
Abstract
Objectives
To develop and externally validate a machine learning (ML) model of VTE in hospitalized Chinese patients.
Methods
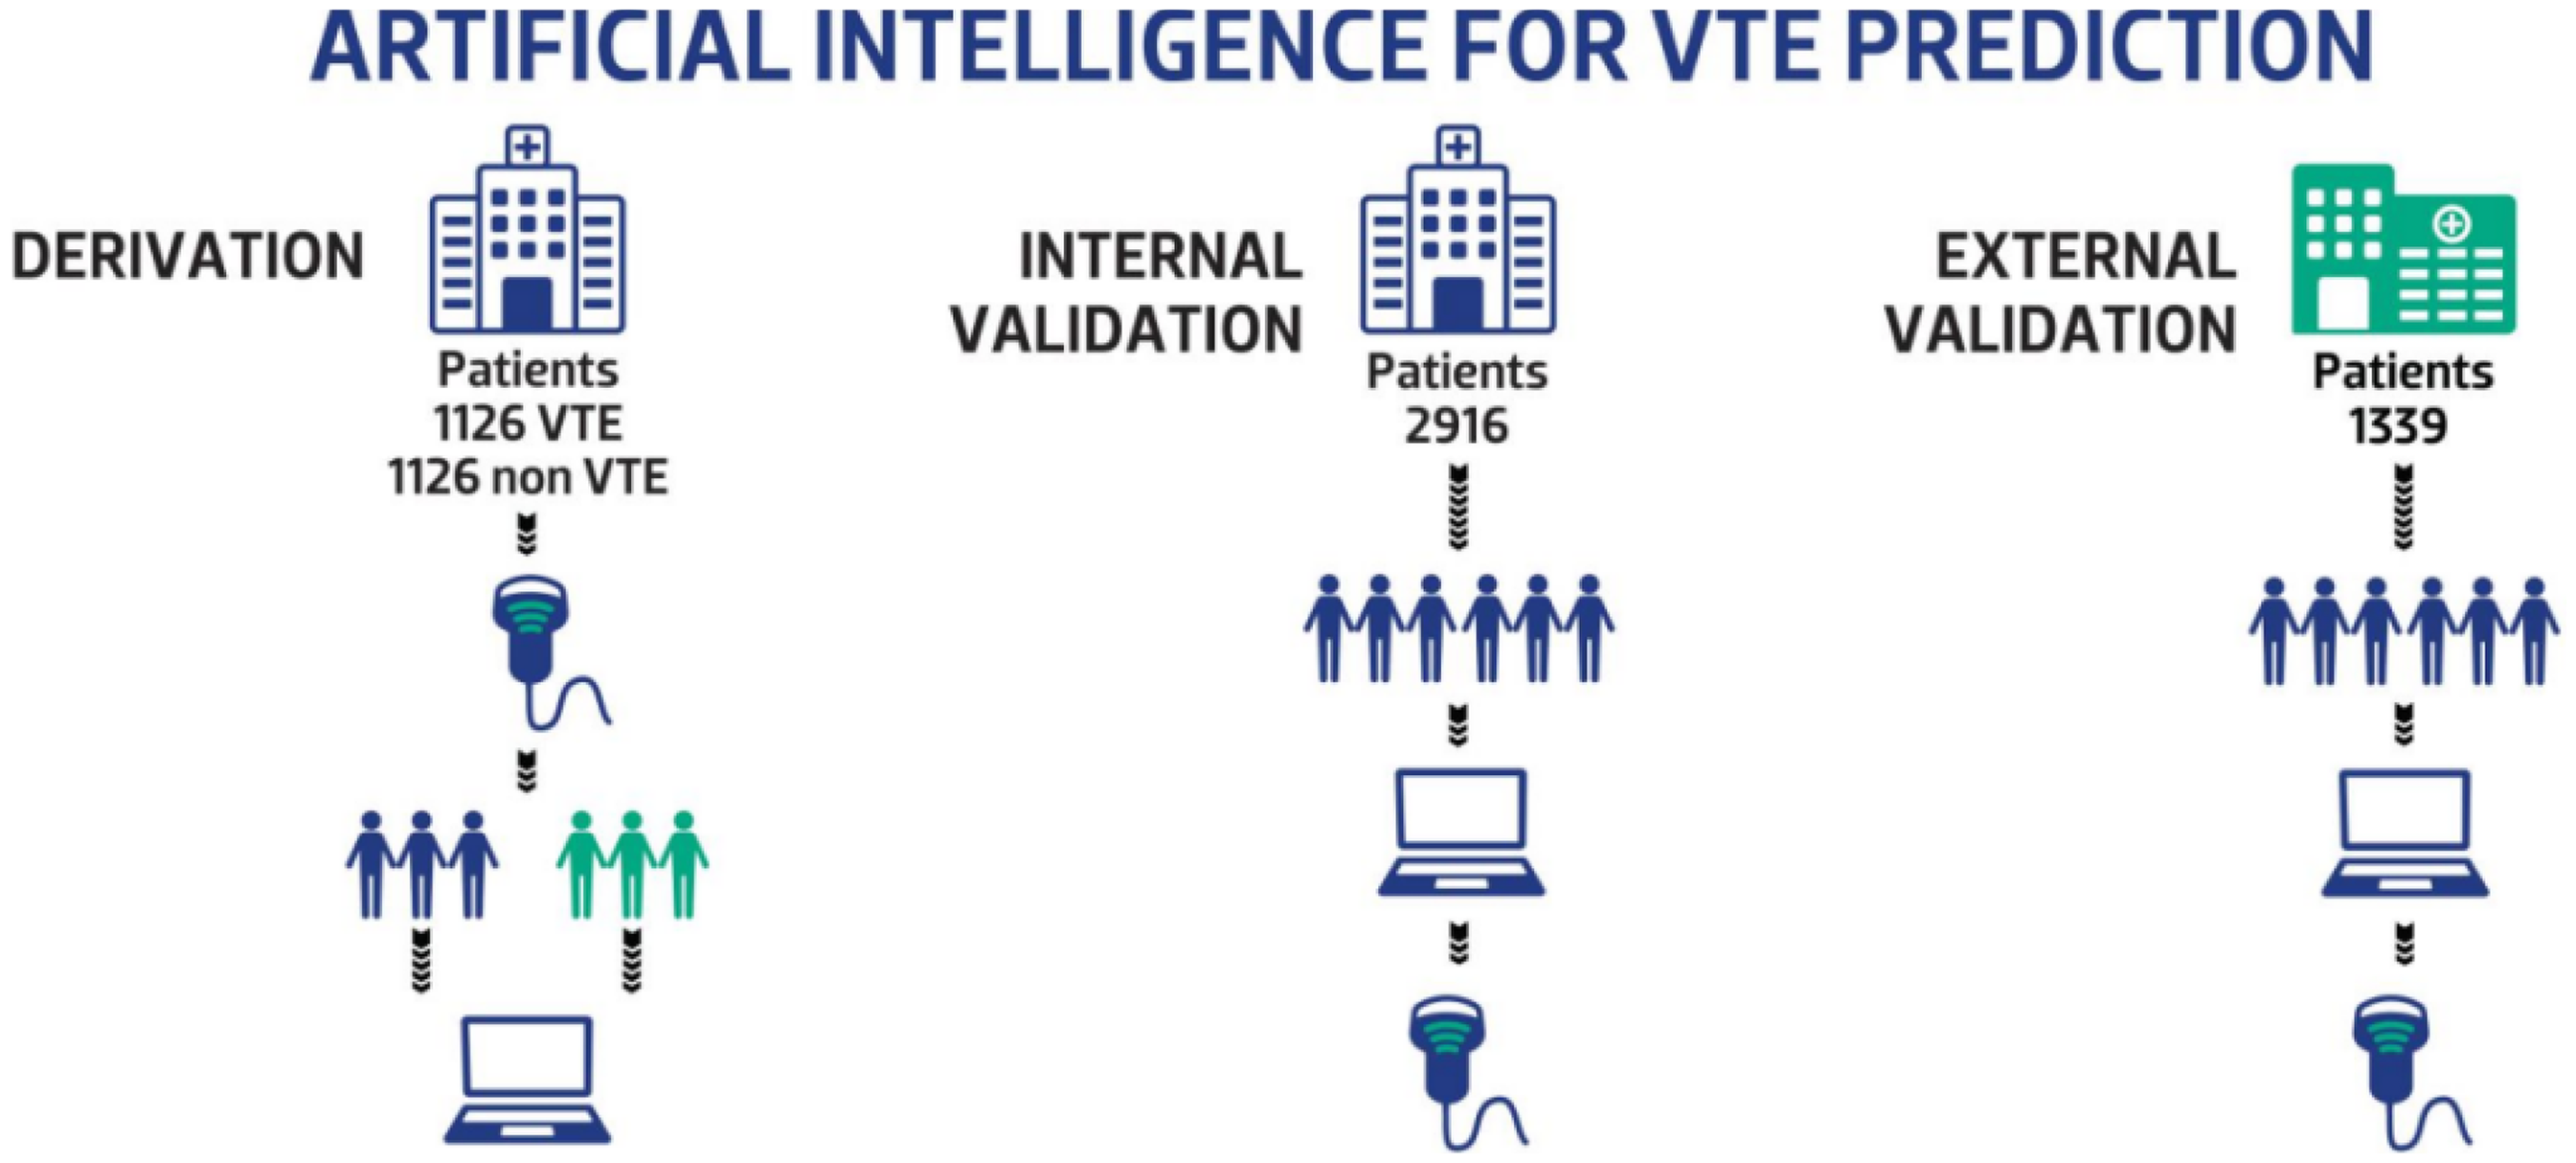
We retrospectively reviewed structured data from patients with and without VTE (N = 1126 in each group) at Beijing Shijitan Hospital between January 2012 and December 2021. ML algorithms, including logistic regression (LR), decision tree (DT), or gradient boosting (GBoost) were used to establish prediction models. Patients were prospectively enrolled at Beijing Shijitan Hospital (N = 2916) or Beijing Chaoyang Hospital (N = 1339) for internal and external model validation, respectively.
Results
Several clinical features were had high weighted correlation with VTE in ML models: age, D-dimer level, platelet count, hemoglobin level, coronary heart disease, cancer, male sex, and comorbidity. The two highest weighted features were age and D-dimer. Optimal cut-off values indicated that age >65 years, white blood cell count >8.69 (109/L), hemoglobin level >126 (g/L), platelet count >197 (109/L), neutrophil percentage >72%, and D-dimer level >965 (ng/ml, D-dimer units) were significantly correlated with VTE occurrence. The AUC value of the GBoost model (0.88 ± 0.03) was significantly higher than the DT (0.70 ± 0.03) or LR (0.64 ± 0.03) models. GBoost also had a higher sensitivity, specificity, Youden index and Matthews correlation coefficient (MCC) than DT or LR (P < 0.05). In the internal validation cohort, the AUC value of the GBoost model (0.85 ± 0.03) was higher than the DT (0.76 ± 0.03) and LR (0.67 ± 0.03) models and the Caprini Risk Assessment Model (RAM) (0.75 ± 0.03). GBoost also had a greater sensitivity, specificity, Youden index and MCC than DT and LR (P < 0.05). In the external validation cohort, the AUC value of the GBoost model (0.81 ± 0.03) was also better than the DT (0.72 ± 0.03) and LR (0.71 ± 0.03) models and the Caprini RAM (0.73 ± 0.03). The GBoost model also had a higher sensitivity, specificity, Youden index and MCC than DT and LR (P < 0.05).
Conclusion
The GBoost ML model was better at identifying hospitalized Chinese patients at risk of VTE than other ML algorithms and the Caprini RAM.
Keywords
Introduction
Venous thromboembolism (VTE), encompassing deep vein thrombosis (DVT) and pulmonary embolism (PE), is a significant cause of morbidity and mortality worldwide and is increasingly recognized as a major health burden in China. 1 Despite this growing awareness, most existing VTE risk prediction models were developed using non-Chinese populations, limiting their generalizability and accuracy in Chinese patients due to potential differences in clinical risk factors and healthcare practices. For Caucasian families, F5 mutations are reported most frequently, at 37.8% (85/225), while PROS1 mutations are most frequently reported, at 40.4% (21/52), for East Asian families. Factor V Leiden is reported more frequently in Caucasians than in East Asians. 2 In the USA, the average length of stay for VTE is 6–7.7 days, 3 but in China, the average length of stay for VTE is almost 15 days 4 The incidence of VTE also differs between the USA (1.17/1000 person year) and China (1.45/1000 person year). 5 Consequently, there is an urgent need to develop tailored, accurate VTE risk prediction models for Chinese patients to optimize prevention strategies and improve outcomes. In our previous approach to this problem, we used the Caprini risk assessment model (RAM) which is used widely in China and has demonstrated a higher sensitivity and predictive ability than the Padua RAM among hospitalized Chinese patients. 6
Machine learning (ML) offers a promising approach for developing personalized prediction models by leveraging large-scale clinical data and identifying complex patterns that traditional statistical models may overlook. Compared to conventional clinical scores, ML can analyze multidimensional data to capture nonlinear relationships. Thereby improving predictive accuracy and providing more individualized risk assessments. Automated integration of electronic medical records (EMR), and other data eliminates subjectivity and omissions inherent in manual scoring. It rapidly processes large-scale data, enabling real-time evaluation of thousands of patient cases and reducing assessment time. However, few studies have externally validated these models or systematically compared their performance to established clinical scores.
In this study, we developed and validated ML-based VTE risk prediction models specifically for hospitalized Chinese patients. We compared the performance of three ML algorithms—logistic regression (LR), decision tree (DT), and gradient boosting (GBoost)—to conventional clinical scoring methods in internal and external validation cohorts. This work represents a step toward creating precision-based VTE prevention strategies tailored to hospitalized Chinese surgical and medical patients.
Methods
Ethical Approval
This study was approved by the Medical Ethics Committee of Beijing Shijitan Hospital Affiliated with Capital Medical University (No. 2020-2).
Study Population
We collected data from the structured electronic medical record (EMR) system. A retrospective case-control dataset with a 1:1 allocation ratio of VTE and non-VTE patients (N = 1126 in each group) at Beijing Shijitan Hospital was collected from January 2012 to December 2021 and used for model training. A prospective cohort of 2916 patients were consecutively enrolled for internal validation between January 2023 and December 2023. A separate prospective cohort of 1339 patients who were admitted to Beijing Chaoyang Hospital from October 2021 to March 2022 were consecutively enrolled for external validation. The enrolled patients were from the following departments: gastrointestinal surgery, orthopedics, thoracic surgery, urologic surgery, obstetrics and gynecology, cerebral surgery, neurology, intensive care unit, geriatrics, respiratory and critical care medicine, cardiovascular, nephrologic, hematologic, gastroenterology, traditional Chinese medicine, rheumatologic and immunologic, endocrine, oncologic, and emergency. (Figure 1).
Data Collection for Development and Validation of ML VTE Prediction Models.
Inclusion criteria and case definition: The training dataset included patients who were ≥18 years old with ≥2 days of hospitalization. At admission, all patients were screened for DVT with a baseline compression ultrasound; PE diagnostic imaging was done only for symptomatic patients. Patients who did not exhibit symptoms of PE and had a normal D-dimer level and imaging confirmation of no DVT, were clinically defined as having no acute PE. VTE cases were defined by a DVT and/or PE diagnosis before discharge. All patients had predischarge imaging, including diagnostic color Doppler compression ultrasound for DVT and CT pulmonary angiography (CTPA) or pulmonary ventilation perfusion (V/Q) scanning for symptomatic PE.
Cases were identified by trained medical students, and case adjudication was performed by senior consultant physicians. We excluded patients with superficial venous thrombosis, those on anticoagulant or thrombolytic drug use at admission or after admission (including recombinant tissue plasminogen activator or urokinase), and those with incomplete structured clinical data. Control patients had confirmed negative VTE imaging. Internal validation data from Beijing Shijitan Hospital patients and external validation data from Beijing Chaoyang Hospital patients were collected using the same case definitions as for the training dataset.
Sample Size:Based on the incidence rate of VTE in Beijing Shijitan hospital (5.7%), the necessary sample size, calculated by logistic regression (PASS software), was at least 244 cases.
Definition and Collection of Clinical Variables: After reviewing the literature, the content of the Caprini RAM, and the structured data extracted from the EMR system, we captured the following variables from patients at admission: age, sex, D-dimer level, white blood cell count, platelet count, hemoglobin count, percentage of neutrophils; whether patients were diagnosed with hypertension, coronary heart disease, tumor (history of, or active), diabetes; or had surgery (within the last month), a blood transfusion, were smokers, or had comorbidities.
Model Development
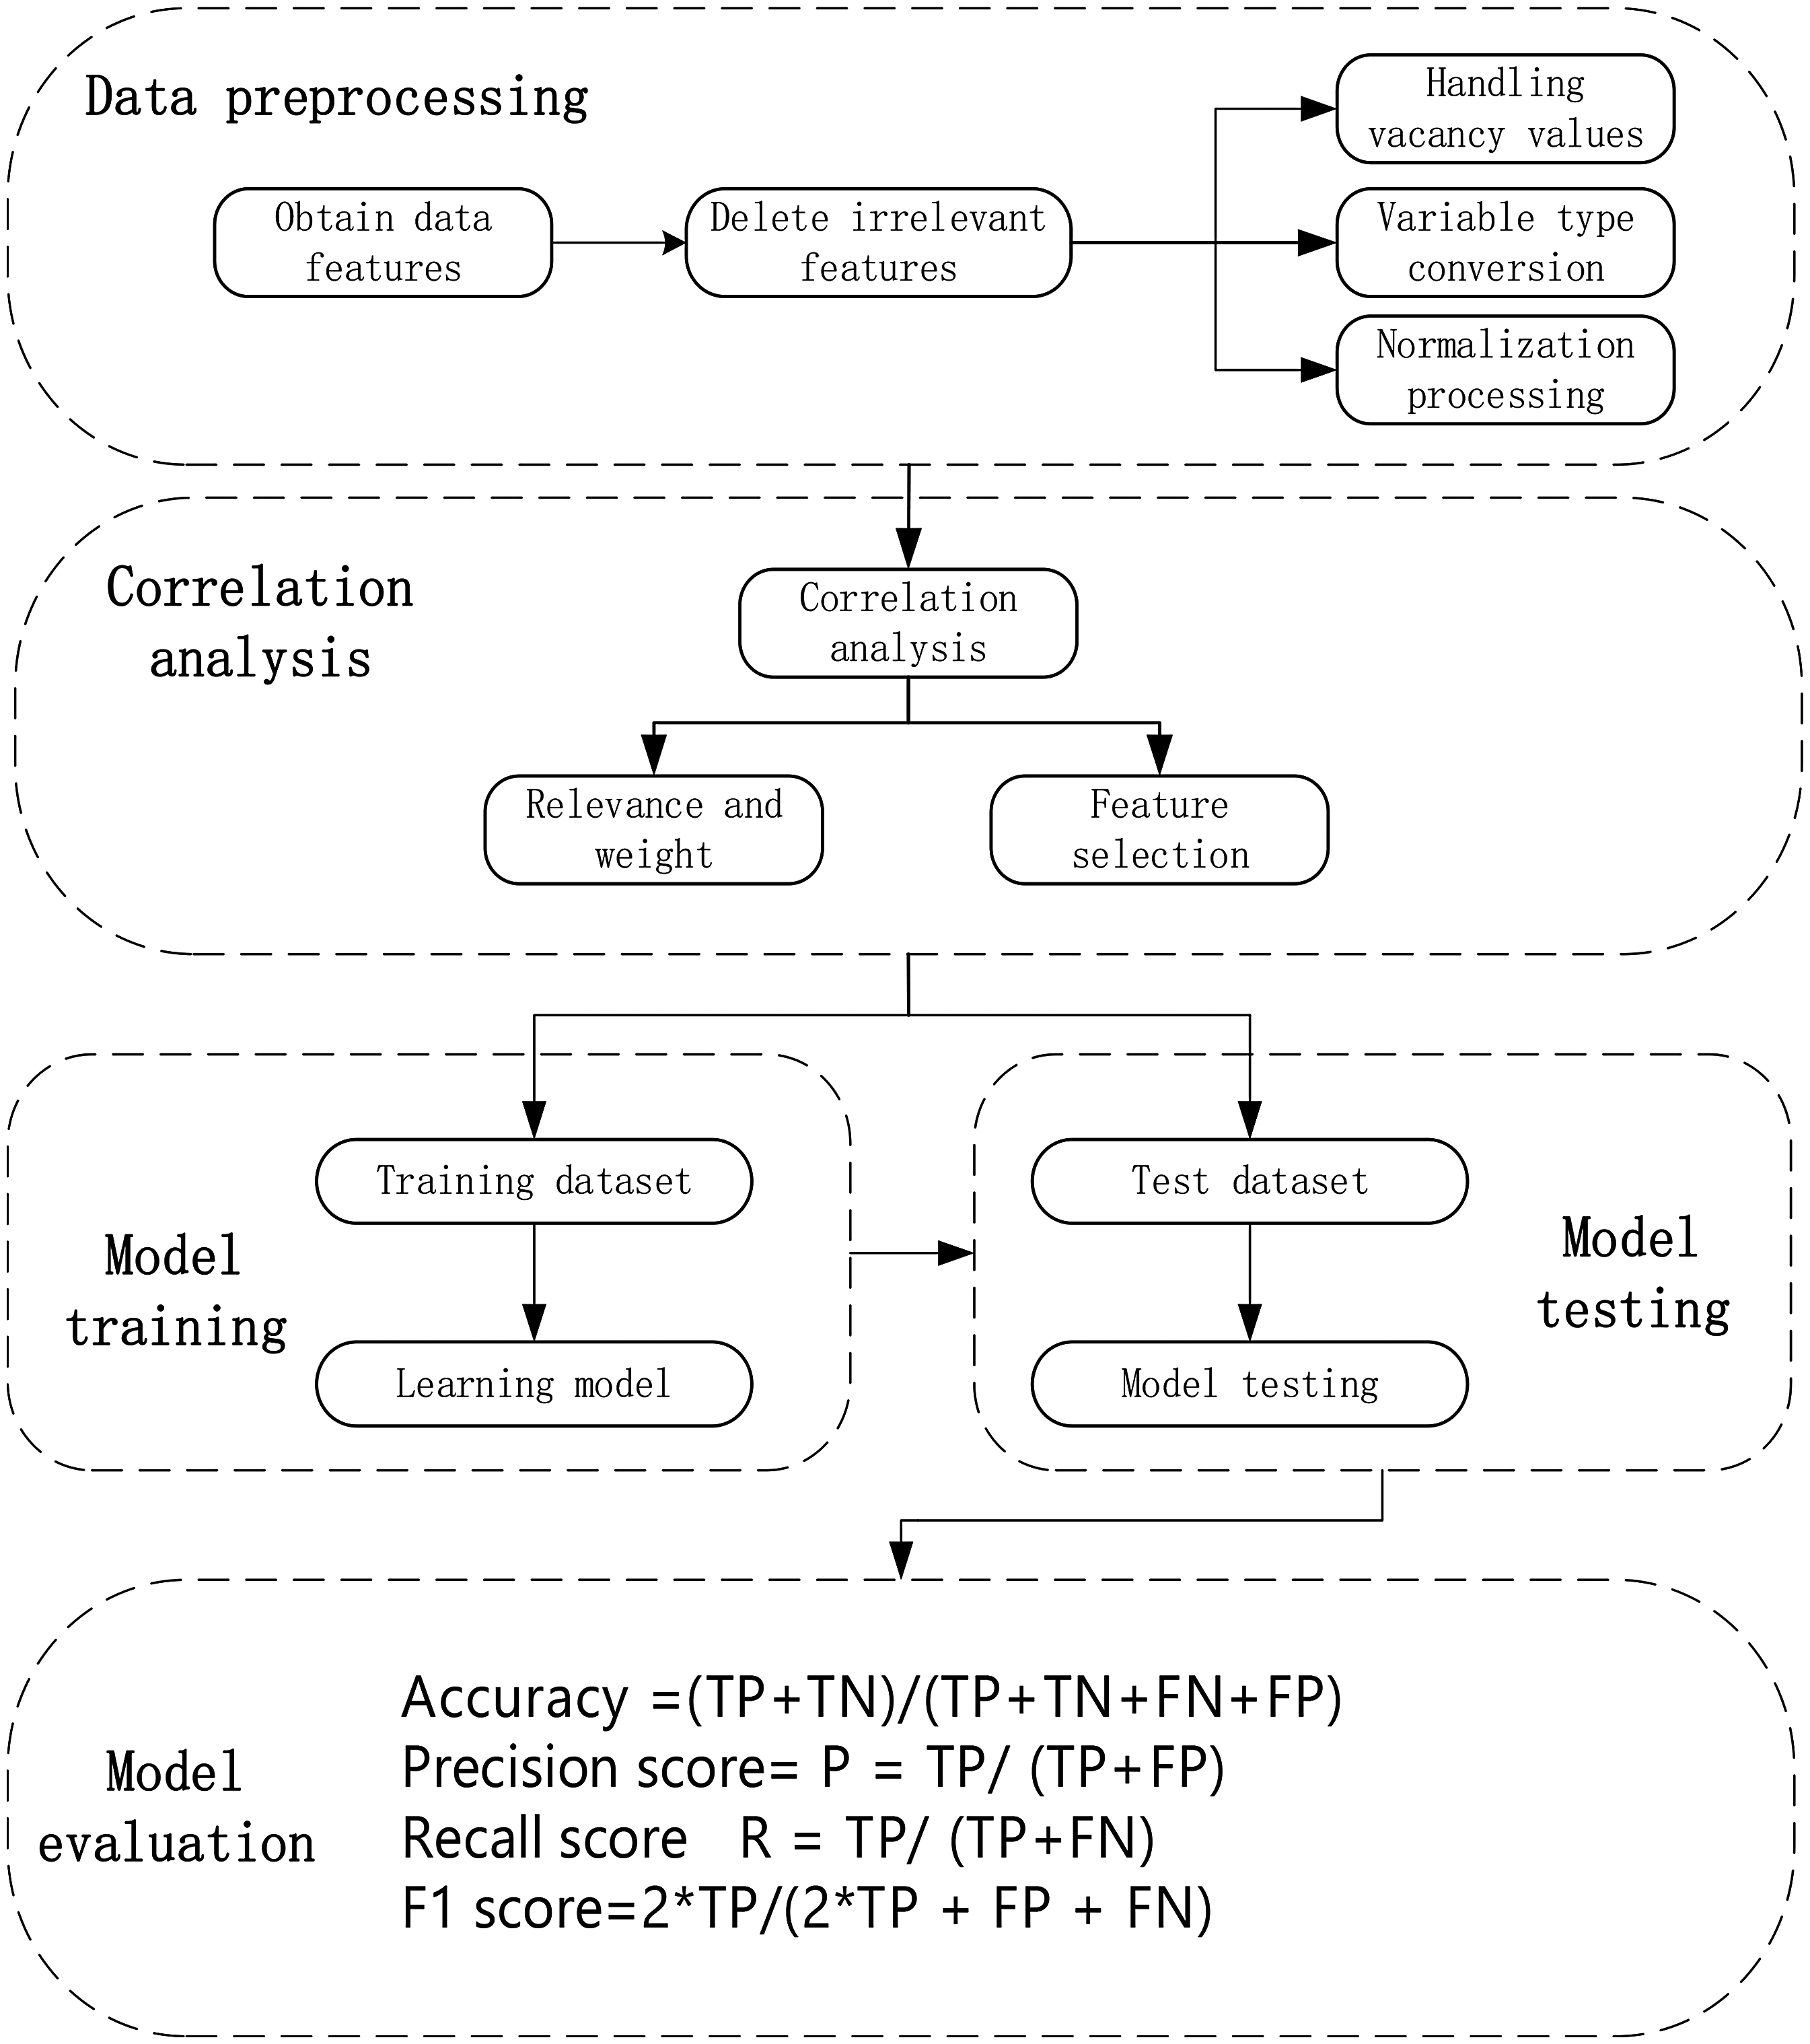
The VTE RAM was developed using ML methods, which included five steps: data preprocessing, correlation analysis, model training, model testing, and model evaluation. The process is shown in Figure 2 (Appendix 1).
The Process of Developing Machine Learning Models.
Data Preprocessing
Many clinical characteristics were captured in the raw data obtained from the structured EM.The most commonly used methods to deal with missing data include the direct-deletion method, the mean-filling method, and the mode-filling method. In order to improve the accuracy of model prediction, the mean- filling method was selected. Therefore, preprocessing of the original data was performed before correlation analysis.
Correlation Analysis
In ML, correlation can be used to identify features that have a significant impact on the target variable. In this study, the weighted Pearson correlation coefficient was used to measure the correlation of features with VTE risk. For each clinical characteristic, a decision tree classifier was used to calculate the weight for each characteristic. During the construction of the decision tree, each internal node will select a characteristic that can minimize the impurity to divide the samples. The total contribution of each characteristic to reduce impurities at all internal nodes was calculated, and after normalization, the result was the weight of each clinical characteristic.
Establishment of Machine Learning Models
In this study, we selected LR, DT and GBoost algorithms according to comprehensive consideration of both the characteristics of medical data and the features of different algorithms.
①
The core of logistic regression is the sigmoid function, whose mathematical expression is: ②

A classification decision tree learns and classifies data based on a tree structure and constructs a model through recursive division of data features, so as to classify and make predictions for new data.
③
The core principle of the GBoost model is to improve overall predictive performance by iteratively training multiple weak learners and combining the accumulated predicted results of these weak learners into a strong learner. The gradient rise algorithm increases the value of the objective function by iteratively updating the parameters along the gradient direction of the objective function. For the general objective function
Evaluation and Validation of Machine Learning Models
The receiver operating characteristic (ROC) curve, AUC value (area under ROC curve), Youden index, Matthews correlation coefficient (MCC), Kappa coefficient, and Jordan index were used to evaluate the classification performance of each prediction model. The ROC curve, drawn with false positive rate (FPR) as the horizontal coordinate and true positive rate (TPR) as the vertical coordinate, shows the performance of the model under different thresholds. The AUC value is the area under the ROC curve and ranges from 0.5 to 1, numbers closer to 1 indicate better performance. The MCC takes into account the number of true positives (TP), true negatives (TN), false positives (FP), and false negatives (FN) in the classification model, providing a single value that summarizes the quality of the classification and reflects the ability of the classification model to distinguish positive and negative samples. The Kappa coefficient was used to evaluate agreement between the classification model predictions and the actual data, with values ranging from −1 to 1, Outcomes closer to +1 mean better agreement. The optimal cut-off values for risk factors were obtained using the Jordan Index method. ROC curves, sensitivity, specificity, Youden index and MCC were used to evaluate the performance of VTE prediction using ML models in internal and external validation cohorts. Python software 3.12 was used for all statistical analyses.
Results
Correlation and Weight of Clinical Characteristics with VTE
In this study, 15 clinical features associated with VTE were obtained from a structured EMR, including age, sex, D-dimer levels, white blood cell count, platelet count, hemoglobin count, percentage of neutrophils, diagnosis of hypertension, coronary heart disease, cancer (history of, or active), diabetes, whether they had surgery (with the last month), blood transfusion, other comorbidities, or were smokers. The correlation with VTE and the weight of each clinical characteristic in each model were calculated A correlation coefficient of more than 0.05 indicated a high correlation between the clinical feature and VTE. Clinical features that were highly correlated with VTE with a high weight were: age, male sex, D-dimer level, platelet count, hemoglobin count, presence of coronary heart disease, history of/active cancer, and comorbidity. The two clinical features with the highest weighted correlations were age and D-dimer level. (Table 1).
Correlation and Weight of Clinical Characteristics with VTE.

*indicates characteristic with weighted correlation coefficient >0.05.
Cut-off Value of Clinical Characteristics with VTE
The optimal cut-off value was obtained using the Jordan Index method, ROC curve method, and density estimation method for the data. The results showed that age >65 years, white blood cell count >8.69 (109/L), hemoglobin count >126 (g/L), platelet count >197 (109/L), neutrophil percentage >72%, and D-dimer level >965 (ng/ml, DDU) were significantly correlated with VTE occurrence, with D-dimer level >965 (ng/ml, DDU) having the highest predictive ability. We further stratified the patients into three age groups (≤65 years, 65–80 years, and ≥ 80 years) and found that the optimal D-dimer thresholds for VTE prediction varied across these groups. In patients aged ≤65 years, a significant increase in VTE incidence was observed when D-dimer >550(ng/ml, DDU). For those aged 65–80 years, the threshold was >750(ng/ml, DDU) for a marked rise in VTE occurrence. In the ≥ 80 years group, VTE risk increased significantly when D-dimer >965(ng/ml, DDU). (Table 2).
Cut-off Value and Correctness Rate of Clinical Characteristics with VTE.

*Correctness rate means the correct classification rate.
Machine Learning Model Development
Comparing the ML models developed using retrospective data indicated that the AUC value of the GBoost model (0.88 ± 0.03) was higher than the DT (0.70 ± 0.03) and LR (0.64 ± 0.03) models. The GBoost model also had a higher sensitivity (0.79 ± 0.04), specificity (0.80 ± 0.04), Youden index (0.59 ± 0.04)and MCC (0.59 ± 0.05) than the DT (0.63 ± 0.04, 0.67 ± 0.04, 0.30 ± 0.04, 0.29 ± 0.05) or LR (0.60 ± 0.04, 0.59 ± 0.04, 0.19 ± 0.04, 0.20 ± 0.05) (P < 0.05) methods, meaning that the GBoost model had much better predictive value than DT or LR models (Figure 3).

ROC Curve of Different Machine Learning Models in Development Cohort.
Internal Validation of Machine Learning Models
In internal validation, the AUC value of the GBoost model (0.86 ± 0.03) was also higher than the DT (0.76 ± 0.03) and LR (0.67 ± 0.03) models, as well as the Caprini RAM (0.76 ± 0.03). The GBoost model had a higher sensitivity (0.80 ± 0.04), specificity (0.76 ± 0.04), Youden index (0.56 ± 0.04)and MCC (0.56 ± 0.05) than DT (0.69 ± 0.04, 0.68 ± 0.04, 0.37 ± 0.04, 0.38 ± 0.05) or LR (0.63 ± 0.04, 0.60 ± 0.04, 0.23 ± 0.04, 0.22 ± 0.05) (P < 0.05) (Figure 4).

ROC Curves of Different Machine Learning Models in Internal Validation Cohort.
External Validation of Machine Learning Models
In external validation, the AUC value of the GBoost model (0.81 ± 0.03) was higher than the DT (0.72 ± 0.03) and LR (0.71 ± 0.03) models, as well as the Caprini RAM (0.73 ± 0.03). The GBoost model had a higher sensitivity (0.73 ± 0.04), specificity (0.74 ± 0.04), Youden index (0.47 ± 0.04) and MCC (0.46 ± 0.05) than DT (0.59 ± 0.04, 0.64 ± 0.04, 0.23 ± 0.04, 0.33 ± 0.05) or LR (0.61 ± 0.04, 0.59 ± 0.04, 0.20 ± 0.04, 0.30 ± 0.05) (P < 0.05) (Figure 5).

ROC Curves of Different Machine Learning Models in the External Validation Cohort.
Discussion
Artificial intelligence (AI) technology is a cost-effective method to promote precision health and prevent adverse patient outcomes. ML is a subset of AI that learns from available data, using recognized patterns and phenotypic groups, and makes decisions or predictions based on these data.
Our study documented that age and D-dimer levels had high weighted correlation with VTE risk. These two characteristics were also the best predictors for VTE in a clinical prediction model for VTE based on Support vector machine (SVM), developed and validated by Xu et al (2023) 7 and in a model of cancer-related VTE. 8 Age is usually included in the commonly used VTE RAMs in clinical practice, as it is the easiest characteristic to obtain. Vuilleumier et al reported that the 30-day mortality rate for acute PE patients under the age of 65 is 4%, while for older patients it is 11%. 9 In the IMPROVE study, a significant correlation was found between being older than 60 and the occurrence of VTE (P < 0.001). The risk of VTE occurring within 3 months in hospitalized patients over 60 years old was twice that of younger patients.10,11 This is consistent with our finding that age is a strong risk factor for VTE, especially in hospitalized patients >65 years old, and that age >65 years was the best cutoff value for high VTE risk.
D-dimer is closely related to the occurrence of VTE and is a commonly used biological marker for evaluating the coagulation status of patients in clinical practice. D-dimer is a degradation product of fibrin, and an increase in D-dimer levels indicates the presence of hypercoagulability and secondary fibrinolysis in the body. A multicenter, randomized, double-blind, parallel-controlled study conducted by Spyropoulos et al showed that a measurement of >2 times normal D-dimer levels can be used as a biological marker for predicting in- and out-of-hospital VTE occurrence, and that patients with D-dimer levels >3 times higher than normal levels are at high risk of VTE and can benefit from extended anticoagulation. 12 In the IMPROVE combined with D-dimer (IMPROVEDD) study, it was found that assigning a score of 2 to a D-dimer level that was greater than twice the normal upper limit significantly improved the ability to predict 77-day symptomatic VTE risk in hospitalized patients with acute disease (HR: 2.22, [95% CI: 1.38–1.58], P = 0.001). Therefore, IMPROVEDD can effectively screen hospitalized patients for VTE risk and need for thromboprophylaxis treatment. 13 Our study showed that D-dimer levels >965 ng/ml (DDU) had the highest predictive ability, in agreement with these studies. Our study demonstrated that the optimal D-dimer threshold increases with advancing age, which aligns with the current Chinese guidelines recommending age-adjusted cut-off values for D-dimer interpretation. 14 Furthermore, our research indicated that some clinical data, including platelet count and hemoglobin levels, were significantly correlated with the occurrence of VTE, although these indicators are not included in the Caprini RAM. Chen et al also identified several other new risk factors for VTE, including low basophil counts and percentages, a high anion gap, and high eosinophil counts and percentages. 15 Including these biomarkers may enhance the predictive accuracy and comprehensiveness of current VTE risk evaluation tools, thereby contributing to more effective prevention and management strategies for at-risk individuals.
The difference between ML modeling and traditional modeling methods lies in their approach to data analysis. Traditional methods analyze linear data, such as linear regression and logistic regression, but ML methods can handle a broader range of data types. As such, ML methods may have obvious advantages in predicting VTE risk. 16 Many studies have compared ML and traditional methods. Across these studies, ML models have shown an AUC ranging from 0.65 to 0.989. Ding et al, found that GBoost outperformed the traditional Geneva score in predicting VTE after hip arthroplasty, with an AUC of 0.982 compared to 0.552, respectively. 17 GBoost also performed the best in predicting VTE after radical gastrectomy, with an AUC of 0.989. 18 A meta-analysis showed that RF and LR achieved the highest AUC (0.90) in assessing the risk of VTE in patients with lung cancer. 19 Comparing Khorana and Caprini RAMs with GBoost, GBoost exhibited an AUC of 0.99 in predicting postoperative VTE in patients with colorectal cancer. 20 Meng et al, found that the Gboost model had a better performance than traditional models in VTE prediction for hospitalized cancer patients. 21 In a retrospective study, Sheng et al, compared LR, RF and GBoost in 3078 individuals. RF was found to have superior performance and great potential in clinical practice. The results showed that RF was effective in correcting the misclassification by Caprini risk score(CRS) in both the positive and negative groups. 22 Comparing conventional scores and ML algorithms for predicting major bleeding after a VTE, Grdinic et al, showed that the ML predictive performance was higher than that of the conventional score and may potentially provide better estimates of bleeding risk than those obtained via classical statistical analysis. 23 Chiasakul et al, reviewed 20 studies using AI for prediction of VTE and found the mean AUC for AI versus conventional methods were 0.79 (95% CI: 0.74-0.85) versus 0.61 (95% CI: 0.54-0.68), respectively, suggesting that an AI-based clinical decision support system could reduce the rate of hospital-acquired VTE by 19%. 24 Hu et al, developed an RF model for colon cancer that had good predictive capability with an AUC of 0.745 for external validation. 25 Guan et al, established three ML models, including RF, XGBoost, and SVM, to predict the risk of VTE in critically ill patients based on ICU data. The results indicated that the RF model achieved the best performance, with an accuracy of 0.99. 26 These studies are consistent with our findings, which indicated that the GBoost algorithm demonstrated the strongest predictive capability for VTE risk among ML models and was also better than a traditional VTE RAM. In contrast, He et al, compared the prediction effects of different ML models with the Padua and Caprini RAMs in trauma patients. The Caprini RAM showed better discrimination ability in predicting VTE events (TPR = 0.667, FPR = 0.227, AUC = 0.773) than ML, because the face-to-face evaluation of patients after admission may provide more accurate data. 27
Lam et al, surveyed clinicians and found that a majority of respondents believed that ML can be helpful in the field of VTE prevention and management. 28 Chrysafi et al, 29 analyzed the application of ML for VTE prevention, diagnosis, and management. They found that the advantages of ML included accelerating clinical documentation,Identifying bleeding events, assisting with clinical decision-making, generating synthetic data, and designing novel anticoagulants. Park et al, developed a RF model derived from EMR data to identify patients at risk for 30-day VTE and readmission after discharge, helping to select patients who may benefit from extended thromboprophylaxis. 30
Most studies that have examined using ML for VTE RAMs are single center retrospective studies, in contrast to our prospective multicenter validation study. Deng et al, collected the data of 256 transplantation patients with VTE and developed a ML model that integrated 8 objective clinical and laboratory predictors. The AUC value of this ML model for VTE risk was 0.88. 31 Liu et al, reviewed data collected between December 2019 and July 2022 for VTE in urological inpatients. They used Random forest (RF) and SVM for assessing the VTE risk; the accuracy of SVM was 92.6%. Danilatou et al, documented several retrospective studies of ML from a single institution, only a few of which performed external validation. Some ML models described excellent performance for VTE prediction internally, compared with traditional RAMs but their performance tended to be lower in external validation cohorts. 32 Our study used both internal and external data to validate our models. In this study population, GBoost was better in the than other models and conventional RAM in both internal and external cohorts.
ML offers the following significant advantages, such as 1) ML through feature importance analysis, may uncover novel VTE-related biomarkers or clinical features. 2) Integration with hospital information systems (HIS) allows automatic triggering of alerts and preventive recommendations, enhancing clinical compliance. 3) Unlike traditional models that rely on fixed variables and weights with long update cycles, machine learning-based models can periodically incorporate new patient data for training, automatically adjusting parameter weights to adapt to evolving clinical scenarios. Their self-updating capability surpasses that of conventional models. The challenges of ML include hidden biases, clinical reluctance, data privacy, litigation and need for prospective testing. 29 An EMR contains multidimensional data of variable quality, thus while building large datasets from multiple institutions is essential, there are numerous challenges, including reconciling different test assays and interpretation of clinical variables.
The limitations of this study are as follows:1) Our study included all hospitalized patients and did not categorize them into internal medicine, surgical medicine or oncology patients. In the next step of our research, we will compare different ML models among patients in these different categories. 2) The ML analysis in this study was based solely on structured clinical variables available in the EMR system, though not all clinically relevant variables are captured in a structured format. Nevertheless, the structured variables included in this study encompassed key VTE-related predictors, and the constructed ML model demonstrated statistically significant predictive performance. As the structured data capture in EMR systems continues to improve, future incorporation of additional clinical variables may further enhance model performance. And we plan to embed ML model into EMR system and automatically capture structured data and assign risk scores upon admission. this would significantly reduce the time needed for physician evaluation, thus reducing workload and improving evaluation efficiency.
Supplemental Material
sj-docx-1-cat-10.1177_10760296251372942 - Supplemental material for Development and External Validation of a Machine Learning Model to Predict Venous Thromboembolism Risk in Hospitalized Chinese Patients
Supplemental material, sj-docx-1-cat-10.1177_10760296251372942 for Development and External Validation of a Machine Learning Model to Predict Venous Thromboembolism Risk in Hospitalized Chinese Patients by Xiaolan Chen, Peiran Wang, Xinyu Hu, Guilian Wang, Zhijia Zhang, Qibo Liu, Yuanhua Yang, Alfonso J Tafur and Lei Pan in Clinical and Applied Thrombosis/Hemostasis
Footnotes
Acknowledgments
The authors thank Dr Jawed Fareed, Dr Grigorios Gerotziafas, and Dr Joseph A. Caprini for their support and encouragement during this study as well as reviewing the manuscript and providing editorial support.
Author Contributions
X.L.C. and L.P. designed the article. G.L.W. was responsible for methodology. X.Y.H., P.R.W. and Y.H.Y. collected data. Z.J.Z, P.R.W. and Q.B.L. analyzed the data. X.L.C wrote the initial draft, A.J.T reviesd the draft.
Funding
This work was supported by the Beijing Municipal Administration of Hospitals Incubating Program and Training Plan for High level Public Health Technical Talents Construction Project (grant numbers PX2022029 and 03-33).
Declaration of Conflicting Interests
The authors declared no potential conflicts of interest with respect to the research, authorship, and/or publication of this article.
Supplemental Material
Supplemental material for this article is available online.
References
Supplementary Material
Please find the following supplemental material available below.
For Open Access articles published under a Creative Commons License, all supplemental material carries the same license as the article it is associated with.
For non-Open Access articles published, all supplemental material carries a non-exclusive license, and permission requests for re-use of supplemental material or any part of supplemental material shall be sent directly to the copyright owner as specified in the copyright notice associated with the article.