
Abstract
Introduction
Postoperative venous thromboembolism (VTE) is a frequently occurring complication among glioma patients. Several risk assessment models (RAMs), including the Caprini RAM, the IMPROVE Risk Score, the IMPROVED VTE Risk Score, and the Padua Prediction Score, have not been validated within the glioma patient population. The purpose of this study was to assess the predictive accuracy of established VTE risk scales in patients with glioma.
Materials and Methods
A single-center, retrospective, observational cohort study was conducted on 265 glioma patients who underwent surgery at the Almazov Medical and Research Centre between 2021 and 2022. VTE detection followed the current clinical guidelines. Threshold values for the Caprini, IMPROVE VTE, IMPROVEDD, and Padua scales were determined using ROC analysis methods, with cumulative weighting for sensitivity and specificity in predicting VTE development. The areas under the ROC curves (AUC) were calculated, and comparisons were made using the DeLong test.
Results
The area under the curve for the Caprini risk assessment model was 80.41, while the IMPROVEDD VTE risk score was 75.38, the Padua prediction score was 76.9, and the IMPROVE risk score was 72.58. No significant differences were observed in the AUC values for any of the scales. The positive predictive values of all four scales were low, with values of 50 (28–72) for Caprini, 48 (28–69) for IMPROVEDD VTE, 50 (30–70) for Padua, and 64 (35–87) for IMPROVE RAM. No significant differences were found in terms of PPV, NPV, positive likelihood ratio, and negative likelihood ratio among the analyzed scales.
Conclusions
The Caprini Risk Assessment Model, the IMPROVE Risk Score, the IMPROVED VTE Risk Score, and the Padua Prediction Score exhibit acceptable specificity and sensitivity for glioma patients. However, their low positive predictive ability, coupled with the complexity of interpretation, limits their utility in neurosurgical practice.
Introduction
Venous thromboembolism (VTE) comprises superficial vein thrombosis, deep vein thrombosis (DVT), venous gangrene, and pulmonary embolism (PE). Cancer-associated thrombosis is a significant concern in the field of cardio-oncology and is strongly associated with increased early all-cause mortality during cancer chemotherapy and surgery. The frequency of VTE varies depending on tumor location and significantly increases in advanced and metastatic stages. The most thrombogenic cancer sites include the pancreas, kidneys, ovaries, lungs, gastrointestinal tract, and brain tumors. These tumors can be categorized into primary tumors and secondary tumors associated with metastasis. Meningioma and glial tumors are the most common primary brain tumors, accounting for 35.6% and 35.5% of cases, respectively. Glioblastoma (GBM) is the most common malignant brain tumor, representing 15.6% of cases, and is associated with an extremely low five-year survival rate of 6.8%. 1 In a series of prospective studies, the cumulative risk of VTE in patients with brain tumors ranged from 10% to 40% during a 2-year follow-up period, which is notably higher than in other cancer types. 2 In routine neurosurgical practice, various risk assessment models are used for evaluating thrombosis risk. The most used ones include the Caprini risk assessment model, the IMPROVE Risk Score, the IMPROVEDD VTE Risk Score, and the Padua Prediction Score. 2
The Caprini risk assessment model (RAM) was developed through a retrospective data analysis from 538 surgical patients, excluding oncological patients. 3 The entire group was divided into three strata based on the number of risk factors present in the patients: low-risk (34.5%, n = 186), moderate-risk (48.5%, n = 261), and high-risk (17.2%, n = 91). The significance of each risk factor in relation to thrombosis occurrence was determined by the researchers’ judgment and aligned with current clinical recommendations. 3 In 2005, the same authors introduced the third version of the Caprini RAM, which is currently in use. This version incorporates numerous indicators categorized into five groups, based on the significance of each specific risk factor. 4 The Caprini risk score has been validated across various populations, including surgical patients and therapeutic pathology cases. A meta-analysis conducted by the Hilary Hayssen group summarized data from 57 studies that explored the application of the Caprini Risk Assessment Model (RAM) in real clinical practice. The analysis revealed that different authors used varying numbers of thrombosis risk categories, ranging from 5 to 2 categories, and different threshold values for identifying high VTE risk, ranging from 5 to 10 points. Furthermore, the frequency of venous thrombosis events in patients categorized as high-risk according to this model ranged from 0% to 40%. 5 The redundancy in risk categories for thrombosis development in the Caprini RAM, along with the varying cutoff points used to define risk categories in different patient groups, appears to significantly complicate its routine application in oncology patients.
In 2010, Barbar et al introduced another risk assessment model known as the Padua Prediction Score. This model is based on retrospective data from 1180 patients with various medical conditions, including therapeutic, surgical, and oncological cases. The data was collected during the 90 days following hospitalization. The model incorporates several indicators, such as active cancer, prior history of VTE, reduced mobility, known thrombophilia, advanced age, heart or respiratory failure, acute myocardial infarction, acute infection or rheumatological disease, obesity, and hormone therapy. 6 Subsequently, several authors validated this model in a cohort of rheumatological patients, achieving an estimated area under the curve (AUC) of 0.771 with sensitivity at 48% and specificity at 93.5%. 7
In 2011, the group led by A.C. Spyropoulos conducted a retrospective assessment of VTE risk factors using data from the International Register of Venous Thromboembolism Prevention (IMPROVE), which included 15 156 patients and aimed to evaluate the effectiveness of thromboprophylaxis. They identified seven independent predictors: a history of VTE, known thrombophilia, cancer within the past 5 years, age over 60 years, paralysis or paresis of the lower extremities, immobilization lasting at least 7 days, and hospitalization in the intensive care unit. The cumulative VTE risk significantly increased in patients with more than 2 points (1.5% for 2 points, 57% for 3 points). Furthermore, the risk of death due to venous thromboembolism was significantly higher in patients with 2 or more points. 8 Mahan et al retrospectively evaluated the IMPROVE Risk Score tool using medical data from 41 486 patients across three emergency hospitals. They calculated an AUC of 0.77 with a sensitivity of 63.3% and specificity of 77.7% for the threshold value for VTE detection set at 3 points.
The association of the IMPROVE score and D-dimer ≥ 2 × the upper limit of normal (ULN) with the risk of symptomatic deep vein thrombosis, non-fatal pulmonary embolism, or VTE-related death was evaluated in 7441 hospitalized, patients with diseases randomized in the APEX trial. Based on Cox regression analysis, the IMPROVE-D score was derived by adding two points to the IMPROVE score if D-dimer was ≥ 2 × ULN. The inclusion of D-dimer in the IMPROVE VTE risk assessment model further improved risk stratification in hospitalized patients receiving thromboprophylaxis. An IMPROVEDD score of ≥2 identified hospitalized at increased risk of VTE for up to 77 days. 9
It is important to note that neurosurgical patients were not included in the cohorts used to develop all the mentioned VTE risk assessment models (RAMs). The objective of our study was to assess the predictive accuracy of existing VTE risk scales in glioma patients. Notably, a clinically significant characteristic of brain tumor patients is their high risk of hemorrhagic complications, which significantly restricts the use of antithrombotic agents for both treating and preventing thrombosis. Therefore, the ideal venous thrombosis risk assessment tool should maximize specificity to accurately identify the group at the highest risk of thrombosis, ensuring they receive the most benefit from thromboprophylaxis.
Materials and Methods
A total of 265 consecutive patients, comprising 133 (51.2%) men and 132 (49.8%) women, with histologically verified glioma who underwent surgery at the Almazov Nationa. The study was retrospective. There was less than 5% missing data. No imputation or missing data procedures were used in this trial. l Medical Research Center from January 2021 to May 2023 were enrolled in our study. The average age in the group was 54 [41; 63] years. Prior to surgery, all patients underwent lower extremity vein ultrasound for deep vein thrombosis (DVT) screening. The diagnosis of pulmonary embolism and deep vein thrombosis was conducted following current clinical recommendations. 12
Descriptive statistics for a continuous variable, representing the average period of VTE development, were calculated as a median with the first and third quartiles provided in brackets [median; Q1; Q3]. For the categorical variable GRADE, the frequency (number of patients) in each category was computed.
For binary variables indicating the occurrence of VTE, clinical manifestations of neoplasms, and concomitant cardiovascular pathology, the frequency was determined, and 95% confidence intervals (95% CI) were calculated using the Wilson formula.
The threshold scores for the Caprini, IMPROVE VTE, IMPROVEDD, and Padua scales were determined through ROC analysis methods, ensuring a balance between sensitivity and specificity for VTE development prognosis. The areas under the ROC curves (AUC) were calculated and compared using the DeLong test.
Various prognostic characteristics related to VTE development were calculated and compared. Sensitivity and specificity were assessed using McNemar's test, while positive and negative predictive values (PPV and NPV) were compared using a weighted generalized test (WSG test).
To account for multiple comparisons of the scales, p-values were adjusted using the Benjamini-Hochberg method. Statistical hypotheses were tested at a critical significance level of p = 0.05, considering differences as statistically significant if p < 0.05.
All statistical analyses were conducted using R (version 4.1.3, 2022-03-10), Austria, URL: https://www.R-project.org/) and the RStudio IDE (version 2022.02.1 Build 461, USA, URL: https://posit.co/).
Results
The VTE incidence in the group was 12% (n = 32): DVT was diagnosed in 75% (n = 24) of cases, while pulmonary embolism was observed in 18.8% (n = 6) of cases. The average time for VTE development in the postoperative period was 18 [3; 28] days.
Table 1 provides information on risk factors for the development of VTE.
VTE Development Risk Factors.
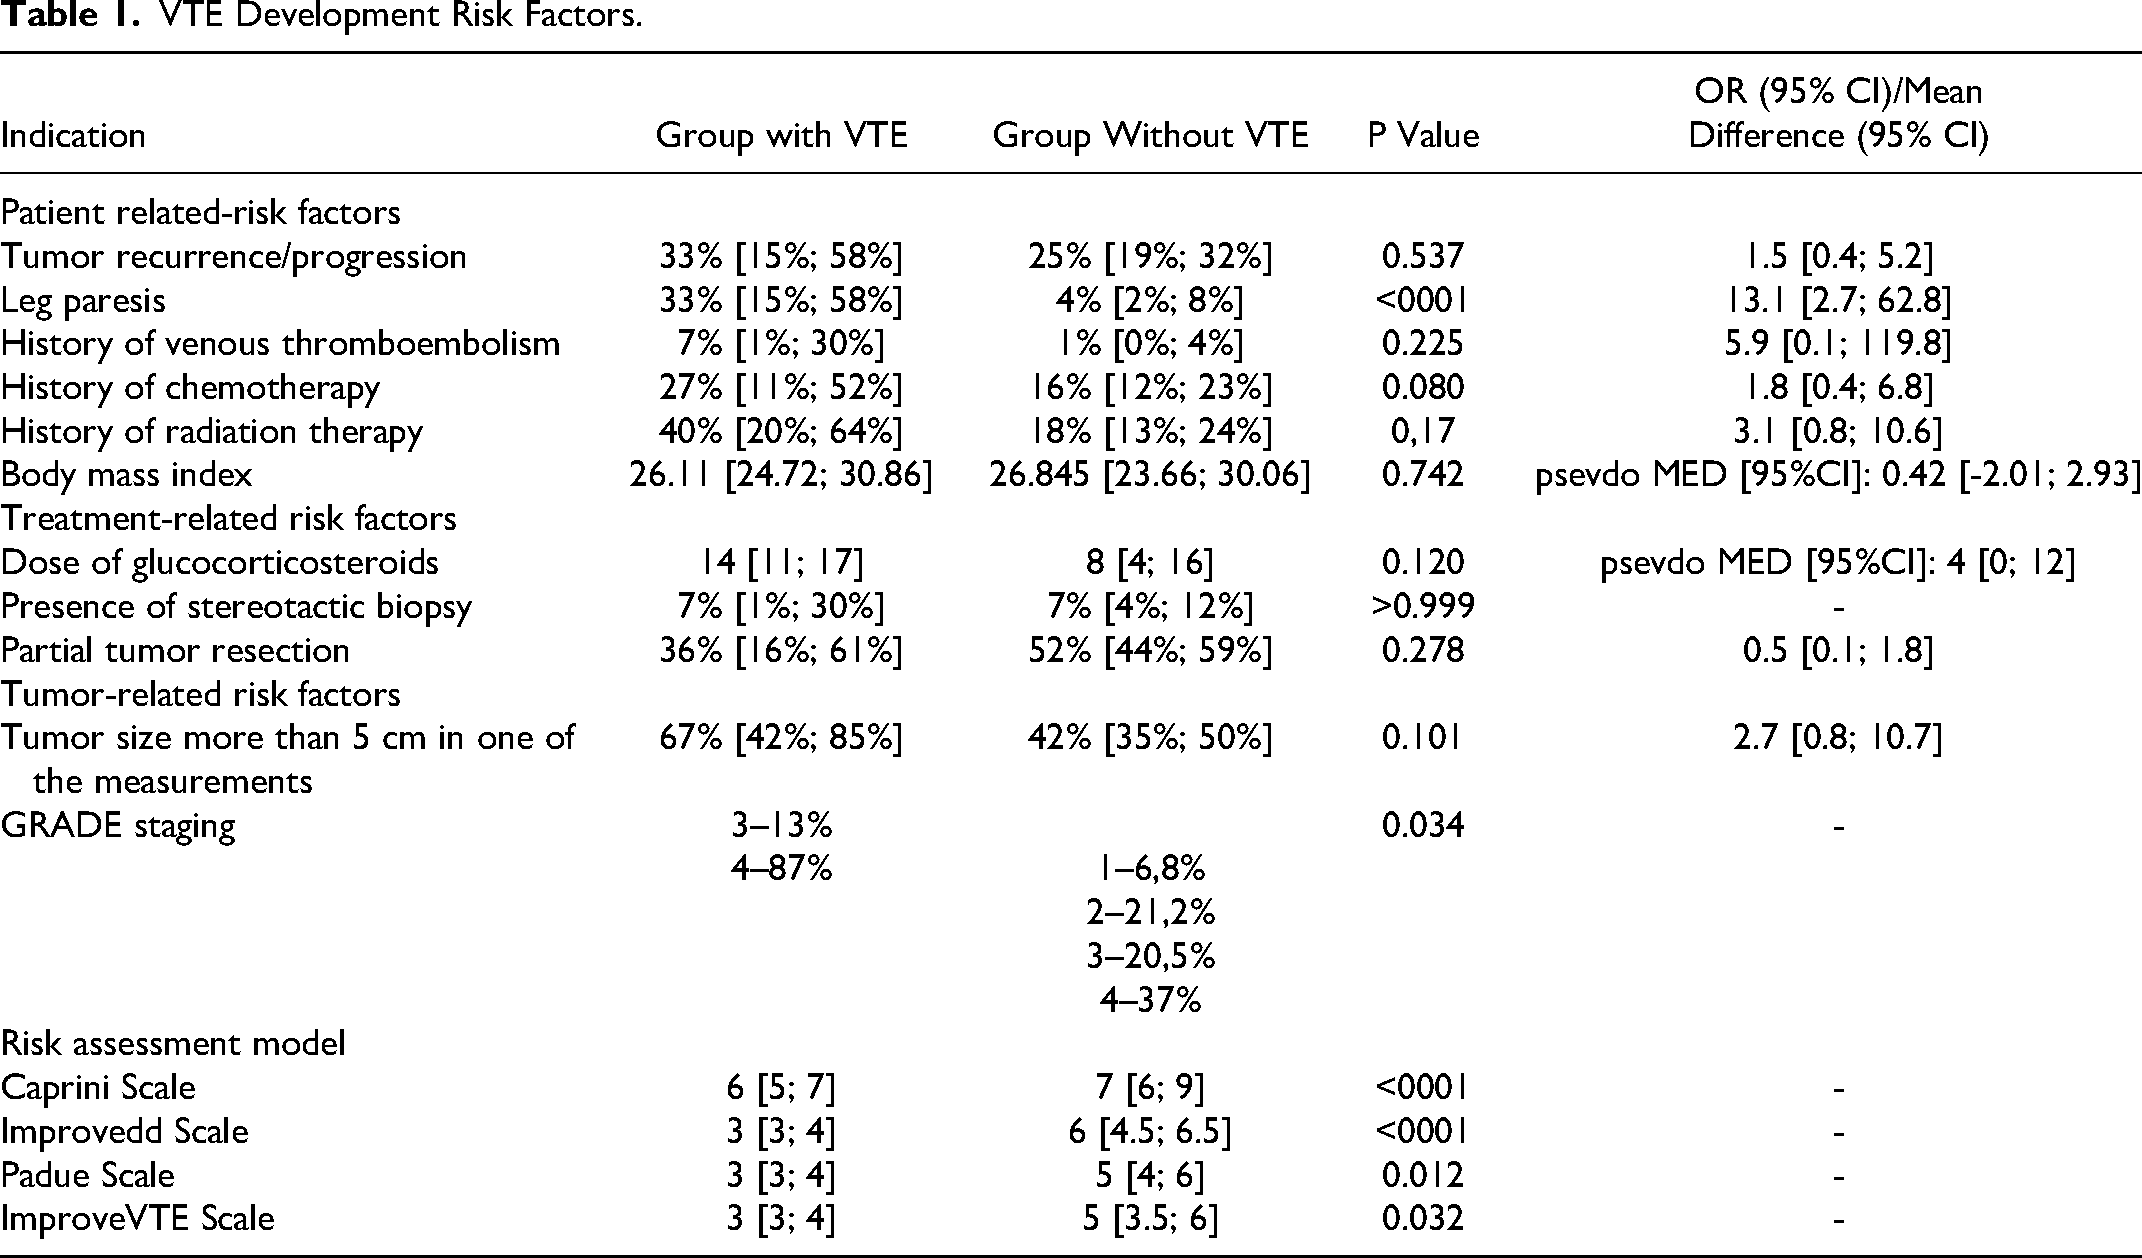
OR – odds ratio, CI – confidence interval
Microsurgical tumor resection was performed in 98.8% of the patients. Low-grade gliomas were diagnosed in 18.8% (n = 49) of patients, while high-grade gliomas (grade 3 and 4) were observed in 82.2% (n = 216) of cases. Focal deficiency was identified in 40.6% of patients (n = 99). The median Karnofsky Performance Scale Index for the group was 70 [70; 80].
Hypertension and dyslipidemia were the most prevalent comorbidities, affecting 54% and 28% of the patients, respectively. The median BMI in our group was 26.6, with a range from 23.6 to 30.1, and only 7.8% (n = 19) of the patients had obesity. Digestive and genitourinary disorders were less common, affecting 32% and 11% of the patients, respectively.
The results of the assessment of the predictive potential of the studied VTE risk scales are displayed in Table 2.
Predictive Potential Scale Characteristic.
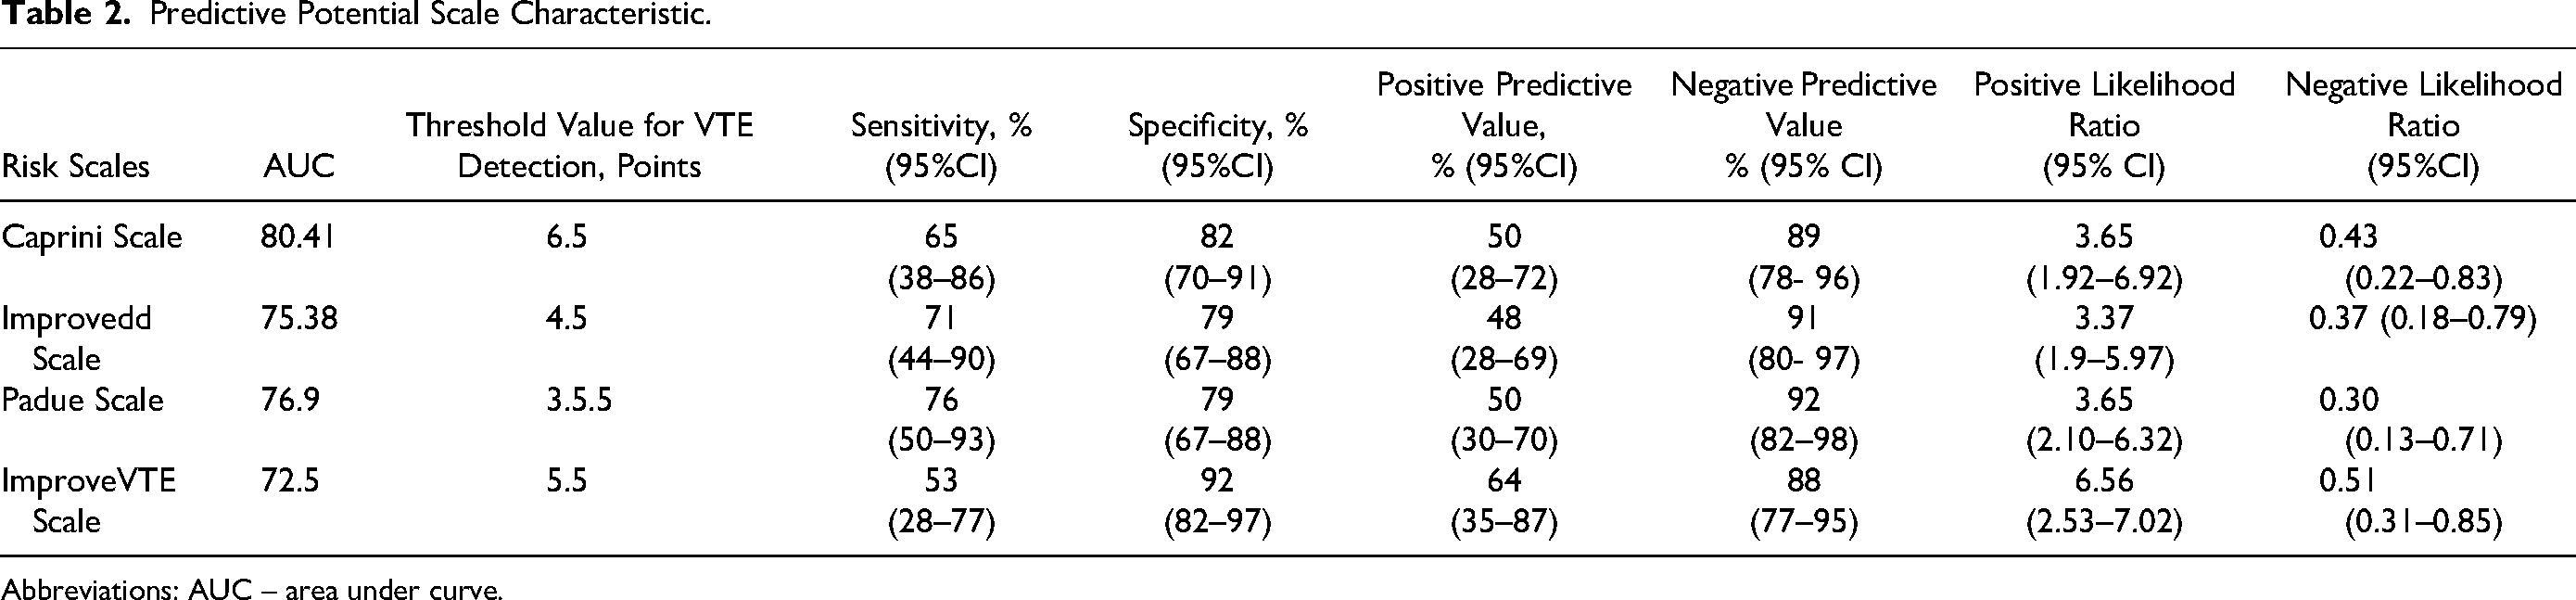
Abbreviations: AUC – area under curve.
Sensitivity is the proportion of true positives tests out of all patients with a condition.
Specificity is the percentage of true negatives out of all subjects who do not have a disease or condition.
PPV – Positive predictive value. PPVs determine, out of all the positive findings, how many are true positives.
NPV – Negative predictive value. NPVs determine, out of all the negative findings, how many are truly negative.
A positive likelihood ratio is the probability that a positive test would be expected in a patient divided by the probability that a positive test would be expected in a patient without a disease.
A negative likelihood ratio is the probability of a patient testing negative who has a disease divided by the probability of a patient testing negative who does not have a disease. 10,11
The assessed RAMs did not exhibit significant differences in terms of the AUC value and sensitivity (Figure 1). Notably, the specificity of the IMPROVE VTE scale was higher compared to both the Padua scale (92%, 95% CI 82%–97% vs 79%, 95% CI 67%–88%, p < 0.001) and the IMPROVEDD scale (92%, 95% CI 82%–97% vs 79%, 95% CI 67%–88%, p = 0.011). However, the sensitivity and positive predictive value (PPV) of the IMPROVE VTE scale remained low. There were no significant differences in PPV, negative predictive value (NPV), positive likelihood ratio, or negative likelihood ratio among the analyzed scales.
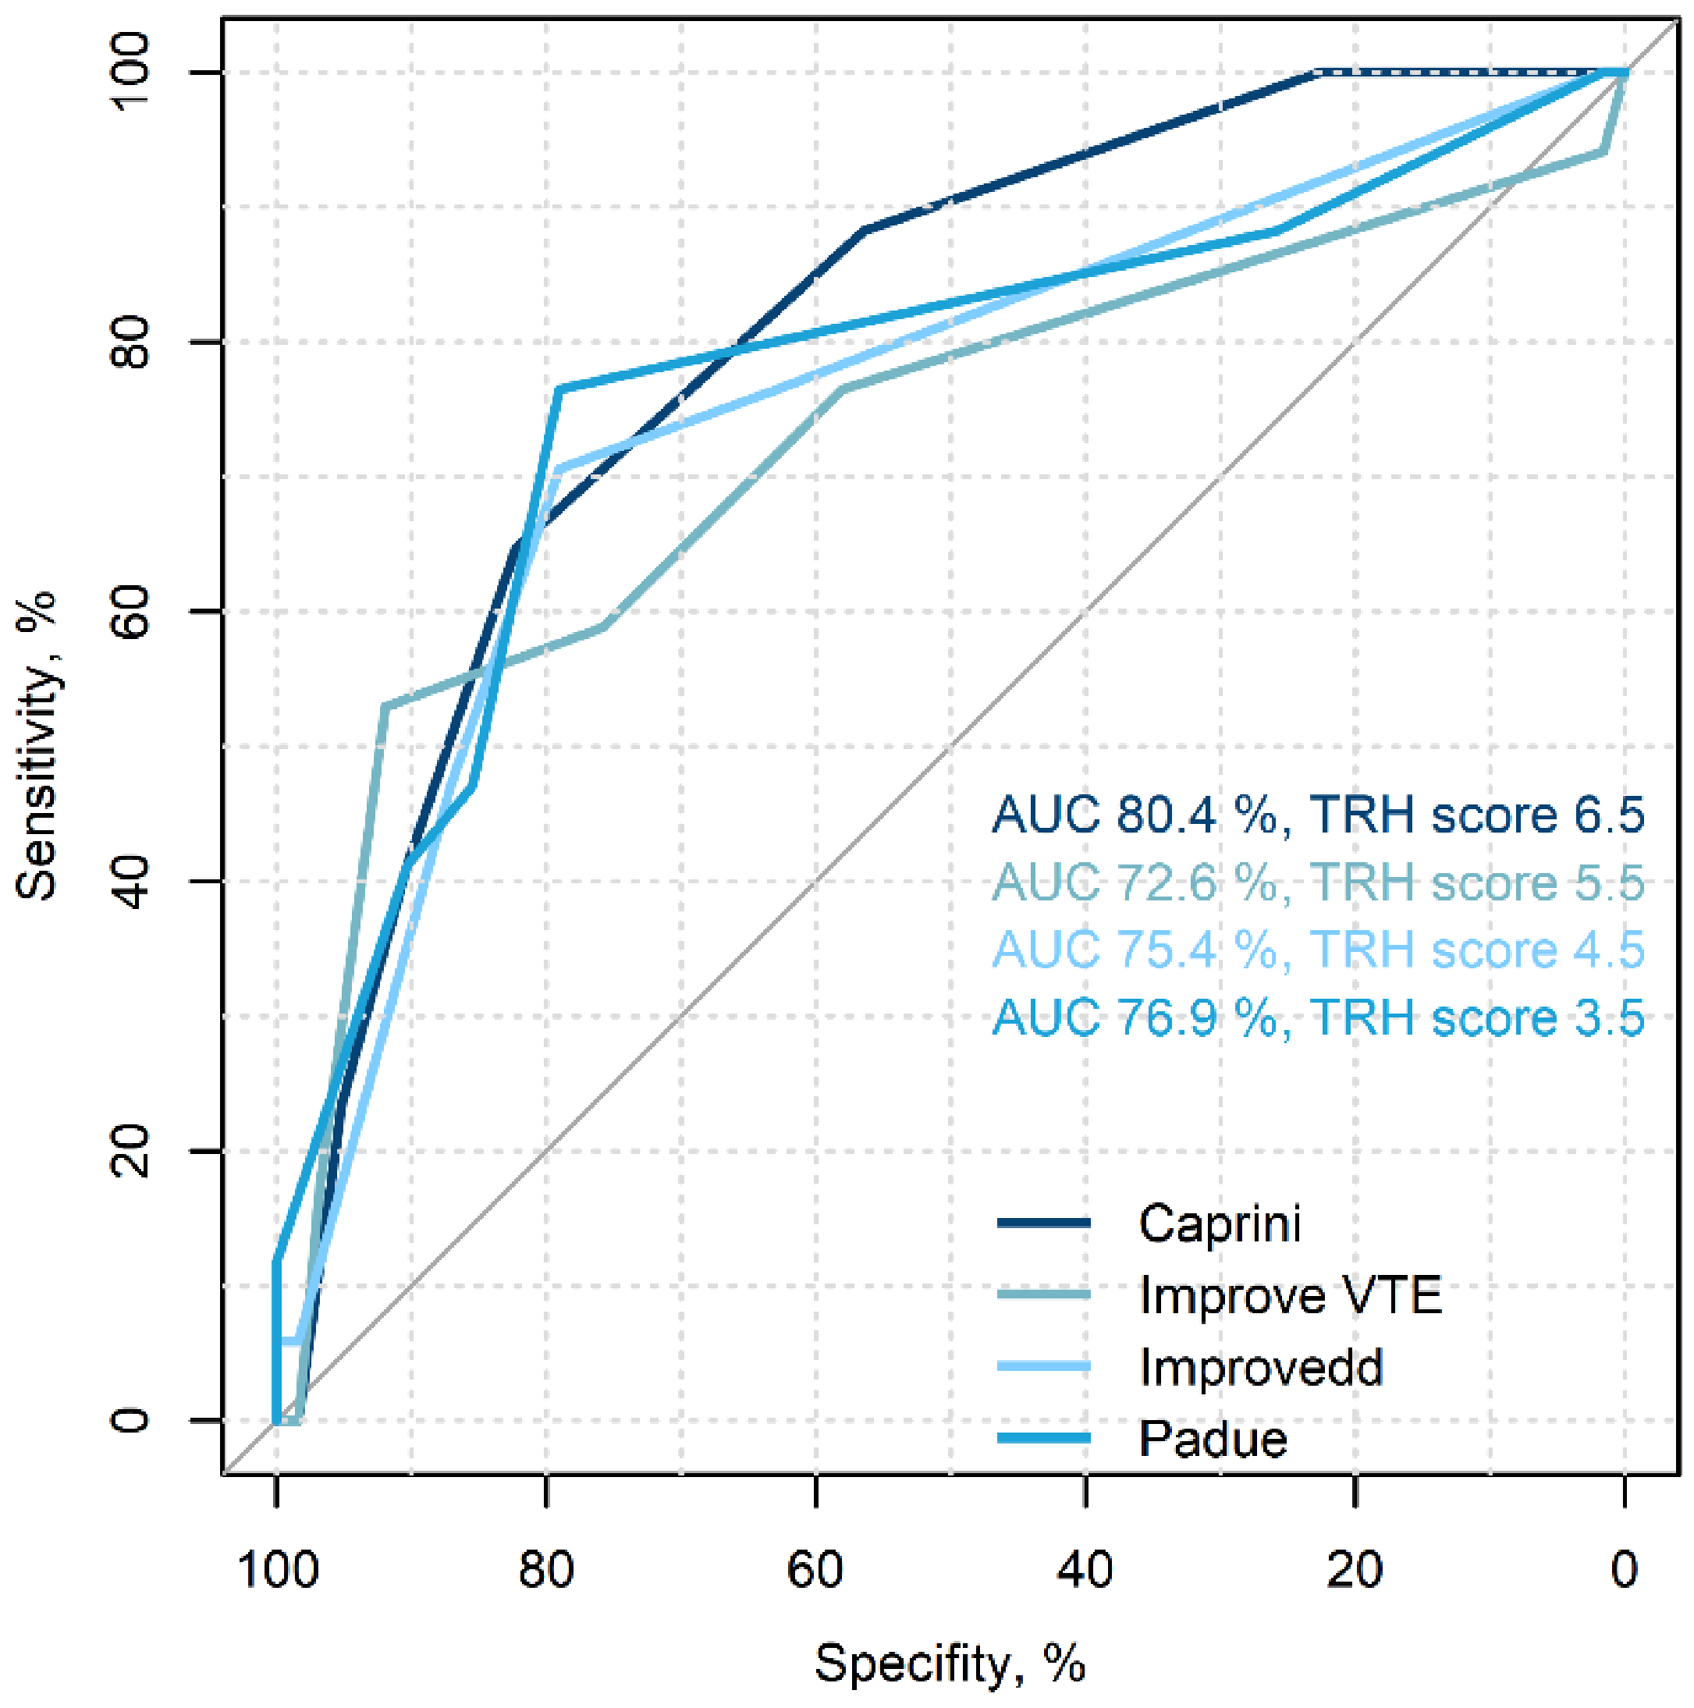
ROC curves of the risk assessment models. Abbreviations: AUC – area under curve, TRH – threshold.
The following thresholds were calculated to identify a high risk of VTE:
For the Caprini scale, the threshold is set at 6.5 points (in the general population, more than 5 points are considered a moderate risk, while more than 9 points indicate a high risk of VTE).
For the IMPROVE VTE scale, the threshold is 5.5 points (in the general population, more than 2 points are indicative of a high risk of VTE).
For the IMPROVEDD scale, the threshold is 4.5 points (more than 2 points are considered a high risk of VTE in the general population).
For the Padua scale, the threshold is 3.5 points (more than 4 points suggest a high risk of VTE in the general population).4–9
Discussion
Current clinical guidelines recommend considering the use of thromboprophylaxis in neurosurgical patients when undergoing tumor removal. 12 While the administration of low-molecular-weight heparin is frequently discussed, the timing is not always clearly indicated. In our study, consistent with the findings of a large single-center retrospective study by T.R. Smith et al on surgical patients with high-grade glioma, we observed that the median duration for thrombosis development was 18 days after surgery. This suggests the need to consider extending thromboprophylaxis into the outpatient period. 13 This is likely the reason for the emergence of several studies assessing the safety of using prophylactic doses of oral anticoagulants (DOACs) in glioma patients during the postoperative period to prevent VTE. The results of a double-blind, placebo-controlled study involving a reduced dose of rivaroxaban (10 mg) in patients following glioma surgery, conducted by Wang ZY et al, showed a significant reduction in the incidence of VTE in the rivaroxaban group compared to the placebo group (1/47 vs 10/47 patients, P = 0.008). The rate of major bleeding events was very low in both groups (1/47 vs 1/47 patients). This observation is reflected in modern recommendations regarding thromboprophylaxis in cancer patients with brain tumors.14–16 Nevertheless, the utilization of DOACs in clinical practice, particularly without the support of large randomized clinical trials, is constrained by the exceptionally high risk of intracranial hemorrhage.17,18
VTE assessment tools can aid in identifying groups that would derive the maximum benefit from prophylactic anticoagulant therapy. Given the higher potential risk of intracranial hemorrhage compared to the benefits of anticoagulants for thrombosis prevention, a VTE risk assessment model must minimize false-positive detections. Consequently, the optimal model should exhibit high specificity and, more importantly, high positive predictive ability. All the models validated in our glioma patient cohort demonstrated acceptable specificity, ranging from 79% to 92%. However, the positive predictive value (PPV) of these models was relatively low, varying from 50% to 64%, which may limit their routine use.
One approach to enhance the specificity and PPV of risk scales is the incorporation of glioma-specific thrombosis risk factors. In a series of papers, J. Riedl and colleagues summarized specific risk factors for this group, which include dependent functional status (ie, patients requiring assistance for daily activities) and leg paresis, tumor biopsy, subtotal tumor resection, and glioma molecular subtype, as well as the use of corticosteroids and anti-VEGF therapy.2,16–22 Notably, thrombocytopenia was given particular attention as it sets glioma patients apart from other cancer types. 17 A number of studies have shown that podoplanin expression is associated with platelet activation by CLEC 2 receptors on their surface and the development of thrombocytopenia, which can be considered a risk factor for the development of VTE. 19 Myeloproliferative diseases, such as true polycythemia and essential thrombocytosis, are characterized by thrombocytosis, a well-known risk factor for VTE, especially in cancer patients. In this population, the scales discussed in our article are not used, probably because the main risk factors are changes in the hemogram. For example, in the case of Philadelphia-negative myeloproliferative neoplasms the white blood cell (WBC), but not thrombocytosis, represents a clinically relevant candidate risk factor. In a subanalysis of the ECLAP trial the level of WBC > 17 × 109/L was independently associated with myocardial infarction, and in patients of the high-hematocrit arm of CYTO-PV trial, the risk of thrombosis was clearly increased when WBC count was above 12 × 109/L (hazard ratio, 4.89; 95% confidence interval (CI), 1.1–22.7; P = 0.04)(PMID: 31395856). Thus, in our opinion, for patients with myeloproliferative diseases, it is necessary to create separate risk scales with the inclusion of traditional high-risk factors and factors specific to this population. 20
A recently published VTE predictive model by Zhang et al warrants special attention. The study encompassed a total of 480 patients, with 45 excluded based on initial treatment compliance with the study criteria. In contrast to our retrospective study, DVT rates were higher (18.4), possibly attributed to more active DVT screening, including routine duplex ultrasound (DUS) conducted 3 to 5 days post-operatively. Notably, the researchers excluded patients with initial risk factors, such as those with a history of pre-operative VTE, pre-operative leg vein conditions, and patients receiving pre-operative radiation or chemotherapy. We believe this approach raises questions about the pathogenetic validity of these classic risk factors. The risk model included the following factors: age, operation time, systemic immune-inflammation index, hypertension, and diabetes mellitus. The area under the curve of the nomogram was 0.834, surpassing the scales we investigated. However, further studies are necessary for external model validation. 21
In many risk assessment models (RAMs) used in our study with glioma patients, the threshold for VTE detection was notably higher compared to the general population. This is primarily due to the presence of strong predictors of venous thrombosis, such as active cancer and surgical treatment, which categorize patients as intermediate or high risk. The Padua scale was the only tool with a lower threshold in our group. This RAM was developed with the inclusion of cancer patients and has only one constant risk factor for our group (previous surgical intervention). Additionally, this model includes significant risk factors for neurosurgical patients, including corticosteroid therapy and reduced mobility. These factors may explain the lower threshold value for detecting high VTE risk when using the Padua scale in glioma patients.
It is important to note that when these scales are externally validated on different populations, the threshold often does not align with that of the original model. For example, in a meta-analysis conducted by A. Pandor et al, the threshold for VTE risk according to the Caprini RAM varied from 3 to 9 points across different studies, while the threshold for the Padua scale typically remained at 4 points, as originally proposed by its authors. 22 In our opinion, taking into account the multifactorial nature of the Caprini scale, it is advisable to perform validation with threshold calculation for each population. During validation, it is possible to identify the most common risk factors in a given population and assess the contribution of each to the development of thrombosis using the method of logical regression.
In summary, it's crucial to highlight the challenges associated with utilizing existing VTE risk assessment models in routine neurosurgical practice. These challenges primarily stem from their low positive predictive ability and the discrepancies in the thresholds for detecting high-risk groups when compared to previously validated standards.
Conclusion
The Caprini Risk Assessment Model, the IMPROVE Risk Score, the IMPROVED VTE Risk Score, and the Padua Prediction Score exhibit acceptable specificity and sensitivity for glioma patients. However, their limited positive predictive ability, coupled with the complexity of interpretation, hinders their practical utility in neurosurgical practice. It appears prudent to consider the development of a risk scale tailored specifically for glioma patients, incorporating thrombosis risk factors unique to this pathology.
Footnotes
Author Contributions
P.K. and M.S. conducted the study design. All authors were responsible for the data collection and case confirmation. P.K., M.S. and L.V. performed the statistical analyses and drafted the manuscript. V.N., B.M., S.K., M.O., Z.E., S.A., M.O. modified and revised the manuscript. All authors have read and approved the final version of the manuscript.
Declaration of Conflicting Interests
The authors declared no potential conflicts of interest with respect to the research, authorship, and/or publication of this article.
Ethics Statement
The study protocol was approved by the Regional Ethics Committee (No. 0603-21). Written informed consent in accordance with the Declaration of Helsinki was obtained from all participants before their inclusion in the study.
Funding
The author(s) received no financial support for the research, authorship, and/or publication of this article: This work was financially supported by the Ministry of Science and Higher Education of the Russian Federation, (grant number Agreement No. 075-15-2022-301).