
Abstract
Warfarin is a widely used anticoagulant, and bleeding complications are the main reason why patients discontinue the drug. Currently, there is no nomogram model for warfarin-associated bleeding risk. The aim of this study was to develop a risk-prediction nomogram model for warfarin-related major and clinically relevant non-major (CRNM) bleeding. A total of 280 heart disease outpatients taking warfarin were enrolled, 42 of whom experienced major or CRNM bleeding at the one-year follow-up. The Least Absolute Shrinkage and Selection Operator regression model was employed to identify potential predictors. Backward stepwise selection with the Akaike information criterion was used to establish the optimal predictive nomogram model. The receiver operating characteristic (ROC) curve, calibration plot, Hosmer–Lemeshow goodness-of-fit test, and decision curve analysis (DCA) were used to evaluate the performance of the nomogram. The nomogram consisted of four predictors: female (OR = 1.85; 95% CI: 0.91-3.94), TIA (OR = 6.47; 95% CI: 1.85-22.7), TTR (OR = 0.99; 95% CI: 0.97-1.00), and anemia (OR = 2.30; 95% CI: 1.06-4.84). The model had acceptable discrimination (area under the ROC curve = 0.68, 95% CI: 0.59-0.78), and was significantly better than the existing nine warfarin-related bleeding prediction scoring systems. The calibration plot and Hosmer–Lemeshow test (χ² = 7.557; P = .478) indicated well-calibrated data in the model. The DCA demonstrated good clinical utility. In this study, we developed a nomogram to predict the risk of warfarin-related major or CRNM bleeding. The model has good performance, allows rapid risk stratification of warfarin users, and provides a basis for personalized treatment.
Keywords
Introduction
Warfarin is a traditional vitamin K-dependent anticoagulant that is widely used in the treatment and prevention of thromboembolic diseases such as atrial fibrillation and pulmonary embolism.1,2 Millions of patients worldwide are taking warfarin. In the UK alone, total warfarin usage in 2015 was 11.6 million prescriptions, well above the 1.5 million for rivaroxaban, 700 000 for apixaban, and 400 000 for dabigatran. 3
However, bleeding complications associated with warfarin, including major bleeding and clinically relevant non-major (CRNM) bleeding, are the main reason for patients to discontinue the drug. And, the risk of bleeding and all-cause mortality associated with warfarin is significantly higher than with other nonvitamin K-dependent direct oral anticoagulants (DOACs).4–6
Early identification and risk stratification of the risk of warfarin-related bleeding may help improve the prognosis of users. So far, there is no nomogram model that identifies the risk of bleeding in warfarin users. The aim of this study was to develop a simple nomogram model to help clinicians identify the risk of bleeding from warfarin and to specify individualized clinical treatment decisions.
In addition, we compared the nomogram model with nine existing scoring systems for warfarin-associated bleeding to assess the performance of the nomogram model.
Methods
Study Population
Data were obtained from a publicly available, free dataset on the web at https://www.ncbi.nlm.nih.gov/pmc/articles/PMC6195286/. The original study was a single-centre, prospective cohort study. 7 The original study used nine warfarin-related bleeding prediction models, including the ORBIT, 8 ATRIA, 9 HAS-BLED, 10 RIETE, 11 Shireman et al, 12 HEMORR2HAGES, 13 Kearon et al, 14 Kuijer et al, 15 and OBRI 16 to assess the risk of bleeding in patients on warfarin and to compare the predictive performance of these models. However, the authors did not use the raw data to build predictive models; and the authors used major bleeding or CRNM bleeding as two different endpoint events and compared the predictive value of each of the nine predictive models for these two endpoint events. Compared to the original study, this study had three differences: (1) we used the original data to build a predictive nomogram model and performed model validation; (2) we used major bleeding and CRNM bleeding at one year of follow-up as a composite study endpoint, 17 as they both required clinical intervention; and (3) we evaluated the difference in performance between the nomogram model and nine other predictive models in predicting bleeding risk.
The original study was conducted to evaluate the efficacy of an anticoagulation clinic at a university public hospital located in southeastern Brazil. The main condition for the admission of patients at this clinic is the baseline diagnosis of cardiopathy, such as atrial fibrillation, rheumatic valve disease, and Chagas cardiomyopathy. This trial included patients aged 18 years or older presenting a diagnosis of cardiac disease and with at least one indication of long-term oral anticoagulation, such as atrial fibrillation/flutter, mechanical heart valves, history of ischemic stroke/transient ischemic attack, or thrombosis. A total of 280 heart disease outpatients taking warfarin were enrolled, 42 of whom experienced major bleeding or CRNM bleeding at the one-year follow-up.
Data Collection
Data were extracted from the raw data for the following 35 variables: age, gender, hypertension, diabetes, international normalized ratio (INR) target range, labile INRs, time within therapeutic INR target range (TTR), abnormal liver or kidney function, atrial fibrillation/flutter, mechanical heart valve, stroke, transient ischemic attack (TIA), pulmonary embolism, deep vein thrombosis, Chagas disease, history of bleeding (including major bleeding, non-major bleeding, and gastrointestinal bleeding), estimated glomerular filtration rate (eGFR, mL/min), thrombocytopenia, ethanol abuse, excessive fall risk, concurrent use of antiplatelet drugs, anemia, and bleeding risk scores from 9 predictive models.
Definitions
The endpoint of this study was a composite of major bleeding and CRNM bleeding as defined by the International Society on Thrombosis and Haemostasis (ISTH) within one year of follow-up.18,19 Bleeding was defined as major bleeding if it resulted in death, occurred in a critical organ (intracranial, intraspinal, intraocular, retroperitoneal, intra-articular, intramuscular with compartment syndrome, or pericardial) or was associated with either a decrease in the hemoglobin level of at least 2 g/dL or a transfusion of at least 2 units of packed red blood cells. Bleeding was defined as CRNM bleeding if it resulted in hospitalization, medical or surgical intervention for bleeding, an unscheduled clinic visit, or a change in physician-directed antithrombotic therapy.
TTR was determined by the method of Rosendaal et al 20 TTR represents the percentage of time in which the INR remains in the 2.0 to 3.0 target range across time. 21 INR measurements during follow-up were used to determine the TTR and all INRs from baseline to the end of follow-up were taken into account. 7 Labile INRs were defined as poor time in the therapeutic range (TTR <60%). Ethanol abuse was defined as a consumption of >20 units of alcohol weekly. Thrombocytopenia was defined as the platelet count <150 000 μL-1. Excessive fall risk was defined as age >60 years, presence of neuropsychiatric disease, impaired mobility, or any other factor that predispose to fall.
Statistical Analysis
The distributions of all quantitative variables were analyzed using the Shapiro-Wilk test and the three continuous variables including age, TTR and eGFR all showed non-normal distributions. The Least Absolute Shrinkage and Selection Operator (LASSO) regression model was employed to identify potential predictors. Univariate and backward stepwise multivariate logistic regression analyses were performed to identify the risk factors for warfarin-related bleeding, and the Akaike information criterion (AIC) was used to select the best prediction model. A nomogram was developed based on the results of the best prediction model, which was validated internally using bootstrap method. The performance of the nomogram was evaluated using the receiver operating characteristic (ROC) curve, Hosmer–Lemeshow goodness-of-fit test, calibration plot, and decision curve analysis (DCA). All data analyses were performed using R software (version 4.2.2). A P-value < .05 (two-tailed) or the 95% confidence interval (CI) of the odds ratio excluding the value one was considered statistically significant.
Results
Baseline Characteristics
A total of 280 eligible participants were enrolled in this study and a total of 42 had endpoint events, including 13 with major bleeding, 28 with CRNM bleeding and one with both major and CRNM bleeding. The detailed flowchart of the study is shown in Figure 1. The baseline characteristics of the study population are presented in Table 1. The median age of all participants was 57 years, and 54.6% were male. Compared with non-bleeding patients, those undergoing bleeding were propensity to have TIA and anemia (all P < .05). There were no other statistically significant differences between the two groups in other outcomes.
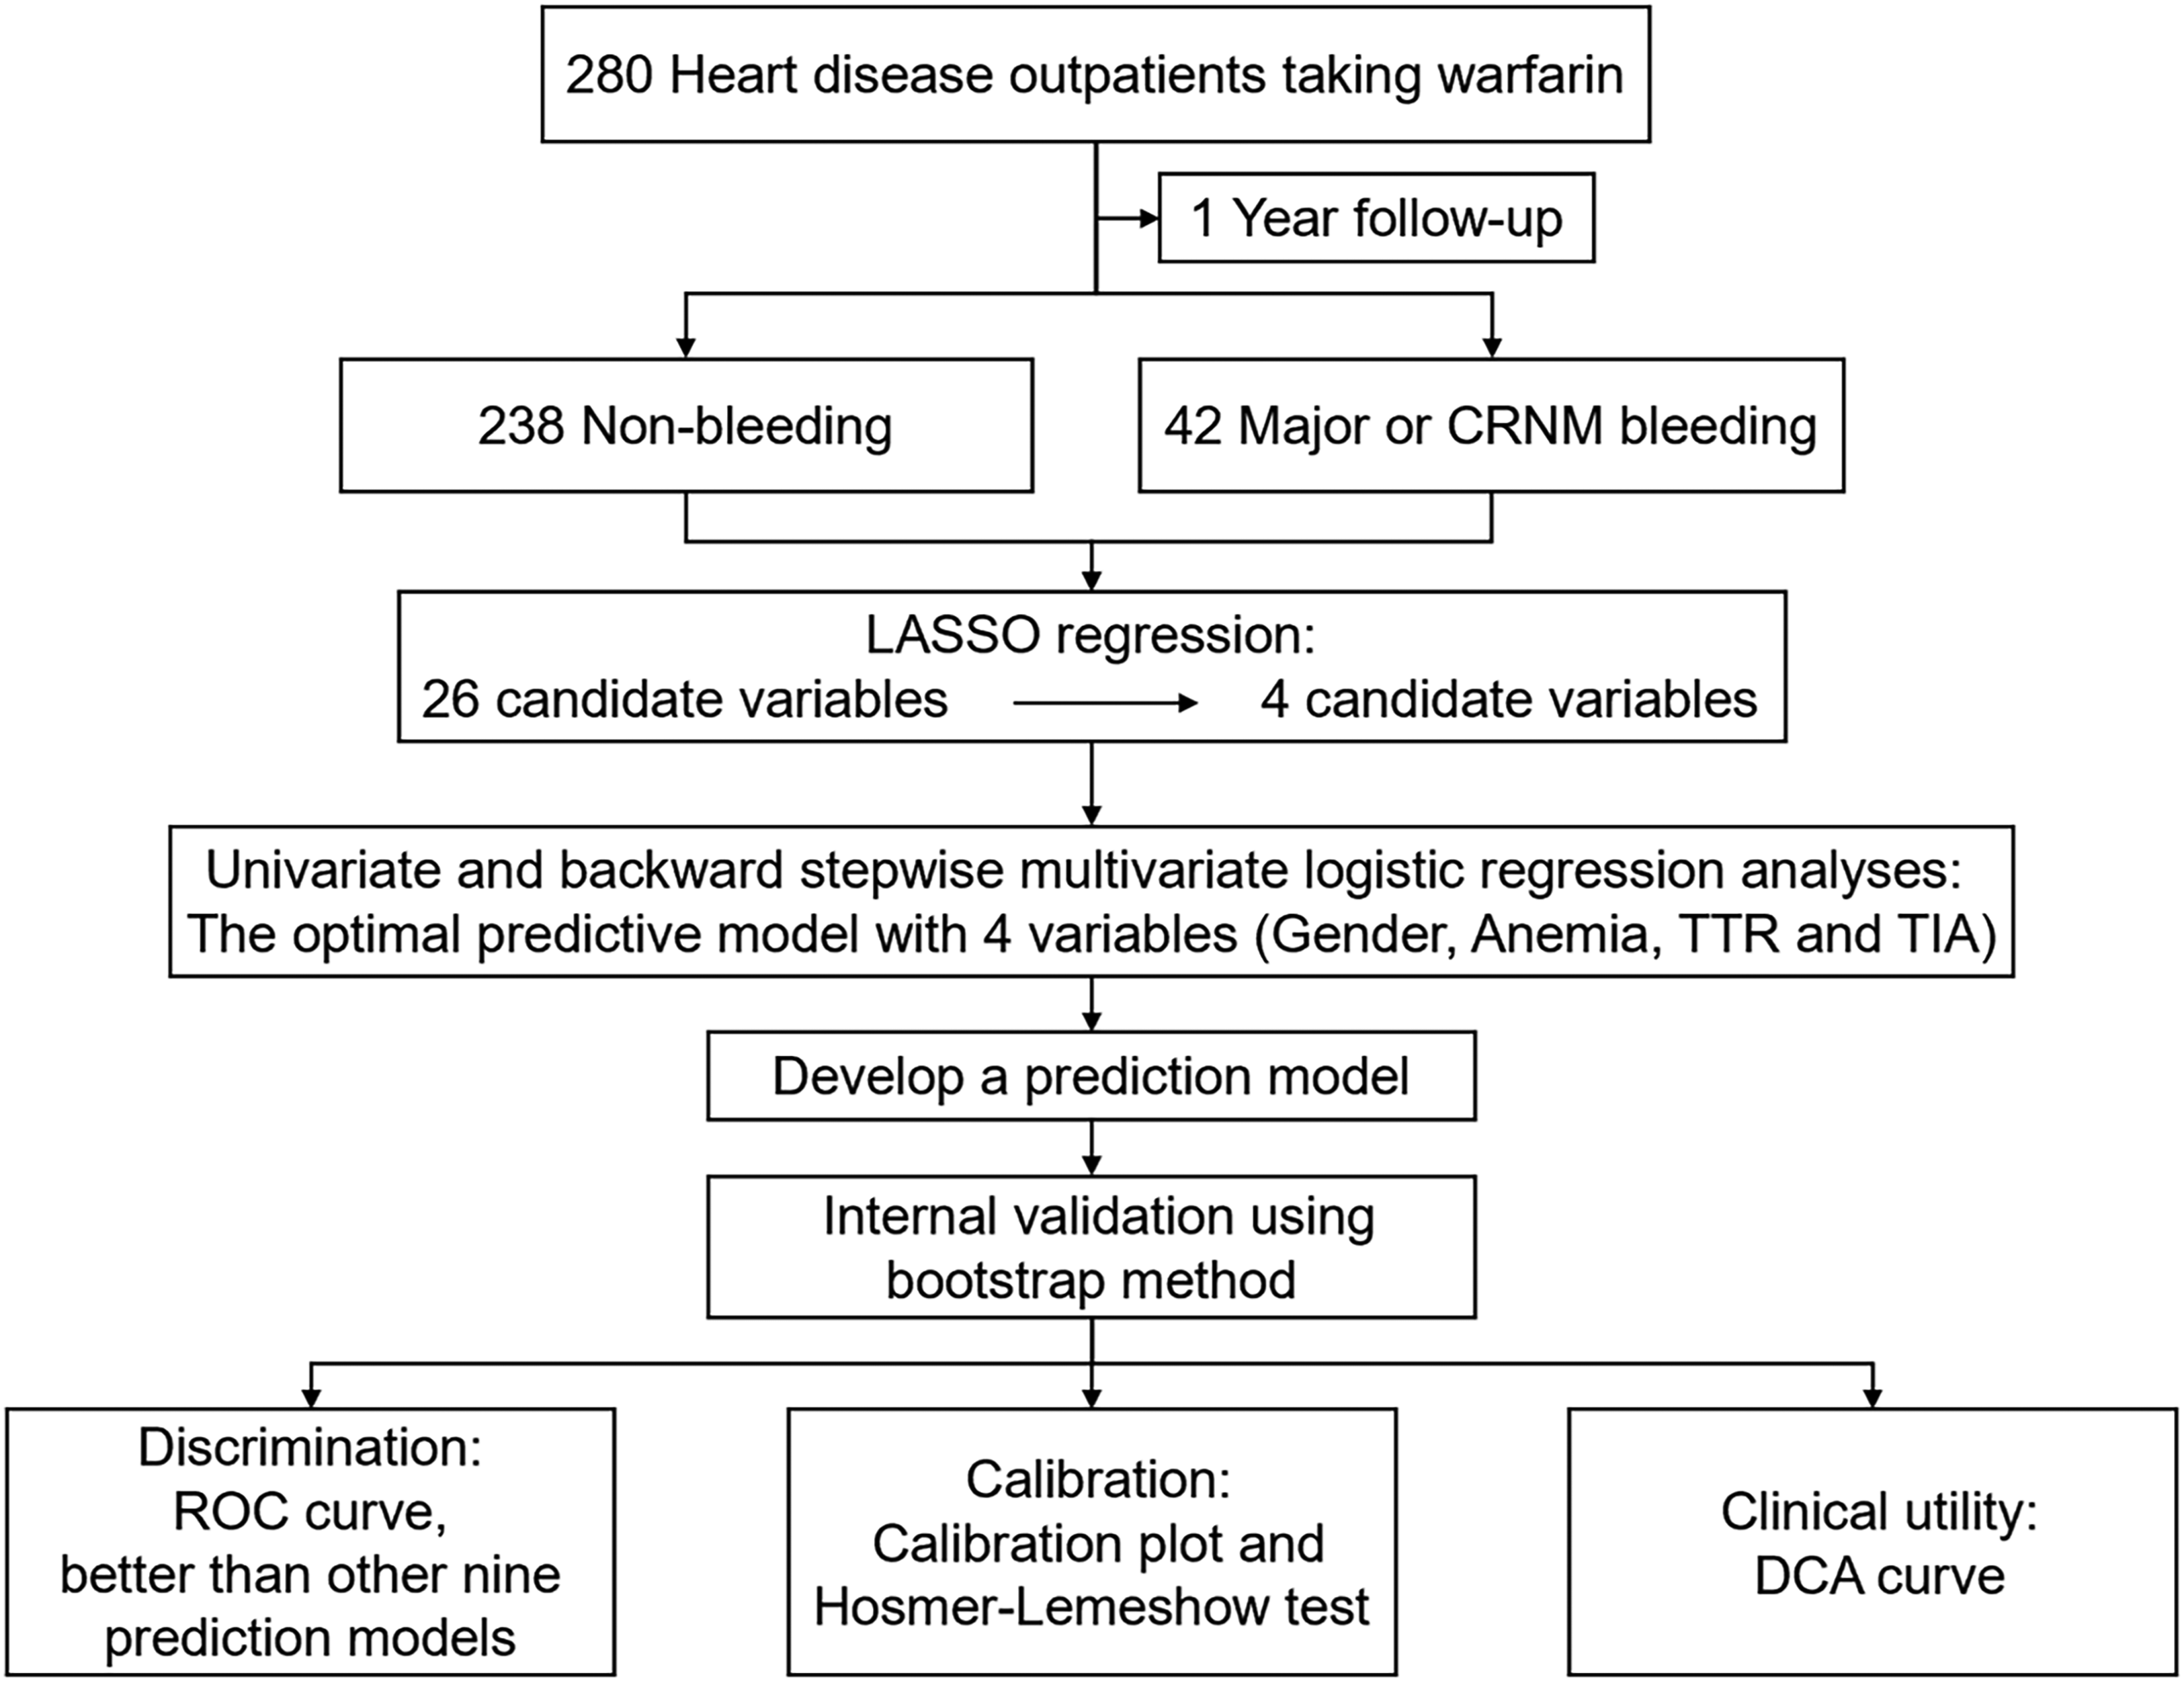
Flow chart of the study.
Baseline Characteristics of Participants.
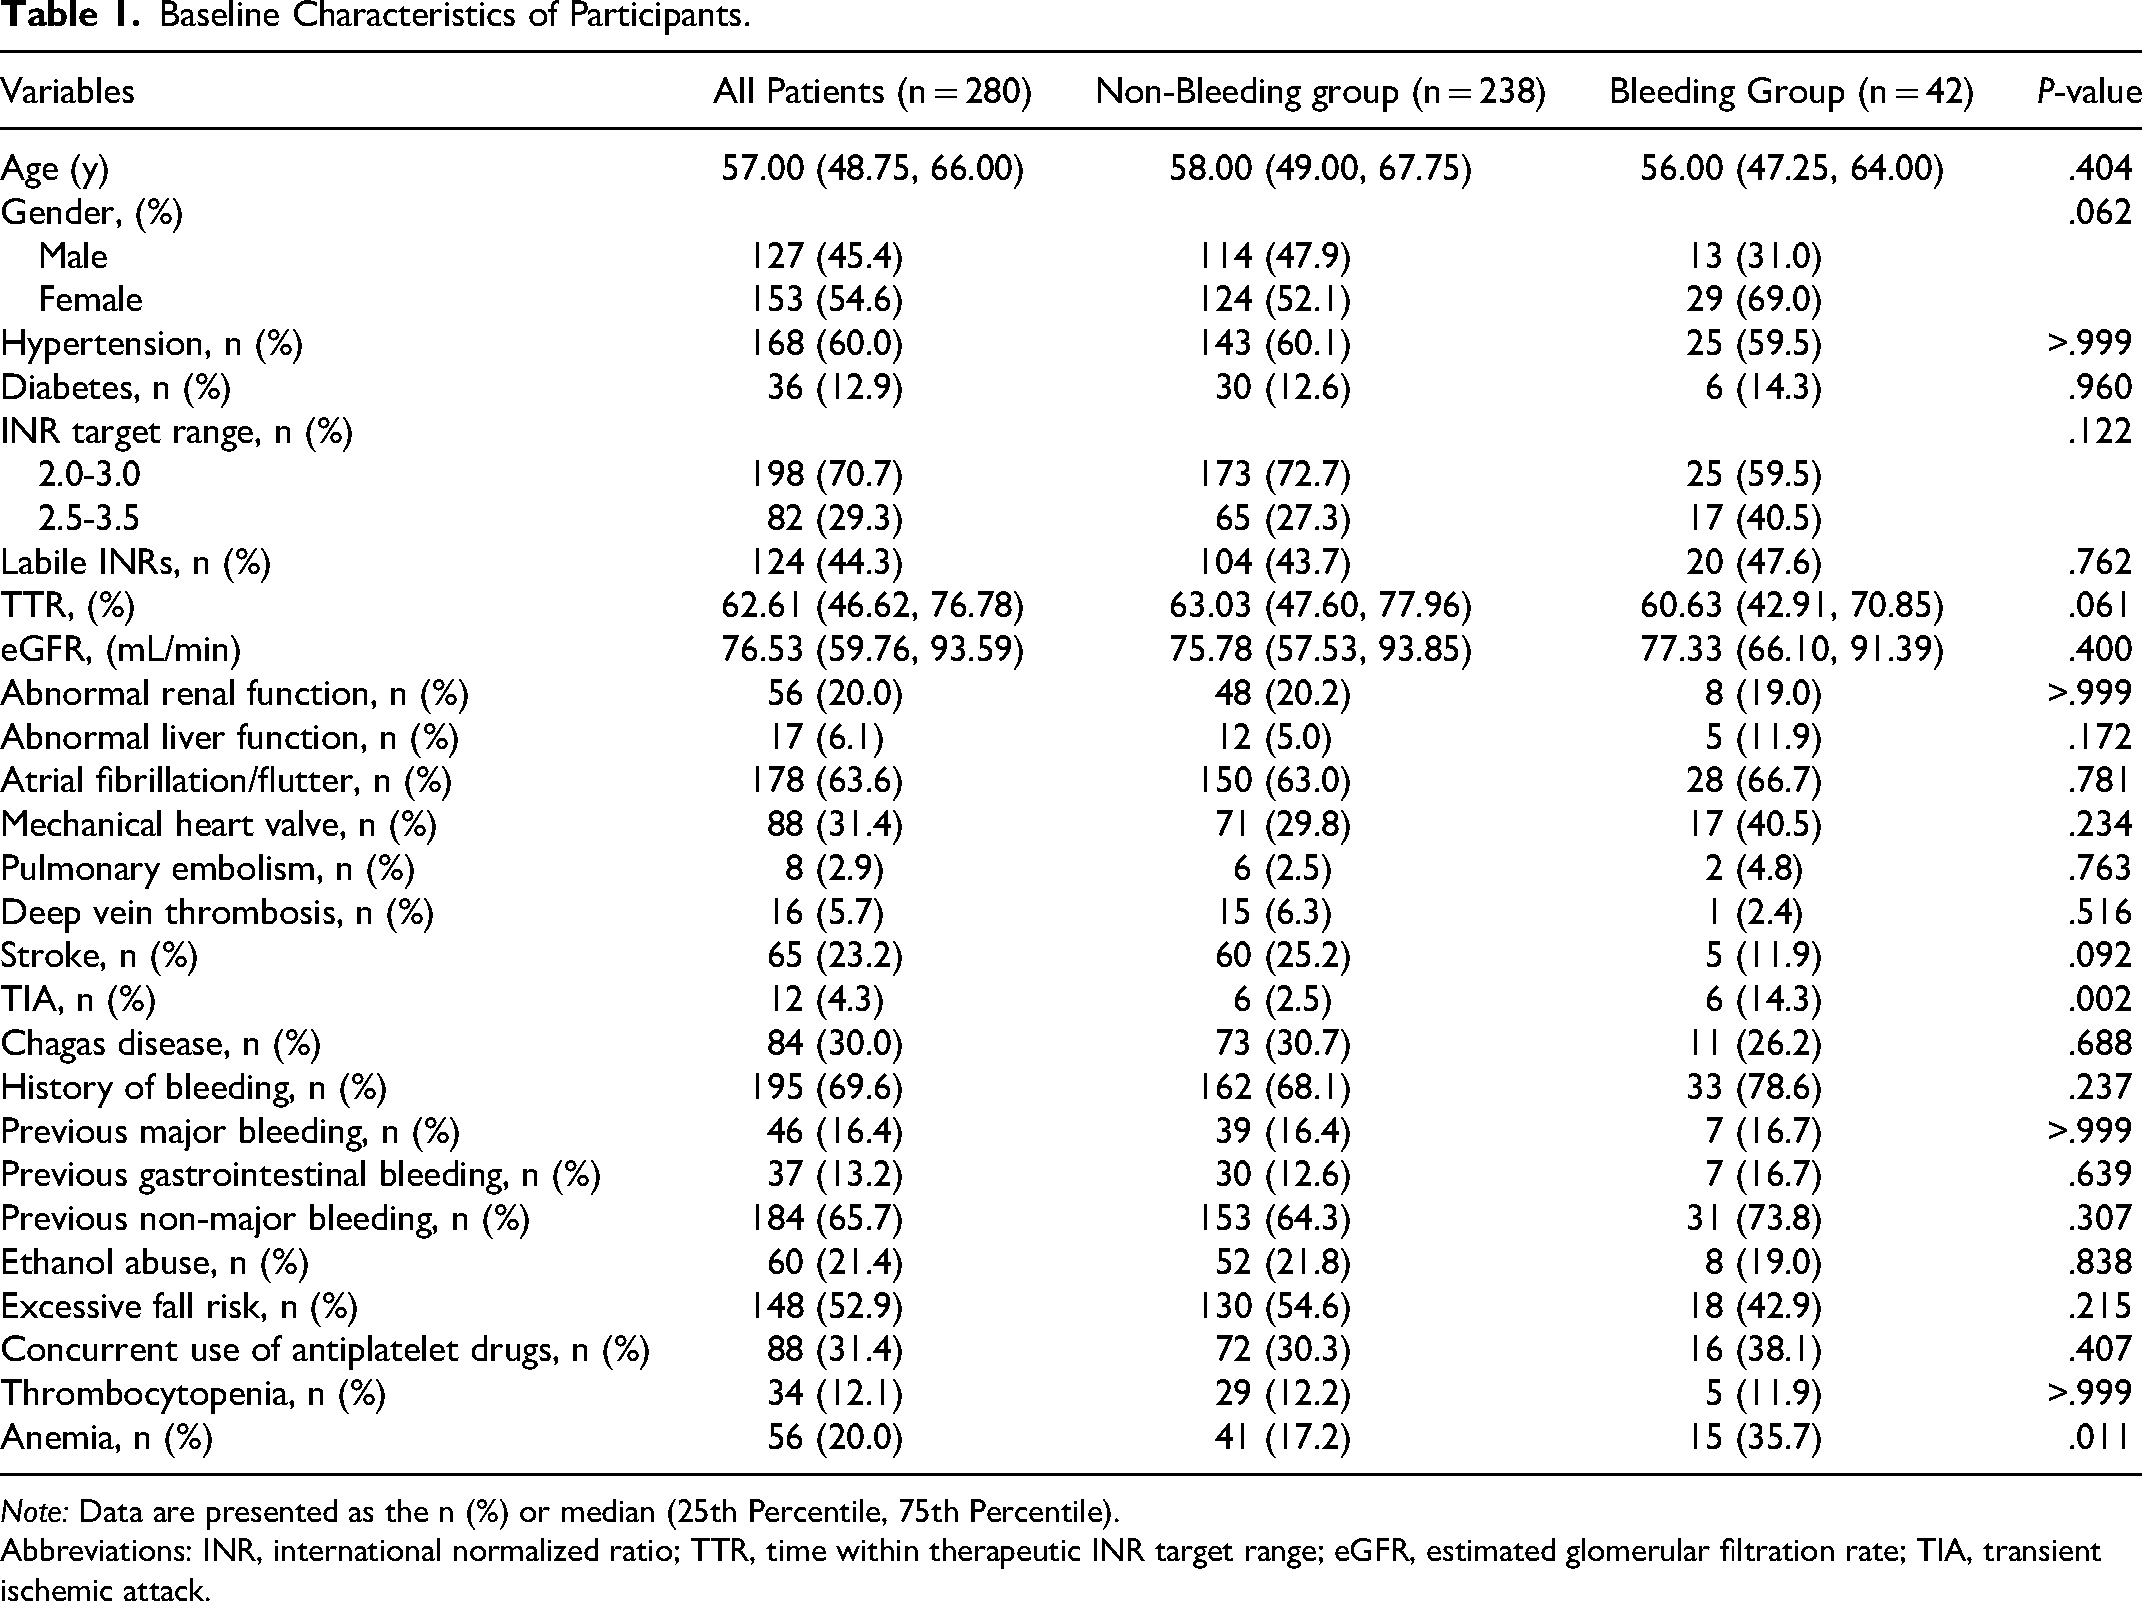
Note: Data are presented as the n (%) or median (25th Percentile, 75th Percentile).
Abbreviations: INR, international normalized ratio; TTR, time within therapeutic INR target range; eGFR, estimated glomerular filtration rate; TIA, transient ischemic attack.
LASSO Regression and Variable Selection
To avoid co-linearity between variables and over-fitting of the model, the LASSO regression was applied to select characteristic variables. The LASSO regression included 26 candidate variables (all variables in Table 1), with a final selection of four potential predictors of bleeding: gender, anemia, TTR, and TIA (Figure 2).
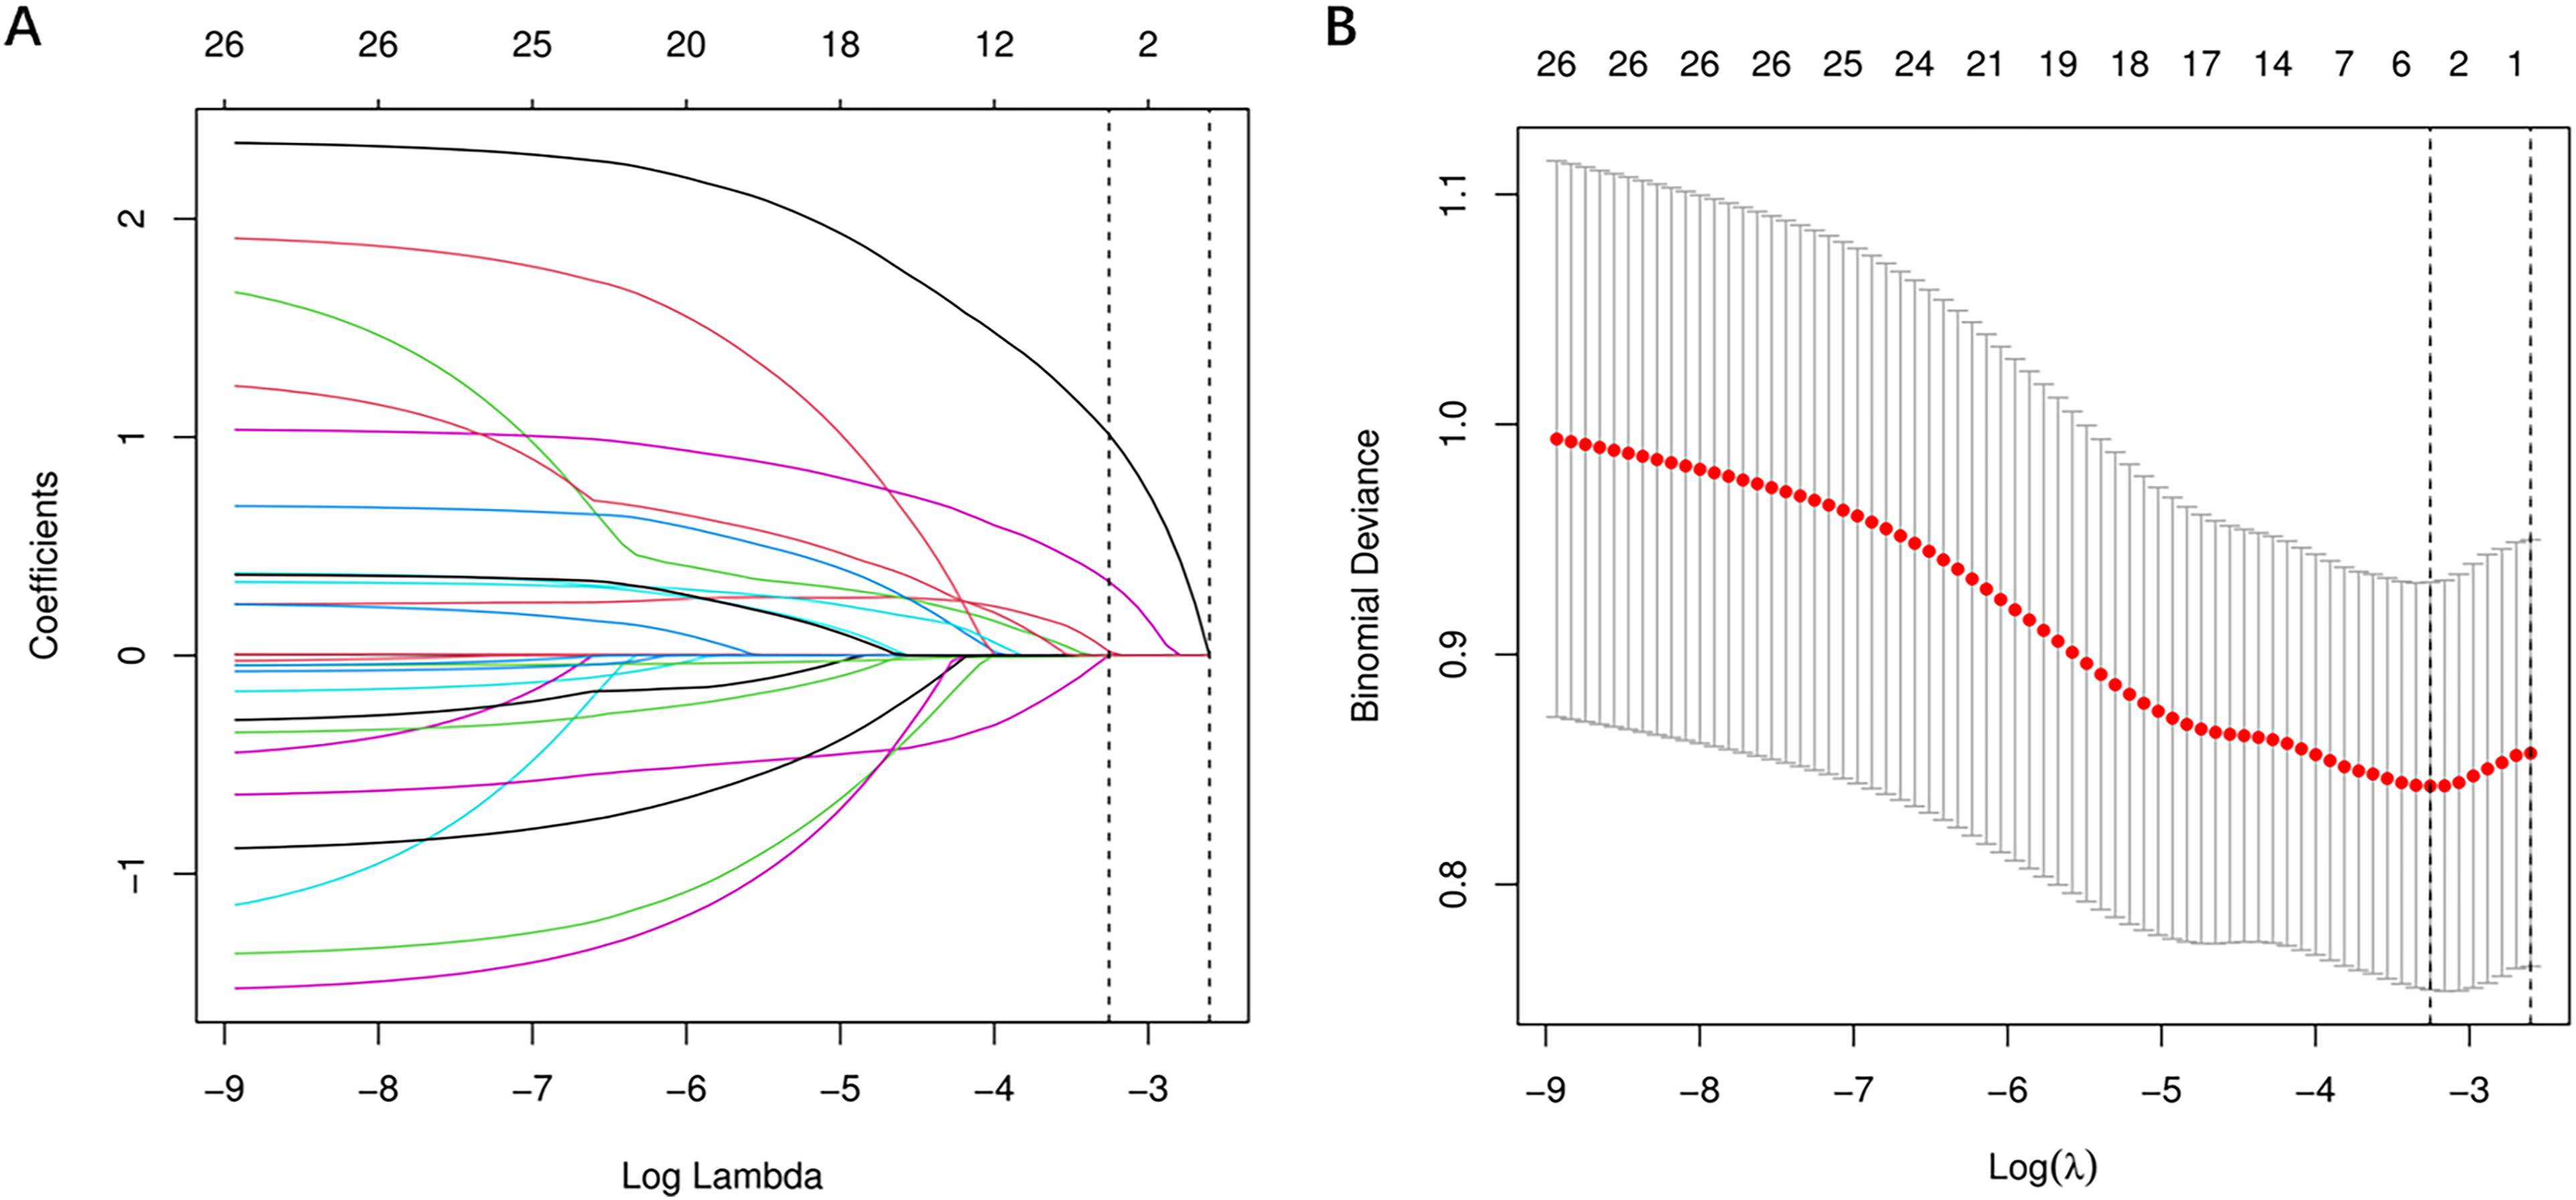
Predictors selection based on the LASSO regression method. (A) LASSO coefficient profiles of the 26 baseline features; (B) The tuning parameter (λ) selection in the LASSO model using 10-fold cross-validation via minimum criteria.
Univariate and Multivariate Logistic Regression Analyses
Four variables screened by LASSO regression were included in the univariate logistic regression analysis and those variables that were statistically significant (P < .05) in the univariate analysis were included in the multivariate logistic regression model in a backward stepwise fashion. Finally, an optimal predictive model consisting of four variables (gender, anemia, TTR, TIA) was determined according to the AIC (minimum AIC value: 223.86), as shown in Table 2.
Univariate and Backward Stepwise Multivariate Logistic Regression Analyses.
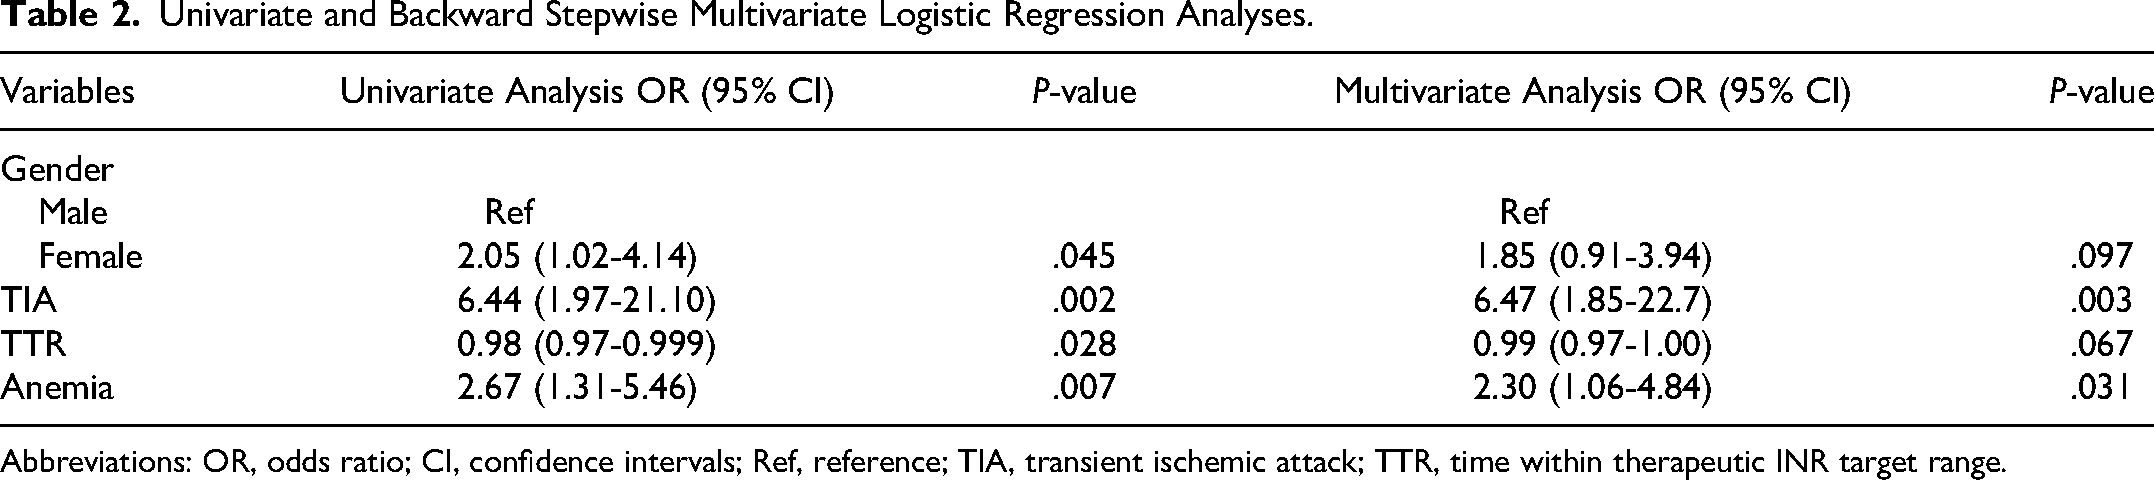
Abbreviations: OR, odds ratio; CI, confidence intervals; Ref, reference; TIA, transient ischemic attack; TTR, time within therapeutic INR target range.
Development of a Nomogram for Warfarin-Related Major and CRNM Bleeding
A nomogram was constructed based on the results of the optimal prediction model to assess the probability of an individual’s warfarin-related major and CRNM bleeding. According to Figure 3, the nomogram model contained four predictors: gender, anemia, TTR, and TIA. Each of these predictors was projected upwards onto the “point” of that value at the top of the nomogram to obtain a score from 0 to 100, and the total score of these points was then recorded to predict the probability of warfarin-related major and CRNM bleeding.
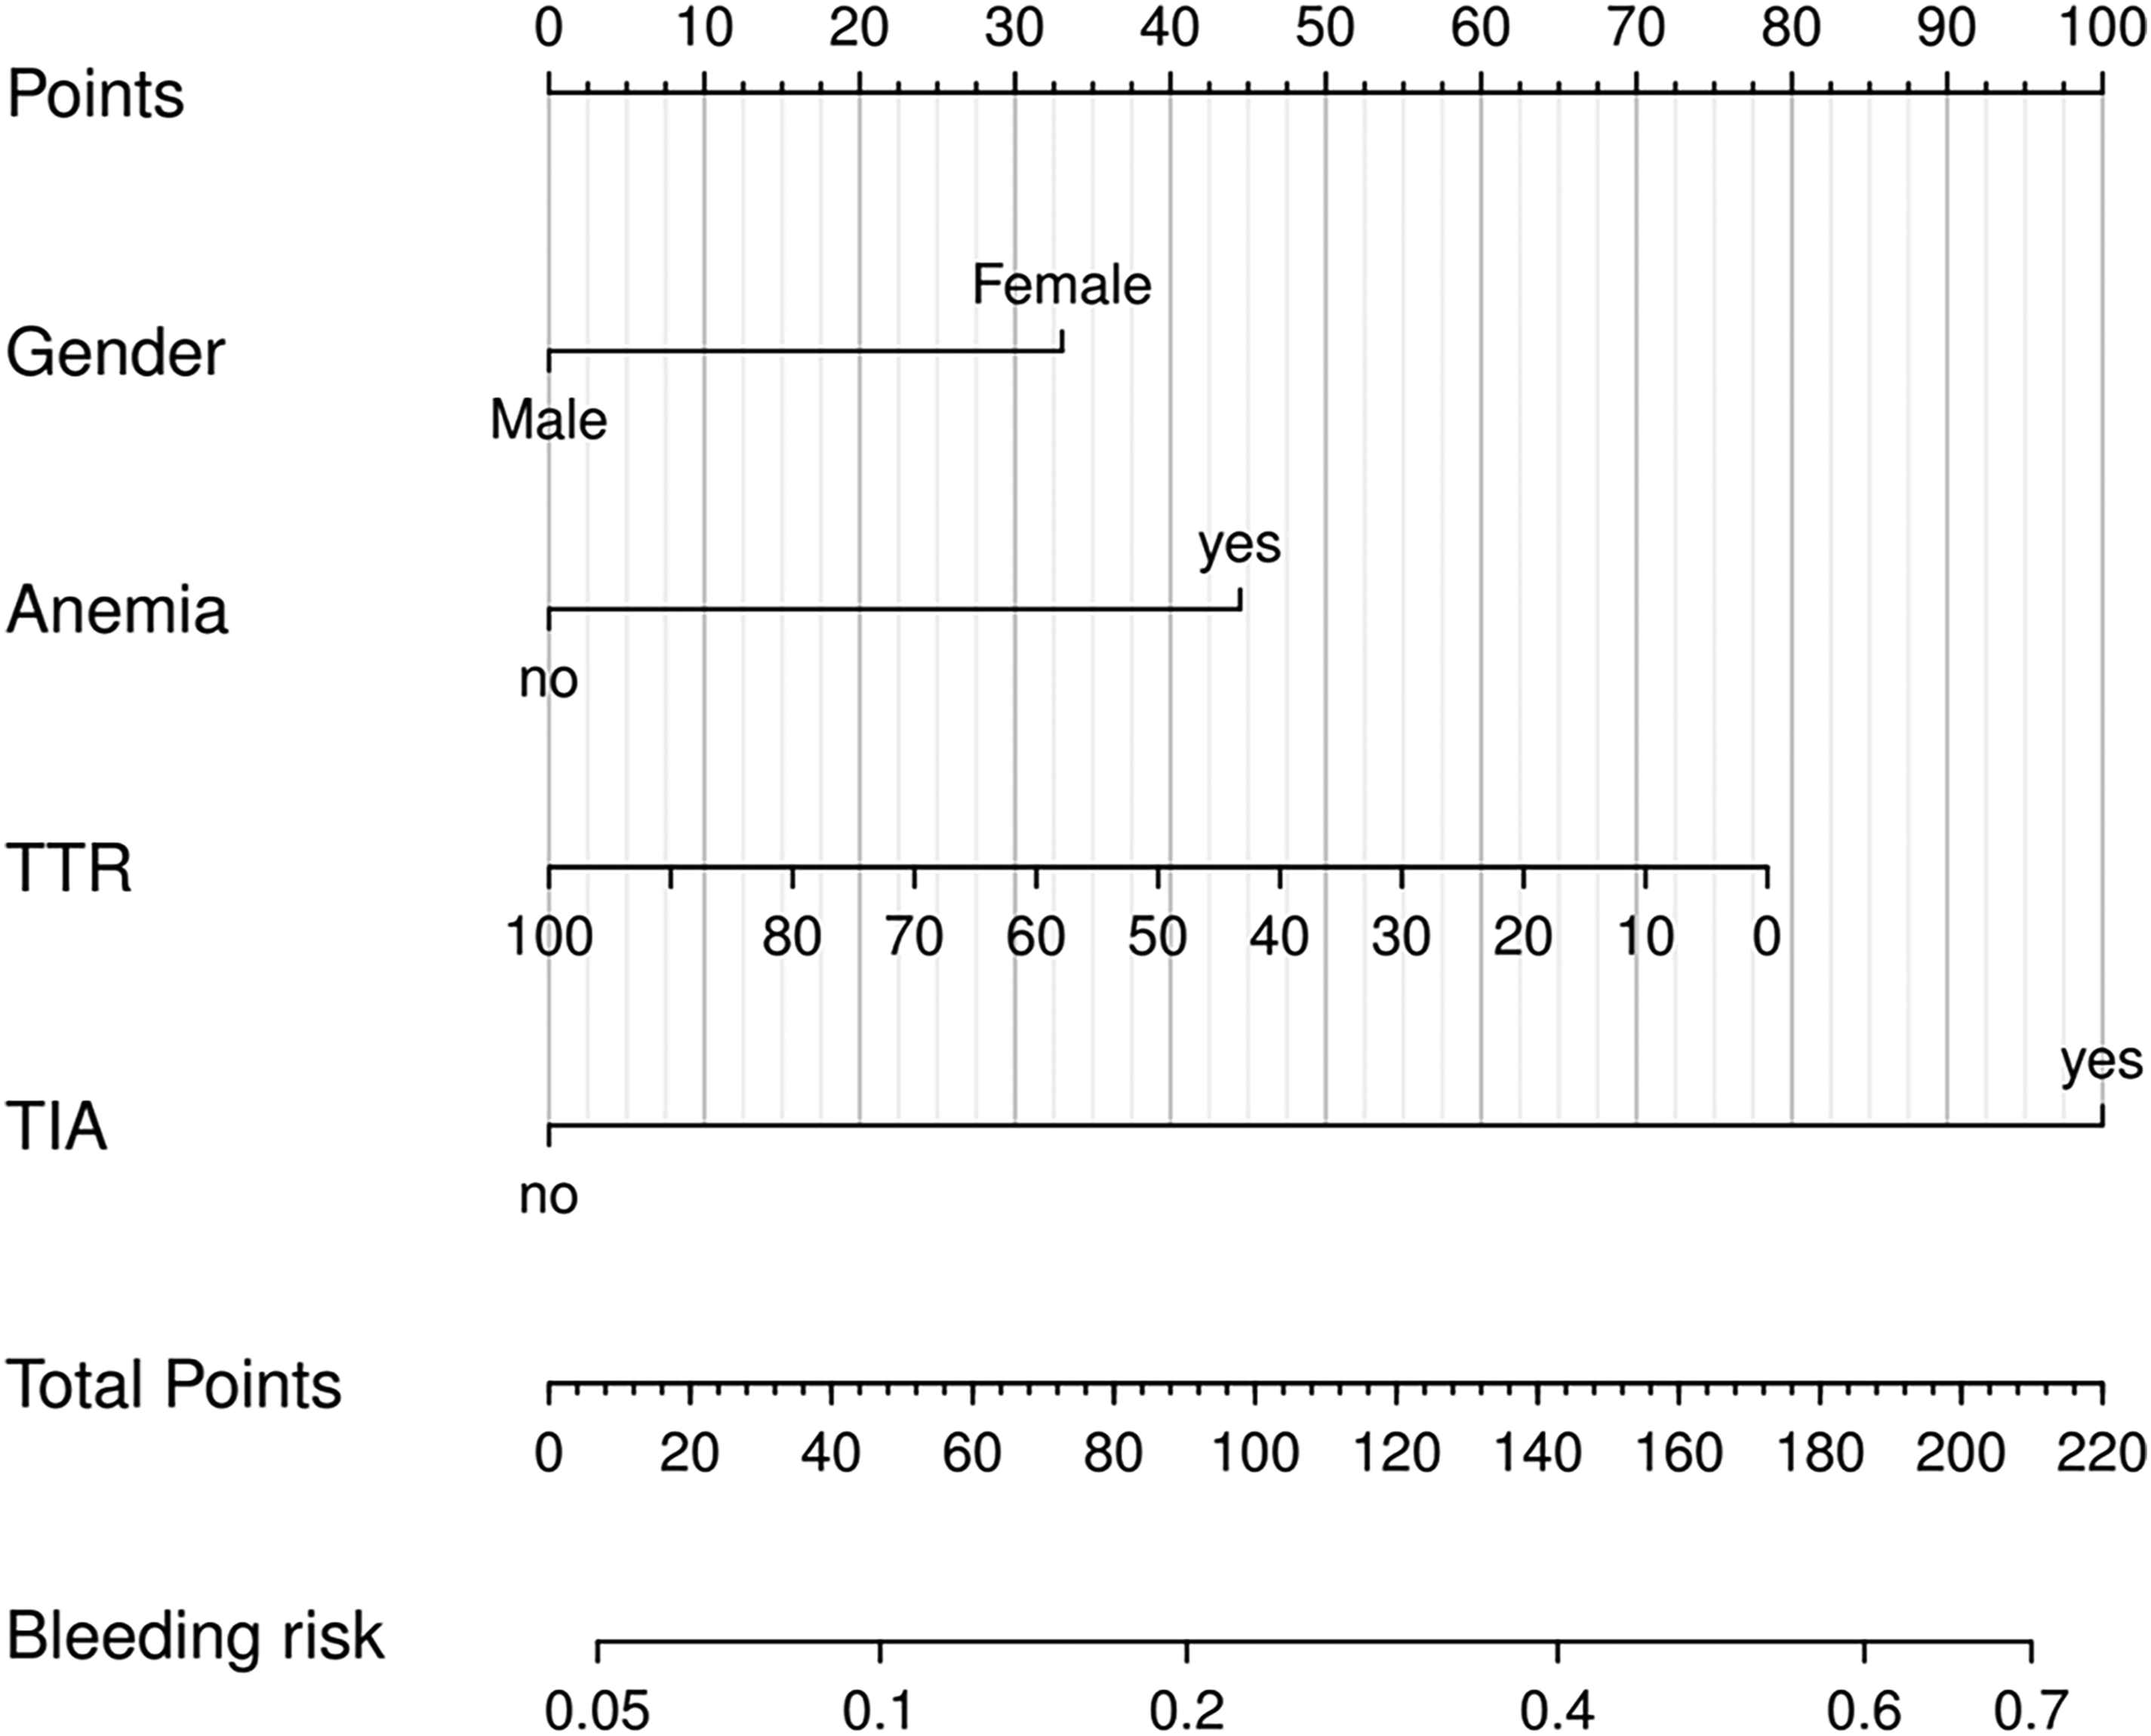
Nomogram for estimation of patient's risk of warfarin-related major and CRNM bleeding.
Discriminative Power of the Nomogram and Comparison of the Discriminative Power of Different Prediction Models
The nomogram model was cross-validated internally by the 1000 bootstrap resamples. The discriminative power of the nomogram was acceptable, and the corresponding area under the ROC curve (AUC) was 0.684 (95% CI: 0.588-0.780) (Figure 4A). In terms of discrimination, the nomogram model is significantly better than the existing nine warfarin-related bleeding prediction scoring systems (Figure 4B, Table 3).
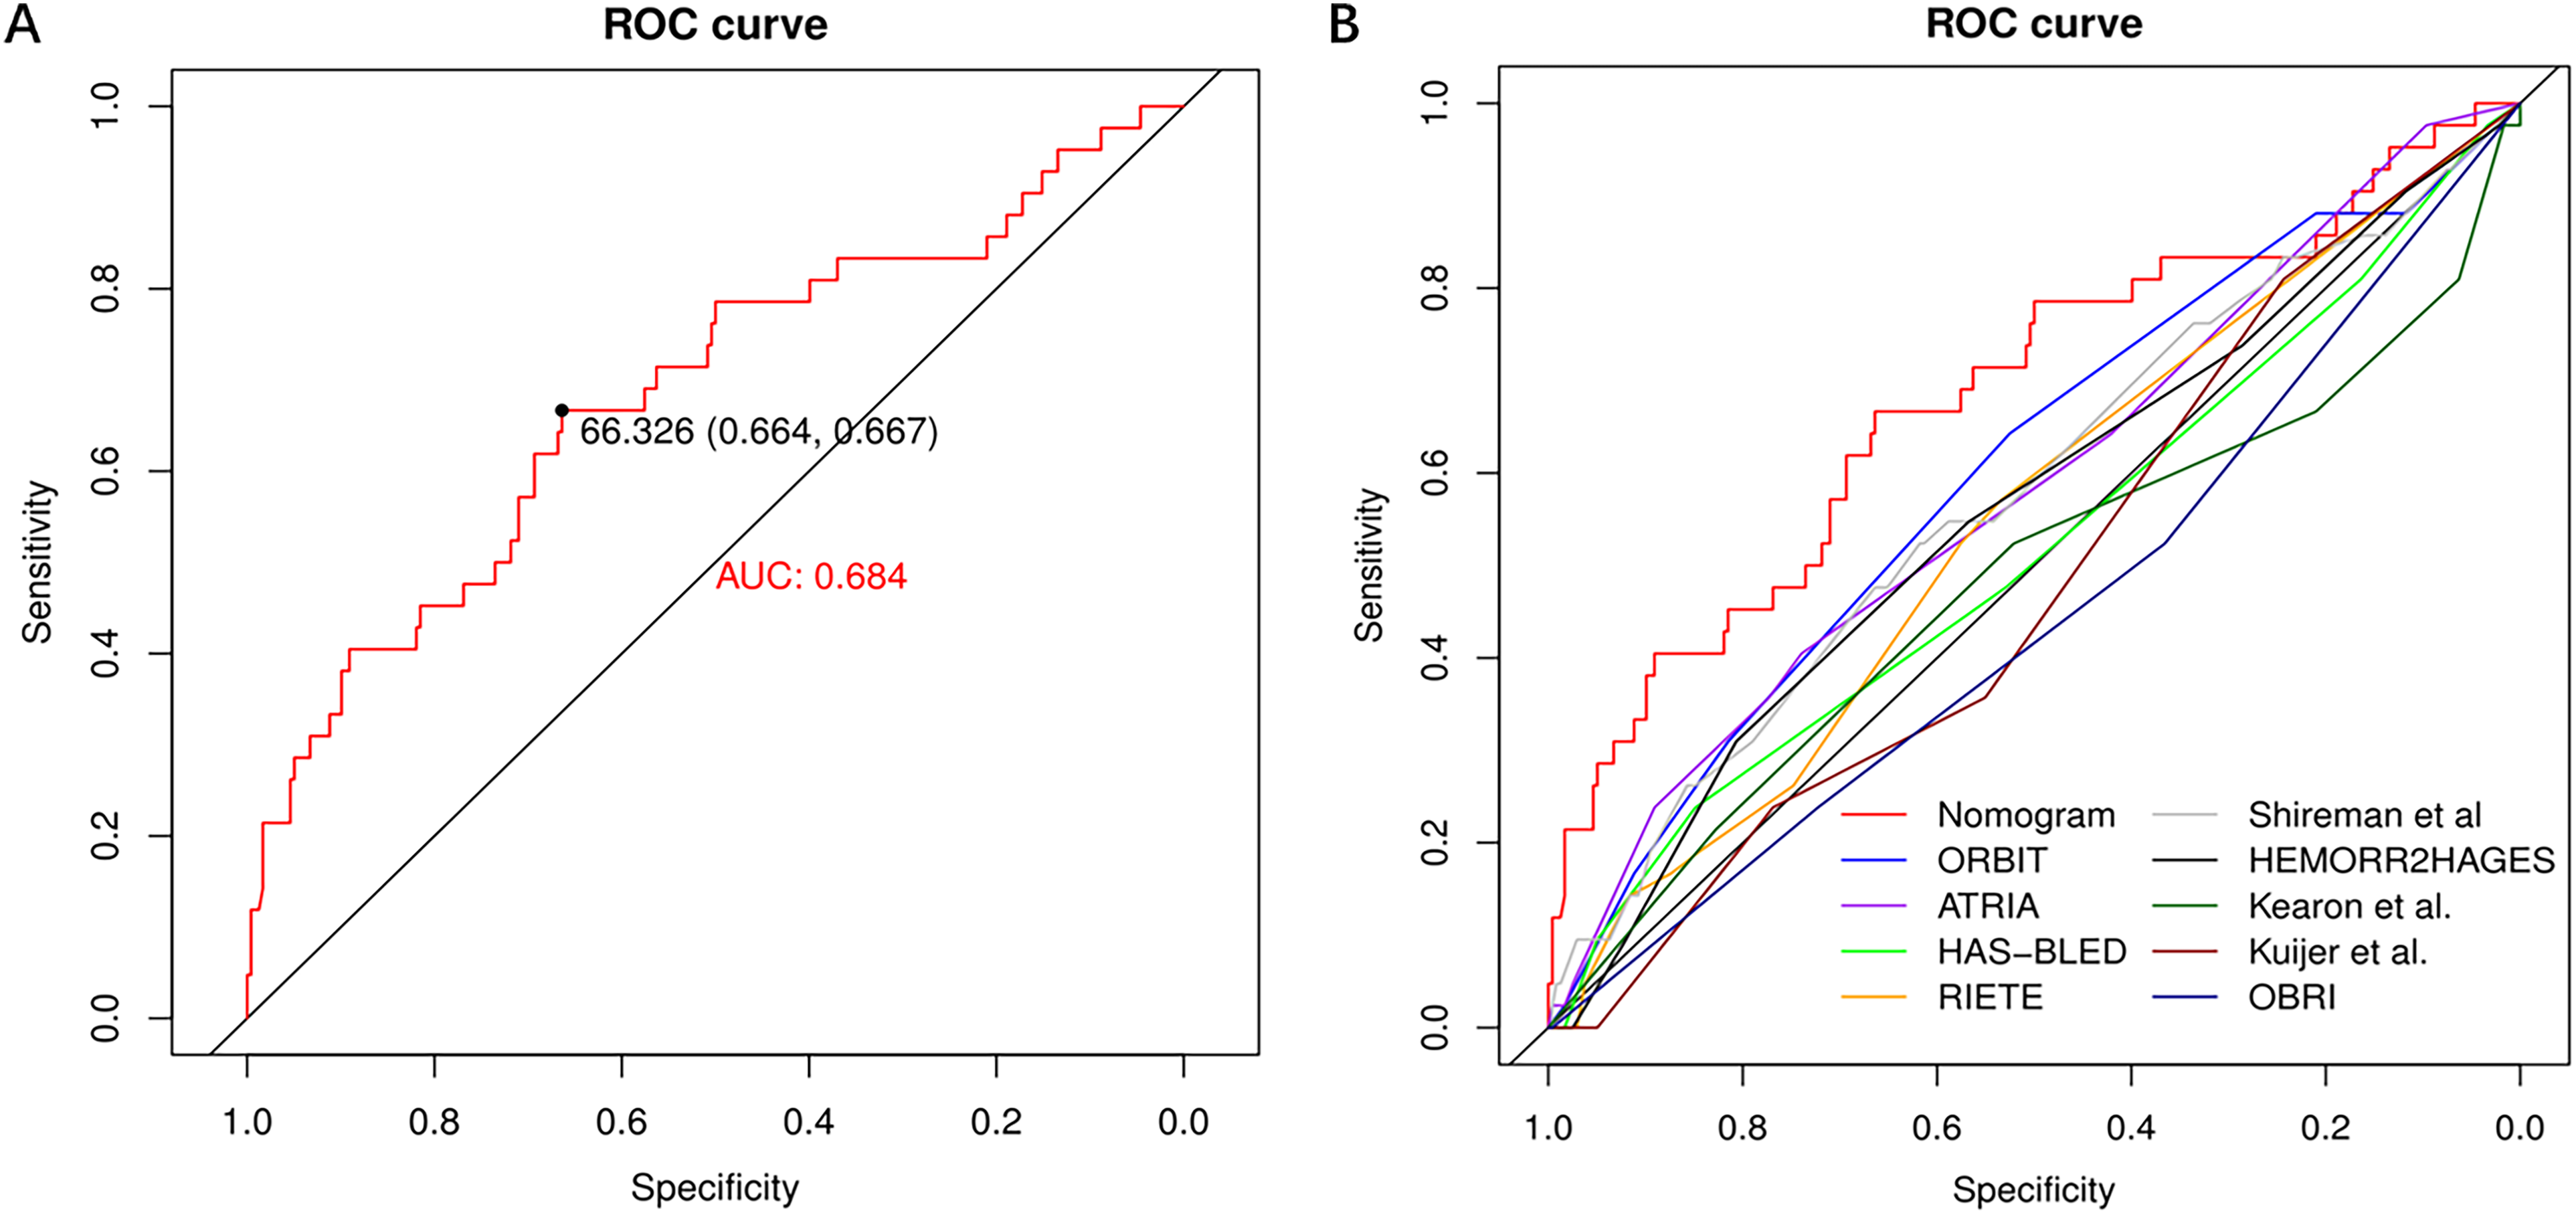
ROC curves. (A) ROC curve for nomogram model; (B) ROC curves for different models predicting the risk of major and clinically relevant non-major bleeding.
Discriminative Ability of Different Models to Predict the Risk of Warfarin-Associated Major and Clinically Relevant Non-Major Bleeding.
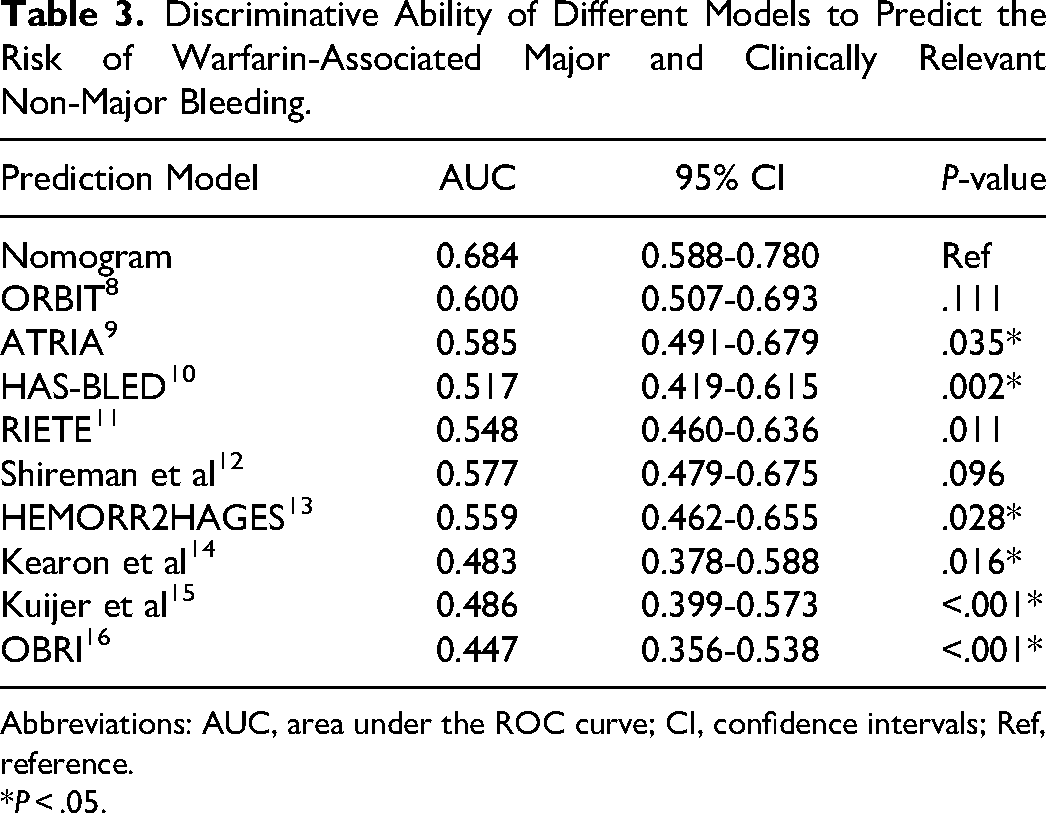
Abbreviations: AUC, area under the ROC curve; CI, confidence intervals; Ref, reference.
P < .05.
Calibration and Clinical Utility of the Nomogram Model
The calibration plot of the nomogram exhibited a good consistency between predicted values and observed values (Figure 5A). Hosmer–Lemeshow test also indicated well-calibrated data in the model (χ²=7.557; P = .478). Furthermore, according to the DCA result (Figure 5B), the model exhibited a good clinical utility and when the threshold probability is within 10%-70%, the use of this nomogram model in decision-making results in a greater net benefit for the patients compared with either treat-all or treat-none strategies.
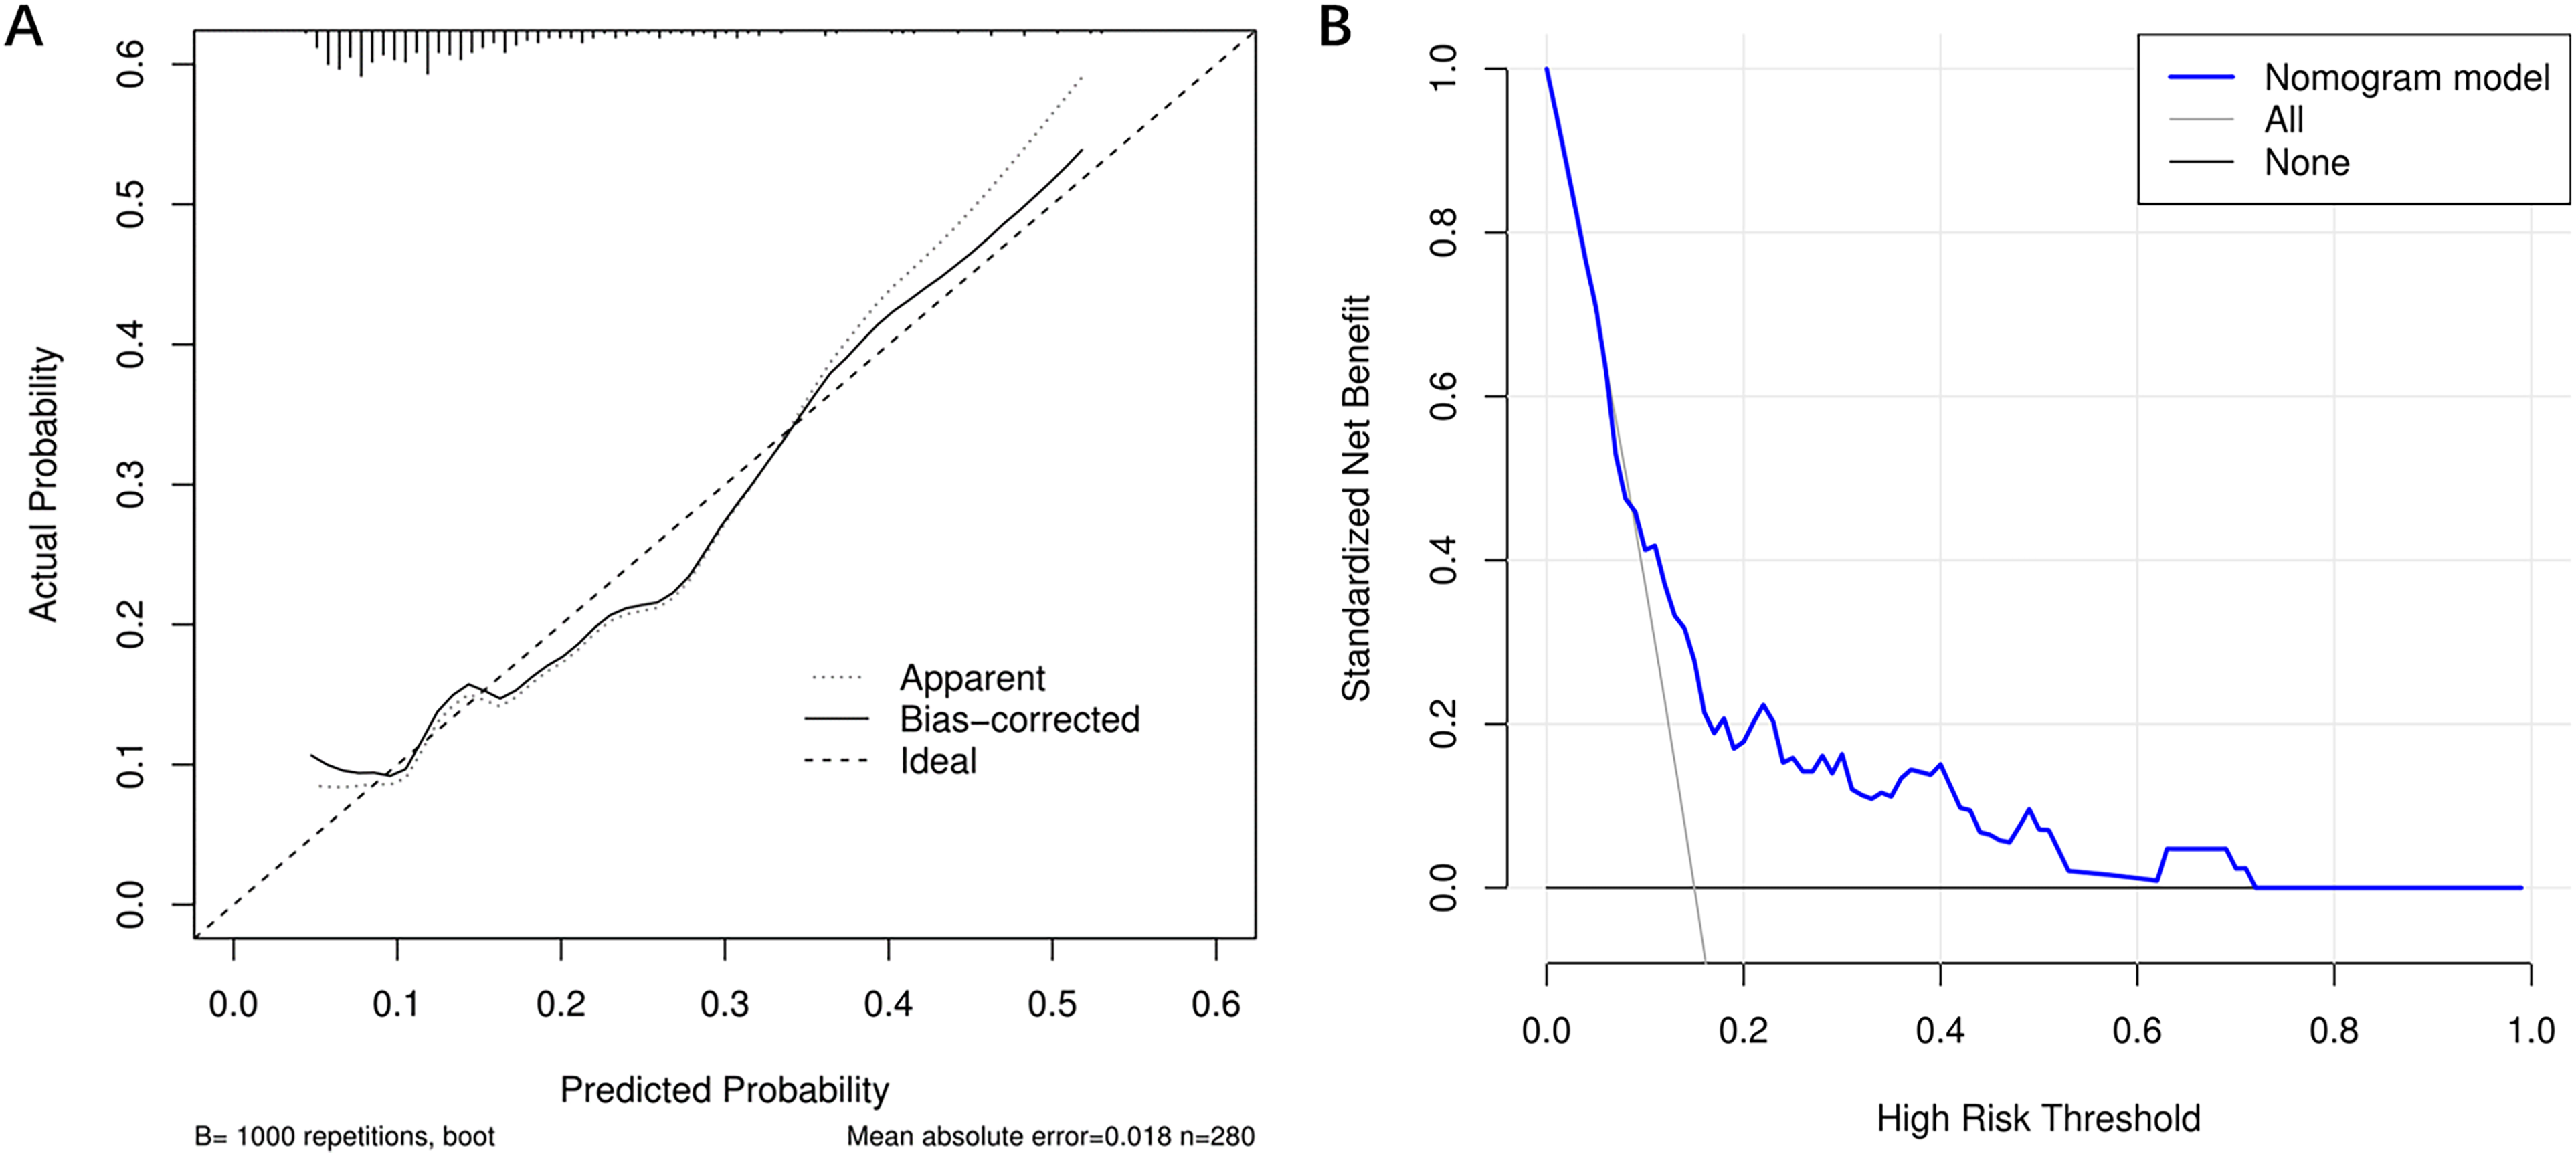
(A) Calibration curve of the nomogram model; (B) DCA of the nomogram model.
Risk Stratification Based on Nomogram Scores and the Optimal Cut-Off Value for TTR
We calculated the total nomogram score for each patient and determined the cut-off value of the score from the ROC curve. As shown in Figure 6A, the best cut-off value for the score was 66.326, with patients with scores greater than this being classified as high risk and those with scores lower than this being classified as low risk. The sensitivity and specificity of the nomogram model were 66.7% and 66.4%, respectively.
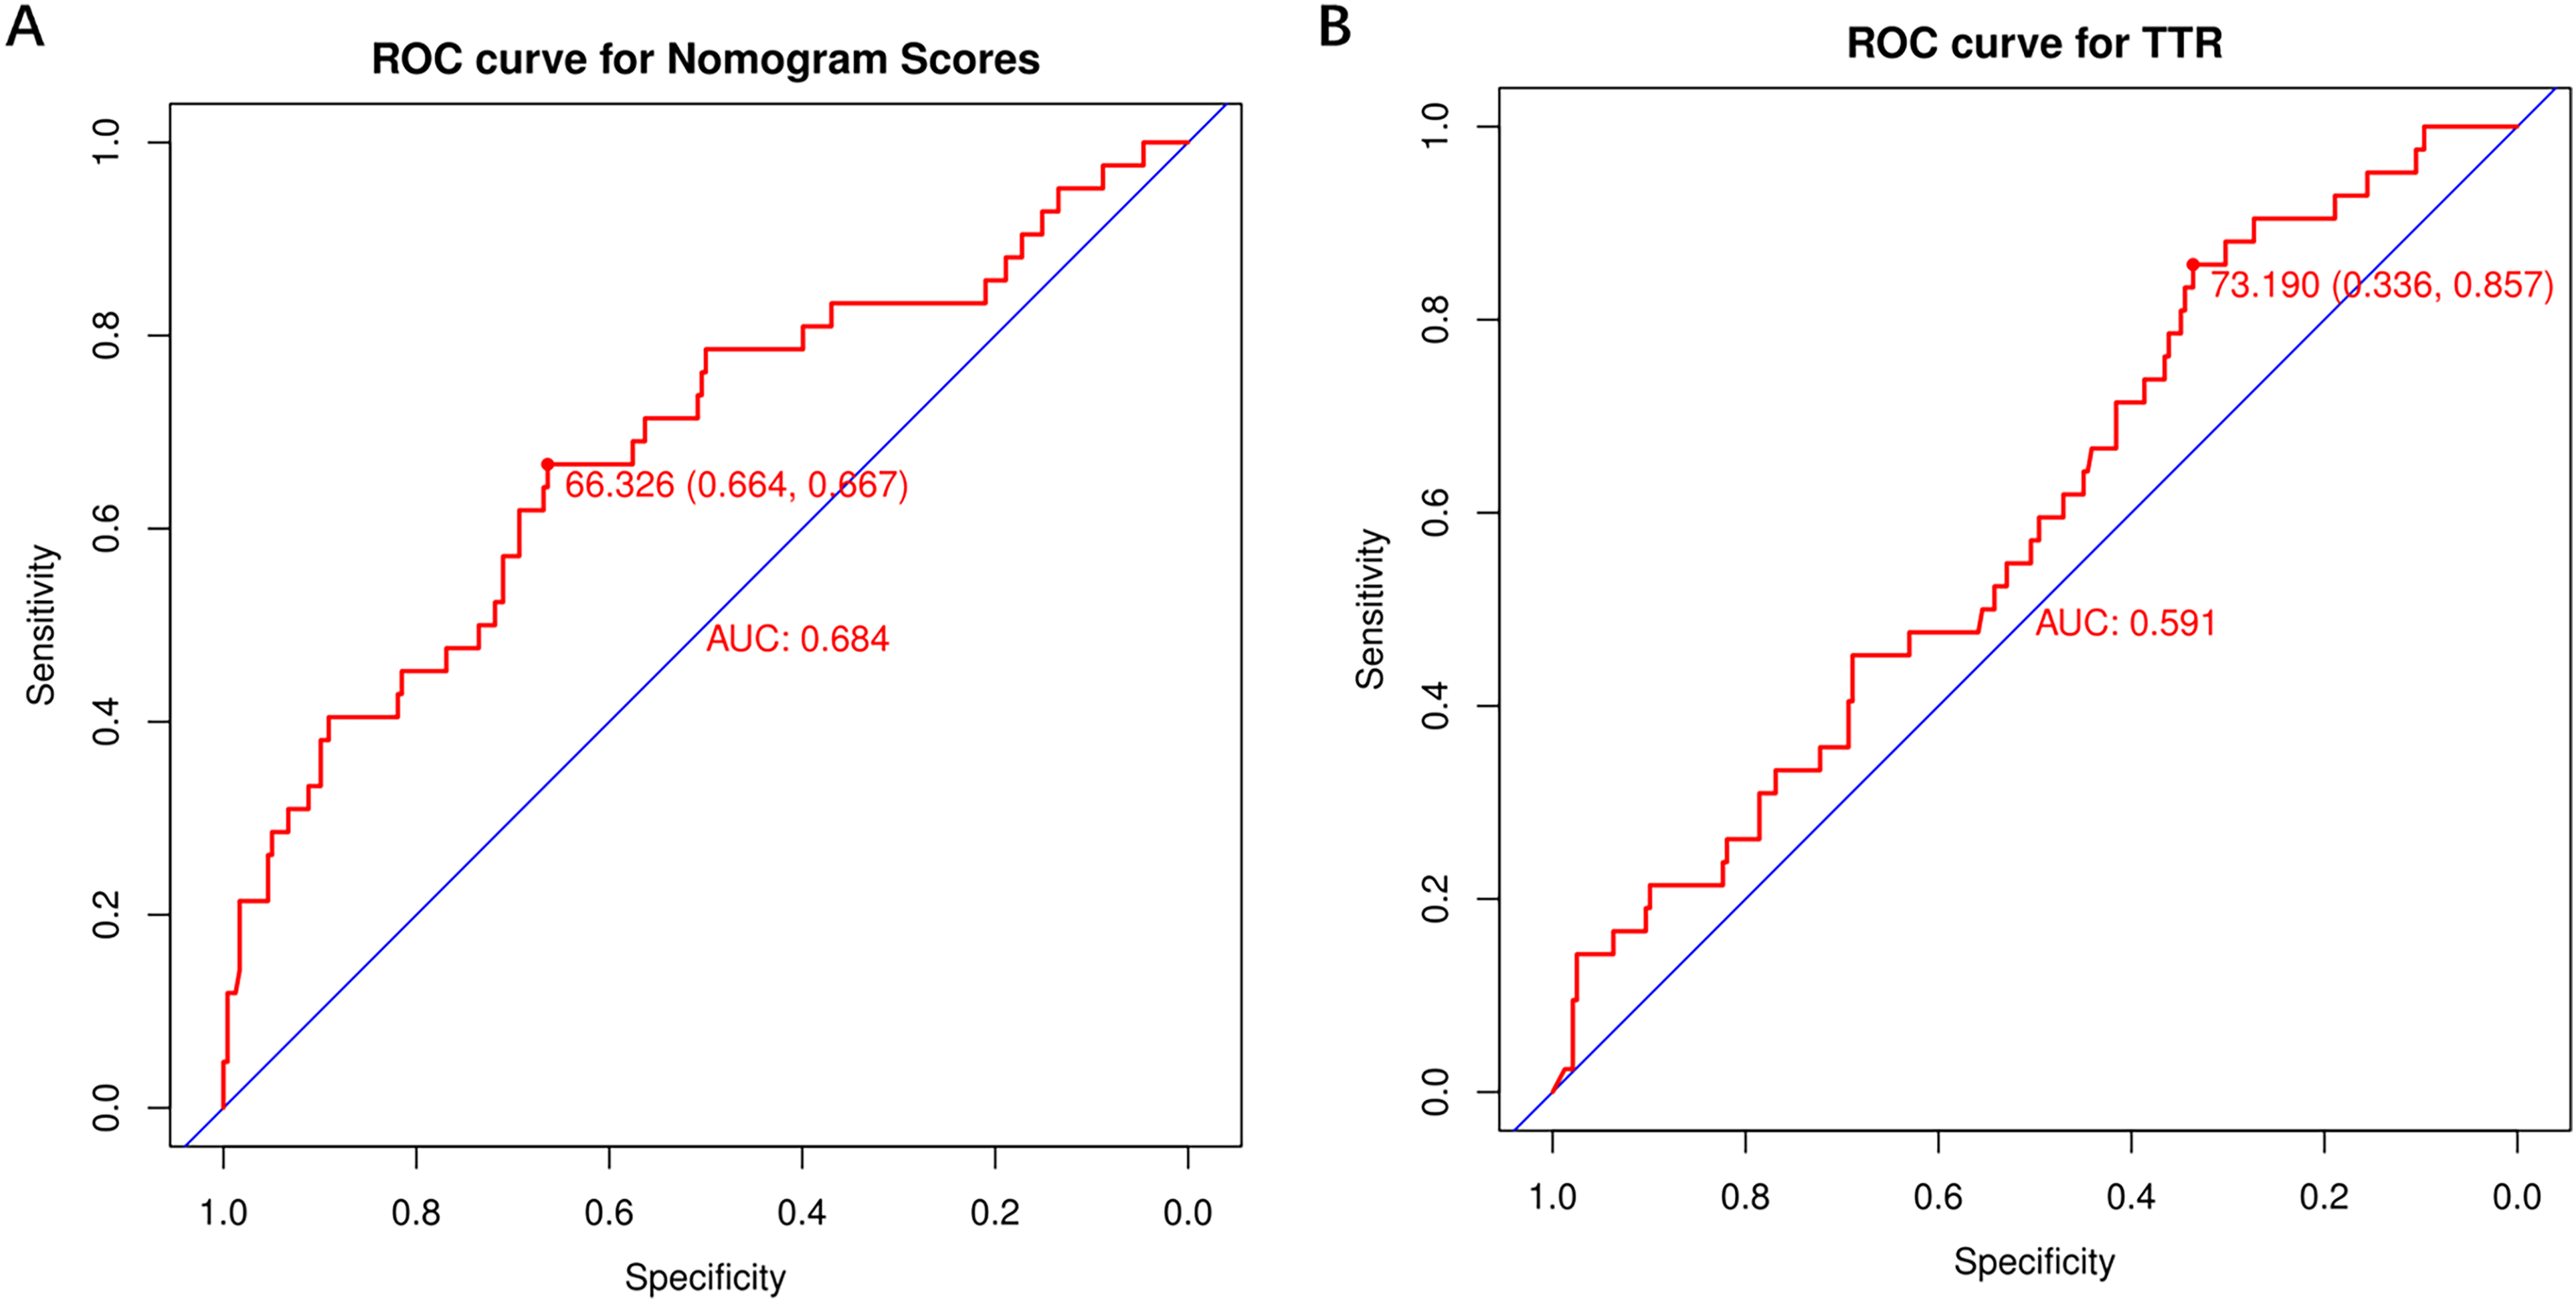
(A) ROC curve for nomogram scores; (B) ROC curve for TTR (time within therapeutic INR target range).
As shown in Figure 6B, based on the ROC curve for TTR, the cut-off value of TTR is determined as 73.19%, which is consistent with the ESC recommendations. 22 The sensitivity and specificity of the TTR were 85.7% and 33.6%, respectively.
Discussion
This study presents a novel and easy-to-use nomogram model for predicting the risk of warfarin-related major and CRNM bleeding in warfarin users. This optimal prediction model incorporates four predictors: gender, anemia, TTR, TIA, which are readily available from the outpatient electronic medical record.
Warfarin has been used as an anticoagulant for almost 70 years as the first anticoagulant to be discovered. Compared to warfarin, DOACs such as rivaroxaban and dabigatranate are increasingly used in the prevention and treatment of atrial fibrillation, thrombotic disorders, and have a lower risk of bleeding. 23 However, due to its effectiveness in anticoagulation, cheapness, and easy availability, warfarin still has a large number of users worldwide, especially in developing countries. Major and CRNM bleeding are important indicators for evaluating the safety of anticoagulants. 24 Moreover, bleeding is significantly associated with warfarin discontinuation. 25 Early identification of the risk of bleeding with warfarin and adjustment of the treatment regimen is important for the prognosis of the patients. We tested the value of nine existing bleeding scoring systems in predicting the risk of warfarin-related bleeding, and only the ORBIT model showed acceptable performance (Table 3).
A total of 280 patients on warfarin were included in this study, 42 of whom experienced major and CRNM bleeding within one year of follow-up, giving a 15% incidence of bleeding. Previous studies have shown that women are a risk group for warfarin-related bleeding.12,15 In line with this, our study showed that there is a mild but nonsignificant increase in the risk of bleeding in female patients compared to male patients taking warfarin (OR = 1.85; 95% CI: 0.91-3.94).
Anemia occurs in up to 25% of the US population, 26 and it is often asymptomatic and discovered incidentally on laboratory testing. 27 Many studies have established that anemia is an independent risk factor for the risk of warfarin-related bleeding complications.28–30 This study also confirmed that anemia was an independent risk factor for warfarin-related bleeding, with anemic patients having 2.3 times (OR = 2.30; 95% CI: 1.06-4.84) the risk of warfarin-related bleeding of non-anemic patients. Correction of anemia has been reported to improve the prognosis of patients with subarachnoid hemorrhage and lung cancer surgery.31,32 To date, there have been no studies on the relationship between the correction of anemia and the risk of warfarin-related bleeding, and we believe this is a direction worth investigating.
Several clinical trials have confirmed that prior TIA significantly increased patients the risk of warfarin-related bleeding.24,33 This study found that the risk of major and CRNM bleeding was 6.5 times (OR = 6.47; 95% CI: 1.85-22.7) higher in patients with prior TIA than in those without prior TIA.
Warfarin still presents some problems in terms of the safety of anticoagulation therapy compared to DOACs. The narrow therapeutic window for warfarin, and the obvious individual variability in its effects make regular coagulation monitoring and dose adjustments essential. 34 TTR represents the percentage of time that the INR remains within the target range of 2.0 to 3.0 across time, 21 and is one measure of quality of anticoagulation dose management. 35
Typically, a TTR value of ≥65% is considered effective warfarin therapy, 36 and the European Society of Cardiology (ESC) guidelines recommend a TTR of ≥70%, 22 based on which warfarin results in a low rate of major bleeding and thromboembolic complications. 37 The median TTR of patients in this study was 62.61% (46.62%, 76.78%), with 44.3% achieving good anticoagulation quality if TTR ≥ 65% was used as a reference, and only 36.1% achieving good anticoagulation quality if TTR ≥ 70% was used as a reference. Furthermore, using the ROC curve (Figure 6B), we identified TTR ≥73% as the best criterion to distinguish anticoagulation attainment, which is consistent with the ESC recommendations. 22
We evaluated the performance of the nomogram. The nomogram model has good predictive performance, including good discrimination, calibration, and clinical utility. The predictors in the model are also easy to obtain, which helps clinicians to quickly judge the bleeding risk of warfarin users. Compared with the existing nine warfarin-related bleeding scoring systems, the nomogram model showed significantly better discrimination in predicting the risk of warfarin-related bleeding. In addition, we calculated the nomogram score of each patient, and determined the cut-off value of the score (66.326 points) according to the ROC curve to facilitate clinicians to carry out risk stratification for warfarin users. For patients at high risk of bleeding with nomogram scores >66.3, we can take interventions such as increasing the number of follow-up visits and adjusting the dose of warfarin, which may help to reduce the risk of bleeding.
The main advantage of our research is the establishment of a nomogram model for warfarin-related bleeding, which has good discrimination, calibration, and clinical utility. Compared to the other nine predictive models, our model is based on four variables (gender, anemia, TTR, TIA) and exhibits better performance. These variables are widely used in clinical practice and are easy to obtain, making them suitable for various medical environments.
This study also has some limitations. Firstly, although the prediction model developed in this study was internally validated and performed well, it lacked external validation. Secondly, this is a secondary analysis based on previous studies, and there may be other confounding factors that have not been included. Finally, this was a retrospective and observational study, and prospective studies and large multi-center studies are needed to confirm these findings.
Conclusions
Warfarin users frequently experience warfarin-associated bleeding requiring clinical intervention, including major bleeding and CRNM bleeding. We developed a nomogram model based on four variables (gender, anemia, TTR, TIA) to predict the risk of warfarin-associated bleeding. In internal validation, the nomogram model performed well. The nomogram predictive model based on these easily accessible parameters can help clinical staff to quickly assess and risk-stratify the risk of warfarin-associated bleeding, and to take proactive interventions in high-risk patients to prevent serious bleeding.
Footnotes
Acknowledgments
We thank Dr João Antonio de Queiroz Oliveira for sharing the study data.
Author Contributions
Wensen Yao designed the study. Shaohua Yang and Wensen Yao analyzed the data and were involved in writing the manuscript.
Declaration of Conflicting Interests
The authors declared no potential conflicts of interest with respect to the research, authorship, and/or publication of this article.
Ethics Approval
The original study was approved by the Research Ethics Committee of the Federal University of Minas Gerais (ETIC 376/09).
Funding
The authors received no financial support for the research, authorship, and/or publication of this article.