
Abstract
Support with VV-ECMO requires anticoagulation with unfractionated heparin to prevent thrombotic complications. This must be monitored due to bleeding risk. A point-of-care (POC) method of testing aPTT and APR was evaluated for agreement with laboratory methods. In a prospective observational study, patients supported on VV-ECMO as a result of severe respiratory failure secondary to Covid-19 infection were given heparin as part of standard therapy. The aPTT was measured (i) at the bedside using the Hemochron Signature Elite device and (ii) at the hospital laboratory. Duplicate results were compared. Agreement between the POC and laboratory tests was poor, as assessed using the Bland-Altman method. The maximum difference between POC and laboratory methods was 133% and the minimum was 0%. Overall bias was 7.3% and limits of agreement were between −43.8% and 58.5%. Correlation increased when results were normalised to platelet count and creatinine. This POC test is insufficiently accurate for use as the primary method of heparin monitoring in patients requiring VV-ECMO for Covid-19. Platelets and renal function may influence the result of this whole blood POC test.
Introduction
Although the majority of the components of modern extra-corporeal circuits are manufactured to be as biocompatible as possible, they predispose to contact activation of the enzymatic clotting cascade, thus posing a risk for developing thrombotic complications. 1 The symptoms of an infection with SARS-coronavirus-2 (Covid-19) can include severe respiratory failure and a significant pro-thrombotic state.2,3 Covid patients requiring support with VV-ECMO due to Covid-19 face a significant risk of thrombotic complications.
To mitigate this, anticoagulation is required and is usually achieved using an infusion of unfractionated heparin, 4 which increases the risk of bleeding complications. Balancing the risks of thrombosis and of bleeding risks through reliable coagulation monitoring is, therefore, essential. 5
The activated partial thromboplastin time (aPTT) is commonly used to monitor the heparin effect in long-term anticoagulated patients. The test is prolonged in the presence of unfractionated heparin; however, values differ depending on the test method used. Many institutions standardize the aPTT by normalizing the values measured in heparinized patients against the mean of a normal range of heparin naïve patients to calculate the aPTT ratio (APR) to monitor the anticoagulant effect of heparin.6, 7, 8 The APR has been shown to have a positive correlation with a normalized activated clotting time (ACT), while there is poor agreement between ACT and aPTT for heparin concentrations required for patients supported with ECMO. 9 Using the APR allows assay comparison by correcting for differences in the reference range between instruments and reagents.
Despite a recent shift to the use of anti-Xa levels for heparin monitoring, the aPTT/APR performed in the hematology laboratory on platelet poor plasma is still considered to be the standard of care. The sample transport and pre-analytical processing, however, introduces delay. Highly infectious patients pose additional challenges in that their samples are potentially excluded from Lamson tube transport and may have to rely on porter pick up. Increasingly point-of-care (POC) tests are becoming available for use at the bedside, providing advantages such as shorter draw-to-result times, fewer preanalytical variables, and smaller blood sample volume. 10 POC tests necessarily use whole blood.
ECMO patients need their anticoagulation status assessed regularly, sometimes several times per day and each sample are typically 3.5 mL. The total volume of blood taken from patients to monitor anticoagulation over an often prolonged period of extracorporeal support can be significant. 11
Materials and Methods
This prospective observational study was conducted with the approval of the institutional review board at the Research and Development Unit at Royal Papworth Hospital (Reference S02673). The date of approval was third July 2020 and the study was deemed to be a service evaluation and as such informed consent was not required. All blood samples were taken from indwelling arterial or venous cannulae inserted as part of standard care. Heparin dosing during the study period was based on the laboratory APR. All procedures were performed in accordance with the Helsinki Declaration of 1975.
The POC aPTT was measured at the bedside using the Hemochron Junior Elite system (Werfen, Warrington, UK); the samples tested at the laboratory were centrifuged for 10 min to produce platelet poor plasma before benchtop testing on the Werfen ACL Top system with HaemosIL reagent (Werfen, Warrington, UK). The reference ranges for normal values are 23.2–38.7 s for Hemochron system and 28.2–36.6 s for the ACL Top respectively.
Obtaining the Reference Value to Calculate the APR
The APR is calculated by dividing the patient's aPTT by the mean of a reference range of aPTT test results. To allow direct comparison of results, we obtained a POC aPTT reference range of 31 heparin naïve patients with normal renal function and normal platelet count and not on antiplatelet therapy undergoing elective thoracic surgery in April and May 2021. We used this mean value as the denominator to calculate the APR for all further POC tests. This is in analogy to the method used in the hospital laboratory, where the mean value of all tests results within the reference range is used as the denominator for obtaining the APR.
Evaluating POC APR Versus Laboratory APR
As second step we compared POC and laboratory APR values from 11 patients supported by VV-ECMO for respiratory failure secondary to Covid-19 by analyzing 79 paired samples between June and August 2021.
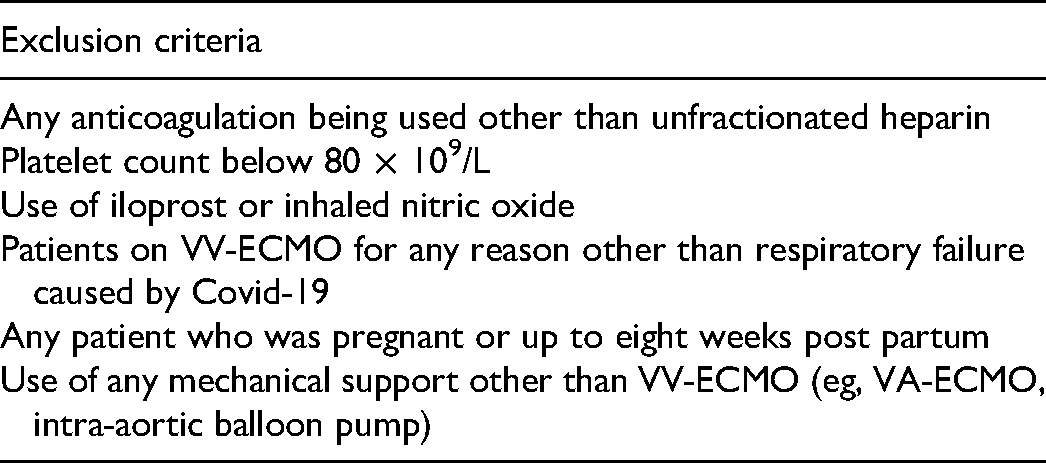
Only results with a concomitant platelet count of >80 × 109/L were included in the evaluation. The criteria we used to exclude samples are listed in Table 1. None of the patients included in the study had known pre-existing thrombophilia or disorders of coagulation.
Exclusion Criteria. Patients Belonging to any of These Groups Were Excluded from the Study.
Statistics
Due to the exploratory nature of this investigation and the lack of any previous data to inform sample size calculation we obtained guidance from the laboratory literature. 12 The paired POC and laboratory APRs were evaluated for their degree of agreement. In line with other studies investigating POC anticoagulation monitoring we decided prior to commencement of data collection that a minimum agreement of 80% (ie, a maximum difference of 20%) between laboratory APR and POC APR could be tolerated to consider the POC test reliable and safe enough for monitoring of heparin therapy in Covid-19 ECMO patients. 13
Statistical comparisons were made using Student's t tests and statistical significance was concluded when p was < 0.05. Data are expressed as mean ± standard error of the mean or mean with 95% confidence intervals as appropriate. Agreement between coagulation tests was assessed using the Bland-Altman method, 14 and differences between pairs of results were calculated by subtraction of the POC result from the laboratory result. Correlation was assessed by calculating the Spearman's coefficient.
Results
Patient demographics that the time of inclusion are shown in Table 2.
Characteristics of Patients at the Time That the First aPTT Sample was Taken.

The mean aPTT used to calculate the POC APR from the thoracic patients was significantly higher than the laboratory aPTT for the same cohort (39.98 ± 1.48 s vs 28.98 ± 0.68 s, n = 30, p < 0.0001). By converting the results to an APR, we compensated for this absolute difference in reference range.
The bias across all APR results was 7.3% with 95% limits of agreement between −43.8% to 58.5% (see Bland-Altman plots in Figure 1). However, for individual results, there was little agreement regarding whether the POC result was greater or less than the laboratory result. When all the differences between paired APR results were converted to absolute values, the mean difference was 19.0% (−18.7% to 56.7%). The maximum absolute difference between laboratory and POC APR results was 133.3% and the minimum was zero. There were 30 pairs of tests (38% of the total) where the difference between the APR results was 20% or greater.

Bland-Altman plots showing mean of each POC and laboratory aPTT or APR result against the percentage difference between them. The solid green line represents bias (mean difference) of all pairs of results and purple dotted lines are 95% limits of agreement. The grey area indicates the pre-decided limit of acceptable disagreement between the tests. A and B show mean aPTT and APR respectively, plotted against the difference (laboratory - POC result). C shows the same data as B, but with all differences converted to positive values.
There were three pairs (3.8%) of outlying results that fell outside two standard deviations from the bias. If these data points are excluded the absolute mean difference is reduced to 16.1% (−5.7% to 37.9%). The maximum difference after the removal of these outliers was 38.7% and 27 pairs of tests (35% of the total) had results that differed by 20% or greater.
There was some funneling in the shape of the Bland-Altman plot, indicating that the difference between test results increased as the mean increased. When the mean APR was 2 or less, the mean difference was 17.2% (12.5% to 21.8%); when the mean APR was over 2, the mean difference was 25.7% (14.5% to 36.8%). However, this increase in mean difference was not statistically significant and will have been influenced by the outliers.
Agreement was also assessed between the uncorrected aPTT values produced by the two test methods. Here, the bias was −27.8% with 95% limits of agreement between −98.4% and 42.7%. Subtraction of this bias from each individual POC aPTT result did not lead to an improved agreement with the laboratory (bias changed to −6.3% with 95% limits of agreement between −74.4% and 61.8%).
Spearman's correlation coefficient between the POC and laboratory aPTT test results was 0.5808. When the POC APR results were normalized to the patient's platelet count and the creatinine result on the day of each measurement the Spearman's coefficients rose to 0.8479 and 0.8793, respectively. There were no significant changes in the Bland-Altman plots. Correlations are shown in Figure 2.
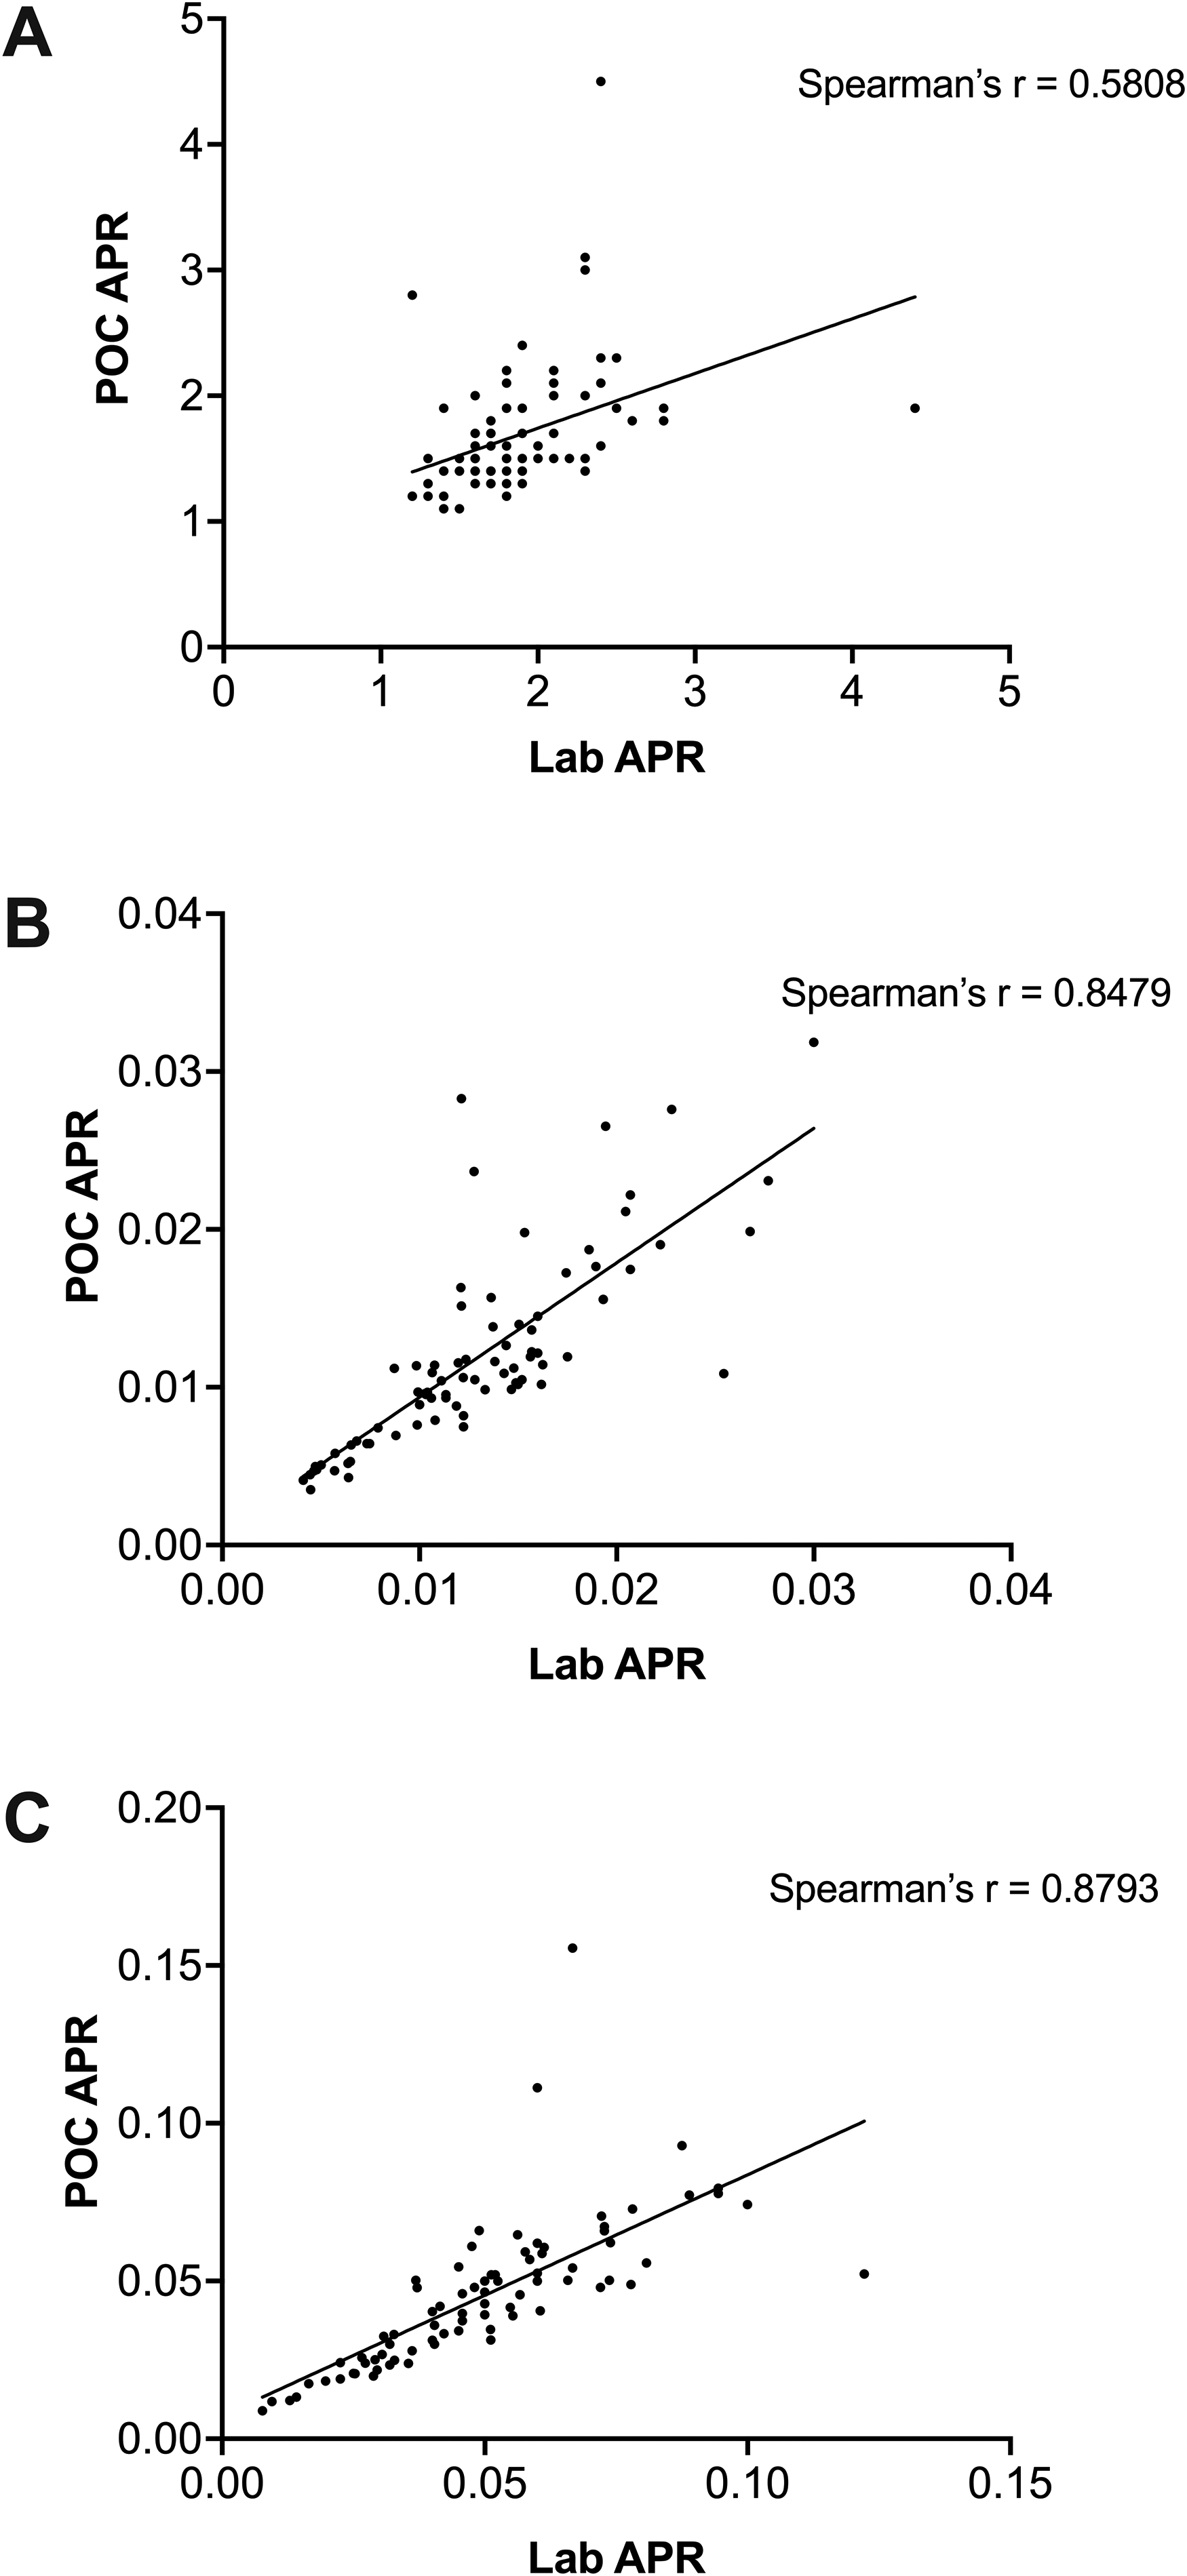
Correlations between POC and laboratory APR test results. The correlation between the uncorrected APR results is shown in A. These data are normalised to platelet count in B and to creatinine in C.
Discussion
In the study, the Hemochron POC APR coagulation results agreed insufficiently with the laboratory result to be considered safe to use as the primary or sole method of monitoring heparin therapy in Covid-19 patient requiring VV-ECMO support. A large proportion of POC results disagreed with the laboratory results by more than 20%.
Agreement between POC and Laboratory Results
To our knowledge, this is the first study to assess point-of-care coagulation monitoring in patients supported on VV-ECMO due to Covid-19-induced respiratory failure. Overall, our findings are similar to other studies comparing POC coagulation tests with laboratory results in other contexts. Ferring et al 15 concluded that the CoaguCheck® Pro (Roche, Basel, Switzerland) device was not sufficiently accurate to be used clinically when monitoring the aPTT in post-cardiovascular or abdominal surgery patients in ICU. However, in contrast to the present study, where a difference in aPTT results was observed in relatively healthy, heparin naïve patients prior to thoracic surgery as well as in the unwell VV-ECMO patients, Ferring et al concluded that the CoaguCheck® Pro was more accurate for healthy controls than for the post-surgical patients. Karigowda et al 10 used the Hemochron Junior Signature Plus in ICU patients to monitor heparin therapy using aPTT and found good correlation but poor agreement between the laboratory and POC method, with a bias of up to 24%. Similarly, Douglas et al 16 used the Hemochron Response to try to monitor heparin therapy. The cohort of patients in that study was undefined, but the POC aPTT result had a bias of 15.2 s and the authors concluded that the device was not sufficiently accurate to be used routinely in the place of standard laboratory testing. Douglas et al also tried correcting the POC aPTT by subtracting the bias from each result, but the consequence of this was an increase in the number of POC results that would have led to different management decisions regarding the heparin infusion rate when compared to that of the laboratory result (49% vs 64%). While the present study did not look at the effect of the POC results on heparin infusion management, the correction of our aPTT results for the bias did not result in improved agreement between the aPTT measurement methods. In a very recent study Lardinois et al 17 compared the CoaguCheck® with a laboratory measured aPTT and anti-Xa activity in a diverse group of 35 intensive care patients requiring continuous high- or low-range heparin infusions. These authors found the inter-method agreement between POC aPTT and laboratory aPTT to be 0.27 and between POC aPTT and anti-Xa to be 0.3. Their conclusion is also that the results of the POC aPTT were poorly consistent with lab aPTT or anti-Xa and the test should not be used with the aPTT nomograms currently in use.
In the absence of heparin, Gauss et al 13 used the Hemochron Signature Elite in the context of acute hemorrhage, to compare both POC aPTT and prothrombin time (PT) to corresponding laboratory tests. Their definition of an acceptable agreement was no more than 5% of POC tests results differing more than from 20% of the laboratory result. The authors found that 27% of POC PT results and 89% of aPTT results fell outside this range. This disagreement is considerably higher than that found in the present study (38% of POC tests differed from the laboratory result by more than 20%), and it is likely that this is due to the different contexts of the studies. Hemorrhage is associated with rapid changes in hematocrit, platelet count, and other factors including fluid therapy and transfusion, which are likely to be less pronounced in relatively stable ICU patients supported with VV-ECMO.
In a study using blood from ICU patients suffering from Ebolavirus infection, Kok et al 18 evaluated several POC devices, including the Hemochron Signature Elite for PT and aPTT measurement in patients who were not anticoagulated with heparin. They set a limit of ± 10% difference between POC and laboratory results and found acceptable agreement for several biochemical analyses and some hematology results, but not for PT and aPTT. Possible reasons for the lack of accuracy of the coagulation results were not ascertained.
We were only able to identify two studies that were able to demonstrate a satisfactory agreement between POC and laboratory monitoring of aPTT, and both were in the context of heparinization for surgery as opposed to longer-term anticoagulation in ICU: Fitch et al 19 used the Hemochron Junior to monitor heparin therapy in patients who required different levels of anticoagulation during cardiac or vascular surgery. They monitored heparin-induced anticoagulation using the aPTT and compared the POC and laboratory results in a combined analysis. The bias was 5.5 s with 95% confidence intervals of 2.3 to 8.7 s. Similarly, Chavez et al 20 used the CoaguChek® Pro DM to monitor the aPTT in patients heparinized for cardiopulmonary bypass during elective cardiac surgery. They concluded that the device was sufficiently accurate based on correlation and regression analysis, but no Bland-Altman analysis was performed.
A possible explanation regarding the poor agreement between the POC and laboratory results lies in the methods used to measure aPTT. While the former is performed on whole blood, the latter uses plasma depleted of red and white cells and platelets. This processing of blood before aPTT measurement may remove some of the individual variation and influences, particularly those related to platelet count, and may therefore account for some of the difference in results. It is also well-recognized that different activators of coagulation produce different results.21,22 The POC system used in the present study uses kaolin and phospholipids to activate clotting in the whole blood sample, 23 whereas the Werfen ACL Top system uses a buffered synthetic phospholipid reagent containing a colloidal silica activator. These test substrate and analytical differences may account for some of the lack of agreement between results.
Correlation Between POC and Laboratory Result and Effect of Platelets and Creatinine
The possible effect of platelets on APR results was pre-empted and we attempted to reduce some of the potential variation caused by platelets by excluding those patients whose counts were lower than 80 × 109/L. Nevertheless, when APR results were normalized to platelet count, the correlation between the POC and laboratory groups increased from 0.5808 to 0.8479, suggesting an effect of platelets was indeed still present. However, this improvement in correlation was not accompanied by a significant change in agreement as assessed by Bland-Altman.
Renal dysfunction induces platelet dysfunction and is likely to affect a whole blood coagulation test but not a plasma-based aPTT. To correct for any effect of impaired renal function on platelets or coagulation, the test results were normalized to creatinine. This also resulted in an increase in the correlation coefficient between the two groups, but again failed to have an effect on agreement.
Difference in APTT Measurements
The difference we found between the two test methods was unlikely to be related to the demographics of the patients tested, as the group was adequately homogenous. Moreover, the difference between POC and laboratory aPTT was also observed in the thoracic patients. Additionally, the disagreement in APR between the two test methods does not appear to be caused by an erroneous mean value for the aPTT values within reference range, as the agreement between the aPTT results themselves was poor.
The increased aPTT value observed with the POC test has been seen in some,13,15,16 but not in other 10 previous studies. Ferring et al found the CoaguCheck® Pro gave results that were higher than those from the laboratory, and that this difference increased as the mean aPTT increased, leading to the overall conclusion that the device was not accurate enough for clinical use. This effect was also seen to a limited extent in the present study, with some evidence of a larger bias when the mean result was higher. This is echoed by Karigowda et al, who demonstrated a 4% increase in bias for every 10 s increase in aPTT.
Limitations
The study has a number of limitations: This is a single-center study, using a limited cohort of patients supported in a specialized manner, which may lead to selection bias. However, the results are locally applicable and important for our ICU management of anticoagulation in VV-ECMO patients, particularly those suffering from Covid-19.
We took several paired APR measurements from the same patients over a period of time. Repeated measurement analysis using the Bland-Altman method has been described,24,25 but depends on the true value for the variable of interest remaining constant between repeated measurements. 24 This may be the case when performing repeated measurements over a short period of time (for example during a single surgical procedure) but is not likely to be the case over several weeks of heparin treatment in patients supported with VV-ECMO, especially since the APR target is a range and not a single value. Furthermore, in order to keep the patient cohort relatively homogenous, only patients on VV-ECMO due to Covid-19 were included and the number of subjects was therefore limited to the number of patients who required this support during the study period. Repeated measurements from the same patients were therefore required to increase the number of pairs of results.
While the agreement between the two methods of measuring APR was evaluated, the possibility that one method was superior to the other was not investigated. The laboratory aPTT / APR is considered the standard of care.
Conclusions
POC APR monitoring with the Hemochron Junior Elite does not sufficiently agree with laboratory results to be considered safe or accurate enough for clinical use in Covid-19 patients supported by VV-ECMO on our ICU.
Author Contributions
D.A. collected data from electronic patient record, performed Bland-Altman, correlation and other analyses and wrote first draft of manuscript; B.G., N.M. and H.A. collected blood samples and APR / aPTT measurements from thoracic patients in order to determine control aPTT values; M.B. oversaw laboratory processing of blood samples; M.B. and F.F. were responsible for the study conception and methodology; all authors contributed to manuscript editing.
Footnotes
Acknowledgements
The authors would like to acknowledge and thank the ECMO specialists and other nursing staff on the intensive care unit at Royal Papworth Hospital for their contribution to this study at a time when pressure on the service was unprecedented.
Declaration of Conflicting Interests
Dr Besser received educational grants from Novartis, GBT and Amgen and speaker honoraria from Novartis and Sanofi. He has participated in advisory boards by Agios, GBT and Novartis.
Dr Falter has received speaker honoraria from Abbott Point of Care and has participated in advisory boards by Abbott Point of Care, Abbott Diabetes and Werfen.
For the remaining authors, no competing interests declared. Werfen kindly provided the aPTT cartridges used for this study free of charge.
Funding
The author(s) received no financial support for the research, authorship, and/or publication of this article