
Abstract
Heparin-induced thrombocytopenia (HIT) is associated with antibodies to complexes between heparin and platelet factor 4 (PF4), a basic protein usually found in platelet alpha granules. Heparin-induced thrombocytopenia antibodies preferentially recognize macromolecular complexes formed between positively charged PF4 and polyanionic heparins over a narrow range of molar ratios. The aim of this work was to study the complexes that human PF4 forms with heparins from various species, such as porcine, bovine, and ovine; heparins from various organs, such as mucosa and lung; and different low-molecular-weight heparins (LMWHs) at several stoichiometric ratios to evaluate their sizes and charges by photo correlation spectroscopy and zeta potential measurements. The resulting data of the PF4 complexes with unfractionated heparins (UFHs), LMWHs and their fractions, and oligosaccharide components suggest that the size of aggregates is not only a simple function of average molecular weight but also of the molecular weight distribution of the sample. Moreover, it was found that lower concentrations of the tested ovine-derived mucosal heparin are required to form the large PF4/heparin complexes as compared to mucosal porcine and bovine heparin.
Keywords
Introduction
Heparin therapy is often complicated by 2 types of thrombocytopenia—a relatively common nonimmune, clinically harmless heparin-induced thrombocytopenia (HIT) type I and a rare immune-mediated, serious HIT-type II. The first type, caused by direct interaction of heparin with the platelet membrane resulting in enhanced platelet aggregation, occurs in approximately 10% of patients treated with heparins, usually within the first few days of treatment. 1
Heparin-induced thrombocytopenia type II, typically occurring 10 to 14 days following the initiation of heparin therapy in about 5% of treated patients, is an adverse immunological effect. 1 In HIT type II, there is formation of antigenic platelet factor 4 (PF4)–heparin complexes that induce the binding of immunoglobulin G (IgG) antibodies to form immune complexes (ICs). The IC binding to FcyRIIa receptors on the platelet membrane activates platelets leading to a greater release of PF4, platelet consumption, and the first HIT-type symptoms. The excess of PF4 binds glycosaminoglycan (GAG) on endothelial cell membrane to form new PF4 antigens and antibodies causing vascular endothelial injury, such as thrombi formation and disseminated intravascular coagulation. 2
The PF4 exists mainly as a tetramer at physiological ionic strength and pH values, 3–4 and it can complex with heparin through nonspecific electrostatic interactions governed by principles of colloidal chemistry. This affinity for heparin appears to depend on the ratio of PF4 tetramers to polysaccharide. 5–6
Models proposed from X-ray crystallographic 5 and Nuclear Magnetic Resonance (NMR) studies 4 support the hypothesis that heparin may wrap around the tetramer, binding to a ring of positive charges running perpendicular to the lysine-containing α-helices. The antigenicity of the complex depends on the concentration, polydispersion (Pd), sulfation degree (DS), chemical composition, structure of the GAG, and structural and conformational changes of PF4 as suggested by NMR 7 and circular dichroism spectroscopic 8 studies.
Both HIT types occur more frequently with unfractionated heparin (UFHs) than with low-molecular-weight heparins (LMWHs) 9,10 or with the synthetic pentasaccharide, fondaparinux, which does not form antigens with PF4 recognized by HIT antibodies. 11 UFH and LMWHs produce the same type of PF4 complexes but a different clinical frequency of HIT mainly due to the different sizes and amount of complexes formed. Greinacher et al 12 presented a model for the interaction of LMWH, UFH, and fondaparinux with PF4 taking into account the different plasma concentrations of the GAG anticoagulants. They conclude that smaller PF4/LMWH/IgG complexes cross-link fewer of the platelet FcγRIIa receptors, thereby activating platelets to a lesser degree than the larger PF4/UFH/IgG complexes. This is a likely reason for the reduced breakthrough of HIT-related thrombocytopenia and thrombosis with LMWH treatment among immunized patients.
The size of the PF4/heparin complex is important for the pathogenesis of HIT, 12 and the size distribution had been investigated by size exclusion chromatography (SEC) 13 using the radiolabeled protein. Using high-performance liquid chromatography-SEC (HPLC-SEC), it has been shown that the formation of ultralarge complexes (ULCs) and small-size complexes (SC) of UFH and PF4 occurs over a narrow ratio of molar concentrations, and that their relative proportion depends on the amount of heparin present in the solution. In fact, the ULCs were found predominantly for PF4/heparin ratios greater than 1, whereas the SCs are more abundant at ratios lower than 1.
In order to overcome the need to radiolabel PF4 and the low sensitivity of HPLC-SEC, the same authors published another study 14 examining the macromolecular complexes formed at distinct protein/heparin ratios using photon correlation spectroscopy (PCS), a very sensitive technique usually used to analyze the size of particles in solution. In particular, they observed a progressive increase followed by a decrease of PF4 particle size that was a function of the PF4-heparin concentration ratio (PHR).
Due to the importance of size, surface charge, and stoichiometry to the formation of PF4/heparin complexes, the present work focuses on the investigation of these parameters using PCS and zeta potential (Zp) techniques. In particular, the surface charge of PF4/heparin complexes was determined by Zp, and PCS was used to determine the change in particle size as a function of the PF4/heparin ratio. Considering the intra species and interspecies heparin heterogeneity, we investigated the molecular weight dependence of the heparin–PF4 interaction using UFH samples from different sources (porcine, ovine, and bovine), LMWHs (tinzaparin, dalteparin, and enoxaparin) and their fractions, and oligosaccharides such as fondaparinux.
Materials and Methods
The PF4, from human platelets (hPF4), was purchased from ChromaTec, Greifswald, Germany (freeze-dried in Hanks’ balanced salt solution [HBSS]). The unfractionated porcine heparin samples were supplied by Medefil (Glendale Heights, Illinois), Bioiberica (Barcelona, Spain), and Hepalink Pharmaceutical Co (Shenzhen, China); LMWH preparations used in this study included enoxaparin, supplied by Sanofi Aventis Pharmaceutical Products, Bridgewater, New Jersey, as injectable Lovenox; tinzaparin, supplied by LEO-Pharma (Ballerup, Denmark) as a powder; and dalteparin, supplied by Pharmacia AB (Uppsala, Sweden) as injectable Fragmin. Bovine mucosal heparin was a laboratory preparation provided by Bioiberica. Ovine heparin was provided by Kin Master, Brazil. The synthetic pentasaccharide Arixtra (fondaparinux) was from Glaxo SmithKline (Verona, Italy).
To determine the anti-Xa and anti-IIa activities, blood bank plasma was thawed and various heparins were supplemented into the plasma at concentrations from 10 to 0.625 μg/mL. Two assays, anti-Xa and anti-IIa, were performed on the ACL Elite instrument (Lexington, MA) using a standardized coagulation method.
Four heparin fractions were obtained by size fractionation on a Sephadex G50 (Sigma Aldrich; St. Lois, MO) column (25 cm × 100 cm), using 0.3 M NaCl with 0.2% NaN3 as eluent. The flow rate was 2000 mL/h. Dalteparin fractions were obtained by SEC on a Bio-gel P6 column (Bio-Rad; 5 cm × 95 cm for 2 columns in series; Hercules, CA). The flow rate of 0.25 M NH4Cl elution buffer was 1.8 mL/min. For UFH and dalteparin fractions, the elution profile was determined by evaluating the absorbance of each fraction at 210 nm. Desalting on a TSK (5 cm × 85 cm), a methacrylic polymer resin (Tosoh; Portland, OR) was performed with 10% ethanol as the eluent; a flow rate of 4.8 mL/min was maintained with a peristaltic pump. The elution profile was determined by evaluating the absorbance at 210 nm of each fraction. 15
Sample Test of PF4/heparin Solutions
Each sample of freeze-dried hPF4 in HBSS was dissolved in deionized water to obtain a protein concentration of 1 mg/mL. In order to measure the Zp of hPF4/heparin complexes, the solution obtained by mixing 40 μL hPF4 (1 mg/mL in HBSS) with a suitable volume of water and heparin solutions was transferred to a disposable folded capillary cell (Malvern, Worcestershire, United Kingdom) at room temperature and analyzed 10 minutes post-mixing.
To analyze hPF4/heparin complex size, the solution obtained by mixing 40 μL hPF4 (1 mg/mL in HBSS) with suitable volume of HBSS and heparin solutions was transferred to a disposable folded capillary cell at room temperature and analyzed 60 minutes post-mixing.
The molar ratios between protein and heparin concentration (PHR) were determined considering the average molecular weight value (Mw) of each heparin sample, measured by high performance–size exclusion chromatography with triple detector (HP-SEC-TDA) 16 and the molecular weight of the hPF4 tetramer (31.2 kDa). 12
Photon Correlation Spectroscopy and Zp
The PCS and Zp of PF4/heparin complexes were measured using the Zetasizer Nano ZS (Malvern, Worcestershire, United Kingdom) with a fixed 173° scattering angle and a 633-nm helium–neon laser. Data were analyzed using Zetasizer software version 7.11 (Malvern, Worcestershire, United Kingdom).
For Zp experiments, the statistical evaluation was carried out using Origin software where the Zp data were fitted versus the logarithm of PHR with a sigmoidal equation that allows for the determination of the PHR at which Zp = 0 mV, the neutral state of the complex.
Results
Photon Correlation Spectroscopy
In the first part of the study, the influence of PF4 concentration on the size of complexes between PF4 and heparins at different molar ratios of reactants was assessed. For this, an LMWH was chosen to test the method in a more critical condition where smaller aggregates are formed. The PF4 was dissolved at 3 different concentrations (20 μg/mL, 50 μg/mL, and 100 μg/mL) in HBSS buffer solution, and solutions at different concentrations of enoxaparin were added, obtaining different PHRs. The Z-average values, obtained fitting with a single exponential the correlation function, and the size distributions, obtained fitting with the multiple exponential function, of the complexes are shown in Table 1. Confirming the literature data, 14 we observed a bell-shaped relationship between PHR and Z-average that was lost at the highest PF4 concentration. Such a relationship made it difficult to identify the PHR for which the larger Z-average value is obtained. Moreover, the data quality is poor and the polydispersity of complexes is too high for distribution analysis when using the highest PF4 concentration. At the lowest concentration of PF4, the difference among the observed Z-average values is less significant than at 50 μg/mL. For these reasons, the subsequent experiments were done using a PF4 concentration of 50 μg/mL.
Z-Average (nm) and Size Distribution (nm) of Solutions Containing Different Concentrations of PF4 (20 μg/mL; 0.64 μM; 50 μg/mL; 1.60 μM; 100 μg/mL; 3.2 μM) and Enoxaparin.
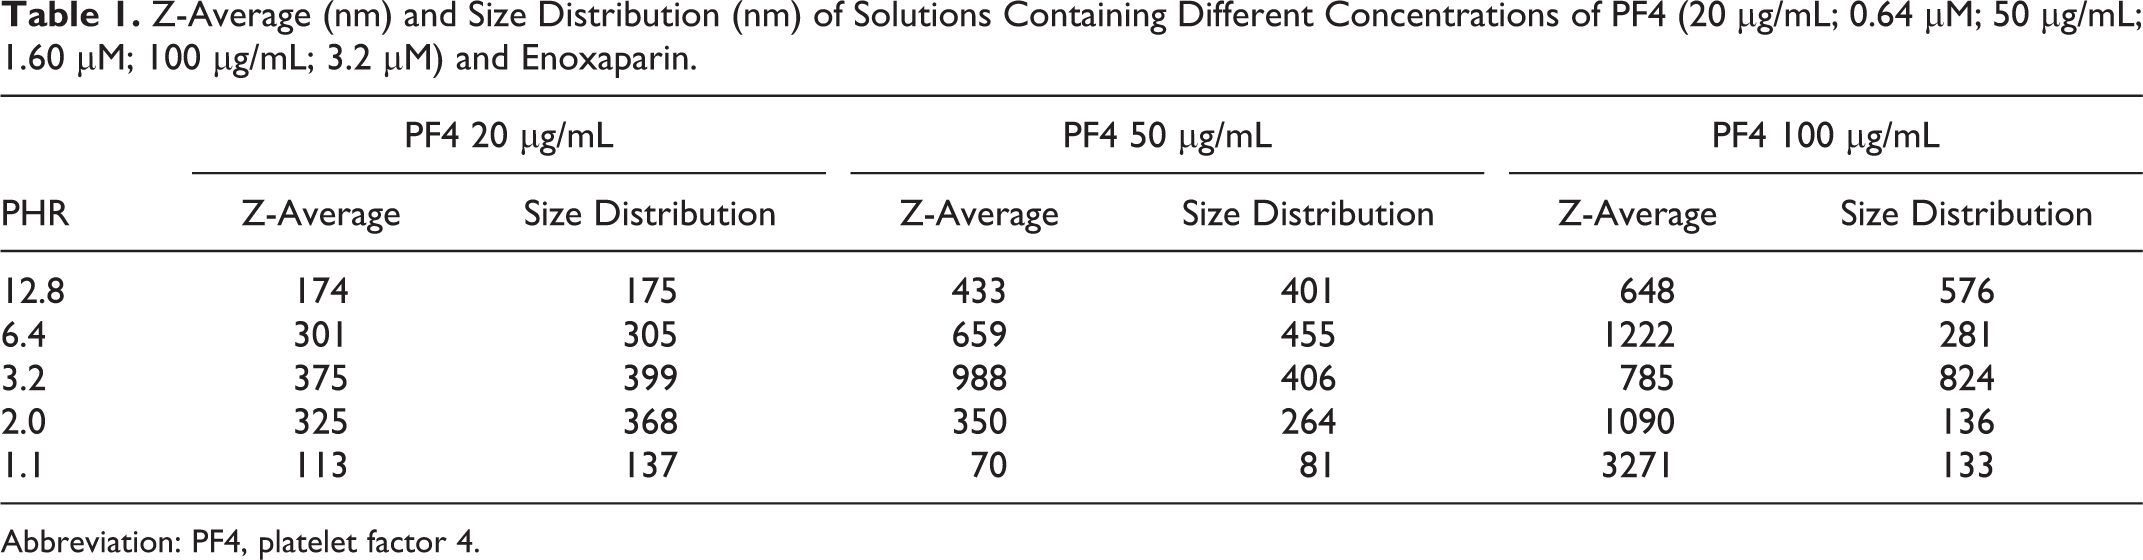
Abbreviation: PF4, platelet factor 4.
High-molecular-weight heparin samples
Heparin is a polydisperse polysaccharide whose sulfation pattern, average chain length, and molecular weight distribution were found to vary, not only with respect to the source material, organ, and species but also to manufacturing process. In order to study how such variability can affect the aggregation of hPF4, 3 commercial porcine heparin samples coming from different manufacturers and 3 heparin laboratory samples derived from different species and organs were studied. The physicochemical characteristics of these heparins are shown in Table 2.
Physicochemical Properties of Porcine Heparin Samples and Heparin Samples From Different Species and Sources.a
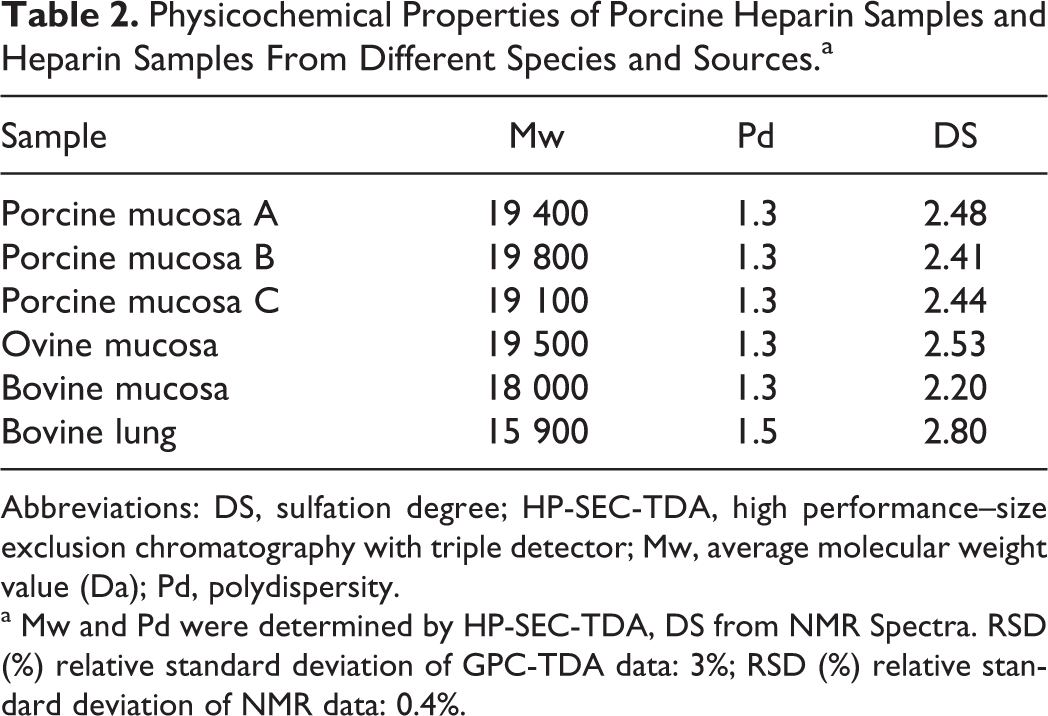
Abbreviations: DS, sulfation degree; HP-SEC-TDA, high performance–size exclusion chromatography with triple detector; Mw, average molecular weight value (Da); Pd, polydispersity.
a Mw and Pd were determined by HP-SEC-TDA, DS from NMR Spectra. RSD (%) relative standard deviation of GPC-TDA data: 3%; RSD (%) relative standard deviation of NMR data: 0.4%.
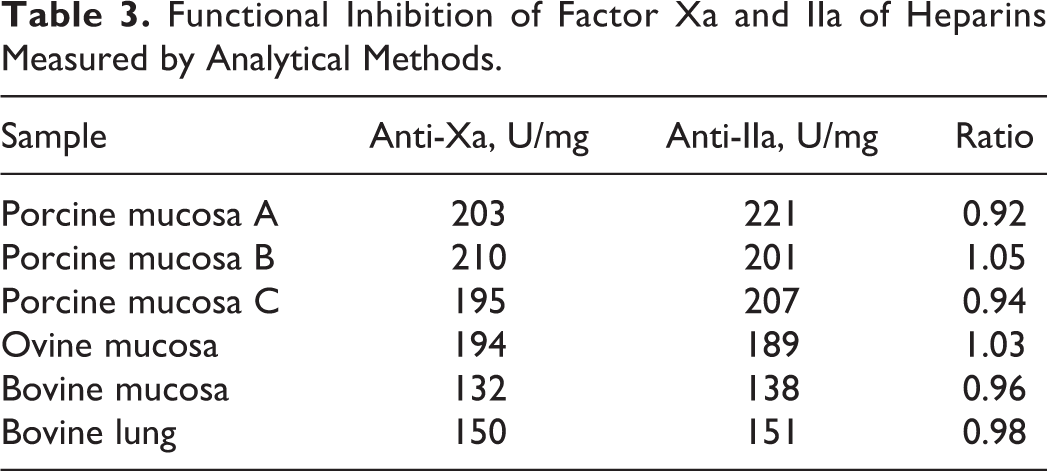
The biological effects of various heparins were measured in terms of the anti-Xa and anti-IIa activities after supplementation in blood bank plasma. The results are shown in Table 3. The anti-Xa activities ranged from 132 to 210 U/mg. The anti-IIa activities ranged from 138 to 221 U/mg. The bovine samples showed relatively lower anti-Xa and anti-IIa activities.
Functional Inhibition of Factor Xa and IIa of Heparins Measured by Analytical Methods.
The method repeatability was first evaluated by analyzing 4 independent solutions of the same porcine heparin sample. In particular, the sizes of PF4/heparin complexes at 3 different PHRs were measured (Table 4). The obtained “bell-shaped” curves have a maximum at the same PHR value, confirming that this could be considered the most important parameter for comparing different heparin samples. It is important to highlight that the variability of the Z-average measurements is good and allows for an assessment of differences in the size of aggregates at different PHRs.
Z-Average (nm) Values of Solutions Containing PF4 and Porcine Heparin B Sample.
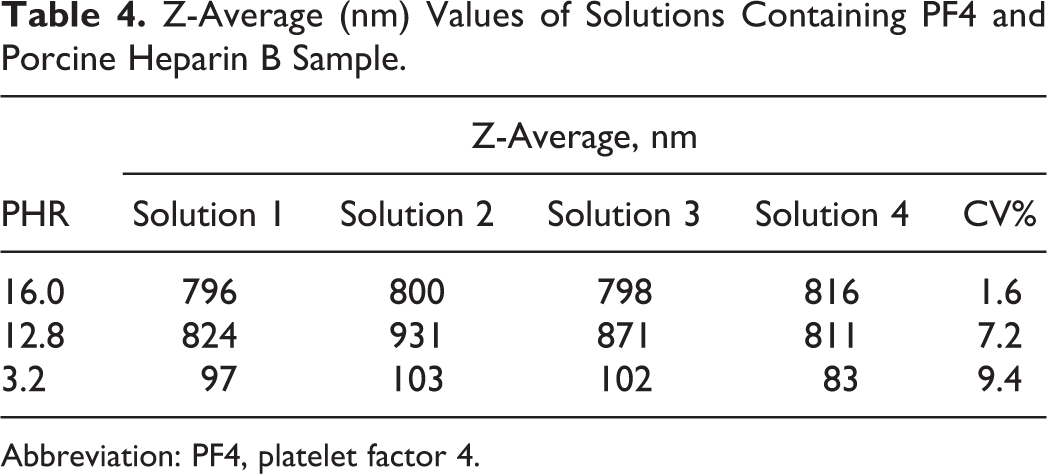
Abbreviation: PF4, platelet factor 4.
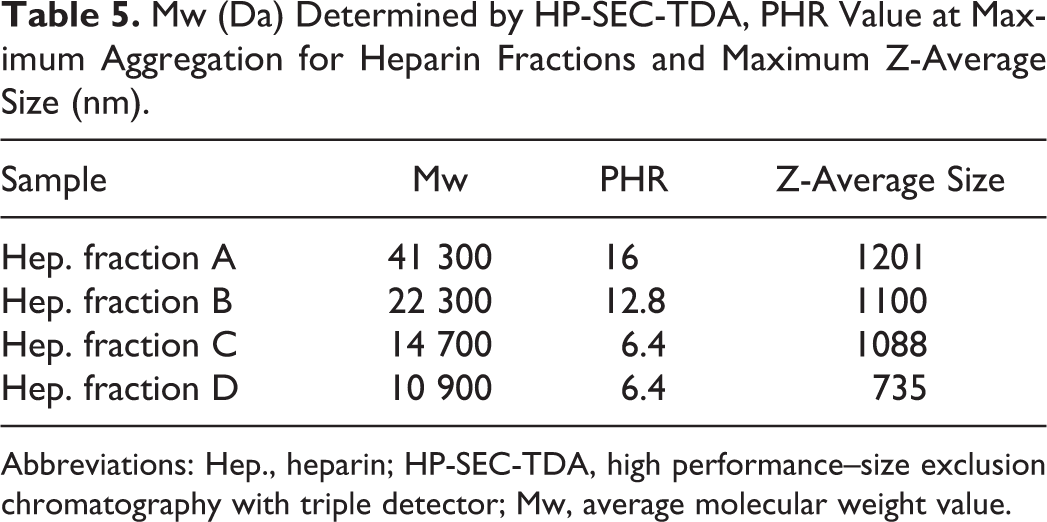
The influence of heparin’s molecular weight on the PF4/heparin interaction was also evaluated using heparin fractions with different molecular weights obtained by SEC. These fractions produced different complexes, and therefore, different values of size expressed as Z-average value (nm). The plot of PF4/heparin molar ratio versus size (Z-average; Figure 1 and Table 5) presents a bell-shaped profile with the PHR at which there is maximum aggregation corresponding to the highest Z-average radius.
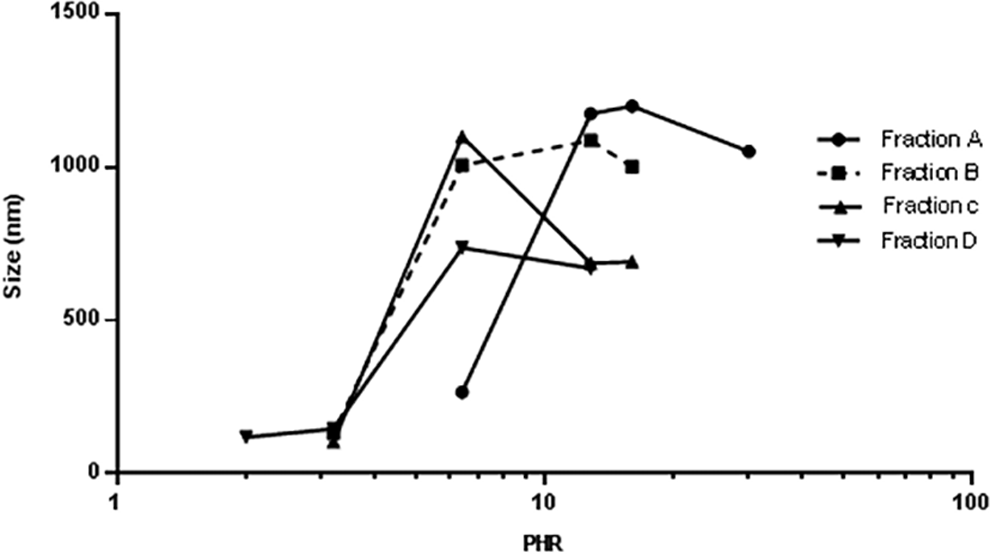
Z-average (nm) vs log PHR for different porcine heparin samples complexing with PF4.
Mw (Da) Determined by HP-SEC-TDA, PHR Value at Maximum Aggregation for Heparin Fractions and Maximum Z-Average Size (nm).
Abbreviations: Hep., heparin; HP-SEC-TDA, high performance–size exclusion chromatography with triple detector; Mw, average molecular weight value.
Different values of PHR at maximum size were obtained with heparins of varying average molecular weight. In particular, PHR and Z-average size decrease with molecular weight, indicating that higher concentrations of lower molecular weight oligosaccharides are needed to reach the maximum of aggregation. For fraction D, the size of the aggregates is lower without a decrease in PHR.
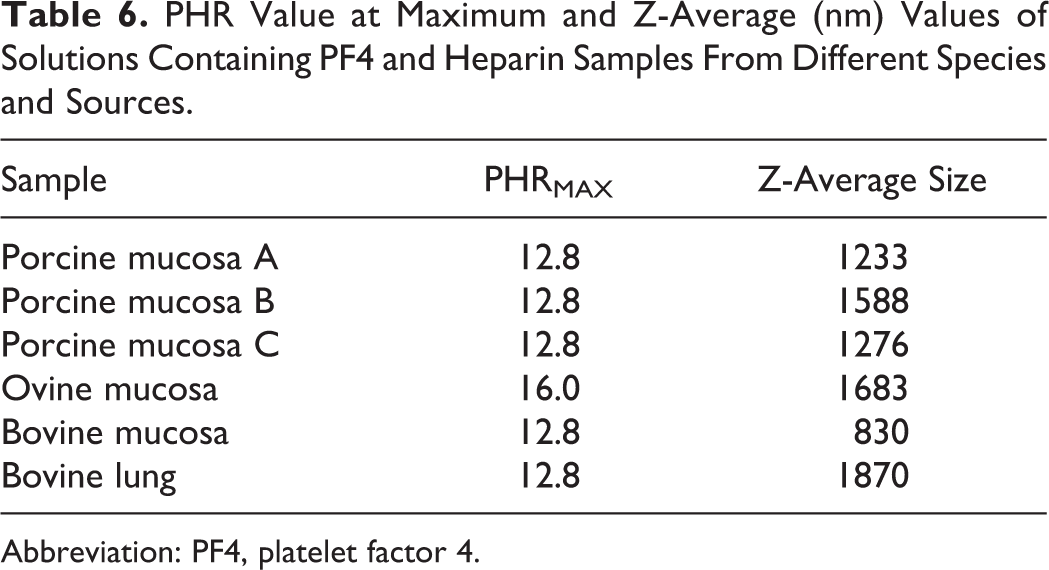
The same experimental approach was applied to the 3 commercial porcine mucosal heparins and to experimental preparations of heparins isolated from ovine and bovine tissues. These samples exhibit different degrees of sulfation and average molecular weights (Table 2). The Z-average size values obtained at different PHRs are shown in Figures 2 and 3. The PHR at which the biggest complexes formed and their corresponding Z-average values are shown in Table 6.
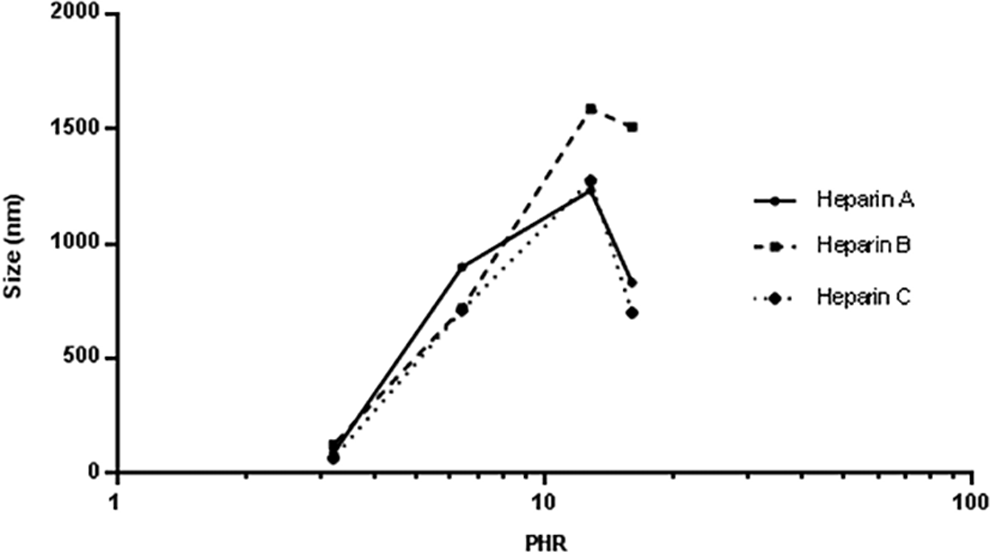
Z-average (nm) vs log PHR for different porcine heparin samples complexing with PF4.
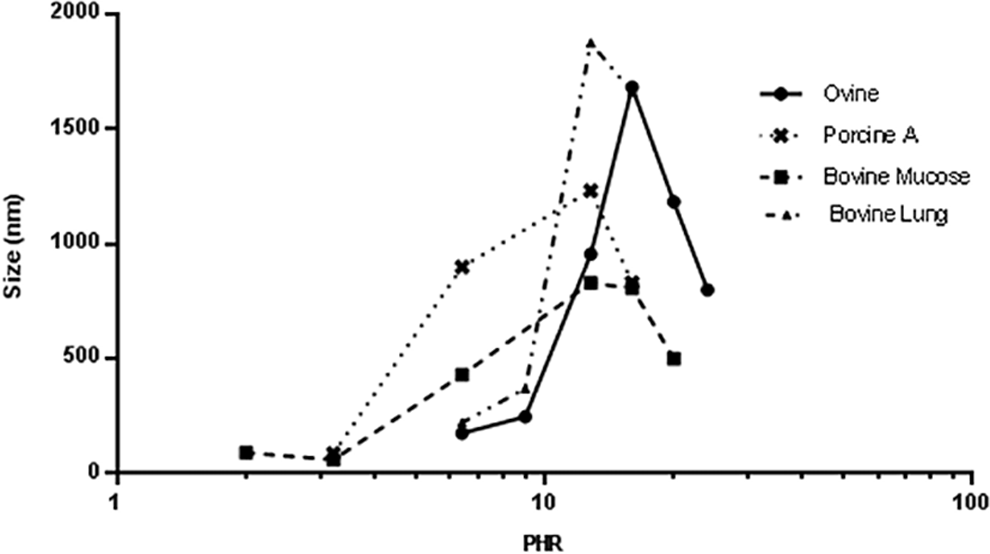
Z-average (nm) vs log PHR for different heparin samples complexing with PF4.
PHR Value at Maximum and Z-Average (nm) Values of Solutions Containing PF4 and Heparin Samples From Different Species and Sources.
Abbreviation: PF4, platelet factor 4.
As already shown, the size of particles follows a bell-shaped curve with a maximum achieved at a PHR of approximately 12.8:1 for the 3 porcine mucosal, the bovine mucosal, and the lung heparin samples, whereas the PHR for ovine heparin was 16:1. This indicates that lower concentrations of ovine heparin are needed to form the large complexes as compared to the other heparins. Moreover, ovine heparin forms larger aggregates compared to the other mucosal heparins. This behavior likely results from a combination of the higher degree of sulfation observed for ovine and porcine heparin and the lower molecular weight of the bovine mucosal heparin. Bovine lung heparin appears to differ from bovine mucosal heparin in that the size of complexes formed is higher despite having lower average molecular weight. This behavior may be attributed to the higher degree of sulfation of bovine lung heparin.
Zeta Potential
The PF4 and heparins interact electrostatically to give rise to complexes, so it could be important to evaluate the surface charge of these complexes as a function of the protein/heparin ratio. Zeta potential is a measure of the magnitude of the electrostatic repulsion or attraction between particles and is one of the fundamental parameters known to affect their stability. In this study, the Zp measurements were performed at the same PF4 concentration as used for the PCS. Because high-conductivity buffer solutions preclude electrophoretic mobility measurements, PF4 was solubilized in 10% HBSS.
Unfractionated heparin samples
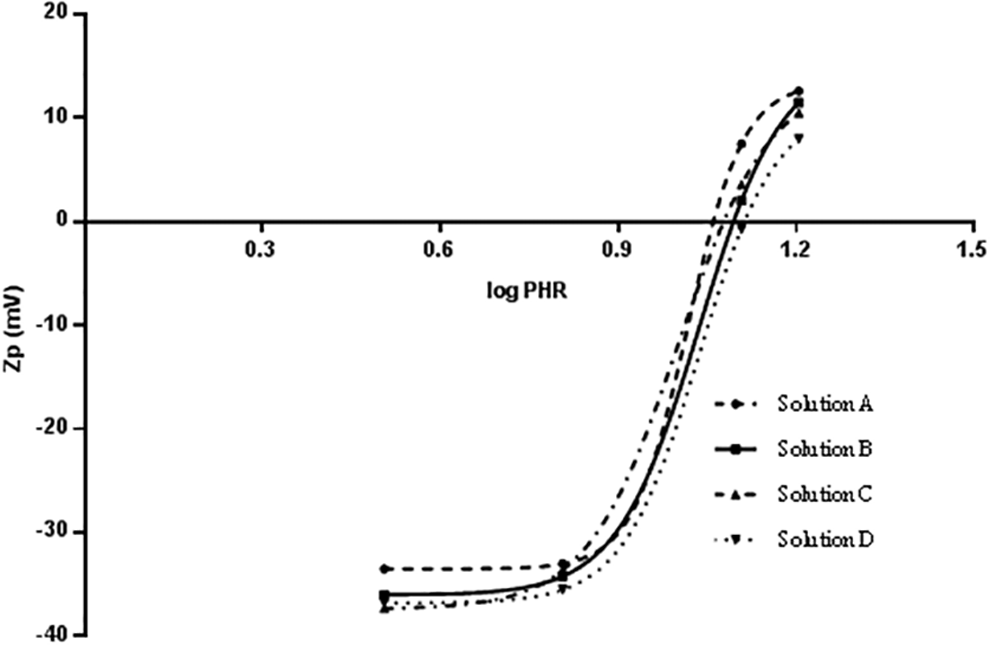
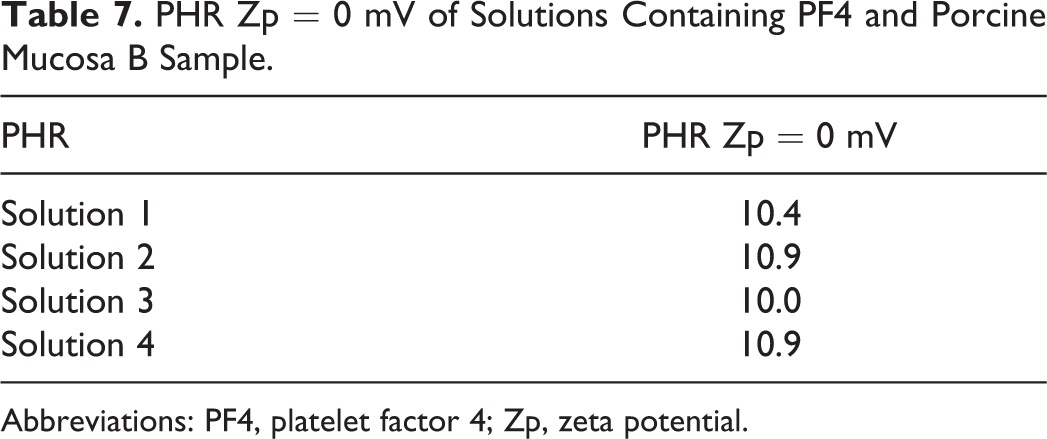
The Zp of complexes was measured using conditions analogous to those of the PCS experiments shown in Figure 1 whereby increasing amounts of heparin were incubated with a fixed concentration of hPF4. The method repeatability was evaluated analyzing 4 independent solutions of the same porcine mucosal heparin. In particular, Zp values of PF4/heparin complexes at 4 different PHRs were measured (Figure 4). Using Origin software, the method repeatability was studied considering parameters of the sigmoidal equation and the PHR value calculated when Zp is equal to zero (Table 7). The sigmoidal curves obtained by interpolation of the experimental data were very similar, and the relative standard deviation related to PHR value at which Zp is equal to zero was less than 5%.
Zp (mV) vs log PHR for four different solution of porcine B complexing with PF4.
PHR Zp = 0 mV of Solutions Containing PF4 and Porcine Mucosa B Sample.
Abbreviations: PF4, platelet factor 4; Zp, zeta potential.
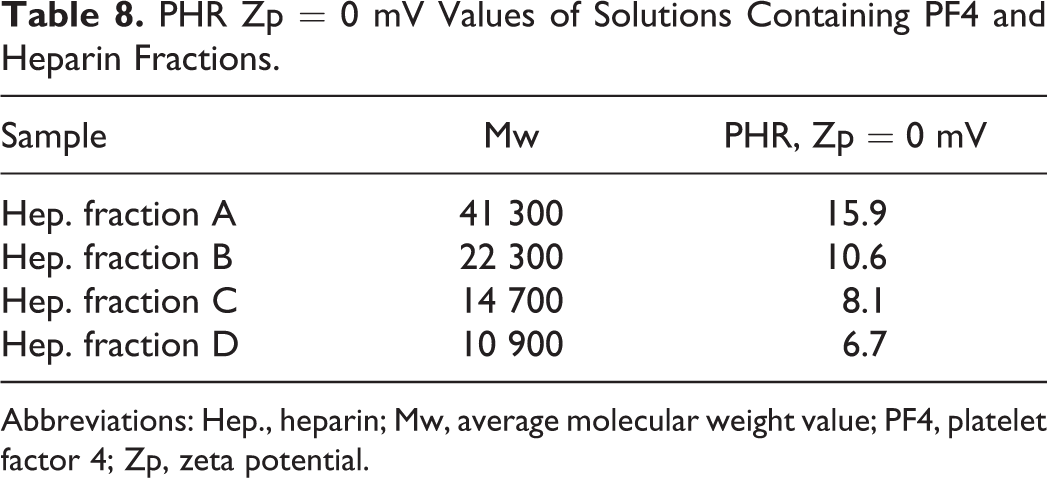
When heparin fractions with different average molecular weights were tested, a linear decrease in PHR at Zp = 0 mV with decreasing molecular weight was observed (Table 8), indicating that higher concentrations of lower molecular weight fractions are needed to obtain the charge neutralization that corresponds with maximum aggregation.
PHR Zp = 0 mV Values of Solutions Containing PF4 and Heparin Fractions.
Abbreviations: Hep., heparin; Mw, average molecular weight value; PF4, platelet factor 4; Zp, zeta potential.
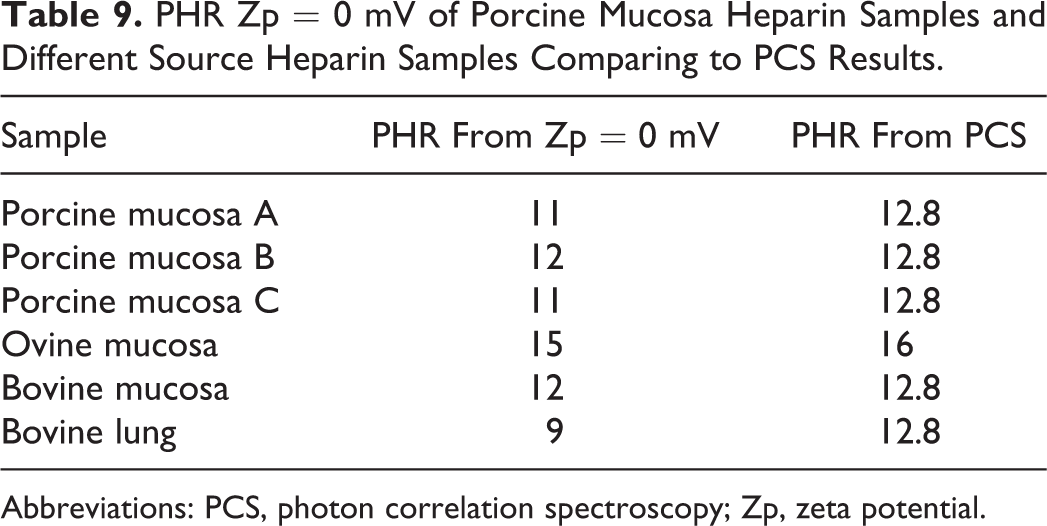
The same experimental approach was applied to heparins isolated from porcine mucosa, bovine mucosa, bovine lung, and ovine mucosa (Figures 5 and 6). A reduction of Zp was recorded for all heparin samples. A sigmoidal equation was fitted to the Zp versus the logarithm of PHR data to obtain the PHR value of the curve that corresponds to the neutral state of the complex (Zp = 0). The PHR values at which Zp = 0 mV for each heparin, and the hPF4/heparin complex size obtained by PCS experiments are shown in Table 9. For each of the porcine mucosal heparins, the concentration that yielded net charge neutrality occurred at approximately the same molar ratio (PHR: 12:1, PHR: 11:1) in agreement with the values of the molar ratios inducing the maximal particle size. Heparin B, characterized by a slightly higher Mw, exhibited PHR = 12, and the largest aggregate structures, confirming that molecular weight, is an important parameter in determining hPF4/heparin complex formation, particularly for samples with the same molecular weight distribution, as in this case where the Pd values are equal.
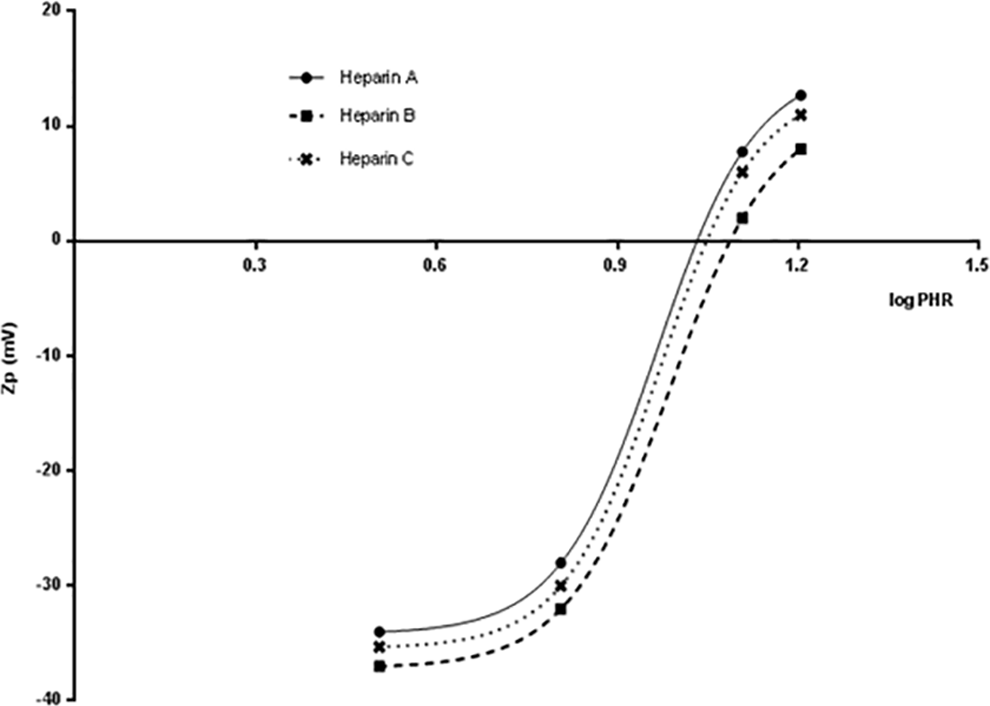
Zp (mV) vs log PHR for different porcine heparin samples complexing with PF4.
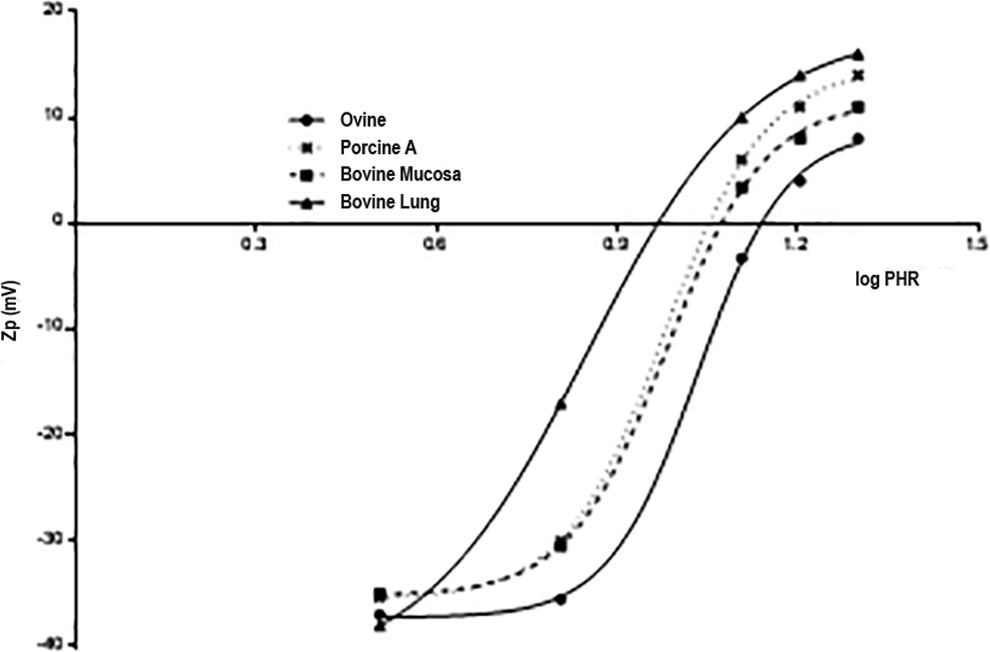
Zp (mV) vs log PHR for different source heparin samples complexing with PF4.
PHR Zp = 0 mV of Porcine Mucosa Heparin Samples and Different Source Heparin Samples Comparing to PCS Results.
Abbreviations: PCS, photon correlation spectroscopy; Zp, zeta potential.
The ovine sample differs from porcine and bovine samples in terms of the lower concentration required to obtain the neutrality of charge (PHR = 15) and the higher size of formed complexes, confirming the PCS results. Contrary to the Z-size experiments, with Z-potential, it is possible to differentiate the PHR of lung and mucosal bovine samples. A higher concentration of bovine lung heparin is required to obtain neutrality of charge (PHR = 9) even though the size of complexes formed is higher, suggesting a role of charge density to supplement the lower molecular weight.
Low-molecular-weight heparin samples
Refinement of heparin has included the approved clinical use of diverse LMWHs prepared using a variety of UFH depolymerization processes. Their development was based on the discovery that heparin-mediated inhibition of factor Xa via antithrombin (AT) required shorter fragments than its inhibition of thrombin (factor IIa). 2 By exploiting this selectivity, some favorable clinical properties could also be observed including a 10-fold lower frequency of HIT in patients treated with LMWHs compared to those treated with UFHs. 9–10
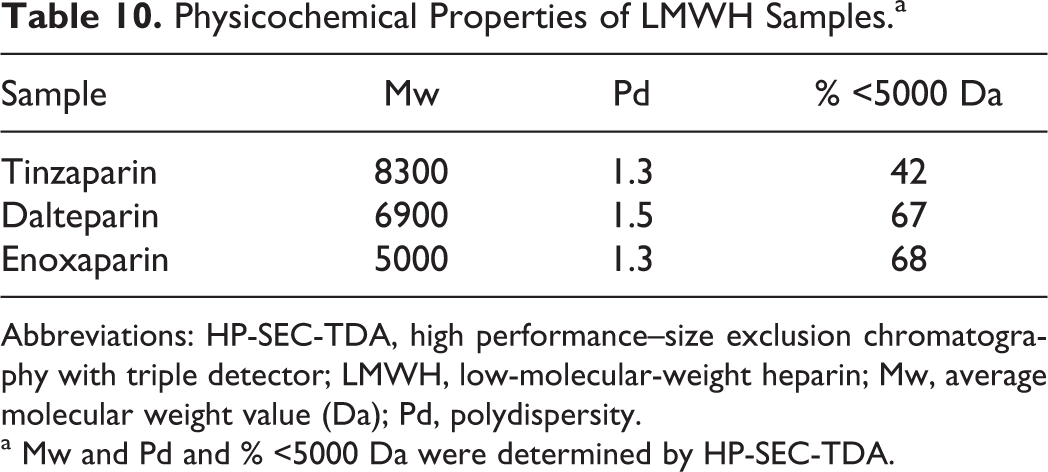
The physicochemical properties of 3 commercial LMWHs, produced by enzymatic (tinzaparin) or chemical processes (dalteparin and enoxaparin), that were included in this study are shown in Table 10. It is noteworthy that each LMWH is characterized by peculiar oligosaccharide family distributions ranging from a minimum of tetra up to more than 24 monomers.
Physicochemical Properties of LMWH Samples.a
Abbreviations: HP-SEC-TDA, high performance–size exclusion chromatography with triple detector; LMWH, low-molecular-weight heparin; Mw, average molecular weight value (Da); Pd, polydispersity.
a Mw and Pd and % <5000 Da were determined by HP-SEC-TDA.
As with the high molecular weight samples, the dependence of PHR and size of the complex on molecular weight was evaluated. The interactions of PF4 with dalteparin fractions (fraction A, B, and C) obtained by SEC on a Bio-gel P6 column, 2 oligosaccharide fractions isolated from dalteparin and fondaparinux, and the synthetic pentasaccharide fondaparinux were analyzed (Table 11 and Figure 7). As expected, for LMWHs with different average molecular weights, different values of PHR at maximum size aggregation by PCS and Zp experiments (Figure 8) were obtained. With decreasing molecular weight, higher concentrations of heparin are needed to produce the largest complexes. The dalteparin decasaccharides and dodecasaccharides present the same PHR by PCS but show different PHR from Zp, confirming the higher sensitivity of this approach compared to the PCS. As shown in Figure 8, somewhat larger species were observed with the dodecasaccharide. A very high amount of fondaparinux was required to obtain neutrality of charge (PHR 1.0).
Dalteparin Fractions, Isolated Oligosaccharides, and Fondaparinux.a
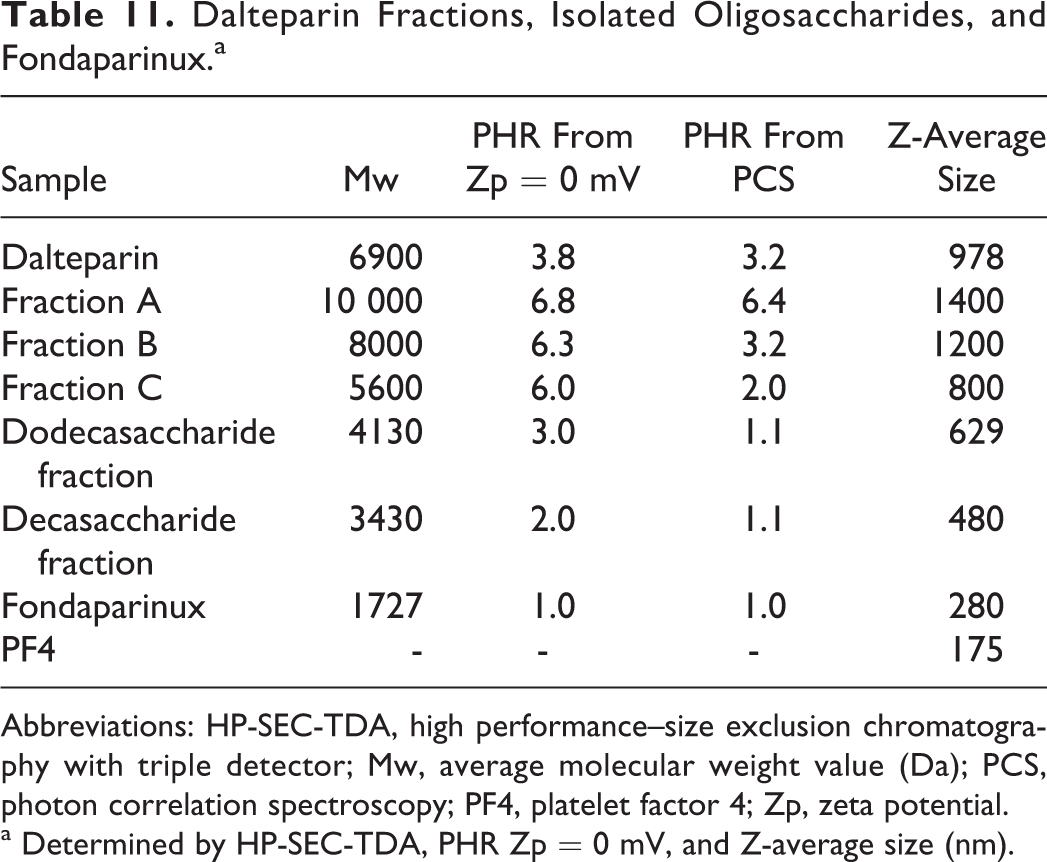
Abbreviations: HP-SEC-TDA, high performance–size exclusion chromatography with triple detector; Mw, average molecular weight value (Da); PCS, photon correlation spectroscopy; PF4, platelet factor 4; Zp, zeta potential.
a Determined by HP-SEC-TDA, PHR Zp = 0 mV, and Z-average size (nm).
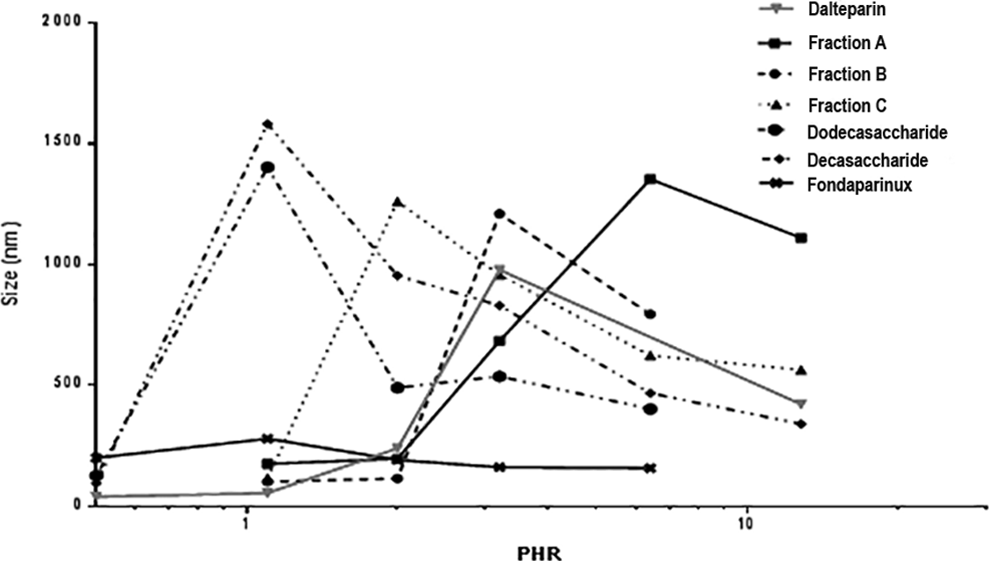
Z-average (nm) vs log PHR for dalteparin fractions complexing with PF4.
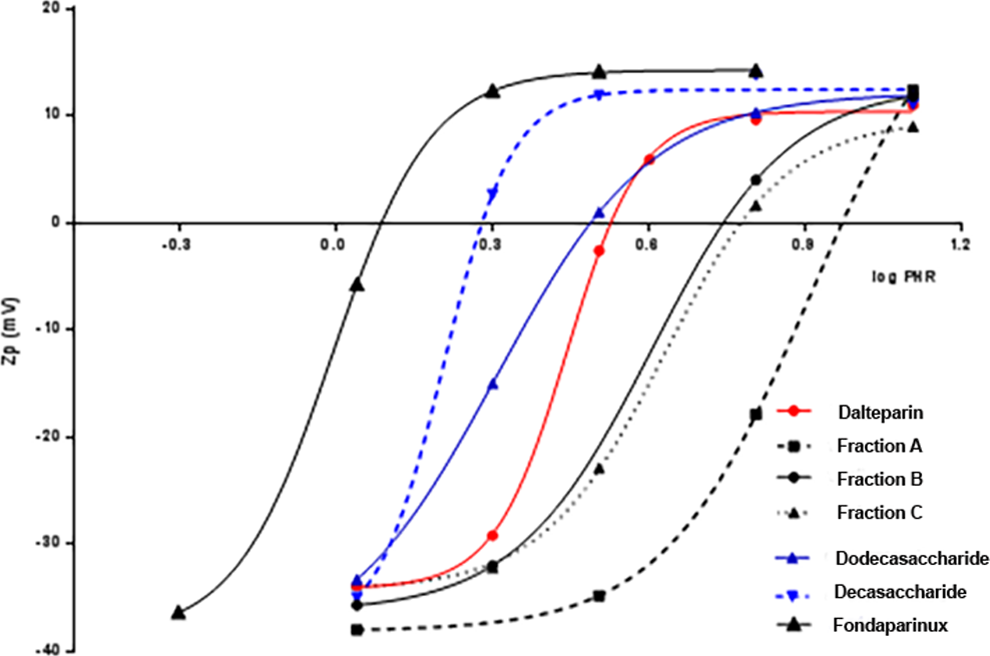
Zp (mV) vs log PHR for dalteparin and its fractions complexing with PF4.
The PHR value from PCS obtained for dalteparin is an intermediate value between the highest and lowest molecular weight fractions, a function of different molecular weight chains present in the compound, but PHR from Zp is lower than the average. Furthermore, while the charge neutralization of the protein follows a regular pattern, obtaining aggregates of a significant size requires an oligosaccharide with molecular weight greater than 4000 Da. These results confirmed that the interaction between heparin and protein is a function of not only average molecular weight but also the distribution of molecular weight. For this reason, it is important to characterize the Pd of the sample; for dalteparin, the Pd is 1.5, whereas for dalteparin fraction Pd is 1.1.
The shape of the log PHR versus size curves for the 3 different LMWHs (Figure 9) was similar to that obtained with UFH, but the PHR at which the largest complexes formed was found to be lower. Moreover, for the various LMWHs, some difference in the size of complexes can be observed (Table 11). The PHR of the complexes, obtained by Zp (Figure 10) and PCS, decreases with molecular weight but differences in PHR between dalteparin and enoxaparin, despite the differences in average Mw are not appreciated by PCS. By measuring Zp, the PHR needed to obtain the maximal aggregation could be evaluated by fitting the underlying data so that small differences, not evaluable directly by size curves, could be detected.
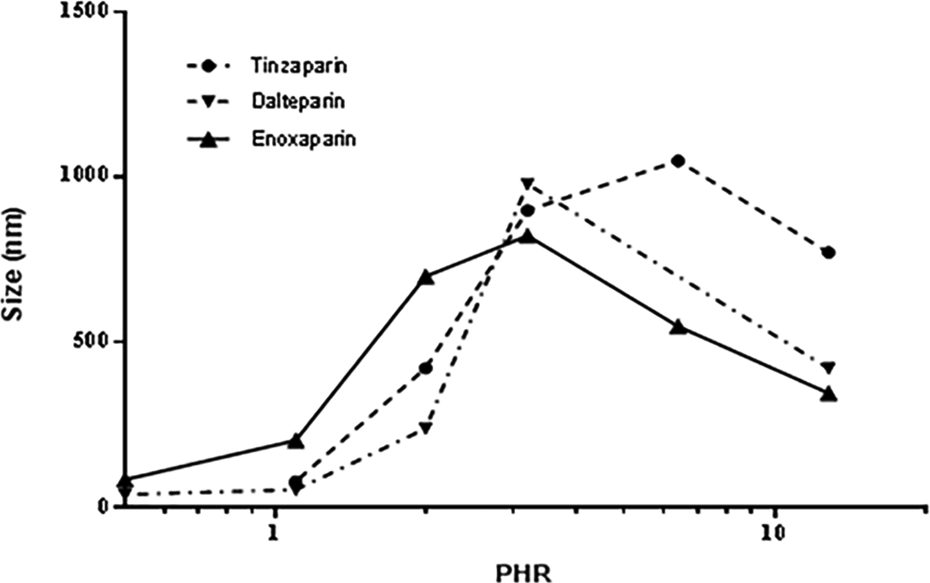
Z-average (nm) vs log PHR for different LMWHs complexing with PF4.
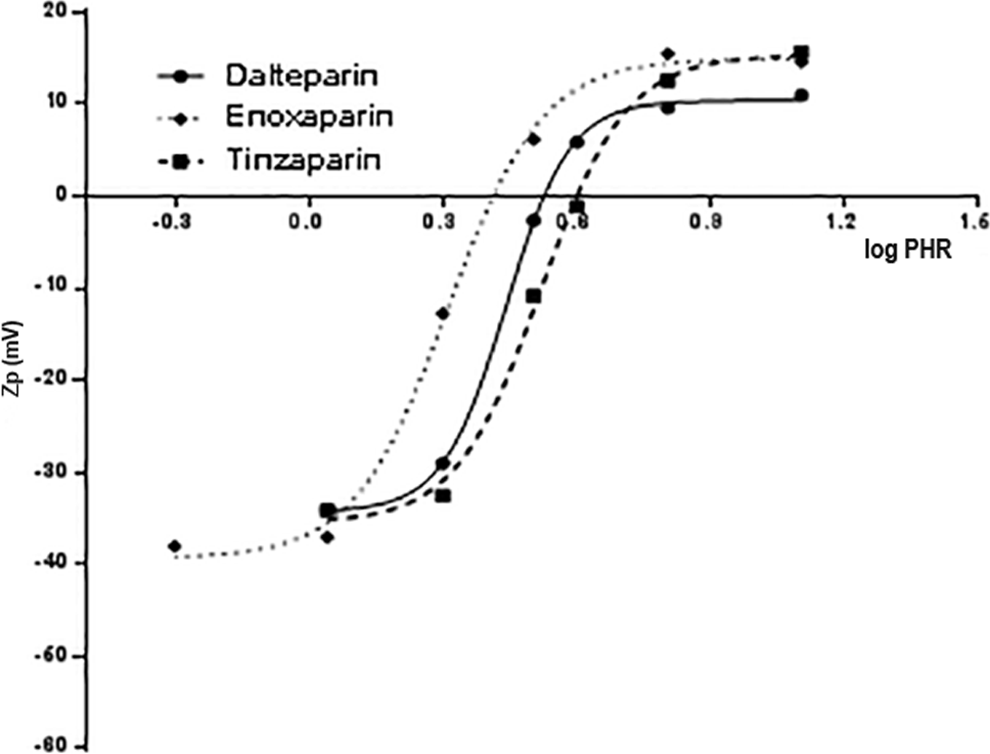
Zp (mV) vs log PHR for LMWH samples complexing with PF4.
To explain the PHR values from PCS, we hypothesized that the interaction of heparin chains with PF4 is related not only to the average chain length but also to the distribution of molecular weight. Therefore, a possible explanation for the similar PHR by PCS for dalteparin and enoxaparin is that the amount of sample with molecular weight higher than 5000 Da is the same for both drugs (67%-68%) (Table 12). Short heparin chains are able to neutralize the positive charge of PF4 but are not able to induce its oligomerization. Therefore, their presence can oppose the aggregation phenomena of the higher molecular weight chains. To confirm this hypothesis, the effect of the pentasaccharide (fondaparinux) on the interaction of PF4 with UFH and dalteparin was tested.
PHR Zp = 0 mV and Z-Average Size (nm) Values of Solutions Containing PF4 and Different LMWH Samples.
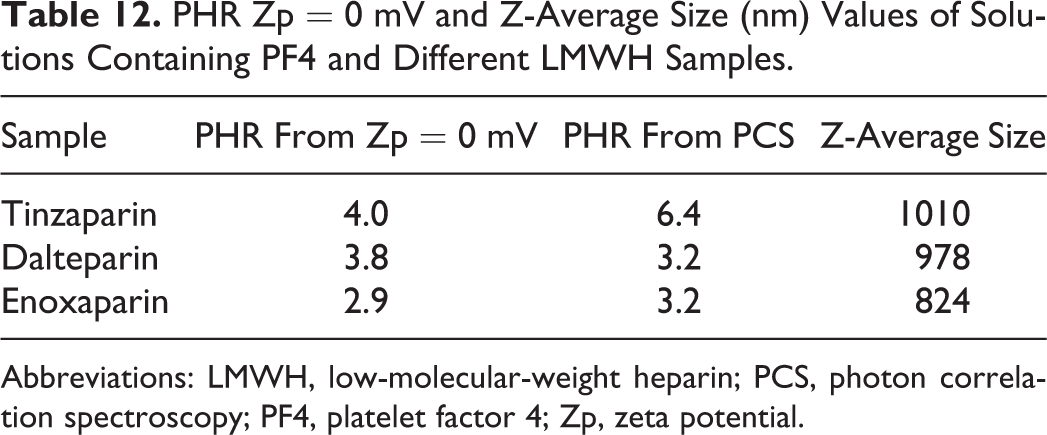
Abbreviations: LMWH, low-molecular-weight heparin; PCS, photon correlation spectroscopy; PF4, platelet factor 4; Zp, zeta potential.
Fondaparinux is the first of a new class of antithrombotic agents distinct from LMWHs and UFHs. It is a synthetic pentasaccharide mimicking the heparin binding site to AT. It inhibits only factor Xa via binding to AT, which in turn inhibits thrombin generation. In contrast to heparin and LMWHs, the plasma anti-Xa activity corresponds directly to levels of fondaparinux. Moreover, fondaparinux does not exhibit in vitro and in vivo reactivity with anti-PF4/heparin antibodies, so when it is incubated with PF4, HIT antibodies do not bind to these complexes. 17,18
The Heparin/PF4 Zp curve was compared to Zp values obtained following addition of 3 heparin/fondaparinux solutions with different molar ratios of UFH and fondaparinux to the protein. In particular, heparin/fondaparinux molar ratios of 2/1, 1/1, and 1/2 were tested. The Zp versus PHR curves are shown in Figures 11 and 12. From the analysis of the curves, the PHR value associated with net charge neutrality changes significantly with an excess of fondaparinux (1/2), as shown in Table 13. The size of the complex formed with UFH is higher than with the UFH/fondaparinux mixture. For fondaparinux, complexes one-quarter the size of those formed between heparin and PF4 were determined by PCS (Tables 13 and 14).
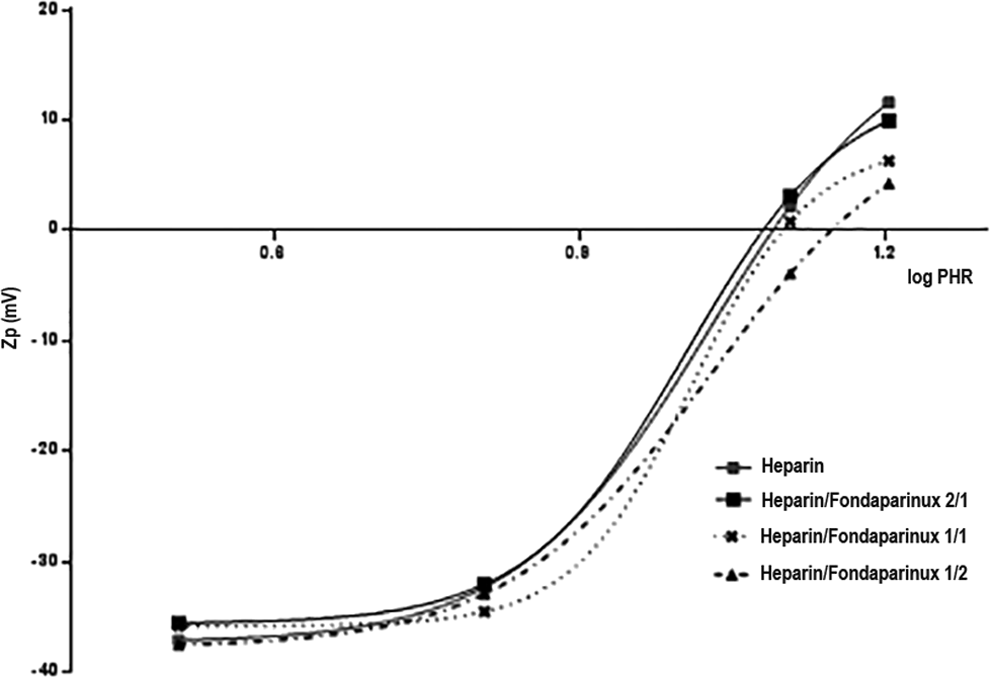
Zp (mV) vs log PHR for UFH and UFH mixed with fondaparinux complexing with PF4.
Zp (mV) vs log PHR for dalteparin and fondaparinux alone and mixed samples complexing with PF4.
Heparin, Fondaparinux, and Their Mixtures.
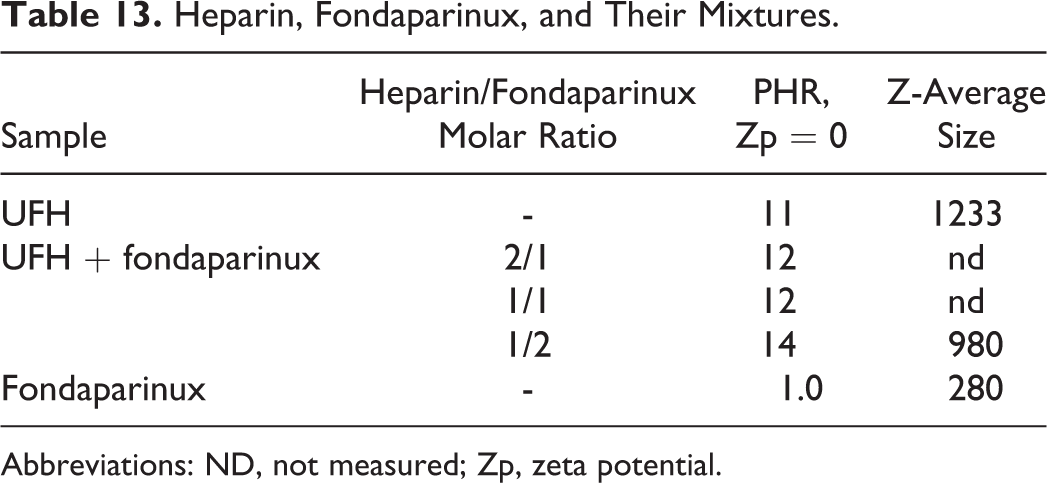
Abbreviations: ND, not measured; Zp, zeta potential.
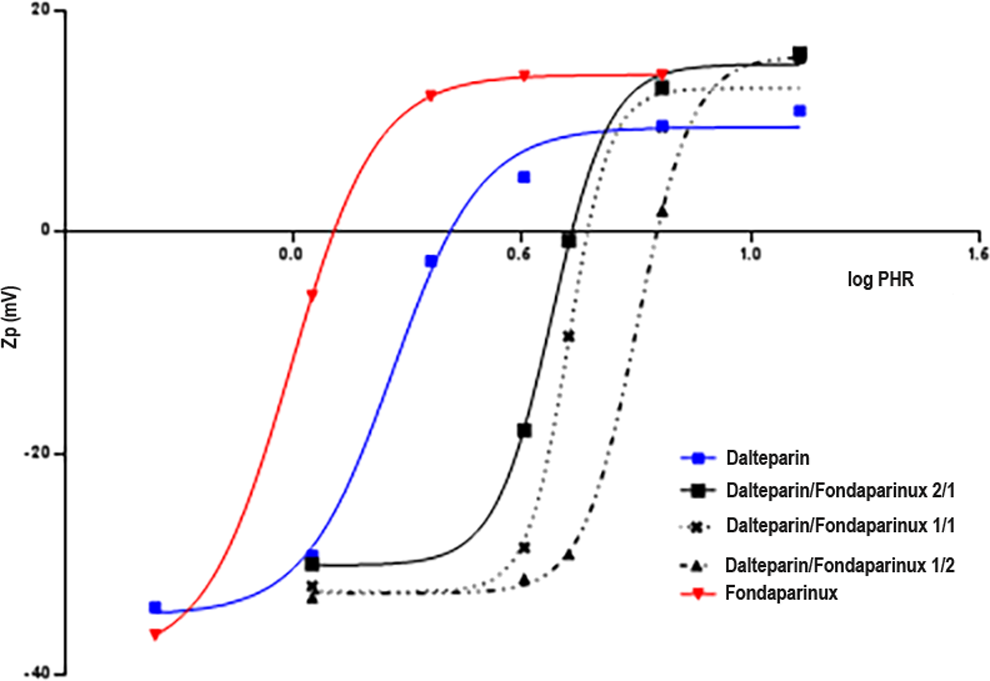
Dalteparin and Dalteparin/Fondaparinux Mixtures.
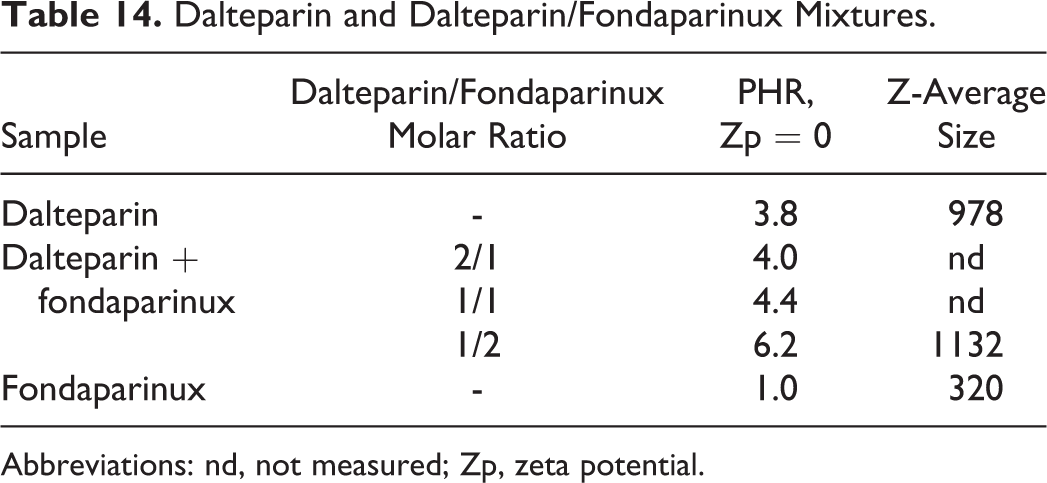
Abbreviations: nd, not measured; Zp, zeta potential.
Using the same experimental approach, the PHR at which the Zp value is equal to zero and the size of complexes was determined for dalteparin/fondaparinux solutions. In particular, the dalteparin/PF4 Zp curve was compared to Zp values obtained following addition of 3 dalteparin/fondaparinux solutions with different proportions of LMWH and fondaparinux to the protein. In particular, LMWH/fondaparinux molar ratios of 2/1, 1/1, and 1/2 were tested. The Zp versus PHR curves are shown in Figure 12. From the analysis of the curves, the PHR value associated with net charge neutrality changes significantly with fondaparinux, as shown in Table 14. It is evident that increasing the pentasaccharide concentration increases the PHR associated with net charge neutrality.
Discussion
The interaction of PF4 and heparin is regulated by a dynamic equilibrium, where the stability of complexes depends, among other things, on the relative concentrations of PF4 and heparin. Complexes of PF4 and heparin can be characterized in terms of their size and, due to the electrostatic nature of interaction, surface charge.
The PCS is a technique for measuring the size of molecules and nanoparticles typically in the submicron range, as well as the time-dependent fluctuations in the scattering intensity that result from Brownian motion. These fluctuations can be correlated with the particle diffusion coefficient and size to determine the translational diffusion coefficient, and subsequently, the hydrodynamic radius using the Stokes-Einstein equation. The rate of intensity fluctuation is dependent upon the size of the particle/molecule—the larger the particle, the slower the Brownian motion will be. The fluctuation produces different scattered light and the intensity of signal at time t is compared to the intensity, a very small time later (t + δt). The correlation between the intensity of the 2 signals is a function of the dimension of particles. If the particles are large, the signal will be changing slowly and the correlation will persist for a long time; if the particles are small and moving rapidly, the correlation will decrease more quickly. Size is obtained from the correlation function using various algorithms. In this study, a single exponential curve was fit to the correlation function to obtain the mean size (Z-average radius).
All particles in solution acquire an electronic charge on their surface. This charge is referred to as the Zp. The Zp is an important parameter to predict the stability of particles in solution. Strongly positive or negative Zp values allow particles to remain dispersed in solution, whereas with a reduced surface charge, particles tend to aggregate and in some cases precipitate. In previous work, 14 it has been shown that positively charged PF4 particles remain dispersed in the absence of heparin due to repulsive interactions. With increasing amounts of heparin, charges are neutralized promoting macromolecular assembly. With a molar excess of heparin, repulsive interactions predominate leading to stable dispersion of smaller particles. This is reflected in the bell-shaped relationship between complex size and PHR.
The present study, investigating the complexes formed upon incubating PF4 with a variety of heparin and heparin-like samples, showed that the macroaggregates differ with respect to size, charge, and composition depending on the heparin used and the experimental conditions. It was found that the size of complexes is a function of PF4 concentration, as larger complexes formed (larger Z-average values) with higher concentrations of PF4 than with a lower PF4 concentration.
In testing the porcine heparin samples, the largest particles with net charge neutrality were observed at a PF4-heparin molar ratio of about 13:1. This value which is larger than the values published previously 1,12 likely results from the use of a different PF4 concentration, mixing times, and buffer.
Pharmaceutical-grade heparin is derived from the mucosal tissue of animals such as pigs, cows, and sheep. Since the 1990s, porcine mucosa has been the sole source of heparin in western countries because of potential prion contamination and the risk of infection with bovine spongiform encephalopathy. In late 2007 and early 2008, contamination of porcine heparin from China with an “unnatural” fully O-sulfated chondroitin sulfate 19–20 resulted in adverse events, including fatalities. As a consequence, US authorities are considering the reintroduction of bovine heparin, which continues to be produced and used clinically in South American countries, in order to diversify the sourcing of heparin. In the current study, it is shown that higher concentrations of porcine and bovine mucosal heparin are required to form the large PF4/heparin complexes as compared to ovine-derived heparin. Such an effect may be related to the higher molecular weight and higher degree of sulfation expressed by ovine heparin.
The variation in the anti-Xa and anti-IIa activities among the porcine and ovine heparins was minimal in comparison to the bovine heparins. However, the PF4 interaction with both the bovine and porcine heparins was comparable. Therefore, both the molecular weight and the charge density are important factors in the determination of the PF4 interactions with heparin. The fact that bovine lung heparin with a lower molecular weight and high charge exhibited bigger aggregate formation points to this suggestion.
To further evaluate the effect of molecular weight and charge on the relationship between PHR and the size/charge of complexes formed, studies were conducted using various LMWHs and LMWH fractions. The LMWHs are produced by depolymerization of unfractionated heparin using a variety of chemical or enzymatic methods. As a class, the LMWHs have an average molecular weight of approximately one-third that of unfractionated heparin. Using PCS and Zp measurements, it was observed that larger amounts of LMWH (reflected in lower PHR values) compared to unfractionated heparin were needed to produce the large complexes. Additionally, each of the depolymerization methods results in a distinct distribution of oligosaccharides. In this study, the size of the PF4/LMWH complexes paralleled the average molecular weight; tinzaparin, with the highest molecular weight (8300 Da) produced the largest complexes, whereas enoxaparin, with the lowest molecular weight (5000 Da), produced the smallest complexes. A similar relationship was observed when the formation of complexes between PF4 and various fractions of dalteparin were measured.
In order to consider the polydispersity of samples, PHR values were evaluated using the number average molecular weight. Overall, the absolute PHR values at maximum aggregation decrease but the differences between the heparin samples were the same obtained using Mw.
Moreover, we calculated the milligrams of heparin samples corresponding to PHR at the maximum of aggregation for all the experiments. The amount of UFH samples, expressed in mg, needed to obtain the aggregation is about 20% lower than LMWH samples. Taking into account the molar ratio, the differences are more evident; in fact, in terms of moles, 4 times more LMWH than UFH is necessary to obtain the maximum of aggregation.
Generally, the largest complexes occur at the molar ratios that lead to charge neutralization. Discrepancies are observed when samples are too small to bind more than 1 molecule of PF4 as in case of oligomers smaller than decasaccharides or when, because of Pd of the sample molecular weight, small chains compete with longer chains for binding to PF4. As a consequence, the size of the aggregate is not a simple function of average molecular weight, but it is also affected by the molecular weight distribution of the sample.
Footnotes
Declaration of Conflicting Interests
The author(s) declared no potential conflicts of interest with respect to the research, authorship, and/or publication of this article.
Funding
The author(s) received no financial support for the research, authorship, and/or publication of this article.