
Abstract
No study has compared 2 different dosing strategies for argatroban titration nor has any published nomogram demonstrated improvement in outcomes. This study was conducted to evaluate the effectiveness of 2 argatroban nomograms on reaching therapeutic anticoagulation. Patients treated with argatroban were separated into 2 sliding scale groups, percentage adjustments (PAs) and predefined dose increments (PDIs). The primary outcome was the time to reach a therapeutic activated partial thromboplastin time (aPTT). The average initial dose and dose to achieve a therapeutic aPTT were similar between the groups. There was also no difference in the number of dose changes. The time to reach a therapeutic aPTT was 2 hours shorter in the PDI compared to the PA group, 8 ± 4 hours versus 10 ± 4 hours, P = .015. This study demonstrates a significant time advantage associated with a PDI nomogram compared to a PA nomogram but no difference with respect to the number of rate changes.
Introduction
Argatroban has proven efficacy in reducing thrombotic complications associated with heparin-induced thrombocytopenia (HIT) and is licensed in the United States to treat and prevent HIT-associated thrombosis. 1,2 Translating the levels of efficacy obtained in clinical trials into equal levels of efficacy in clinical practice (ie, effectiveness) can be difficult to obtain, if at all. A factor that may impact the effectiveness of anticoagulants like argatroban in the acute setting is the time it takes to reach a “therapeutic level of anticoagulation.” 3,4 In the case of argatroban this is considered to be an activated partial thromboplastin time (aPTT) in the range of 1.5 to 3 times the baseline (predrug) levels.
There are no formal dosing titration strategies for argatroban nor has any published dosing algorithm or nomogram demonstrated improvement in clinical outcomes over empiric strategies. 5 –7 However, a recent report from the US Department of Health & Human Services citing the superiority of nomogram-based dosing over routine care in patients receiving intravenous heparin for venous thromboembolism (VTE) led to a Medicare and Medicaid Electronic Health Records incentive program for the use of intravenous heparin nomograms as well as Joint Commission performance measures. 8,9 Evidence suggests that reaching therapeutic anticoagulation with heparin sooner rather than later may lead to improved outcomes. 10 There is also evidence that dosing heparin via nomograms can improve the time to reach a therapeutic aPTT when compared to empiric heparin-dosing strategies. 11,12 Extrapolating from what is known regarding best practices with intravenous heparin dosing for VTE, nomograms have been developed for argatroban in the management of HIT. 13,14 The purpose of this study was to evaluate the effectiveness of 2 novel nomogram-based dosing strategies for argatroban in reaching a therapeutic aPTT in patients with known or suspected HIT.
Nomograms
In October 2009, Massachusetts General Hospital converted from a nomogram that based dosage adjustments in percentages to nomograms that utilized adjustments in predefined dose increments (PDIs; ie, μg/kg/min; see Appendix A). The rationale for this institutional change was 2-fold. First, we had been experiencing infrequent but nonetheless concerning safety reports of actual and near-miss dosing errors attributed to miscalculations during dose titration using percentages. At this time, the institution was not using an electronic medication administration record (EMAR), so nursing would record and manually calculate the dosage adjustments based on the sliding scale (SS) using a direct thrombin inhibitor anticoagulation sheet located in the paper medication administration record (MAR; Appendix A). Second, we were moving away from a paper MAR to an EMAR that required us to imbed our SS electronically, rendering paper calculation sheets impractical.
Our original argatroban-dosing nomogram was developed approximately 13 years ago to address the lack of dosing guidance provided in the prescribing information and literature. Based on the pharmacodynamics of argatroban, specifically the relationship between dose, concentration, and anticoagulant effect that were reported to be predictable and proportional with low intersubject variability, a nomogram based on percentage was chosen. 5,15 –17 When we moved away from a percentage-based nomogram to a dose-based (ie, μg/kg/min) nomogram, we simply applied the percentage adjustment (PA) to the recommended starting dose of 2 μg/kg/min. Therefore, 20% and 40% adjustments up or down in dose in the old nomogram would now be 0.4 and 0.8 μg/kg/min adjustments, respectively, with the new nomogram. Adjustments in the 0.4 to 0.8 μg/kg/min range clearly would not be suitable when initiating therapy at lower doses (eg, 0.5 or 1 μg/kg/min), so we also created 2 additional nomograms using the same logic applied to our 2 μg/kg/min SS (Appendix A).
Methods
This study was approved by the Partners Human Research Committee prior to any data collection and was conducted between October 2009 and July 2012. Because this study was limited to reviewing medical records, it was deemed to present minimal patient risk, and the requirement for consent was waived.
Patients treated with argatroban were identified and screened for inclusion into 1 of 2 SS groups based on how dosing adjustments were made, a group based on PAs and one based on PDIs (Appendix A). The PDI group included any patient ordered for one of the predefined SS (ie, starting doses of 0.5, 1, or 2 μg/kg/min). Patients in the PA group were identified via hospital billing database, and those in the PDI groups were identified real time via the pharmacy operating system and followed prospectively for screening and data collection.
Patients were excluded from data analysis if no goal aPTT range was defined in the initial order or argatroban was discontinued before 2 aPTTs were drawn. Patients in whom liver dysfunction was present, defined as serum glutamic oxaloacetic transaminase (alanine aminotransferase), serum glutamic pyruvic transaminase (asparate aminotransferase), total bilirubin, or indirect bilirubin >3 times the upper limit of normal, were also excluded. Patients with liver dysfunction were excluded, because the clearance of argatroban is dependent on liver function and the SSs may not be appropriate in the setting of reduced clearance (eg, magnitude and frequency of dosage changes). In addition, patients in the PA arm were excluded if the initial goal aPTT range was not 50 to 70 seconds, or it was adjusted before a therapeutic aPTT was reached. Patients were excluded from the PDI arm if they were not ordered for 1 of the 3 predefined SS algorithms, or the dosing or goal aPTT recommendations were modified in one of the predefined SS algorithms (default aPTT range 50-70 seconds). Choice of SS (ie, 0.5, 1, or 2 μg/kg/min) was at the discretion of the ordering clinician based on the patient-specific factors (age, comorbidities, etc). The following monitoring recommendations appeared for both groups at the time of ordering; “check aPTT 2 hours after the start of the infusion and after any rate change. Once a therapeutic aPTT is obtained, a second aPTT should be drawn 2 hours later to confirm therapeutic goal. When 2 consecutive values are within range, then PTT should be monitored daily.” For both groups, when the argatroban order was placed, the clinician was automatically prompted to order aPTT testing as described previously.
Data collection included, age, weight, gender, indication for anticoagulation with alternative to heparin (ie, suspected or documented HIT), goal aPTT, initial dose, SS chosen, liver function tests, serum creatinine, number of dose changes to reach goal aPTT, time to reach goal aPTT, and dose in μg/kg/min when at goal aPTT.
The primary outcome was the time to reach a therapeutic aPTT. Our secondary outcome was the number of dose changes required before a therapeutic aPTT was reached. All nomogram-based dosing adjustments were managed by nursing. Pharmacy was available 24 hours a day to assist with any questions around dosing and/or dose calculations. A therapeutic aPTT was defined as the first of 2 consecutive aPTT values within the goal range. This value was used to calculate the time to reach a therapeutic aPTT in the data analysis.
Statistics
Based on a standard deviation of 4 hours derived from a pilot analysis, we calculated 58 patients in total were needed to have an 80% chance of detecting, as significant at the 5% level, a difference in the time to reach a therapeutic aPTT of 3 hours between the PDI and the PA groups. Data are presented in proportions or mean ± SD unless otherwise noted. Between groups differences for continuous variables were compared using a Student t test, and a 2-tailed P value of <.05 was considered statistically significant.
Results
A total of 133 patients were screened for inclusion/exclusion with 65 patients meeting criteria for inclusion in the data analysis, 32 in the PA group and 33 in the PDI group. Of the 46 patients excluded from the data analysis in the PA group, 34 (74%) were because the initial goal aPTT was not defined in the order, 6 (13%) were for adjustments in the goal aPTT to something other than 50 to 70 seconds, and 6 (13%) because only 1 aPTT was drawn. Similarly, the primary reasons for exclusion in the PDI group were adjusting the dosing nomogram or goal aPTT range in one of the predefined SSs (n = 18, 82%) and only 1 aPTT drawn (n = 4, 18%; Figure 1).
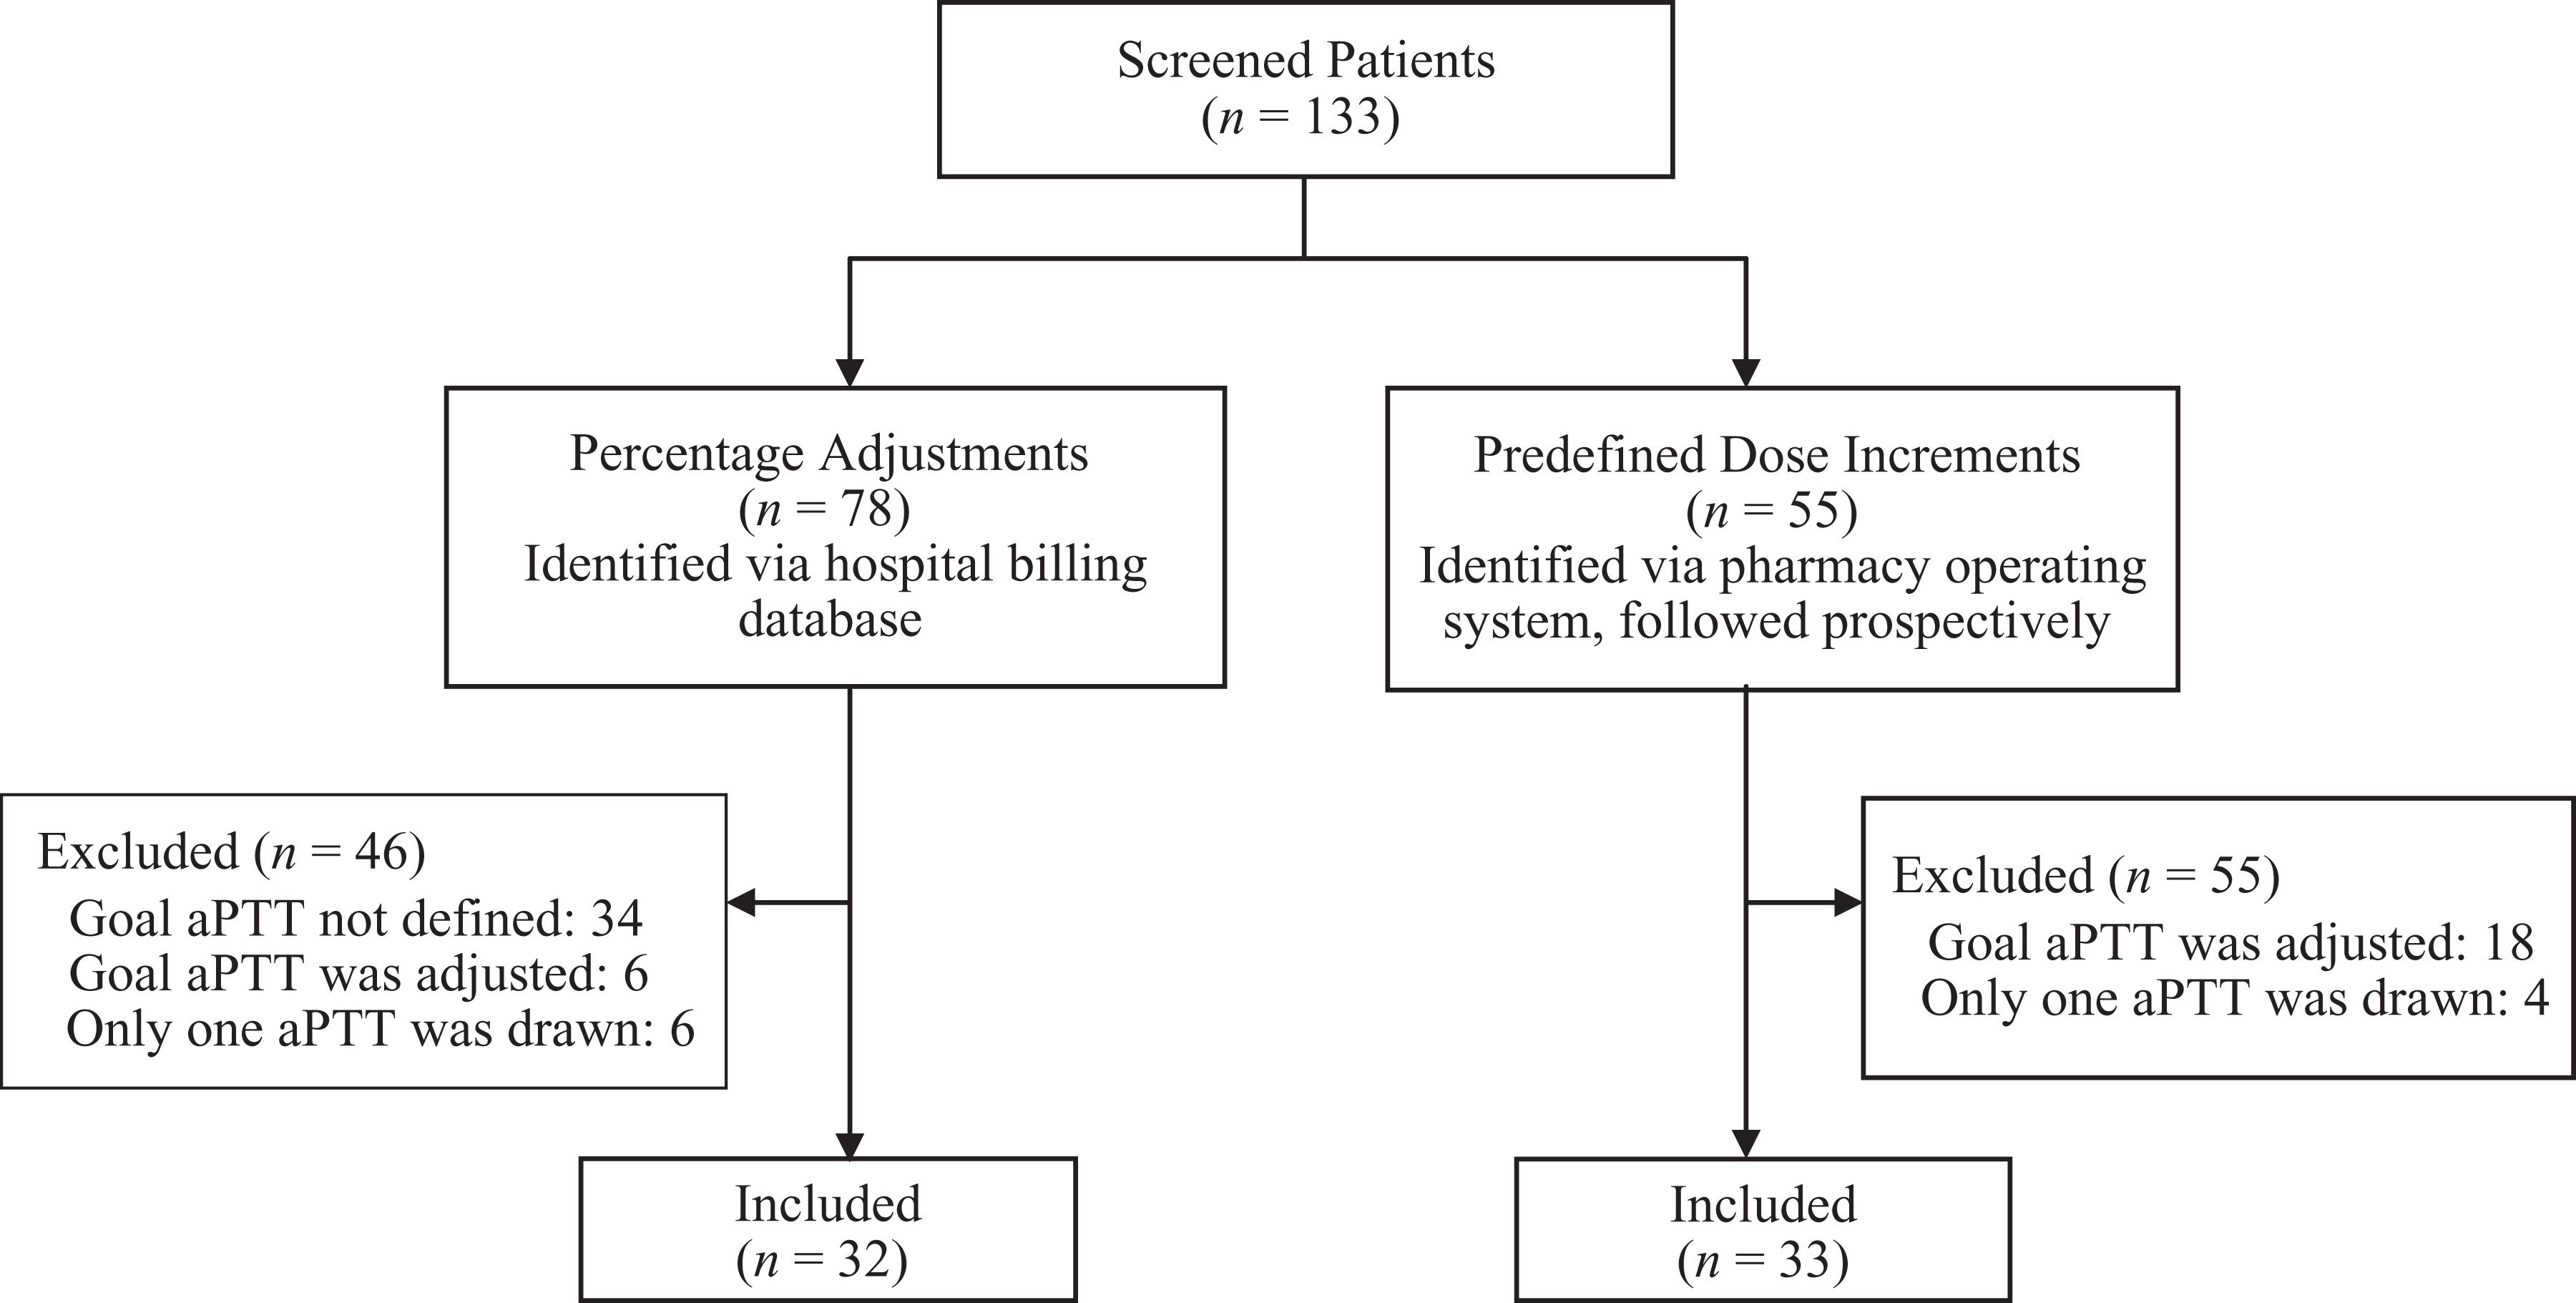
Study flow diagram.
There were no differences in baseline patient characteristics between the 2 groups (Table 1). The average initial argatroban dose in the PA and PDI was similar at 1.25 ± 0.59 μg/kg/min and 1.36 ± 0.62 μg/kg/min, respectively, P = .469. In the PDI group, 12 (36%) patients were initiated on the 1 μg/kg/min SS option, and 15 (46%) were initiated on the 2 μg/kg/min option. At the time of a therapeutic aPTT, the average dose between the PA and the PDI groups was similar at 1.31 ± 0.67 and 1.42 ± 0.85 μg/kg/min, respectively, P = .549 (Table 2).
Baseline Patient Characteristics.
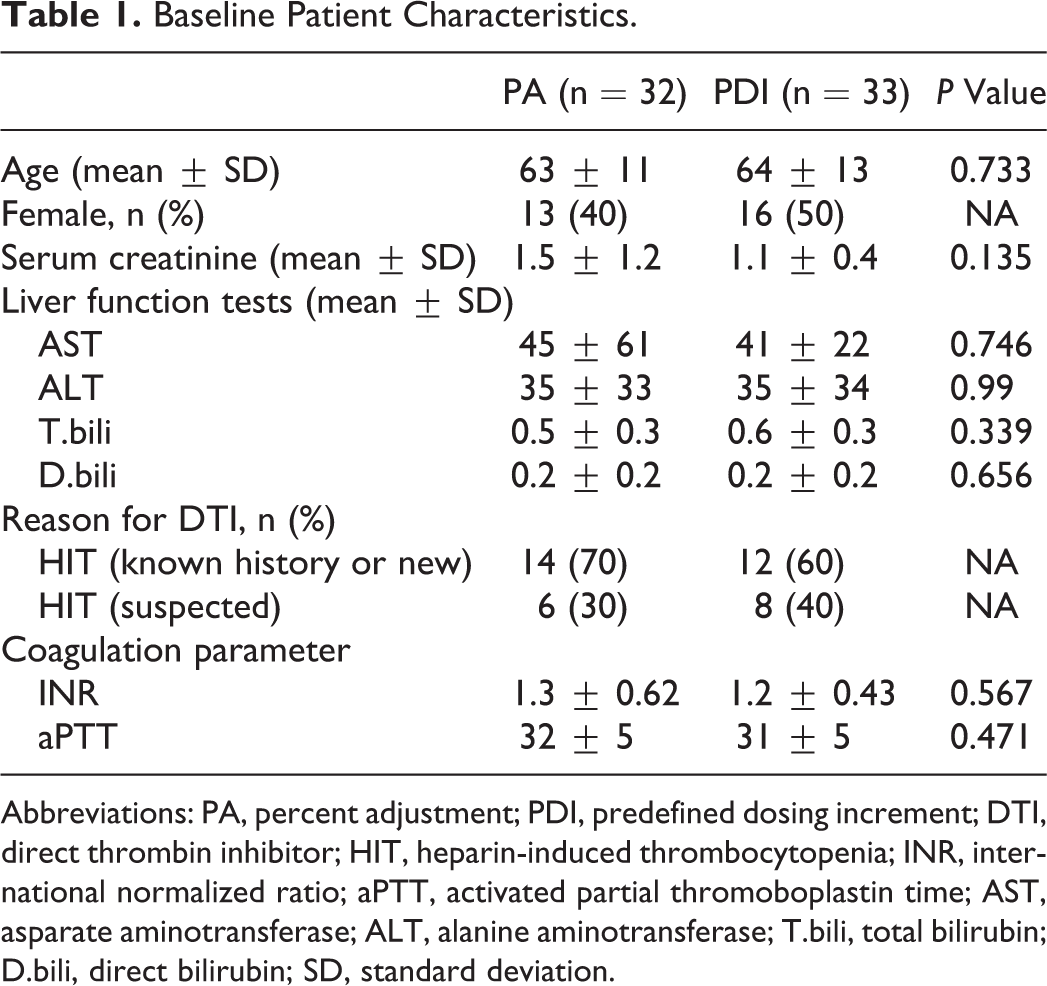
Abbreviations: PA, percent adjustment; PDI, predefined dosing increment; DTI, direct thrombin inhibitor; HIT, heparin-induced thrombocytopenia; INR, international normalized ratio; aPTT, activated partial thromoboplastin time; AST, asparate aminotransferase; ALT, alanine aminotransferase; T.bili, total bilirubin; D.bili, direct bilirubin; SD, standard deviation.
Results.
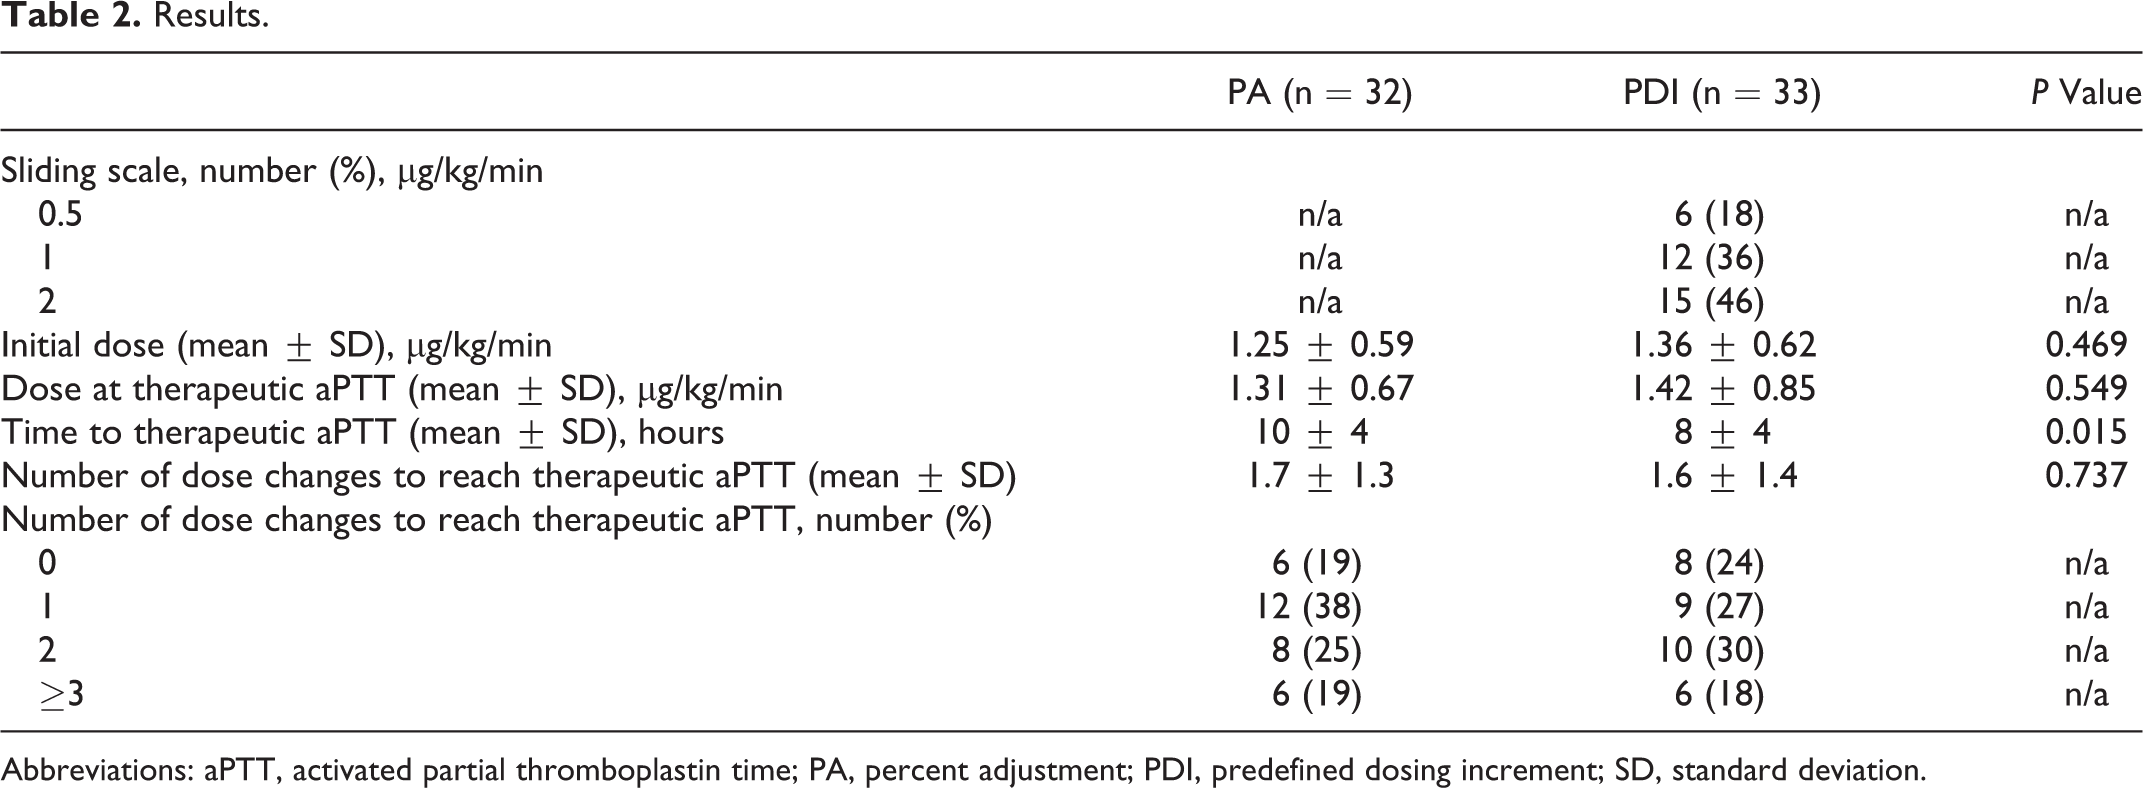
Abbreviations: aPTT, activated partial thromboplastin time; PA, percent adjustment; PDI, predefined dosing increment; SD, standard deviation.
The number of dose changes in both the groups ranged from 0 to a maximum of 5 with >87% of the patients requiring less than 3 dose changes to reach a therapeutic aPTT. There was no difference in the number of dose changes between the PA and the PDI groups, 1.7 ± 1.3 and 1.6 ± 1.4, respectively, P = .737. The time to reach a therapeutic aPTT was shorter by 2 hours in the PDI compared to the PA, 8 ± 4 hours versus 10 ± 4 hours, P = .015 (Table 2).
Discussion
Our study demonstrated no statistically significant difference between our 2 argatroban-dosing nomograms with respect to the number of dosage adjustments needed to reach a therapeutic aPTT. However, there was a significant difference in the time to reach a therapeutic aPTT. Our study is different than the previous studies in that we assessed the differences between 2 novel nomogram dosing strategies, one based on percentages and the other based on predefined dosing increments. 13,14 Ansara et al in an uncontrolled analysis reported their experience with pharmacist-driven nomograms that were based on predefined dosing increments. The average time to dose stabilization was 16.25 hours, which is longer than that was seen in our study. They did not report an average or median number of dose adjustments to reach a therapeutic aPTT. In an analysis comparing nomograms for bivalirudin and argatroban based on percentages to historical controls using empiric adjustments, Kiser et al reported a median (interquartile range) time to first goal aPTT of 5 hours (2-10 hours) for their protocol treatment group versus 13 hours (6-29 hours) in their the historical control group. They also reported an average of 0.9 ± 1.5 adjustments to reach a therapeutic aPTT in their treatment group. In contrast, our combined (PDI and PA groups) average time to reach a therapeutic aPTT was 9 ± 4 hours, and our number of rates changes was 1.6 ± 1.3. This higher number of rate changes and time to reach a therapeutic aPTT that was seen in our analysis may be explained by how a therapeutic aPTT was defined by Kiser et al for their data analysis. The therapeutic range built into their nomogram was 50% wider than the 50- to 70-second range defined on ours. A wider range would be expected to result in more patients in the therapeutic range after their first aPTT resulting in less frequent dose adjustment and quicker time to goal. Furthermore, we defined a therapeutic aPTT for data analysis as the first of 2 consecutive aPTTs in the therapeutic range, whereas Kiser et al used the first aPTT in the therapeutic (goal) range in their data analysis. It is possible that fewer adjustments were required because a second confirmatory aPTT was not required, and any dosage adjustments for those cases that may have migrated and fallen outside the therapeutic range upon confirmation were not included in the data analysis as a rate change.
The average time to reach dose stabilization in Ansara et al’s study was 16.25 ± 12.7 hours in their standard nomogram group. This is in stark contrast to the median time of 5 hours (2-10 hours) to reach a therapeutic aPTT reported by Kiser et al and ours of 8 ± 4 hours in the PDI group. The difference may be because, in our study and that of Kiser et al, aPTT testing was more frequent, more starting dose options were used, and the nomograms were nursing driven instead of pharmacist driven. Specifically, the protocol employed by Ansara et al utilized pharmacists to execute the nomogram, initiated every patient at a dose of 0.5 or 2 μg/kg/min, and required aPTT draws every 3 hours in their standard nomogram group. This is different from both our analysis, and the one performed by Kiser et al in that aPTT draws were recommended every 2 hours, initial dosing could vary according to patient factors, and the nomogram execution was nursing driven. The lack of a reported average dose in the results of Ansara et al upon stabilization makes it difficult to explore the potential impact that starting all patients at a dose of 0.5 or 2 μg/kg/min (instead of offering the 0.5, 1, and 2 μg/kg/min options in our study) may have on time to dose stabilization. However, considering the average dose of 1.3 μg/kg/min at goal aPTT in the Kiser et al study and our study, it is likely that limiting our initial dosing to 0.5 or 2 μg/kg/min would have resulted in a delayed stabilization. Clearly, obtaining aPTTs and adjusting dose (ie, every 3 hours vs every 2 hours) less frequently will delay the time to reach a therapeutic aPTT. Although a clear cut case cannot be made regarding a nursing- versus pharmacist-driven nomogram, practically speaking there are differences that may favor nursing-driven protocols, particularly those related to communication and access. Being at the point of care and being responsible for drawing and sending laboratory test results, making the dosage adjustment, and round-the-clock availability at the bedside may speed up the turnaround between laboratory draw and any subsequent dosage adjustments that may be needed.
We observed that the time to reach a therapeutic aPTT was significantly shorter in the PDI group compared to the PA group. The only changes to practice associated with our institution’s nomogram change to predefined dosing increments from PAs were those related to the need for calculations by nursing before each dose adjustment. Considering that the number of rate changes did not differ between the groups, it is possible that the shorter time to a therapeutic aPTT in the PDI group may be explained by the removal of a manual dose calculation step. A nomogram that requires clinicians to interrupt workflow to manually calculate dosage adjustments and then in some instances seek validation from another clinician may not only be more risky but may also take more time to execute compared to a nomogram that does not. However, we did not collect data on the time to first aPTT collection or the time between aPTT collections, so we cannot exclude variations in the timing of laboratory draws as a possible contributor to the difference in time to reach a therapeutic aPTT.
Our study is the first to compare 2 methods for dosing argatroban, and our results are comparable to the previous analyses discussed here with respect to the number of dosage adjustments and the time to reach therapeutic anticoagulation. However, it is important to note that there are no data supporting improved clinical outcomes with argatroban dosing nomograms. Therefore, we have to look to other similar intravenous anticoagulants that we have much more experience with such as heparin to help guide us. Interestingly, there are no data supporting improved clinical outcomes with the use of heparin nomograms over standard of care. Although several retrospective studies have demonstrated improvement in both the time to reach a therapeutic aPTT and the time within a defined therapeutic range, they failed to demonstrate improvement in clinical outcomes, specifically reduced bleeding for those exceeding the therapeutic range. 11,12 However, leaving heparin monitoring and dosage adjustments to the discretion of each clinician is practically speaking unsafe. In addition, the studies examining the impact of anticoagulation services (ie, experts) on these outcomes standardized dosing via nomograms in their treatment arms. 18 Therefore, coupling the practical implications of not using nomograms and the data supporting the potential for nomograms to reduce the risk of bleeding and thromboembolic events, current national recommendations are to use dosing nomograms or protocols. 1,9
In summary, the results of this study indicate that there is a time advantage associated with our dosing nomogram based on predefined dosing increments (eg, 0.2 μg/kg/min) compared to one based on percentages. Further study is warranted to elucidate the clinical benefits of argatroban-dosing nomograms from both a resource and a safety standpoint.
Appendix A
Massachusetts General Hospital Argatroban Initial Dosing and Titration Nomograms
Initial dose of 0.5 μg/kg/min
Increase rate by 0.2 μg/kg/min
Increase rate by 0.1 μg/kg/min
No change
Decrease rate by 0.1 μg/kg/min
Decrease rate by 0.2 μg/kg/min
Hold and call responding clinician for new order
Initial dose of 1 μg/kg/min
Increase rate by 0.4 μg/kg/min
Increase rate by 0.2 μg/kg/min
No change
Decrease rate by 0.2 μg/kg/min
Decrease rate by 0.4 μg/kg/min
Hold and call responding clinician for new order
Initial dose of 2 μg/kg/min
Increase rate by 0.8 μg/kg/min
Increase rate by 0.4 μg/kg/min
No change
Decrease rate by 0.4 μg/kg/min
Decrease rate by 0.8 μg/kg/min
Hold and call responding clinician for new order
Initial doses of 0.1-2 μg/kg/min
Increase rate by 40%
Increase rate by 20%
No change
Decrease rate by 20%
Decrease rate by 40%
Hold and call responding clinician for new order
Footnotes
Declaration of Conflicting Interests
The author(s) declared no potential conflicts of interest with respect to the research, authorship, and/or publication of this article.
Funding
The author(s) received no financial support for the research, authorship, and/or publication of this article.