
Abstract
We present a new multilingual 14-item scale for measuring science literacy in survey and experimental research. The scale captures three essential dimensions of science literacy in a digital world: civic science literacy, science media literacy, and cognitive science literacy. We developed, tested, and validated the scale through two preregistered national quota surveys in Switzerland and the United States in four languages (English, German, French, Italian). Iterative factor analyses, Bayesian Item Response Theory analyses, and validity tests confirm robustness and reliability of the scale.
Keywords
Introduction
Science literacy has been widely discussed in the concept’s 70-plus years of existence (Osborne, 2023). At its most basic, science literacy is conceived as the ability to understand and use science. This can include “science” as particular scientific facts, a method of inquiry, and a social and human endeavor (National Academies of Sciences, Engineering, and Medicine [NASEM], 2016).
A commonality across the wide range of definitions is the idea that science literacy matters not only for the sake of the knowledge and skills it entails but also for what those knowledge and skills enable people to do and, often, not to do. While many conceptions focus on science literacy as necessary for accessing science (e.g., NASEM, 2016), most also extend to how access enables people to do science (e.g., be scientists), support science, or “function minimally in society” as consumers and citizens (Laugksch, 2000, p. 82). Further conceptions emphasize more intangible benefits, including “a richer, more satisfying, and more exciting view of the universe” (Laugksch, 2000, p. 77), lifelong learning, or opportunities for “happier, more successful, or more politically savvy lives” (Feinstein, 2011, p. 169). Science literacy is also seen as important for enabling people to navigate contentious, emotional public debates, or misinformation on socio-scientific issues (Howell & Brossard, 2021). This includes questions of how literacy empowers people in their actions and decision-making—such as seeking information on benefits and risks of vaccinations—and supports collective deliberation around democratic questions of “What should we do?” (Levine, 2022).
Over past decades, explications of science literacy tended to focus on factual knowledge of science and civic science literacy (Osborne, 2023). Few conceptualizations considered the fuller range of abilities people likely use to be active interpreters of science-relevant information. This range of abilities has grown considerably: People now navigate a world where science is inseparable from broader society and the digital media ecologies that shape both science and society. The rise of questions about access to information and about information quality has further promoted this trend, as have accelerating challenges such as artificial intelligence (AI), the climate crisis, or the COVID-19 pandemic.
Howell and Brossard (2021) approached this gap in the literature with a novel conceptualization of science literacy in digital societies, proposing three components people would rely on to access and use science-related information. They encompass (a) comprehending scientific information and how it is produced and intertwined with society (civic science literacy), (b) accessing and assessing science information as it spreads through a diverse set of media (science media literacy), and (c) recognizing common cognitive biases humans fall prey to when seeking and interpreting such information (cognitive science literacy).
However, a significant gap remains: There is yet no social-scientific instrument to measure whether, and to what extent, people have the skills and knowledge included in Howell and Brossard’s (2021) framework. Our study addresses this gap. We developed and validated a survey instrument—a 14-item survey scale—based on that framework. We tested it in four languages (English, German, French, Italian) using nationally representative samples in Switzerland and the United States (US). This article presents the instrument and describes its potential for expanding our understanding of science literacy across cultures and contexts. Overall, our work advances research on the wider range of relevant science literacies that people employ and contributes to science education and communication practice working toward these literacies.
Conceptual Framework and Literature Review
Conceptualizing Science Literacy
Prior Approaches
Scholars have defined and measured science literacy in a variety of ways (Glynn & Muth, 1994; Laugksch, 2000; Miller, 1983; Shen, 1975). Definitions and measures often focused on factual science knowledge but also expanded to include knowledge and skills that transcend particular scientific issues. These include knowledge of “how science works” or the nature of science; knowledge of what counts as science; ability to independently learn science; ability to think “scientifically” and use scientific knowledge in problem-solving; socio-scientific reasoning; appreciation of, and other attitudes related to, science; knowledge of science’s risks and benefits; and the ability to think critically about science (American Association for the Advancement of Science [AAAS], 1993; Bauer et al., 2007; Elhai, 2023; Feinstein, 2011; Kawamoto et al., 2013; Miller, 1983; Romine et al., 2020). However, scholarship has gained greater understanding of how changing science-society relations and information systems alter conceptions of “what it means to be a science-literate citizen” (Howell & Brossard, 2021, p. 1). Science has become simultaneously more specialized and more intertwined with governance and people’s daily lives and information diets, accompanied by profound ethical dilemmas as exemplified by advances in biotechnology and AI research and applications (Jasanoff & Kim, 2015).
Many approaches to theorizing or measuring science literacy have been described as taking a deficit-model approach presuming a naïve public that lacks science literacy, is hostile to (often undefined) “science,” and therefore needs more scientific knowledge to support science (Kankaria & Chakraborty, 2024). However, scholarship has gained greater understanding of the various relevant capacities, motivations, and agencies people hold, of how people interact with science, and of the media environments they act within. This includes, for example, recognition that people have inherent scientific capabilities for exploratory learning, curiosity, and critical thinking (e.g., Elhai, 2023). Particularly relevant to this study, this increased understanding includes greater focus on how people learn about science not only by direct experience, formal education, and traditional news media (Brossard & Shanahan, 2006), but also through navigating the contemporary digital information environment (Son & Ha, 2024).
Science Literacy in Digital Communication Environments
As social media became a dominant source of information and arena for public discourse over the past decade, people gained access to more scientific information than ever before (Mendonça & Castelfranchi, 2022). New information creators and “gatekeepers” emerged, including social media companies (Brossard & Scheufele, 2022). The result has been a more complicated socio-scientific discourse with more opportunities for varied and diverging viewpoints to spread faster, and at greater scales.
Accordingly, the idea of a dominant, easily coherent narrative regarding “science” weakened. This also reduced the ability of older, more simplistic conceptualizations of science literacy to sufficiently respond to reality. Polarized or misinformation-rife discourse in many parts of the world escalated these changes (Sharon & Baram-Tsabari, 2020). Discussions about science literacy, then, increasingly reflected the belief that a broader understanding of literacy is needed to describe how people navigate this complex world of science, media, and broader society and better resist the impacts of misinformation and polarization (Howell & Brossard, 2021).
An Updated Model for Science Literacy—Civic, Media, and Cognitive Literacy
Howell and Brossard (2021), therefore, put forth a conception of science literacy focused on knowledge and skills people might reasonably need, use, and be able to gain to be informed decision-makers in contemporary society. They were interested as well in what types of literacies would support people in developing their own literacies by engaging with science outside formal education settings. Howell and Brossard proposed a science literacy framework with three dimensions, corresponding to stages in science information’s life cycle in the public sphere, from production to dissemination to personal interpretation:
Civic science literacy, reconceptualizing Miller’s (1998) definition (expanding the conceptualization by Shen, 1975), focused on understanding and awareness of how scientific information is produced and used, including methods for conducting and interpreting research, decisions on research agendas, and other aspects concerning resources, people, norms, goals, institutions, and processes that shape scientific knowledge production;
Digital media literacy, focused on understanding of how science and socio-scientific information appears and spreads through modern media systems, and on skills people use to find and evaluate such information;
Cognitive literacy, focused on metacognitive skills people use to understand cognitive biases shaping information seeking and evaluation, including how those biases might shape one’s own reasoning and opinions.
Howell and Brossard theorized that these three dimensions are distinct yet overlapping in many cases, with aspects of each interacting and changing in importance in different contexts. They also assumed that the dimensions might appear and be used differently at community versus individual levels, such that individuals’ distinct levels of science literacy contribute to a larger collective literacy. With this framework, they proposed areas for empirical research to explore the manifestations, changes, and impacts of these literacies across different contexts.
Measuring Science Literacy and the Need for a New Instrument
The diverse conceptions of science literacy have translated into many different associated measurements. None, however, address science literacy as conceptualized by Howell and Brossard (2021) to investigate the range of abilities people may use in navigating socio-scientific issues. While some measurements include aspects of civic science literacy, media literacy, and/or metacognition, no instrument we know of, as described in the sections that follow, operationalize all three dimensions.
Measures of Civic Science Literacy
Many instruments have included aspects of civic science literacy, albeit often using other terms. These include Miller’s (1998) civic scientific literacy survey, which, building on Shen’s (1975) conception of civic science literacy, includes items on knowledge of basic scientific constructs (e.g., atoms, DNA), processes of science, and science’s societal impacts. This survey informed the US Science and Engineering Indicators items (National Science Board, 2010) and other surveys designed for broader public and student samples, such as national surveys of the Chinese public (Liu et al., 2024) and Laugksch and Spargo’s (1996) Test of Basic Science Literacy (TBSL) designed for South African students.
Several other instruments have focused on aspects that align with Howell and Brossard’s conceptualization of civic science literacy. These include measures capturing people’s understanding and reasoning skills concerning the nature of science (Lederman et al., 2002; Temel et al., 2018), scientific approaches (Benjamin et al., 2017; Fives et al., 2014; Kahan, 2017; Liu et al., 2024), scientific institutions (Bauer et al., 2000), and a range of further socio-scientific issues (Atta et al., 2020; Choi et al., 2011; Coppi et al., 2023; Fives et al., 2014; Romine et al., 2020). Choi et al. (2011) and Fives et al. (2014) provide useful tables comparing instruments relevant to civic science literacy.
Many of the instruments cited above, however, require large batteries of items and open-ended questions (Liu et al., 2024). This can limit their utility for researchers with fewer resources for fielding lengthy surveys or conducting research via telephone, for example. Some instruments, especially those focused on scientific facts, also seem to be somewhat atheoretical, reflecting a collection of ad hoc quiz items (for critiques, see the studies by Bauer et al., 2007; Elhai, 2023; Roos, 2014). Creating items that capture civic science literacy as Howell and Brossard (2021) conceptualized it, then, would fill an important need in literacy research.
Measures of Science Media Literacy
None of the existing instruments incorporate both of the other two dimensions Howell and Brossard proposed: science media literacy and metacognition. But a few include items capturing one or the other. Some scholars developed items focused on science facts that students (Rundgren et al., 2012) and broader publics (Brossard & Shanahan, 2006) could expect to encounter in news media. Fives et al. (2014), in early versions of a science literacy scale for school students, included a science media literacy dimension, which they described as the ability to critique findings portrayed in mass media by assessing the validity of scientific reporting and questioning evidence sources. Similarly, Gormally et al. (2012), focusing on undergraduates, developed a science literacy instrument that included items asking respondents to judge the credibility of online science information sources. More recent measures—which reflect the current state of digital information environments—either do not exist to our knowledge or focus on very specific skills and settings, such as Son and Ha (2024) who developed a scale to assess students’ digital literacy in the context of science practice.
Measures of Cognitive Science Literacy
Even fewer studies have included metacognition as part of science literacy. Although Glynn and Muth (1994) conceived of metacognition as a crucial science literacy component already 30 years ago, only the Global Scientific Literacy Questionnaire, as far as we know, measured metacognition as a dimension of science literacy (Mun et al., 2015, building on Choi et al., 2011). This questionnaire, designed for South Korean classrooms, focused on “intellectual resources and value orientation necessary to live in a global society” (p. 671). Other instruments contain distinct but possibly related concepts that do not measure metacognitive awareness per se but overlap with or require such awareness. These include “habits of mind,” critical thinking, or variations of “scientific reasoning” related to identifying how science might be useful in solving a problem (Kahan, 2017; Krell et al., 2022). Liu et al. (2024), for example, recently developed and validated a measure of civic science literacy that includes problem-solving as a dimension.
Our focus, therefore, was on creating a measure that extends from these existing studies to operationalize Howell and Brossard’s conception of science literacy as entailing civic science, media, and cognitive literacies.
Scale Development and Validation
We conducted two preregistered studies. In Study 1, we tested a set of 21 items in a national quota survey in Switzerland (N = 1,122; August–September 2022) and found a robust three-dimensional scale consisting of 14 items. In Study 2, we validated this scale in a second nationally representative quota survey in the US (N = 1,000; January 2024). The studies received ethical approval by the institutional review boards at the University of Zurich (Study 1) and the University of Wisconsin–Madison (Study 2) prior to data collection. All analyses are fully reproducible with data and code available at https://osf.io/v9tc5.
Study 1: Population Survey in Switzerland
Preregistration
The research questions and hypotheses of Study 1 (see Supplemental Table S1), data-collection procedures, variables, and statistical analyses were preregistered at the Open Science Framework: https://osf.io/x2drc/ (see Supplemental Materials for details).
Item Development
We devised 21 survey items based on scholarship from science communication, science education, media literacy, and cognitive psychology (see Table 1 for an overview). Eighteen items asked respondents if statements like “An essential part of science is scientists checking the quality of each other’s work” are true or false and how confident they were about their answer (1 = I am confident that this is false, 2 = I am somewhat confident that this is false, 3 = I am somewhat confident that this is true, 4 = I am confident that this is true). Three items measured self-reported literacy skills such as whether respondents believe they “understand most news about scientific issues,” using 5-point Likert-type scales (1 = strongly disagree to 5 = strongly agree). All items had a “don’t know” response option.
Overview of the 21 Items Tested in Study 1 and Results of Bayesian 2PL IRT Modeling (Study 1).
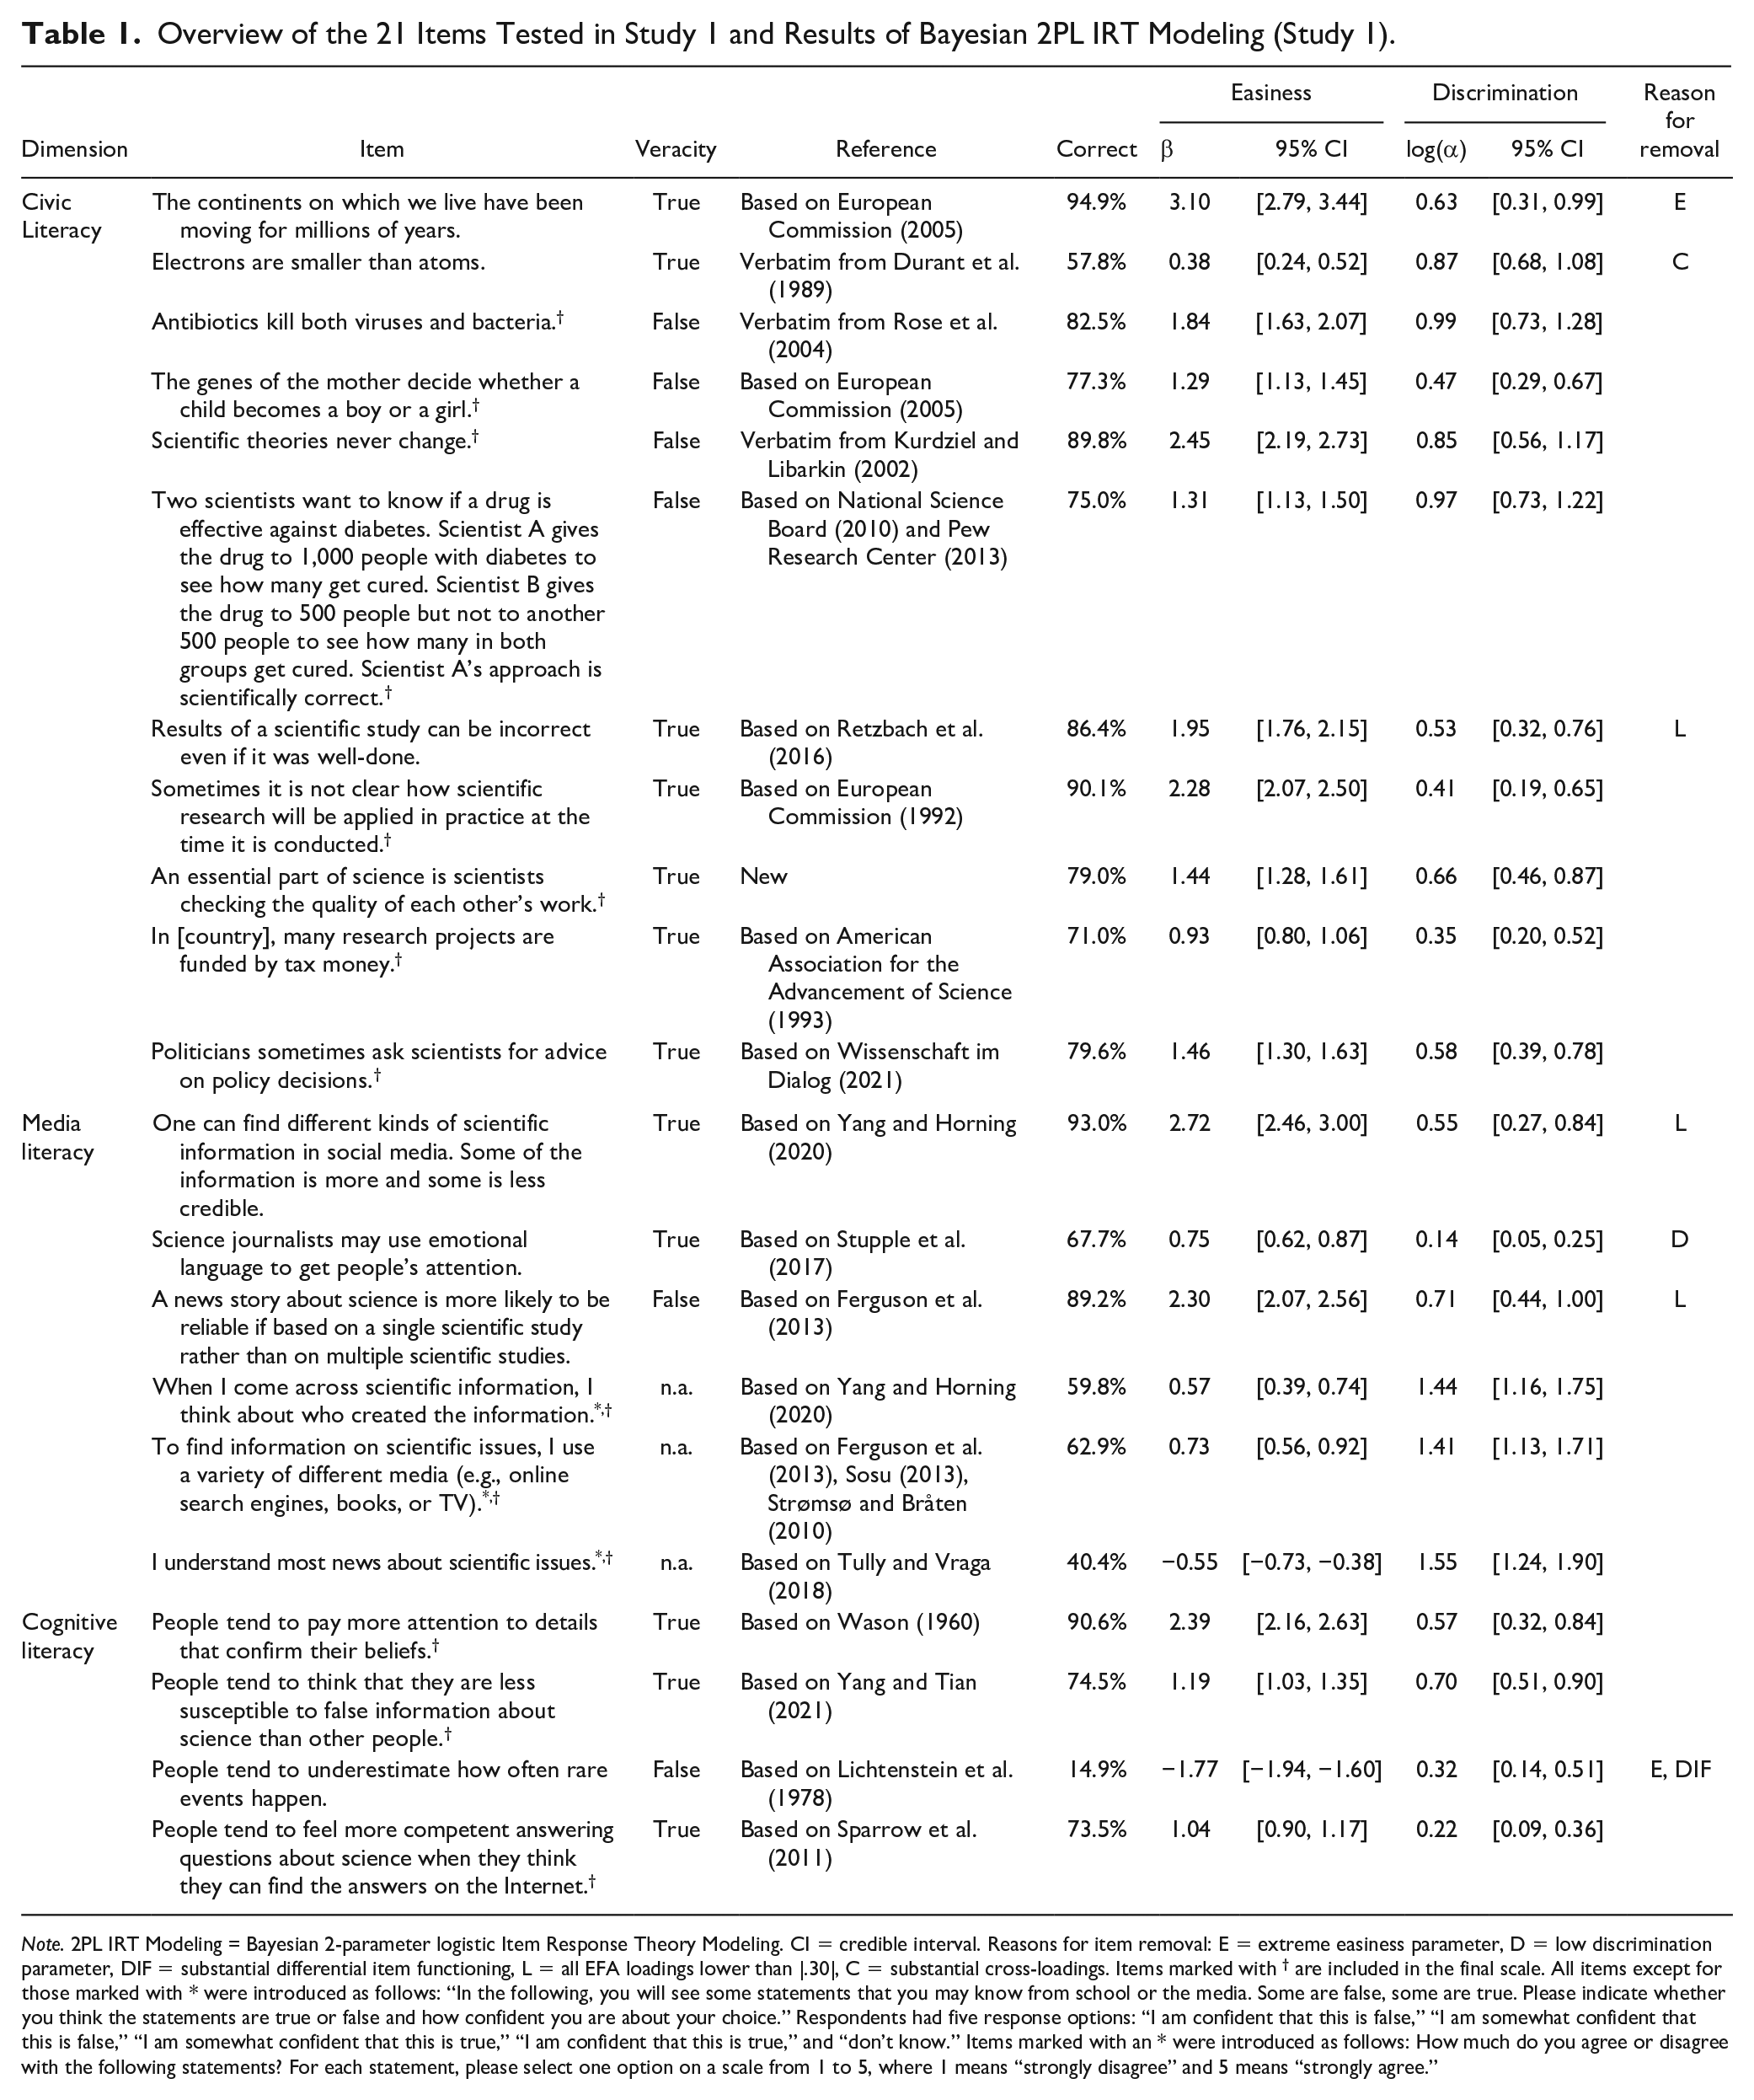
Note. 2PL IRT Modeling = Bayesian 2-parameter logistic Item Response Theory Modeling. CI = credible interval. Reasons for item removal: E = extreme easiness parameter, D = low discrimination parameter, DIF = substantial differential item functioning, L = all EFA loadings lower than |.30|, C = substantial cross-loadings. Items marked with † are included in the final scale. All items except for those marked with * were introduced as follows: “In the following, you will see some statements that you may know from school or the media. Some are false, some are true. Please indicate whether you think the statements are true or false and how confident you are about your choice.” Respondents had five response options: “I am confident that this is false,” “I am somewhat confident that this is false,” “I am somewhat confident that this is true,” “I am confident that this is true,” and “don’t know.” Items marked with an * were introduced as follows: How much do you agree or disagree with the following statements? For each statement, please select one option on a scale from 1 to 5, where 1 means “strongly disagree” and 5 means “strongly agree.”
The 21 items covered the three literacy dimensions described by Howell and Brossard (2021). We measured civic science literacy with 11 items asking respondents whether they know about basic scientific facts and scientific methods, how science operates, and science’s roles in society. The media literacy dimension was operationalized with six items capturing the extent to which people feel able to and know how to assess and understand quality science information in online media and news reporting. The cognitive literacy dimension captured awareness of four cognitive biases relevant in the “science information life cycle” (Howell & Brossard, 2021, p. 1), that is, the confirmation bias (Evans, 2016), the third-person effect (McLeod et al., 2001), the availability heuristic (Tversky & Kahneman, 1973), and the “Google effect” (Sparrow et al., 2011). We fact-checked and pretested all statements to ensure they are clearly correct or incorrect.
Almost all items were taken from major population surveys on science attitudes (AAAS, 1993; European Commission, 2005; National Science Board, 2010; Pew Research Center, 2013) and established scales measuring science knowledge, digital literacy, and metacognitive abilities (Ferguson et al., 2013; Retzbach et al., 2016; Strømsø & Bråten, 2010; Stupple et al., 2017). We focused on items that have proven to be valid literacy indicators (Kahan, 2017) and avoided items that have been criticized in the past, such as items using normative formulations and questions about evolution, climate change, and other controversial science issues, because these may be too confounded by people’s political views, religiosity, and attitudes toward science (Roos, 2014). For example, we used items asking if “electrons are smaller than atoms,” which arguably captures primarily, if not only, knowledge rather than values (Kahan, 2017).
We adopted many items verbatim (e.g., Durant et al., 1989) and slightly rephrased some items so that they apply to science (e.g., Tully & Vraga, 2018). We also developed a new item capturing knowledge about scientific peer review, which is an important facet of civic science literacy (Howell & Brossard, 2021). Moreover, we developed four new items for the cognitive literacy dimension, because research on cognitive biases usually measures people’s susceptibility to these biases rather than their knowledge about them (Teovanović et al., 2021) or uses multiple-choice questions that are less useful for us (Legaki et al., 2021).
Translation and Pretests
The research team, comprising native German and English speakers with profound expertise on science literacy and survey research, translated all items to German. The translations were pretested by other researchers and students familiar with the research context at the University of Zurich and the University of Wisconsin–Madison. Professional translators then translated the items to French and Italian, except where validated translations already existed (Schäfer et al., 2018). These translations were double-checked by the research team and pre-testers and improved if necessary.
Methods and Data
All 21 items were included in the 2022 wave of the “Science Barometer Switzerland”, a longitudinal, national population survey in Switzerland. We drew on the online survey of the Science Barometer conducted in August and September 2022. It relied on a national sample of the Swiss population aged 15 years and older (N = 1,112; age: M = 50.2, SD = 15.9; gender: 50.3% female; education: 54.3% post-secondary degree; see Supplemental Table S2) and was collected with locked quotas for age × gender × linguistic region (the German-, French-, and Italian-speaking parts of Switzerland). Age and gender quotas matched the distribution of the Swiss population, but French- and Italian-speaking respondents were oversampled to achieve sufficient coverage of these small strata. Therefore, our analyses generalize to the Swiss population in terms of age and gender.
Respondents consented before taking the survey and were debriefed about the veracity of the literacy items upon completion. Median completion time was 17 minutes. The survey also contained questions about sociodemographic characteristics (age, gender, education, place of residence), sociopolitical worldviews (political orientation, religiosity), and constructs for validity analyses (e.g., interest in science, trust in science, self-perceived knowledge about science, information seeking; see replication materials for the full questionnaire).
We took several measures to increase the quality and validity of the data. For example, we added two attention checks to the questionnaire and excluded respondents who completed the survey exceptionally fast. See the Supplemental Materials for details.
Analysis
We dichotomized all items for the analyses: Correct answers to the true-false items and agreement with the agree-disagree items were coded as 1, and incorrect answers and disagreement were coded as 0. This approach has been applied by similar studies (e.g., Mede et al., 2024). We used it as it resolved issues with data handling and model convergence and because we were interested in respondents’ science literacy rather than confidence about their literacy.
We conducted four sets of analyses using R version 4.4.0. First, we fitted Bayesian 2-parameter logistic Item Response Theory (2PL IRT) models to identify items that had varying easiness parameters but were not too difficult or easy, had high discrimination parameters, and showed sufficient cross-lingual invariance, that is, no “differential item functioning” (Bürkner, 2021). This analysis, including the 2PL model specifications, was based on the work by Mede et al. (2024), who developed a measure for people’s knowledge about COVID-19 and epidemiology. Model priors can be found in the R code shared at https://osf.io/v9tc5. Second, we ran a series of parallel analyses and exploratory factor analyses (EFAs) to determine factor structures and exclude items with low loadings and cross-loadings. The EFAs used oblique rotation—because the literacy dimensions are presumably correlated—and relied on tetrachoric correlation matrices, which are most useful for dichotomous data. We employed principal axis (PA) instead of maximum likelihood (ML) factoring because PA outperforms ML factoring if multivariate normality is violated as was the case with our data, where Mardia’s skewness = 12,226.60 and Mardia’s kurtosis = 41.54 (Watkins, 2018). Third, we conducted confirmatory factor analyses (CFAs) to investigate scale performance and measurement invariance across languages. To avoid Heywood cases and under-identification, we had to constrain a few variances to be equal to or higher than zero (Dillon et al., 1987). Fourth, we assessed the internal consistency of the scale based on Kuder-Richardson 20, Omega, and Guttman’s Lambda 4 reliability estimates and tested the scale’s convergent validity with linear regressions.
Results
Before the iterative scale development analyses, we inspected inter-item correlations for all 21 items. We found several strong correlations above Pearson’s r = 0.55 within the same literacy dimensions. A few items from different dimensions also had notable correlations of Pearson’s r = 0.30, which is plausible given that the three literacy components have overlaps and condition each other (Howell & Brossard, 2021). However, most items from different dimensions had very weak correlations, many below Pearson’s r = 0.01. This indicates that our item pool was generally well-suited for a multi-dimensional scale of homogeneous and distinct subscales.
Bayesian 2PL IRT analysis
The IRT model suggested removing three items from the 21-item set because of extreme easiness parameters or very low discrimination parameters. The item “The continents on which we live have been moving for millions of years” was exceptionally easy (β = 3.10; 95% credible interval: [2.79, 3.44]; see Table 1 and Supplemental Figure S1). Almost every respondent knew the answer, including many respondents for whom the model predicted they would give an incorrect answer. The item “Science journalists may use emotional language to get people’s attention” showed very low discrimination, with log(α) = 0.14 (95% CI: [0.05, 0.25]), between literate and illiterate individuals. This may be because the item measures an underlying attitude toward science journalism rather than the media literacy dimension. The item “People tend to underestimate how often rare events happen” exhibited particularly low easiness (β = 1.77; 95% CI: [1.94, 1.60]), with few respondents answering correctly even if the model expected them to know the answer. This may be due to the double negation in the item. Moreover, this item showed differential item functioning (DIF), as the easiness parameter of the German item was substantially higher than the easiness parameters of the French and Italian versions. This indicates that the item has high semantic variance across languages. We also found DIF for a few other items, for example, “Electrons are smaller than atoms,” whose German translation was more difficult than the French and Italian translations (Figure 1). However, we retained this item because it had comparatively high discrimination and submitted the remaining 18 items to EFAs.
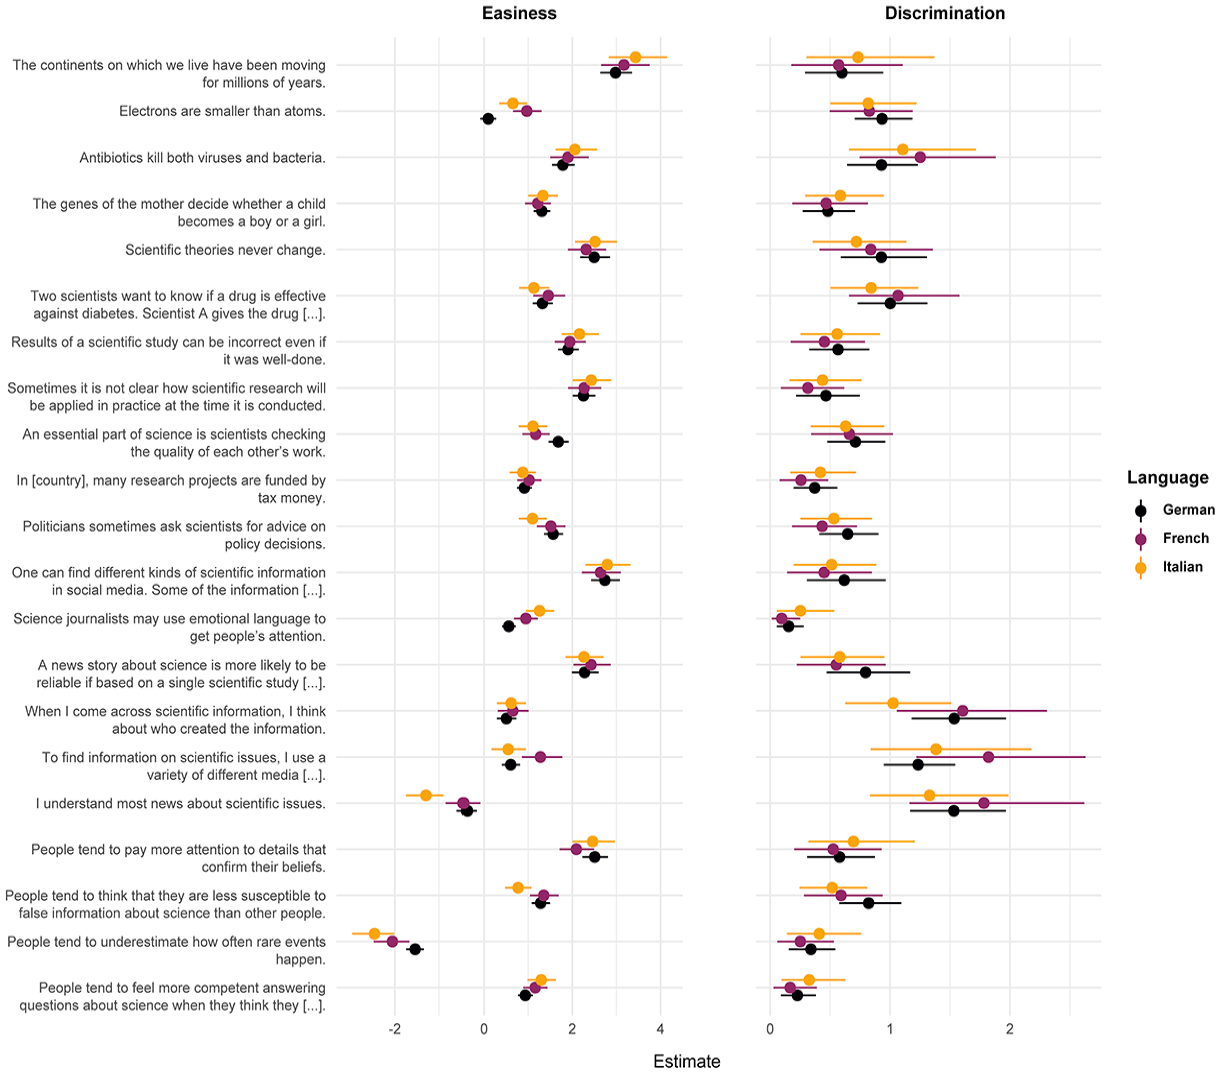
Results of Bayesian 2-Parameter Logistic IRT Model With DIF (Study 1)
Exploratory factor analyses
Tetrachoric parallel analyses showed that the 18 remaining items loaded on four factors. This factor structure was largely driven by the civic literacy items, which, plausibly, spread across all factors. For example, four items measuring factual and procedural science knowledge loaded on one factor, and two measuring knowledge of science’s roles in society formed another factor (see Supplemental Table S3). This suggests that the civic literacy dimension consists of multiple lower-order factors. We confirmed this with parallel analyses. These analyses identified three factors within the civic literacy dimension and indicated unidimensionality for the remaining media literacy items and the remaining cognitive literacy items. However, the three civic literacy factors were not very stable. The item “Electrons are smaller than atoms” had considerable cross-loadings and was thus a less-informative civic literacy indicator, so we removed it from the scale. The item “Results of a scientific study can be incorrect even if it was well-done” had loadings smaller than |0.30|, so we dropped it, following common recommendations for EFA (Costello & Osborne, 2005). This left three robust lower-order factors in the civic literacy dimension, capturing knowledge about scientific facts and procedures, science’s modus operandi, and science’s role in society (see Supplemental Table S4). We then sought to increase the coherence of the media literacy and cognitive literacy factors as well, removing two items with cross-loadings and loadings smaller than |0.30|: “One can find different kinds of scientific information in social media. Some of the information is more and some is less credible,” and “A news story about science is more likely to be reliable if based on a single scientific study rather than on multiple scientific studies.” Finally, we ran a multilevel EFA of the remaining 14 items, which verified that they map onto three higher-order factors largely corresponding with the civic, media, and cognitive literacy dimensions conceptualized by Howell and Brossard (2021) and additionally, three lower-order factors within the civic literacy factor (see Table 2 and Supplemental Table S5). 1 We thus arrived at a stable, theoretically plausible 14-item scale for measuring science literacy on three higher-order dimensions.
Lower-Level Results of Multilevel EFA With the Final 14-Item Scale (Study 1).
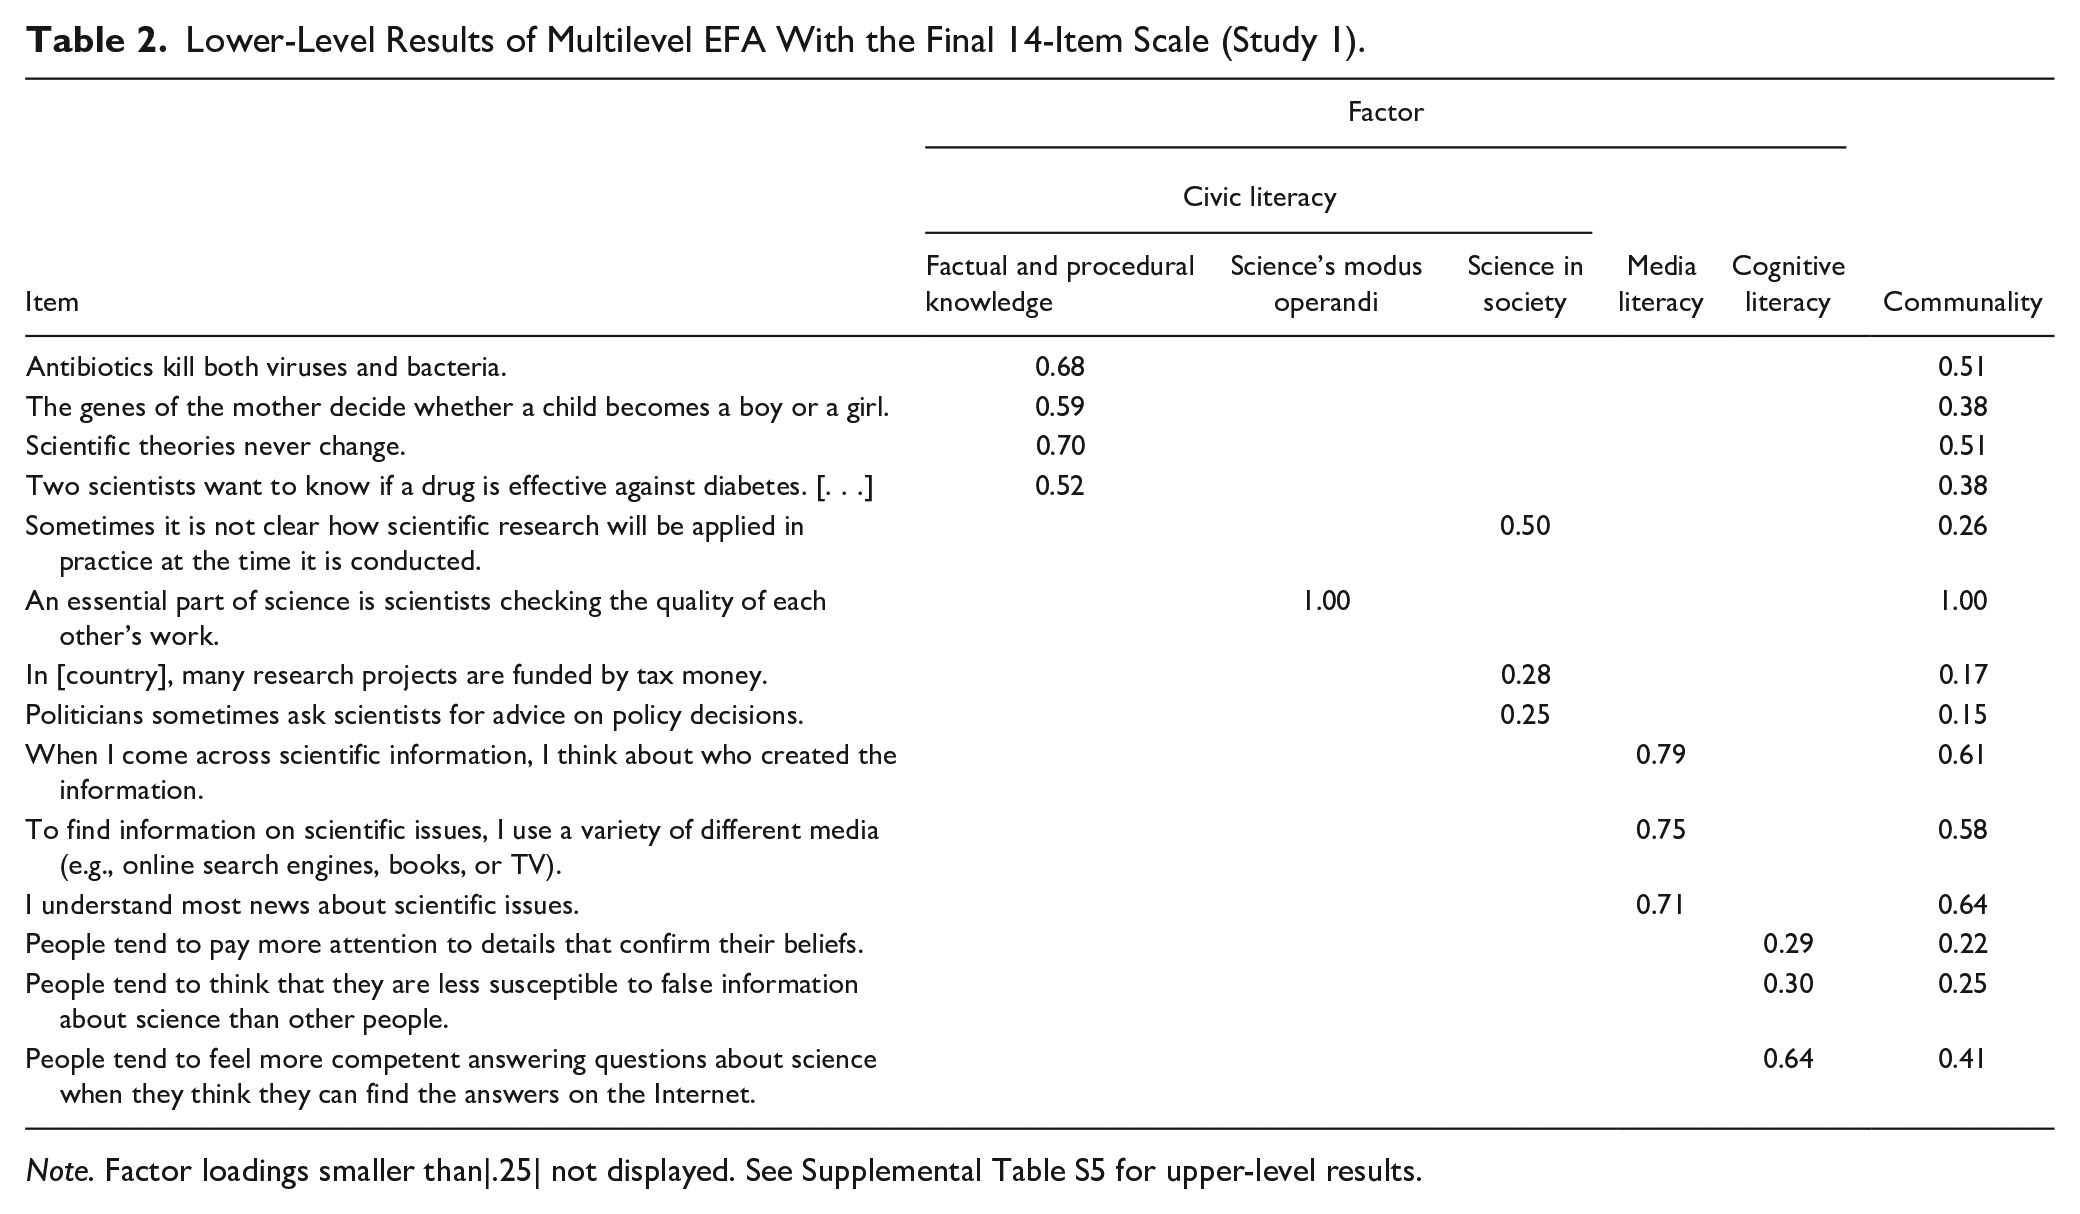
Note. Factor loadings smaller than|.25| not displayed. See Supplemental Table S5 for upper-level results.
Confirmatory factor analyses
CFA that modeled the EFA loading patterns and factor structure of the final 14-item scale 2 indicated very good global and local fit. Fit indicators were clearly within established thresholds (χ2 = 109.352, df = 72, p = .003; root mean square error of approximation [RMSEA] = 0.022, standardized root mean square residual [SRMR] = 0.060, comparative fit index [CFI] = 0.975, Tucker–Lewis Index [TLI] = 0.969), and all loadings were significant at p < .001 (Hu & Bentler, 1999). Results of multi-group CFAs were mixed. We found excellent fit for the configural model (χ2 = 228.732, df = 220, p = .329; RMSEA = 0.010, SRMR = 0.085, CFI = 0.995, TLI = 0.993). The metric and scalar models also exhibited good fit but did not perform significantly better than the configural model. Correspondingly, we found three non-significant loadings in the French-speaking subsample and four non-significant loadings in the Italian-speaking subsample, while the German scale version performed very well. This shows that the scale has slightly limited measurement invariance across the three languages.
Internal consistency and validity tests
The internal consistency of the overall scale was mediocre (Kuder-Richardson 20 = 0.56, Omega = 0.61, Guttman’s Lambda 4 = 0.65; see Supplemental Table S6). Reliability estimates for the civic and cognitive literacy subscales were even less ideal, which is partly because scale performance varied between German, French, and Italian (see Supplemental Table S5). Results of linear regressions indicated that several conceptually related constructs were strongly associated with respondents’ science literacy, including post-secondary education (β = 0.65, SE = 0.06, p < .001), interest in science (β = 0.45, SE = 0.03, p < .001), trust in science (β = 0.29, SE = 0.06, p < .001), self-perceived knowledge (β = 0.52, SE = 0.03, p < .001), seeking out science information (β = 0.51, SE = 0.03, p < .001), and agreeing that it is important to be informed about science (β = 0.42, SE = 0.03, p < .001). This shows that the overall scale has high convergent validity. In sum, Study 1 allowed us to translate Howell and Brossard’s (2021) conceptualization of science literacy into a coherent, multi-dimensional 14-item survey scale in three languages.
Study 2: Representative Quota Survey in the US
Preregistration
Study 2 investigated the measurement performance and psychometric properties of the 14-item scale and validated it in a different context (the US) and fourth language (English), testing 5 main hypotheses and 16 sub-hypotheses (see Supplemental Table S1). The hypotheses were based on the results of Study 1. For example, we hypothesized that we would confirm the factor structure of the 14-item scale (H1) and find significant CFA loadings (H1a) within the same range of Study 1, that is, between λ = 0.218 and λ = 0.774 (H1b). We preregistered the hypotheses and all methodological and analytical procedures including quota targets, power analyses, and R code for IRT and CFA models before data collection at the OSF: https://osf.io/gmw3x. (see Supplemental Materials for details).
Methods and Data
We included the English version of the 14-item scale in a preregistered online survey in the US. It was conducted in January 2024 and used nationally representative quotas that reflected US-population margins for national distributions of age, gender, and level of education (U.S. Census Bureau, 2022, 2023). 3 The survey drew on a sample of N = 1,000 respondents aged 18 years and older (age: M = 46.8, SD = 17.4; gender: 51.1% female; education: 14.0% postgraduate degree; see Supplemental Table S2), who gave informed consent before the survey and received debriefing similarly to the Study 1 respondents. Median completion time was 13.6 minutes.
We ran a priori model-based power analyses to determine the sample size. They used the loading matrix of the 14-item CFA and the regression estimates of the validity tests in Study 1 as input data. Results indicated that we needed a minimum sample size of N = 772 to detect CFA loadings equal to or bigger than λ = 0.218 (the smallest loading found in Study 1) and a minimum sample size of N = 479 to detect regression effects equal to or bigger than b = 0.085 (the smallest effect found in Study 1) with a power of 0.95 at α ≤ 0.001. 4 To ensure that the study would have power to detect even smaller loadings and effects, we targeted a sample size of N = 1,000, which we reached exactly.
The questionnaire contained measures for sociodemographic characteristics and many of the attitudinal measures used in Study 1. It also included additional questions for more rigorous validity tests, for example, five items measuring the need for cognition (Epstein et al., 1996) and two items from the actively open-minded thinking short scale (Haran et al., 2013). To ensure data quality, we included two attention checks and filtered respondents who failed them (see https://osf.io/xazym for the full questionnaire). We used several strategies to increase data quality, including attention checks, duplicate checks, and outlier analyses (see Supplemental Materials).
Analysis
We tested all main hypotheses and sub-hypotheses as preregistered, with three minor exceptions (see Deviations from the preregistration in Study 2 in the Supplemental Materials). The analytical procedures replicated most of those of Study 1: The literacy items were again dichotomized, and we used the same model syntax, Bayesian priors, estimators, and R packages for the CFAs and the IRT analyses. Moreover, we ran preregistered additional analyses that went beyond those of Study 1, including regressions testing if sociodemographic characteristics were related to answering “don’t know” or preferring “confident” over “somewhat confident” answers, as well as further tests of the convergent and discriminant validity of the scale.
Results
We found full support for 11 of the 16 hypotheses and partial support for the remaining five (see Supplemental Table S1 for an overview). Hence, we were able to verify the (H1) factor structure, (H2) internal consistency, (H3) individual item performance, (H4) convergent validity, and (H5) discriminant validity of the 14-item scale.
Factor structure (H1)
A CFA fitting the Study 1 measurement model onto the Study 2 data indicated significant loadings at p < .001. Factor loadings were even higher than those in Study 1, ranging between λ = 0.495 and λ = 0.816. Accordingly, the 14 items can all be considered informative indicators of science literacy. The magnitudes of loadings differed only slightly between the two studies: For example, the item “Antibiotics kill both viruses and bacteria” was a more potent indicator of civic literacy in Switzerland than in the US, whereas the opposite applied to the item “Scientific theories never change.” Model fit was excellent: All goodness-of-fit indices met rigorous thresholds (χ2 = 86.824, df = 72, p = .112; RMSEA = 0.014, SRMR = 0.052, CFI = 0.995, TLI = 0.993) and exceeded those found in Study 1. These results confirm that the 14-item scale consists of three robust higher-order factors that map onto the civic, media, and cognitive literacy dimensions, as well as three distinctive lower-order factors within the civic literacy dimension that are identical with those in Study 1.
Internal consistency (H2)
We found significant Pearson correlations of items within the same dimension and significant correlations of the full scale, the subscales, and their respective indicators (all p < .001). This is further evidence for the scale’s robustness. Reliability analyses corroborated its internal consistency: Kuder-Richardson 20 values ranged between 0.50 and 0.70, Omega between 0.50 and 0.74, and Guttman’s Lambda 4 between 0.48 and 0.78. The cognitive literacy dimension showed rather low internal consistency, and the media literacy dimension had higher reliability, mirroring Study 1 findings. Reliability estimates for the full 14-item scale were good (see Supplemental Table S7). All were higher than those in Study 1, suggesting that the English version has slightly better performance than the version in German, French, and Italian.
Individual item performance (H3)
We were able to confirm that the 14-item scale has no exceptionally easy or difficult items (see Table 3). The item “People tend to pay more attention to details that confirm their beliefs” was not challenging for most respondents (89% correct answers), but more than every tenth answered incorrectly. The item “Two scientists want to know if a drug is effective against diabetes. [. . .]” received many wrong answers (54% correct answers), but more than half the sample answered correctly. IRT models showed that the scale caters well to respondents with different literacy levels, as easiness parameters varied somewhat yet not excessively, ranging from 0.30 to 2.56 (Table 3). Discrimination parameters were sufficient and clearly higher than those in Study 1, confirming that the scale has high capability to distinguish between more- and less-literate individuals.
Final 14-Item Scale and Results of Bayesian 2PL IRT Modeling (Study 2).
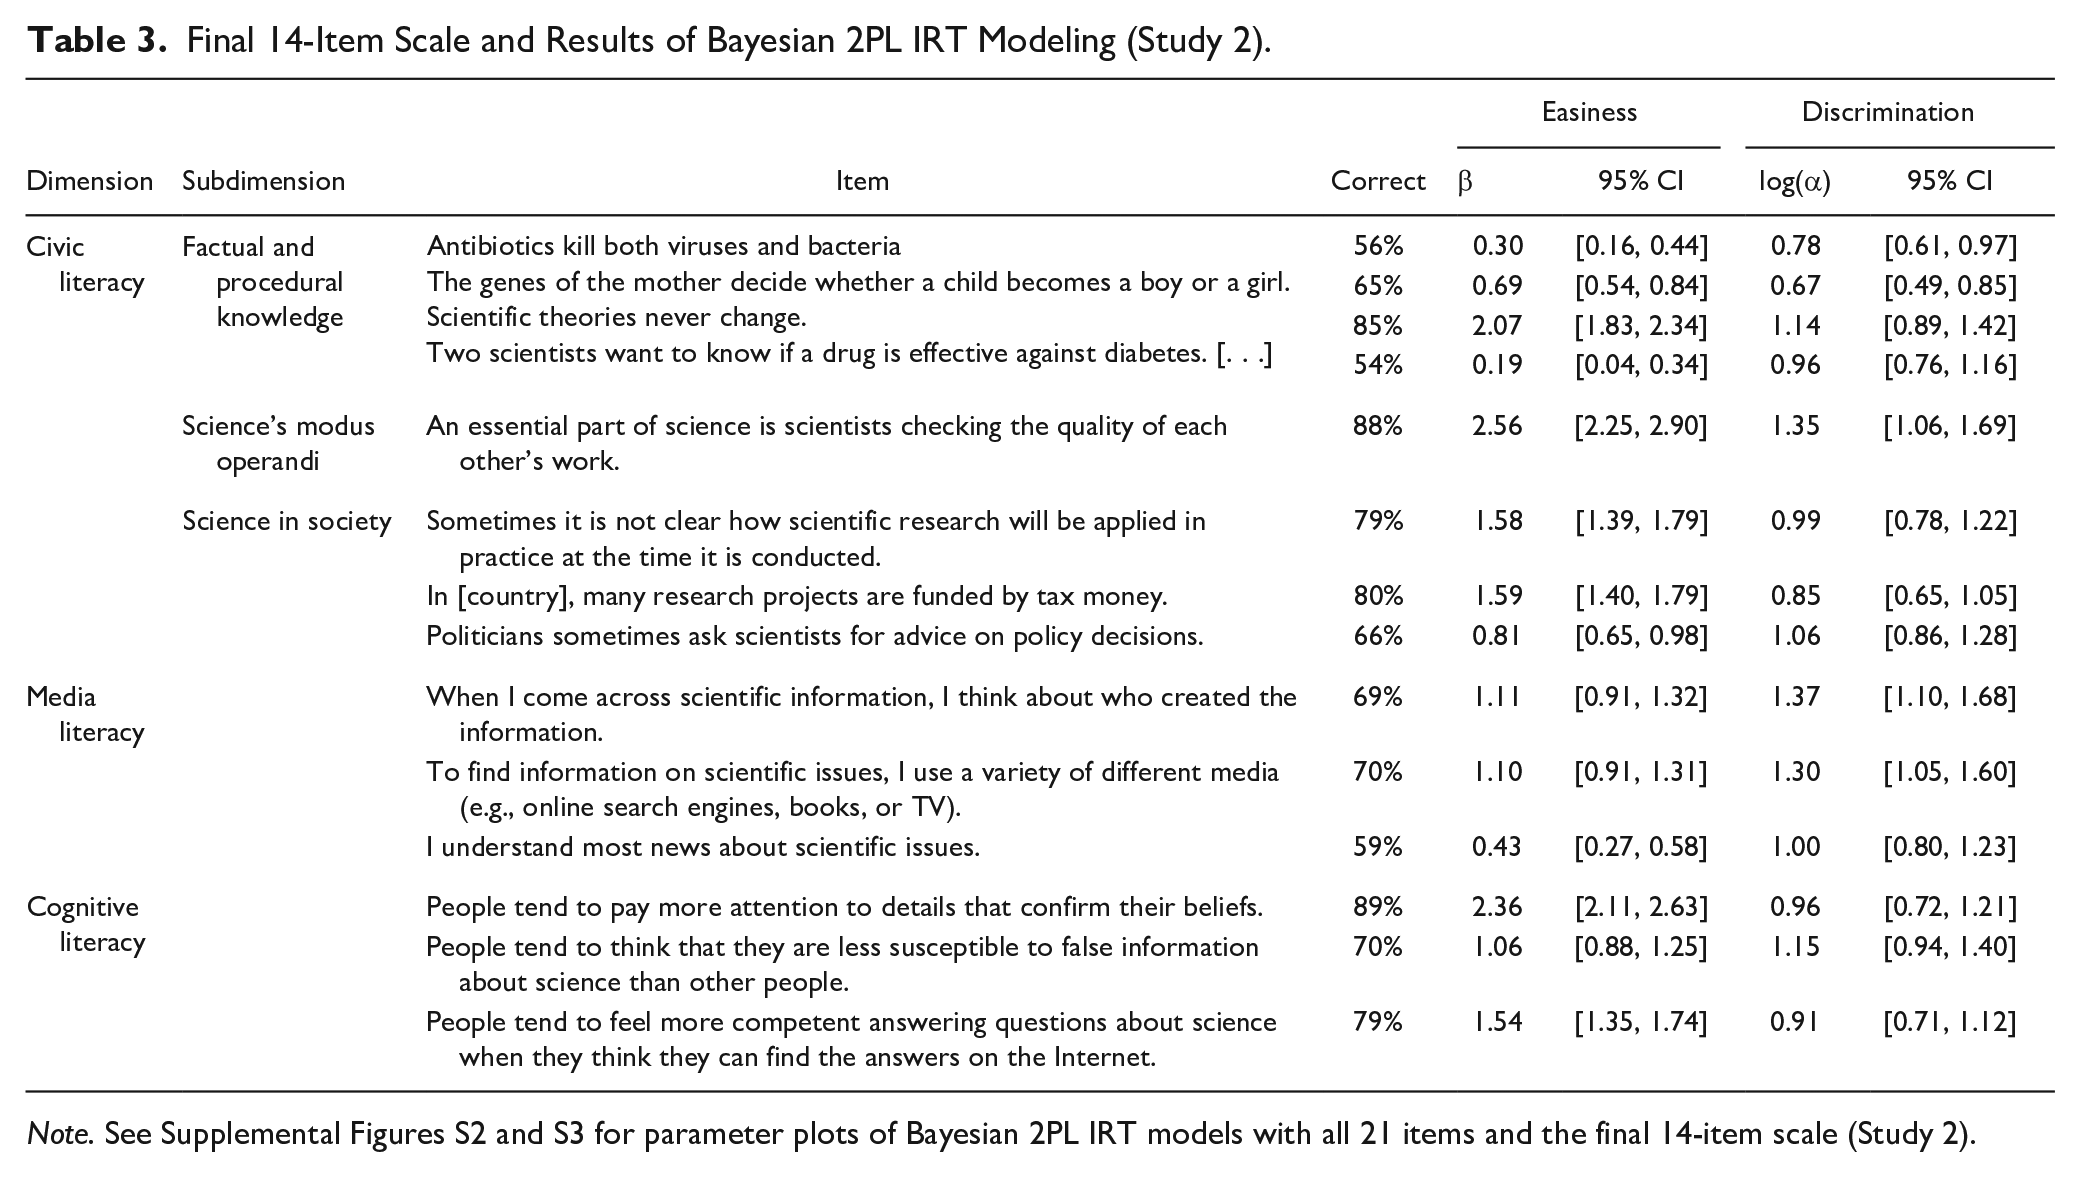
Note. See Supplemental Figures S2 and S3 for parameter plots of Bayesian 2PL IRT models with all 21 items and the final 14-item scale (Study 2).
Regression analyses showed that the scale performs very similarly across different groups of people. For example, the items do not make conservatives versus liberals (p = .284), people with right-leaning versus left-leaning views (p = .149), and religious versus not-religious individuals (p = .510) more or less likely to answer “don’t know.” Young age is not a significant predictor of replying “don’t know” either (p = .282), except for the item “In the United States, many research projects are funded by tax money” (Odds Ration [OR] = 0.98, z = 2.10, p < .05). This suggests that our scale does not make people of certain ages and with specific worldviews feel hesitant to indicate potentially incorrect answers. However, women (β = 0.08, t = 2.25, p < .05) and less-educated individuals (β = 0.09, t = 2.57, p < .05) were significantly more likely to admit unknowingness.
Further analyses show that self-reported confidence about response behavior is not a function of age (p = .914), gender (p = .198), conservative political orientation (p = .290), right-leaning views (p = .970), and religiosity (p = .209). Education is, however: Higher-educated people are clearly more likely to report higher confidence (β = 0.16, t = 4.75, p < .001). But overall, this is additional evidence that the items have high invariance across different types of people and suggests that scale can be assumed to have similar reliability among various target groups.
Convergent validity (H4)
Both the 14-item scale and all subscales are correlated with respondent characteristics and attitudes that other studies found to be related to science literacy (Allum et al., 2018; Altun & Kalkan, 2021; McKasy et al., 2020; McPhetres & Zuckerman, 2018; Miller, 2010). As hypothesized, we find that the overall literacy score is a function of higher education, interest in science, trust in science, self-perceived science knowledge, information-seeking behavior, and informational norm perceptions (Table 4). These results are strong evidence that our scale behaves in a theoretically plausible way and has high convergent validity. The three subscales also exhibit high convergent validity: The civic literacy dimension is associated with someone’s proximity to science, higher perceptions of uncertainty in the scientific process, and lower misperceptions of scientific issues. The media literacy dimension correlated positively with science media use and attention to media coverage on science. The cognitive literacy dimension is positively related with actively open-minded thinking, yet not with the need for cognition. These results show that each subscale may be used as a valid stand-alone measure.
Convergent Validity Tests: Results of Linear Regressions Predicting Science Literacy and Its Dimensions With Related Constructs.
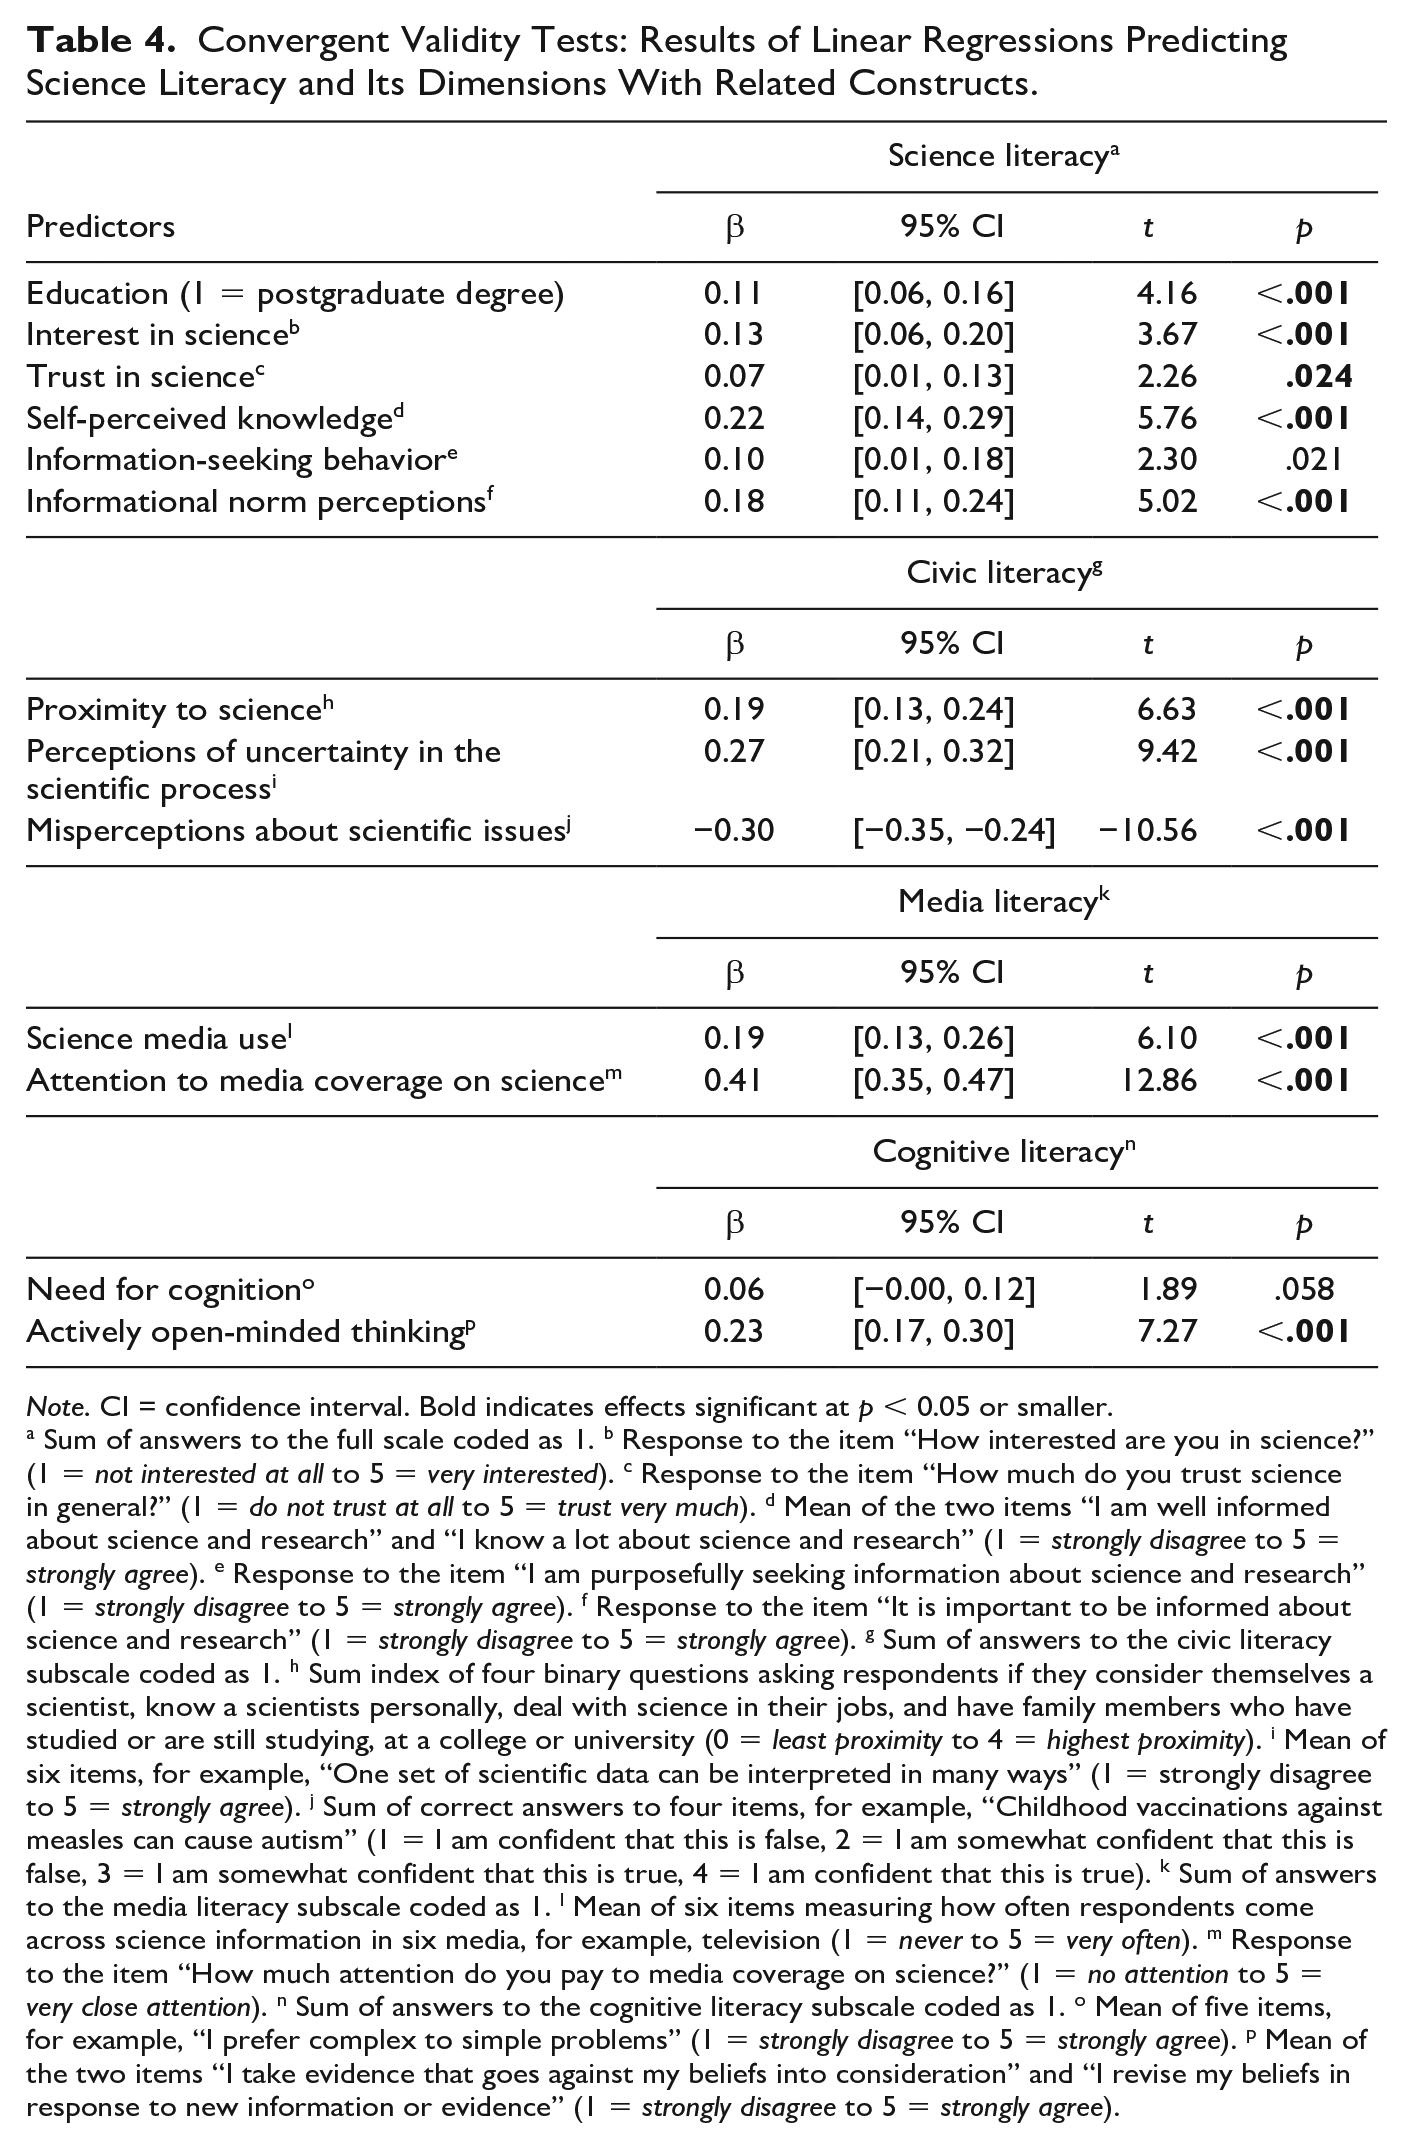
Note. CI = confidence interval. Bold indicates effects significant at p < 0.05 or smaller.
a Sum of answers to the full scale coded as 1. b Response to the item “How interested are you in science?” (1 = not interested at all to 5 = very interested). c Response to the item “How much do you trust science in general?” (1 = do not trust at all to 5 = trust very much). d Mean of the two items “I am well informed about science and research” and “I know a lot about science and research” (1 = strongly disagree to 5 = strongly agree). e Response to the item “I am purposefully seeking information about science and research” (1 = strongly disagree to 5 = strongly agree). f Response to the item “It is important to be informed about science and research” (1 = strongly disagree to 5 = strongly agree). g Sum of answers to the civic literacy subscale coded as 1. h Sum index of four binary questions asking respondents if they consider themselves a scientist, know a scientists personally, deal with science in their jobs, and have family members who have studied or are still studying, at a college or university (0 = least proximity to 4 = highest proximity). i Mean of six items, for example, “One set of scientific data can be interpreted in many ways” (1 = strongly disagree to 5 = strongly agree). j Sum of correct answers to four items, for example, “Childhood vaccinations against measles can cause autism” (1 = I am confident that this is false, 2 = I am somewhat confident that this is false, 3 = I am somewhat confident that this is true, 4 = I am confident that this is true). k Sum of answers to the media literacy subscale coded as 1. l Mean of six items measuring how often respondents come across science information in six media, for example, television (1 = never to 5 = very often). m Response to the item “How much attention do you pay to media coverage on science?” (1 = no attention to 5 = very close attention). n Sum of answers to the cognitive literacy subscale coded as 1. o Mean of five items, for example, “I prefer complex to simple problems” (1 = strongly disagree to 5 = strongly agree). p Mean of the two items “I take evidence that goes against my beliefs into consideration” and “I revise my beliefs in response to new information or evidence” (1 = strongly disagree to 5 = strongly agree).
Discriminant validity (H5)
We also find support for the discriminant validity of our scale: Regression analyses do not indicate significant relationships to conceptually unrelated constructs, such as interest in sports (p = .119). However, place of residence, which we had assumed to be unrelated to science literacy, significantly related to respondents’ test performance, with people living in rural areas having lower literacy (β = −0.12 t = −3.78, p < .001). However, this result conforms with extant research finding that rural populations often exhibit lower science knowledge because of reduced access to museums and less government funding for science education at schools, for example (Lounkaew, 2013; O’Neal & Perkins, 2021). It, therefore, does not undermine the scale’s discriminant validity.
We explored how levels and predictors of science literacy compare between Study 1 and Study 2 to test how our samples differ. Overall, we find only marginal differences: The US sample shows slightly higher overall literacy, which is mainly driven by higher scores on the media literacy dimension. The Swiss sample, on the other hand, shows slightly higher civic literacy scores (see Supplemental Table S8). Moreover, we find similar effects of sociodemographic predictors in both samples: For example, education and proximity to science have positive effects on science literacy in Switzerland and the US (see Supplemental Table S9). Political orientation and religiosity seem to have similar effects on literacy in both countries as well, but these were only significant in Switzerland. Overall, this indicates that the effects of sample composition are limited.
Discussion
Navigating contemporary science communication environments—where science is embedded in larger sociopolitical contexts and hybrid, dynamic media environments often rife with false or misleading information—requires an updated conception of science literacy. Howell and Brossard (2021) proposed such a conception, distinguishing three dimensions of contemporary science literacy: civic science literacy, science media literacy, and cognitive science literacy. We present a measurement of this conception: a robust, reliable, and theoretically informed 14-item survey instrument that captures these three dimensions.
We developed and validated the scale in two preregistered, nationally representative survey studies in two countries (Switzerland and US) and four languages (German, French, Italian, and English). Based on a set of 21 items derived from existing research and tested in a series of rigorous analyses, we identified a stable and reliable scale capturing the civic, media, and cognitive literacy dimensions with 11 true-false statements and three agree-disagree items (Study 1). We tested this scale in a second sample, validated its dimensional structure, and found good internal consistency, strong individual item performance, and high convergent and discriminant validity (Study 2). We conclude that our scale represents a valid measure of science literacy in contemporary societies.
Potential for Use
Our scale has considerable advantages over other science literacy measures and fills important gaps in scholarship on science literacy, education, and psychology. It accounts for an updated conception of science literacy, capturing knowledge and skills required to seek and interpret science information in contemporary societies and their communication ecologies—while most existing measures have focused only on single aspects of the science information life cycle (Miller, 1998) and remained unchanged for decades despite changing demands toward science-literate citizens (Miller, 2022). Another advantage of the scale is its high ecological validity, as we developed and validated it in census-matched quota surveys. This means that it is ready to use in surveys of the general population, in contrast to existing literacy measures that have not been validated outside specific target populations, such as school students (Son & Ha, 2024). The scale can also be used across a wide range of geographical contexts, including several understudied countries in the “Global South,” as it covers four languages that are official languages in more than 80 countries on all continents, with an estimated 1.965 billion speakers worldwide (Eberhard et al., 2024). Our literacy measure caters also to a variety of study designs and data-collection modes: It can be easily implemented through pen-and-paper, telephone, and online surveys and experiments, as it is comparatively short and uses simple response options familiar to participants of social science studies—whereas some existing measures require expensive lab experiments (e.g., Gormally et al., 2012) or use time-consuming tests that put a high cognitive load on participants to understand question formats and response instructions (e.g., Fives et al., 2014).
These advantages make our scale useful for both researchers and practitioners working on science communication, education, and related topics. Researchers can include it in public opinion surveys to investigate literacy levels of (sub)populations and compare them over time and across countries. Experimental studies may use the scale to test predictors and outcomes of science literacy and its dimensions, so as to accumulate much-needed evidence on causal mechanisms of science literacy (Osborne, 2023). Our work is also useful for studies focusing only on the civic, media, or cognitive literacy dimension, as we provide robust subscales that can be used as stand-alone measures for each dimension. These studies may want to explore timely issues of science communication—analyzing, for example, how science literacy affects the use Generative AI tools and perceptions of these tools (Alvarez et al., 2024; Schäfer, 2023). Our scale can also benefit qualitative research and mixed-methods studies: They may include the scale in screening surveys to recruit study participants with a broad range of literacy skills—and examine the ways in which people employ these skills. For example, scholars could use eye-tracking to test how people solve online search tasks, relate task performance to people’s literacy levels, and conduct follow-up interviews to explore the particular skills and knowledge participants were drawing on (Kessler et al., 2020).
Such studies will have actionable value for science communication practitioners and education professionals as well, as they can inform, among others, the design of school curricula, public engagement formats, interventions against science-related misinformation, and evaluations of science communication practices (Amazeen et al., 2024). For example, science communicators and school teachers would need to focus on increasing civic science literacy if they aim to reduce scientific misperceptions yet encourage actively open-minded thinking for achieving higher cognitive literacy (Table 4). Our scale might be even more attractive to communication and education professionals than measures of worldviews toward science, epistemic beliefs, and other value-based drivers of science-related behavior, because such drivers are typically more resistant to improvement through science communication formats than people’s literacy. Hence, we encourage science communication and education practitioners to use the scale, for example, for evaluations of museums, “edutainment” formats, online science games, and other educational formats where science literacy is a target outcome or a factor conditioning the outcome.
Limitations
Despite its strengths, future users should be aware of the scale’s limitations. Some items have slightly limited cross-lingual measurement invariance. For example, the easiness and discrimination of the media literacy items were somewhat higher in French than in German and Italian (Figure 1). We could not avoid this common limitation of multilingual survey instruments (e.g., see the study by Mede et al., 2021) but diminished it as best as possible, excluding items with substantial DIF across languages. Scale performance may also vary across genders and education levels, as we find that women and less-educated people were significantly more likely to admit that they do not know answers to some of the items. This means that the scale may produce more false positives for males and higher-educated individuals, who would have a higher chance of guessing the correct answer when avoiding the “don’t know” option—a common caveat of measures like ours (Linn et al., 1987; Mondak & Anderson, 2004). Also common for literacy measures is their susceptibility to capture information not only about people’s knowledge but also about worldviews, as both are intertwined (Östman & Almqvist, 2010). However, we gave our best to minimize this limitation: We avoided items that refer to controversial science issues and might also measure perceptions of science, journalists, or social media. A few items may still not be fully independent from people’s values in certain contexts, such as “science journalists may use emotional language to get people’s attention” (Stupple et al., 2017). This item measures if people know that interpreting science information can benefit from considering the intentions of information producers. This is an essential skill of science-literate citizens as conceptualized by Howell and Brossard (2021), so we included the item in the initial pool of items. However, it may also capture collateral information on how people perceive science journalism. But as this item is not part of the final scale (excluded due to low discrimination, see section Study 1: Population Survey in Switzerland), we are confident that our scale is as value-agnostic as possible in the settings we analyzed and in many further geographical and cultural contexts.
Users of our scale might also need to be aware of the relatively low internal consistency of the scale and the subscales—which is, however, arguably less problematic for measures composed of multiple dimensions that reflect related yet distinct latent constructs, like in our case (Gardner, 1995). 5 A minor limitation is that the sample of Study 1 was higher educated than the Swiss population (Supplemental Table S2) because we used neither sampling quotas nor survey weights to account for unequal selection probabilities across different levels of education. However, we expect that this has a minimal effect on the validity of our analyses, as weighting in factor analyses, psychometric property tests, and Bayesian IRT modeling has been considered unnecessary and even problematic because it can bias error variances (Bollen et al., 2016; Gaskin et al., 2017; Gelman, 2007). After all, our studies offer limited evidence on the invariance of our measure across cultures, since we tested it only in two Western societies that have somewhat similar value systems. Validating the scale in countries in the “Global South” was unfortunately beyond the scope of our study, as were scale performance tests among Spanish-speaking communities in the US, which are important but understudied target groups of science communication and education (Rodrigues et al., 2023).
Conclusion
We encourage further research to address the limitations mentioned earlier. For example, further studies will need to validate the scale in other languages, for example, Chinese, Spanish, Hindi, and Arabic, and in other cultures. Future scholarship may also explore further relevant aspects of the “science information life cycle” (Howell & Brossard, 2021, p. 1) not covered in the final scale, such as knowledge about preprints and predatory publishing. Such scholarship would also need to update the scale for current trends in science communication (e.g., Generative AI) and add conceptually relevant aspects beyond those described by Howell and Brossard (2021). We provided a starting point for such scholarship. It can help science-related policy-making and science education, informing decisions on government expenditure for education or the design of school curricula. Ultimately, it can help us better understand “what it means to be a science-literate citizen in a digital world” (Howell & Brossard, 2021, p. 1).
Supplemental Material
sj-docx-1-scx-10.1177_10755470251317379 – Supplemental material for Measuring Science Literacy in a Digital World: Development and Validation of a Multi-Dimensional Survey Scale
Supplemental material, sj-docx-1-scx-10.1177_10755470251317379 for Measuring Science Literacy in a Digital World: Development and Validation of a Multi-Dimensional Survey Scale by Niels G. Mede, Emily L. Howell, Mike S. Schäfer, Julia Metag, Becca Beets and Dominique Brossard in Science Communication
Footnotes
Acknowledgements
The authors are very grateful to Khrystyna Boichuk, who programmed and pretested the questionnaire of Study 2 and assisted with the data collection. The authors also thank Mikhaila Calice for valuable feedback on earlier versions of this study and contributions to conference presentations related to it.
Declaration of Conflicting Interests
The author(s) declared no potential conflicts of interest with respect to the research, authorship, and/or publication of this article.
Funding
The author(s) disclosed receipt of the following financial support for the research, authorship, and/or publication of this article: This research was funded by the Gebert Rüf Foundation, the Mercator Foundation Switzerland, the Morgridge Institute for Research, and the University of Zurich.
Data Availability Statement
Notes
Author Biographies
References
Supplementary Material
Please find the following supplemental material available below.
For Open Access articles published under a Creative Commons License, all supplemental material carries the same license as the article it is associated with.
For non-Open Access articles published, all supplemental material carries a non-exclusive license, and permission requests for re-use of supplemental material or any part of supplemental material shall be sent directly to the copyright owner as specified in the copyright notice associated with the article.