
Abstract
We developed and validated the Public Trust in Science (PuTruS) Scale to recognize the multidimensional nature of the concept. Drawing on an epistemic understanding of trust in science as a perception, we integrate prior research on different levels of trust objects, emphasizing the importance of trust in scientists. In addition, we include transparency and dialogue orientation to reflect increased public engagement expectations. Data from two German online panel surveys (nW1 = 3,439; nW2 = 1,030) points toward a five-dimensional structure (expertise, integrity, benevolence, transparency, dialogue orientation). For external validation, we used deference to scientific authority, conspiracy beliefs, and science populism.
Keywords
Rationale and State of Research
Public trust in science (PuTruS) has been increasingly highlighted as a key variable in science communication by prior research (e.g., Brewer & Ley, 2013; Fiske & Dupree, 2014; Kohring, 2016; Weingart & Guenther, 2016). The number of publications by decade indicates vastly growing scholarly attention over the years, 1 with the highest relevance since 2020, presumably due to the discussions on trust in science in light of the COVID-19 pandemic.
While PuTruS as a positive expectation toward science and scientists despite potential risks (Fink et al., 2010) 2 is undoubtedly important in today’s complex risk society (Beck & Ritter, 2010; Giddens, 1990), the assumption of a trust deficit has been criticized (Gauchat, 2012). However, most surveys commonly use single-item direct measures of trust in science (Besley & Tiffany, 2023) that are analyzed as a gradual level of trust over time or through cross-country comparisons (Krause et al., 2019), or as a dependent variable in linear regressions (Huber et al., 2019; Wintterlin et al., 2022). This illustrates that most surveys measuring trust in science are still implicitly based on the deficit assumption that seems to focus on achieving complete (and potentially blind) trust within society rather than acknowledging justified criticism by current research that highlights the idea of informed trust (Bromme, 2020) and the balance between trust in and skepticism of science necessary for an ideal democratic society (Krause et al., 2021). Thus, it does not consider the possibility of individual patterns and reasons for trust based on individual experiences. As a theoretical construct, PuTruS is complex, which requires appropriate conceptualization and measurements (Besley & Tiffany, 2023; see Reif & Guenther, 2021 for a theoretical model; Slater et al., 2019).
We assume that PuTruS is based on evaluations of scientists’ epistemic trustworthiness, namely their expertise, integrity, and benevolence (Hendriks et al., 2015, based on Mayer et al., 1995). Going beyond these three established dimensions, we acknowledge the fundamental changes in the field of science communication that call for the inclusion of transparency and dialogue orientation (Besley et al., 2021; Reif & Guenther, 2021) highlighting scientists’ communicative abilities as a reason to trust them or not. Modern communication environments affect both scientific communication and public perceptions of science and scientists. On one hand, a variety of low-threshold opportunities for direct science communication exist (Neuberger & Jarren, 2017; Weingart & Guenther, 2016). On the other hand, expectations of transparent and dialogical science communication that offer the possibility of direct interaction appear to be increasingly important factors in evaluations of scientists’ trustworthiness (Reif, 2021). Thus, the aim of this study is to extend existing scales by two dimensions proposing a new scale to stimulate conceptual and empirical enhancements in the trust in science literature.
The Concept and Measures of PuTruS
The majority of the literature has assumed that trust is a multidimensional construct (e.g., Hendriks et al., 2015; Mayer et al., 1995). Therefore, we argue that it should be considered in measurements accordingly. However, the direct, single-item measurement of “How much do you trust in . . .” is still widespread, and the measurements often appear unsystematic in relation to the various dimensions (Reif & Guenther, 2021). Despite the advantages of enabling cross-sectional and cultural comparisons and saving survey space, the use of a single item has been critically discussed in the literature (Besley, 2013; Besley & Tiffany, 2023; Reif & Guenther, 2021). Such measures are theoretically weak (Pardo & Calvo, 2002; Weingart & Guenther, 2016) and do not reflect the complexity of trust in science.
Since trust has been widely studied in diverse disciplines and approaches, numerous definitions of it exist (e.g., Hendriks et al., 2021). Here, we mainly refer to the sociological and communication research literature but also lean on established psychological trust research. According to Giddens (1990) and Luhmann (2014), trust reduces the complexity of an uncertain and risky future by involving positive expectations toward a trusted entity (see Fink et al., 2010) that is strongly based on prior experiences (e.g., Bentele, 1994). We consider trust in science an important variable in the relationship between science as the object of trust and the public as the subject of trust (see Reif & Guenther, 2021; Resnick et al., 2015). Specifically, we use an epistemic understanding of PuTruS based on the public’s reliance on scientific knowledge and the risk of not being correctly informed (see also Hendriks et al., 2016).
Trust in Science as a Multilevel Concept
According to sociological theory, however, differences in the nature of trust are assumed when referring to functional systems (macro level) compared to individuals (micro level) (Giddens, 1990; Luhmann, 2014). Trust in expert systems (here, science) is abstract, whereas trust in individuals refers to specific persons (Giddens, 1990; Kohring, 2001) or groups of people (here, scientists) (Resnik, 2011). Thus, trust in science as a system, and therefore the nonpersonal form of trust, is more stable but also abstract; in contrast, trust in scientists is easier to grant but also more fragile. For overall trust in science, the individual level is particularly important as trust is formed and changed by specific access points (Giddens, 1990). At an intermediate level (the meso level), trust in scientific organizations can be examined (Bentele, 1998; Grünberg, 2014; Schäfer, 2016). Representative surveys have indicated a notable difference in public trust at this level, with respondents tending to express higher levels of trust in university scientists compared to their private sector counterparts (BEIS, 2020; Schäfer & Metag, 2016).
Different scales exist that refer to scientists or scientific experts (Fiske & Dupree, 2014; Hendriks et al., 2015) or that vary the object of trust within the same scale (e.g., scientists, scientific theories, science), such as the Trust in Science and Scientists Inventory (Nadelson et al., 2014). Similarly, different reference objects (e.g., science and technology or scientific research) are used synonymously within one representative survey, such as the German Wissenschaftsbarometer, often without clearly distinguishing among the levels (Reif & Guenther, 2021).
Trust in Science as a Multidimensional Concept
Establishing the idea of an epistemic understanding of trust in science, Hendriks et al. (2015) defined three dimensions based on Mayer et al. (1995) and proposed measures accordingly. Based on this three-fold concept, the reasons why scientific experts are perceived as trustworthy are high levels of expertise, integrity, and benevolence. These dimensions and measures show similarities to the dimensions of competence, trustworthiness, and goodwill/caring identified by McCroskey and Teven (1999), rooted in theoretical foundations reaching back to Aristotle. The conceptualization of the Muenster Epistemic Trustworthiness Inventory (METI) has proven useful in numerous studies (e.g., Hendriks et al., 2020, 2023; Reif et al., 2020) and has been developed in the context of digital media use. It also aligns with the two-dimensional concept of Fiske and Dupree (2014), where expertise is referred to as competence, and warmth combines integrity and benevolence (similar to the basic dimensions of source credibility by Hovland et al., 1953). However, within the context of trust in science and scientists, the distinct delineation of integrity and benevolence proves especially valuable, as it underscores the social role of scientists in working for the common good. Thus, we build on these dimensions and define them as follows:
(1)
In the context of “public trust,” a concept well recognized in communication research, Bentele (1994, 1998), furthermore, emphasizes the crucial communicative qualities of transparency and openness that public figures must demonstrate to be considered trustworthy. Specifically, within the field of science communication, there is increasing recognition of communicative transparency (All European Academies, 2019) and the “two-way dialogue” in public engagement due to the evolving significance of changes in science communication (Resnick et al., 2015) as essential dimensions. Summarizing these trends, Reif and Guenther (2021) have proposed a theoretical model of PuTruS, which introduces the two additional dimensions of transparency and dialogue orientation.
3
This model yields as an optimal basis for this study, as it was specifically designed for public surveys on trust in science in light of changes in science communication by digital media environments. These dimensions are defined as follows:
(4)
In sum, PuTruS is considered in this article as a multilevel (micro, meso, macro) and multidimensional (expertise, integrity, benevolence, transparency, and dialogue orientation) concept, which will be the basis for our scale development.
The Relationship of PuTruS With Related Variables
In relation to trust in science, a multitude of concepts have been discussed and studied by previous researches that are promising variables to test external validity. For this study, we have identified three particularly related variables in previous research: deference to scientific authority, conspiracy beliefs, and science-related populist attitudes.
Deference to scientific authority is defined as the belief that scientists should decide on matters of science rather than the general public (Howell et al., 2020). The concept is seen as a “long-term socialized trait” (Brossard & Nisbet, 2007, p. 30) and “cultural value predisposition” (Hasell et al., 2019, p. 3), often studied in the context of the United States. Deference to scientific authority is considered more stable than trust in science, which is more susceptible to change and varies based on individual experiences and relationships (Hasell et al., 2019). Previous research has found that deference to scientific authority moderately predicts trust in science (Anderson et al., 2012; Brossard & Nisbet, 2007). Therefore, we expect to find positive correlations between PuTruS and deference to scientific authority in our study. Specifically, the dimensions of integrity and benevolence may show the strongest correlations, as they underscore the idea of scientists working in the best interests of society without prioritizing others’ expectations. In contrast, there may be a weaker association between deference to scientific authority and perceptions regarding scientists’ interaction with the public and the enabling of public engagement, thus scientists’ dialogue orientation.
In recent years, PuTruS, along with conspiracy beliefs and science-populist attitudes, has been extensively discussed in the context of social media use, revealing positive associations between social media use and beliefs in COVID-19-related conspiracy myths (Allington et al., 2021; Schäfer et al., 2022; Xiao et al., 2021). Beliefs in conspiracy myths, also known as conspiracy theories, are socially constructed beliefs about malevolent or clandestine actions by public figures, which are of public interest but intentionally concealed from the public (Douglas & Sutton, 2023). According to Plohl and Musil (2021), belief in conspiracy myths shows a moderately negative correlation with trust in science. While trust in science remained relatively high and stable in Germany until 2019, there was a significant short-term increase at the onset of the COVID-19 pandemic (Bromme et al., 2022), contrasting with low levels of conspiracy beliefs (Ibbetson, 2021).
Science-related populism is another concept related to trust in science that has been studied in recent years. It is characterized by the perception of a contentious relationship between “ordinary people” and an “academic elite,” focusing on conflicts over the authority to science-related decision-making and the legitimacy of truth claims (see Mede et al., 2021). Regarding the relationship between PuTruS and science-related populist attitudes, existing research indicates small negative correlations (Mede et al., 2021; Wintterlin et al., 2022).
Conspiracy beliefs and science-related populist attitudes are expected to be negatively correlated with PuTruS, thereby serving as effective external convergent validations. Specifically, it is assumed that conspiracy beliefs and science-related populist attitudes will show negative associations with dimensions such as scientists’ integrity, benevolence, transparency, and their dialogue orientation.
In addition to exploring variables assumed to be related to PuTruS, we also aim to conduct a discriminant validity test. In a cross-national study across 20 countries, Huber et al. (2019) found that religiosity had only marginal correlations with trust in science. Given the declining relevance of religion in Germany (The Association of Religion Data Archives, 2024) and the lack of public debates regarding the conflict between creationism and evolution (Gülker, 2015), we assume no or at most marginal correlations between trust in science and individuals’ levels of religiosity.
Methods
Samples in Two Waves
To test and validate the scale, we employed a panel design across two waves (Wave 1: March and April 2022; Wave 2: March and April 2023) using YouGov’s online access panel. For the first wave, we ensured sample representativeness (n = 5,001), by following a quota plan based on gender, age, and federal state. In the second wave (n = 1,065), respondents from the first wave were re-invited using re-quotation. The median time to complete the entire questionnaire was 18 minutes for each wave. During data cleansing, responses were screened to exclude cases below 40% of the median duration (∼7 minutes), totaling 177 cases removed from Wave 1 and 35 from Wave 2 as these were deemed potentially careless or inattentive (Curran, 2016). This procedure led to the sample sizes of n = 4,824 for the first wave and n = 1,030 for the second wave (see Table 1 for sample descriptions). Compared to German Census data (Statistisches Bundesamt, 2021), individuals with university degrees were overrepresented in our samples.
Sample Description by Sociodemographic Information (Frequencies, Percentages).
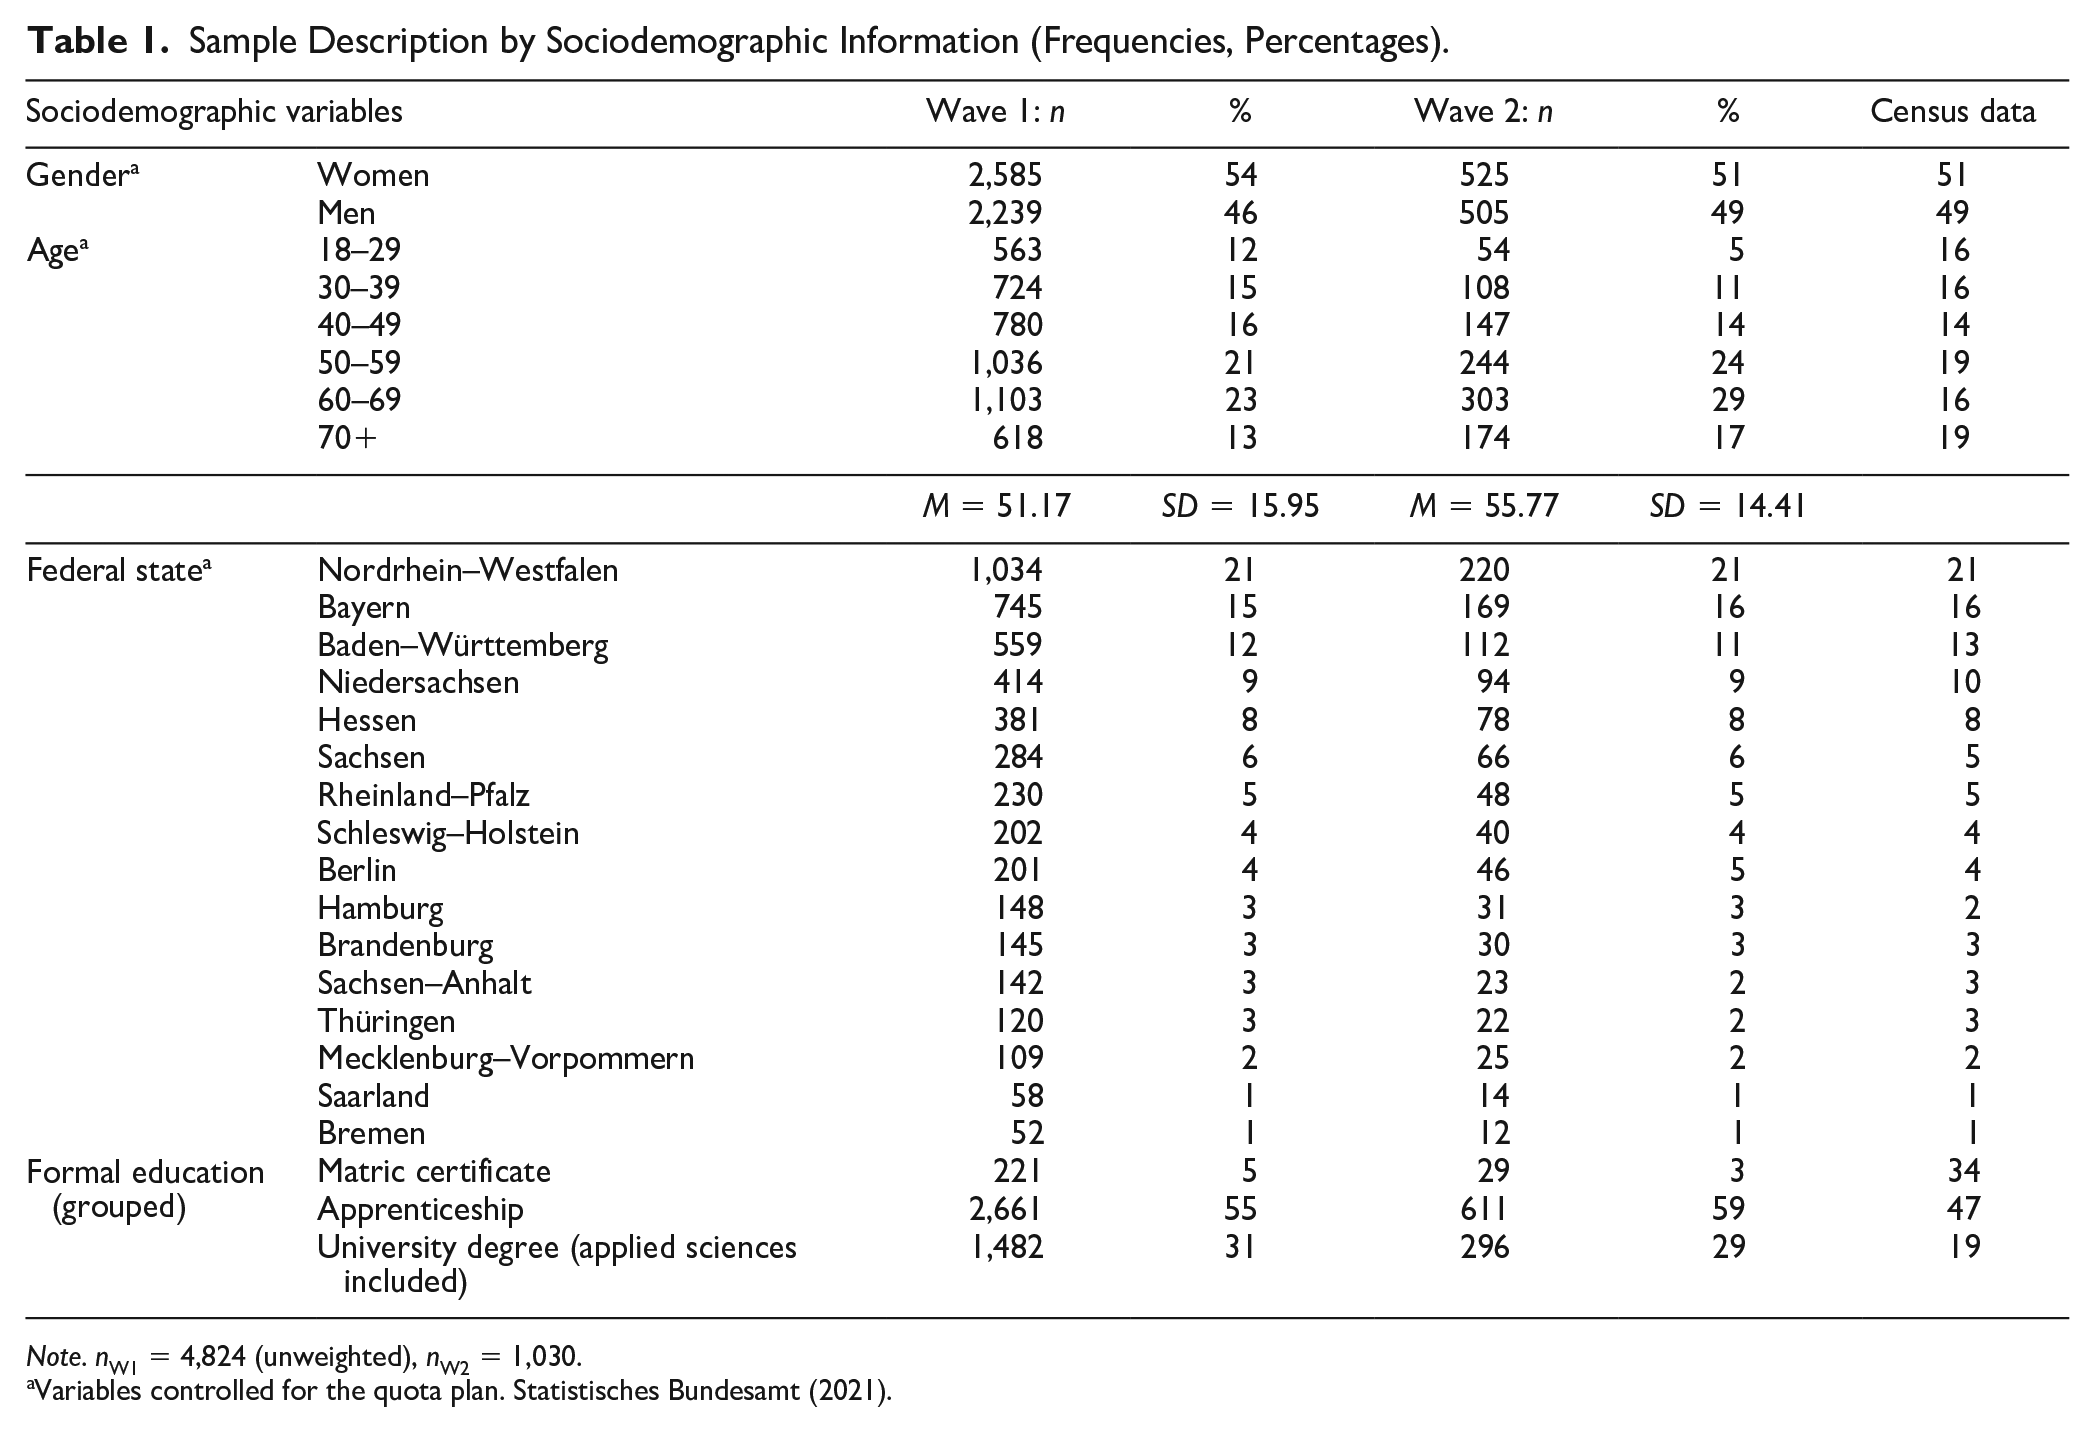
Note. nW1 = 4,824 (unweighted), nW2 = 1,030.
Variables controlled for the quota plan. Statistisches Bundesamt (2021).
Scale Development
The central aim of this study is to develop and validate a new instrument for measuring PuTruS, specifically focusing on trust from the personal perspective based on respondents’ experiences. We developed 15 items to capture the five dimensions (see Table 2)—expertise, integrity, benevolence, transparency, and dialogue orientation—with each dimension addressed by three items to ensure an efficient research instrument. To establish continuity with prior survey research, we closely aligned our questionnaire items with existing instruments wherever theoretically feasible (Besley et al., 2021; Hendriks et al., 2015; Ipsos MORI, 2014; Mayer & Davis, 1999; Nadelson et al., 2014; Schäfer & Metag, 2019; Wissenschaft im Dialog, 2021; see Supplemental Table 1 for items used as inspirations). Each item was developed through literature review and qualitative preliminary work (Reif, 2021; Reif & Guenther, 2021) and comprehensively discussed and underwent thorough scrutiny by the project team. All items were formulated as reasons to trust scientists emphasizing importance of the micro level in trust formation and change (Giddens, 1990). For each dimension, two items captured the main aspects of trust in science, while one item addressed the absence of negative expectations toward scientists (refer to definitions in the Theory Section). For instance, an integrity-related item reads: “Scientists can be trusted because they . . . cover up nothing about their research.” The item structure for expertise and dialogue orientation differed slightly, with three items focusing on positive expectations. In the second wave of data collection, we revised this approach for improved comparability. To achieve this, we introduced new items and made adjustments, such as substituting the item Exp3a “Scientists can be trusted because they . . . have special knowledge and abilities in their field” with Exp3b “Scientists can be trusted because they . . . do not stop striving for more knowledge.” Similarly, for dialogue orientation, we replaced Dia3a “Scientists can be trusted because they . . . are willing to talk with citizens” with Dia3b “Scientists can be trusted because they . . . do not refuse to engage in conversations with citizens.”
Descriptive Statistics for the Measures of the Public Trust in Science (PuTruS) Scale (M, SD).
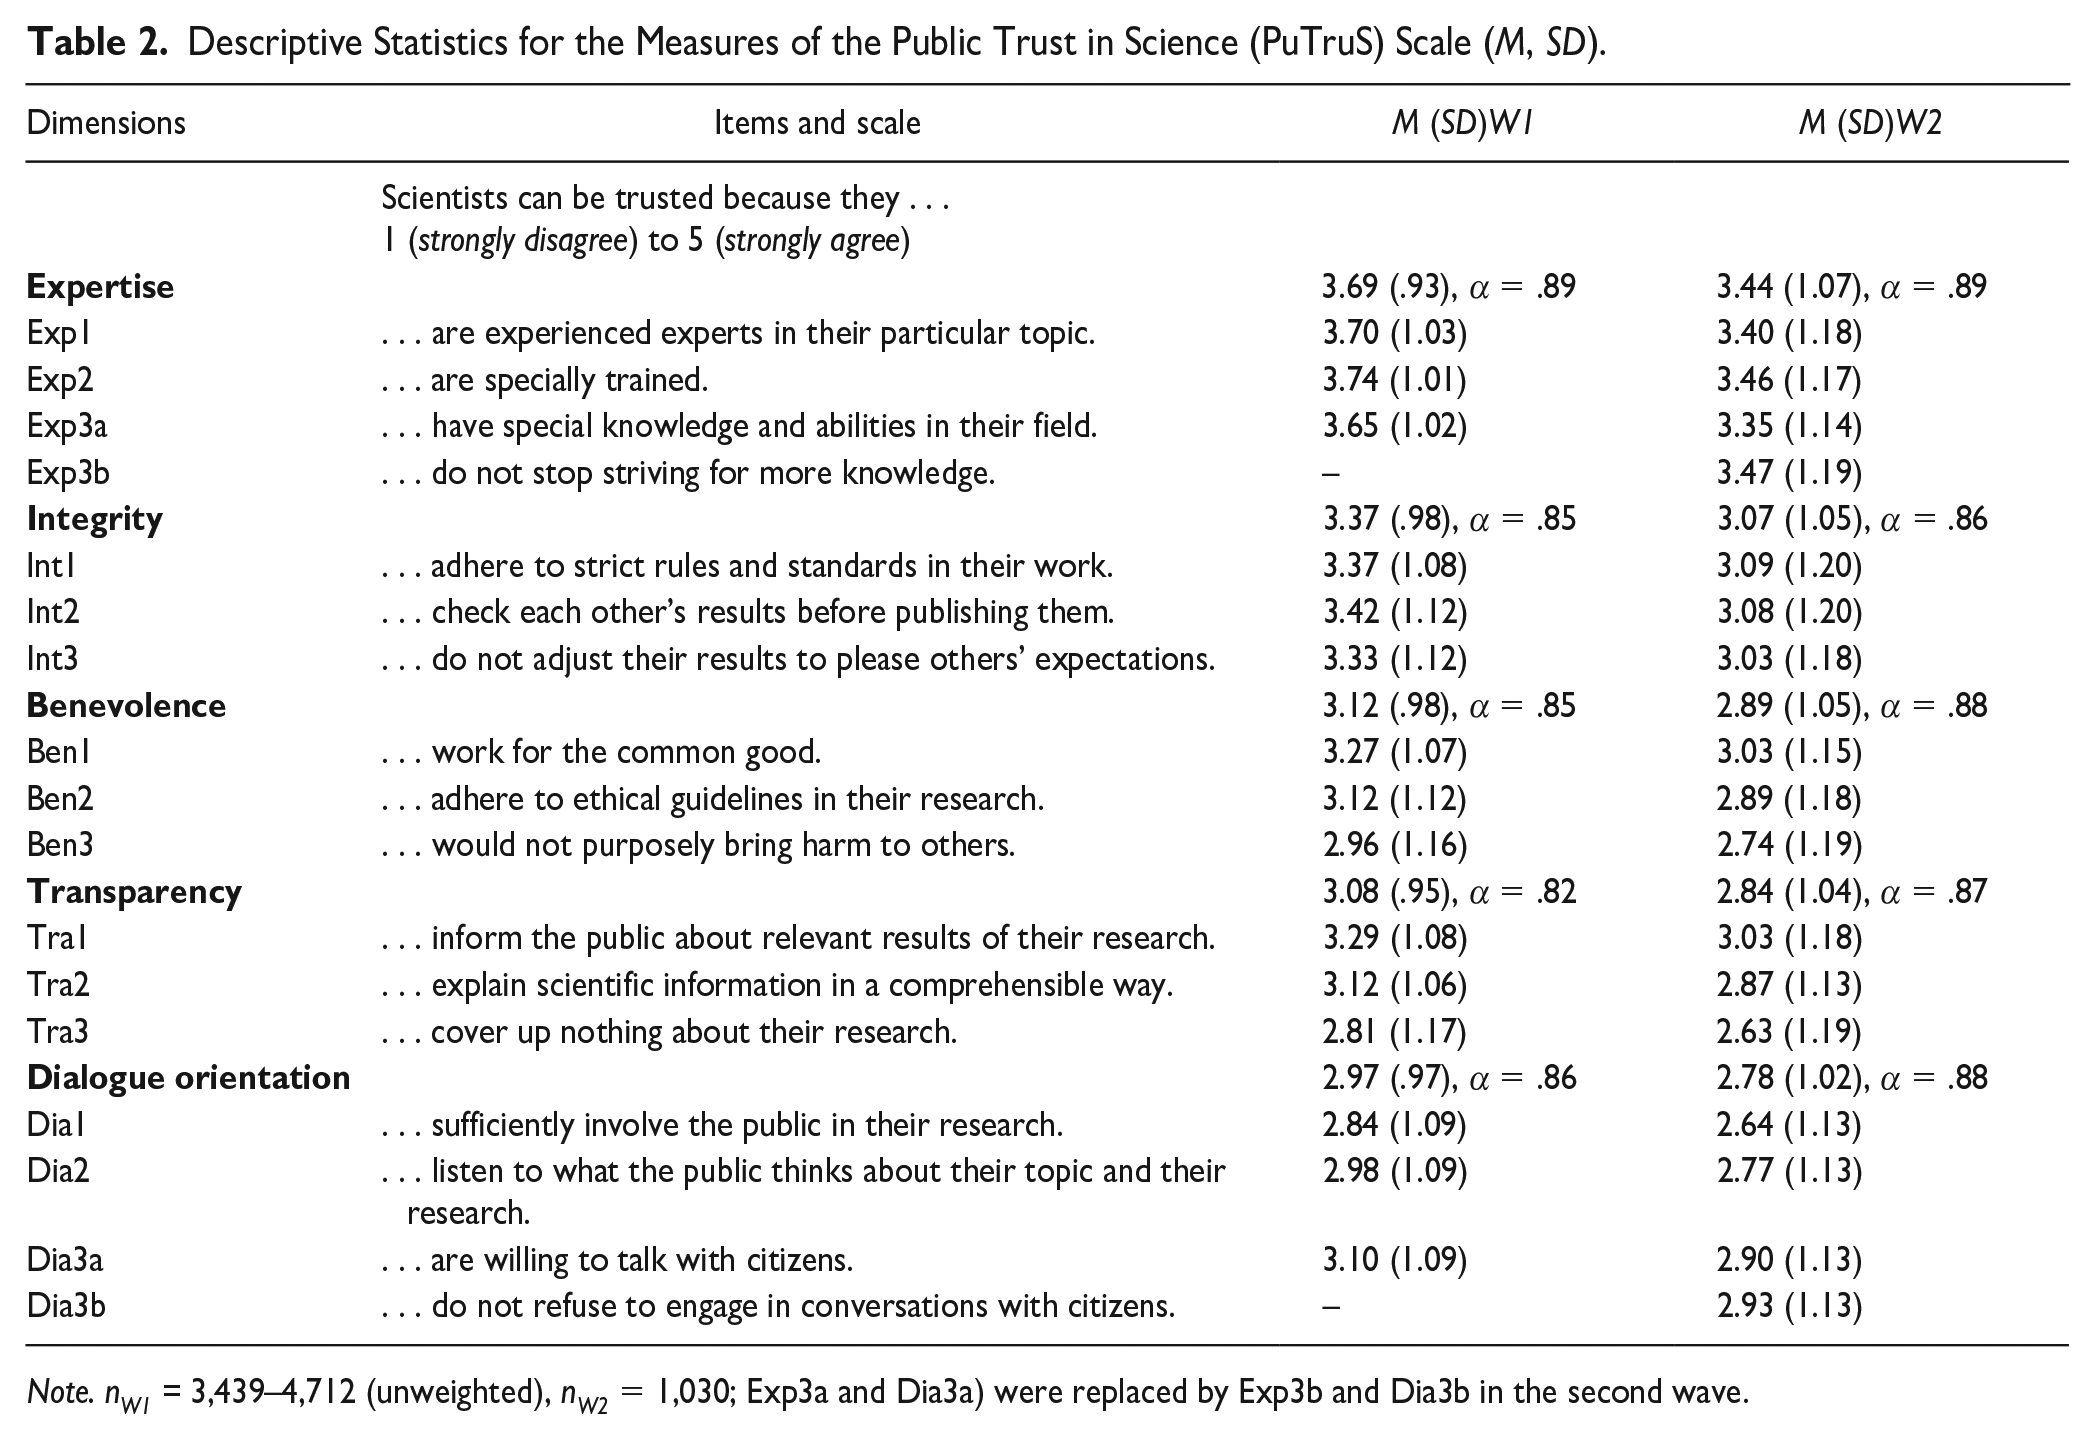
Note. nW1 = 3,439–4,712 (unweighted), nW2 = 1,030; Exp3a and Dia3a) were replaced by Exp3b and Dia3b in the second wave.
Items were presented in randomized order to mitigate potential order effects, using 5-point rating scales ranging from 1 (strongly disagree) to 5 (strongly agree), with an additional response option of “don’t know/no response” in the first wave. Since the surveys were conducted in German, all items have been translated into English for this publication.
Additional Measures
We integrated the developed PuTruS Scale into a broader survey focusing on public perceptions of science and science-related media usage. The initial segment addressed general perceptions of science, including deference to scientific authority. Deference to scientific authority was assessed using two items derived from previous literature (Anderson et al., 2012; Brossard & Nisbet, 2007; Howell et al., 2020; Su et al., 2016). Respondents were asked to indicate their level of agreement on a 5-point rating scale from 1 (strongly disagree) to 5 (strongly agree) with the statements: “Scientists know best what is good for the public” and “Scientists should do what they think is best, even if they have to persuade people that it is right” (W1: r = .38; p ≤ .001; M = 3.24; SD = .95; W2: r = .48; p ≤ .001; M = 3.13; SD = .92).
After querying respondents about their various levels of engagement with science, we proceeded to gauge additional direct measures of trust in science across micro (scientists in general), meso (scientists at universities and research institutes; scientists in private companies/industry), and macro (science) levels. Participants were asked to rate their level of trust with statements such as “How much do you trust in . . .” The macro-level item was incorporated into a scale encompassing trust in several public institutions (e.g., politics and the media), and this was followed by administration of the PuTruS Scale.
At the end of the survey, we assessed science-related populist attitudes and individuals’ tendencies to believe in conspiracy myths, along with a few final sociodemographic questions, including religious beliefs. Conspiracy beliefs were measured using five items from Imhoff and Decker (2013); for example, “I consider the various conspiracy narratives circulating on the internet to be utter nonsense (recoded),” (W1: α = .77, M = 2.85; SD = 1.01; W2: α = .82, M = 3.02; SD = 1.09). Science-related populist attitudes were considered as proposed by Mede et al. (2021); for example, “We should rely more on common sense and less on scientific studies,” (W1: α = .72–.81 for subscales, M = 2.23; SD = 1.01; W2: α = .76–.84, M = 2.34; SD = 1.04). We used a 5-point rating scale from 1 (strongly disagree) to 5 (strongly agree) with a “don’t know/no response” option for both constructs. Religiosity was gauged during the first wave of data collection with a single item asking, “How would you describe your level of religiosity?” The scale ranged from 1 (not religious at all) to 5 (very religious) (W1: M = 2.13; SD = 1.27).
Application in Panel Survey
We implemented our developed PuTruS Scale by presenting the items in randomized order across two pages of the online questionnaire. During the first wave, the additional response option “don’t know/no response” was treated as a missing value in the calculated mean indices (n = 523 cases with missing values). This approach was chosen because testing the scale was a primary aim of this study, and we did not assume that the additional response option equated to the midpoint of the response scale (Sturgis et al., 2014). Owing to critical issues of imputation methods, we decided against using them. In the second wave, however, only respondents with valid values for all direct measures at different levels and for the mean index of each dimension were contacted again (W1: n = 4,301). We conducted tests to determine if the initial sample significantly differed from the final sample that excluded missing values, but found no significant differences (see Supplemental Table 2). To prevent the creation of additional missing values, we did not include the additional response option in the second wave.
Analyses
To test and validate the PuTruS Scale, we initially used data from the first wave to conduct confirmatory factor analyses (CFAs) for the five proposed dimensions at the micro level. Besley et al. (2021) previously demonstrated that a four-factor solution, which includes openness that combines ideas of transparency and dialogue orientation, showed better fit compared to a two-factor solution. We performed a comparative analysis of several models, including a single-factor solution (see Nadelson et al., 2014), a two-factor solution 4 (see Fiske & Dupree, 2014), and the four-factor solution (see Besley et al., 2021), alongside our proposed five-factor model. This confirmatory analysis aimed to identify which model best matched the empirical data.
We conducted the aforementioned analyses in RStudio using the package lavaan and reported the zero-order correlations for all measured dimensions, along with direct measures of trust in science at the micro, meso, and macro levels. To achieve this, we computed mean indices for each of the five dimensions in SPSS. In the second-wave data (n = 1,030), we replicated CFAs and zero-order correlations, using slightly adjusted measures (refer to Table 2) and tested the results on a shortened scale (one item per dimension). Finally, and for external validation of the PuTruS Scale, we calculated zero-order correlations with deference to scientific authority, conspiracy beliefs, and science-related populist attitudes to assess convergent validity, and with religious beliefs to test discriminant validity.
Results Wave 1
Confirmatory Factor Analysis
Owing to missing values, the final sample size for CFA was n = 3,439. To validate the results, we randomly split the data into two subsamples (nSubsample1 = 1,767, nSubsample2 = 1,672) and compared the values for both subsets. We tested a five-factor model against alternative models including a single-factor solution, a two-factor solution (F1: expertise and integrity; F2: benevolence, transparency, and dialogue orientation), and a four-factor solution (F1: expertise; F2: integrity; F3: benevolence; F4: openness combining transparency and dialogue orientation; Besley et al., 2021).
The initial single-factor solution using all 15 items did not meet the criteria for a satisfactory model (Table 3) in both random subsamples, as indicated by root mean square error of approximation (RMSEA) values of .10/.11 (not <.08) and comparative fit index (CFI) values of .91 to .93 (not >.95). The two-factor solution showed improved fit indices but still did not achieve satisfactory RMSEA values. Despite significant χ2 values due to the large sample size, both the four-factor and five-factor solutions demonstrated a good global fit. However, in direct model comparisons, our five-factor model exhibited a significantly better fit than all other models. In this model, all standardized estimates were significant and robust, ranging from .762 to .877 (see Supplemental Table 3).
Model Comparisons (Wave 1).
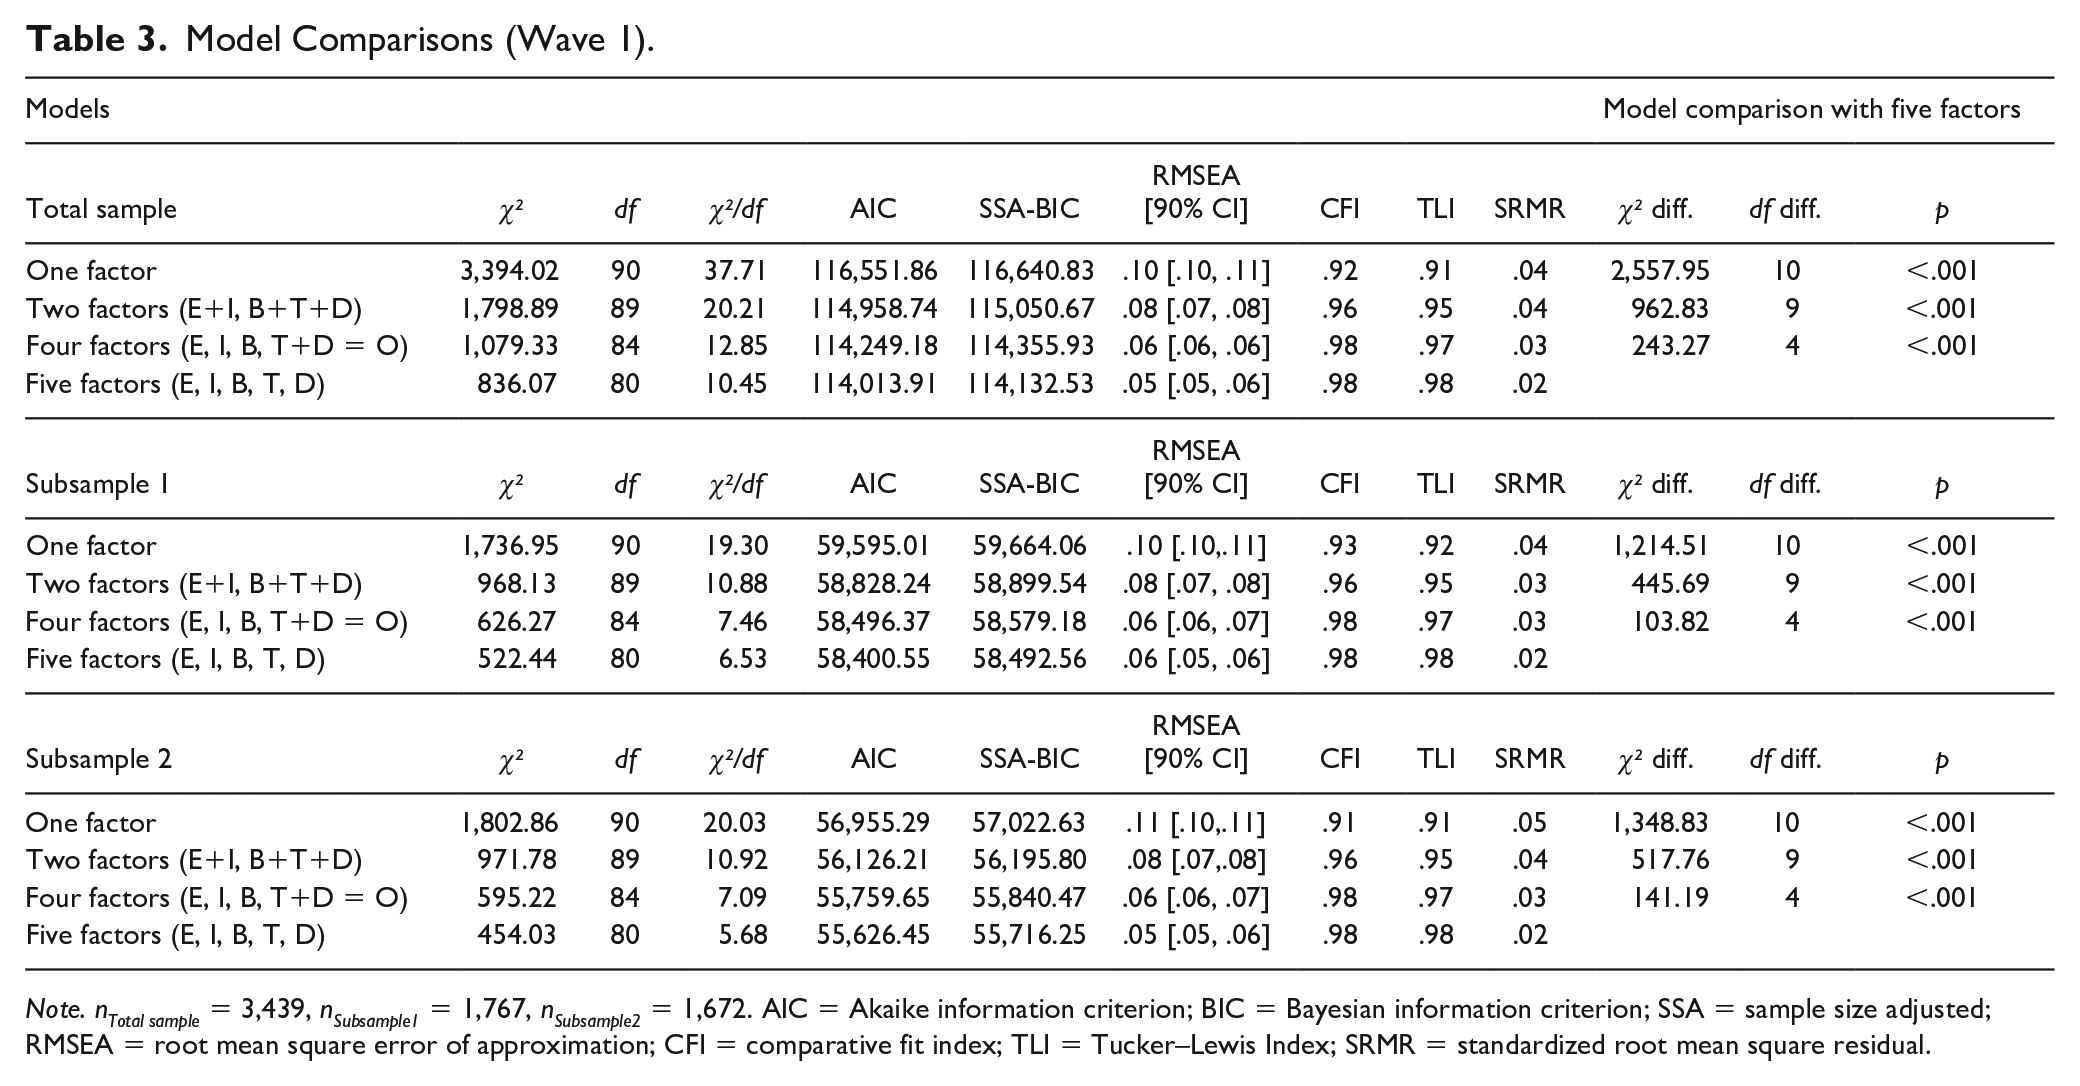
Note. nTotal sample = 3,439, nSubsample1 = 1,767, nSubsample2 = 1,672. AIC = Akaike information criterion; BIC = Bayesian information criterion; SSA = sample size adjusted; RMSEA = root mean square error of approximation; CFI = comparative fit index; TLI = Tucker–Lewis Index; SRMR = standardized root mean square residual.
Correlation Between Trust Levels and Dimensions
All five dimensions were highly correlated (r = .63–.81; Supplemental Table 4). We also observed high correlations between all direct measures of the different levels of trust, indicating very strong links between the items at the micro and macro levels as well as scientists working at universities (r = .72–.80). The correlation between trust in scientists working in private industry and all other items was lower (r = .50–.60), while the correlations between the five dimensions and the direct measures of trust were highest for expertise (r = .49–.64) and lowest for dialogue orientation (r = .46–.48). For expertise (r = .49) and integrity (r = .50), we observed slightly weaker correlations with trust in scientists working for private companies compared to the other direct measures (r = .58–.64; Supplemental Tables 4 and 5 for individual correlations between all measured items).
Results Wave 2
Confirmatory Factor Analysis
In the CFAs using data from the second wave of data collection, the two-factor solution revealed an acceptable global fit. However, the five-factor model again showed a significantly better fit than all the other models tested (see Table 4). The factor loadings were higher than those for Wave 1 (see Table 5).
Model Comparisons (Wave 2).
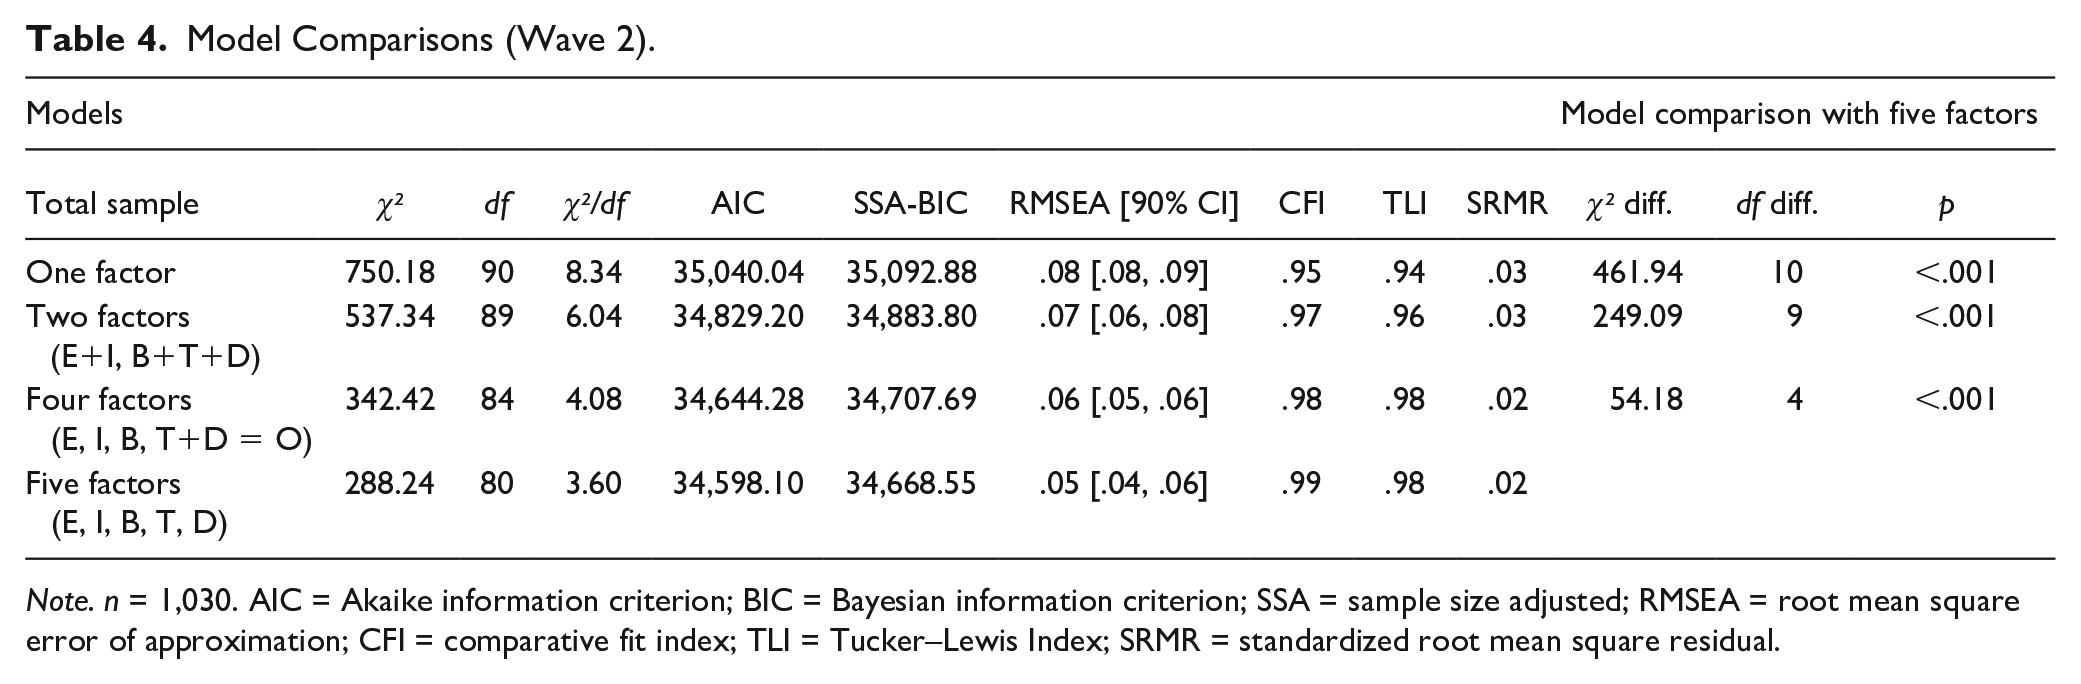
Note. n = 1,030. AIC = Akaike information criterion; BIC = Bayesian information criterion; SSA = sample size adjusted; RMSEA = root mean square error of approximation; CFI = comparative fit index; TLI = Tucker–Lewis Index; SRMR = standardized root mean square residual.
Standardized Estimates Per Dimension (Wave 2).
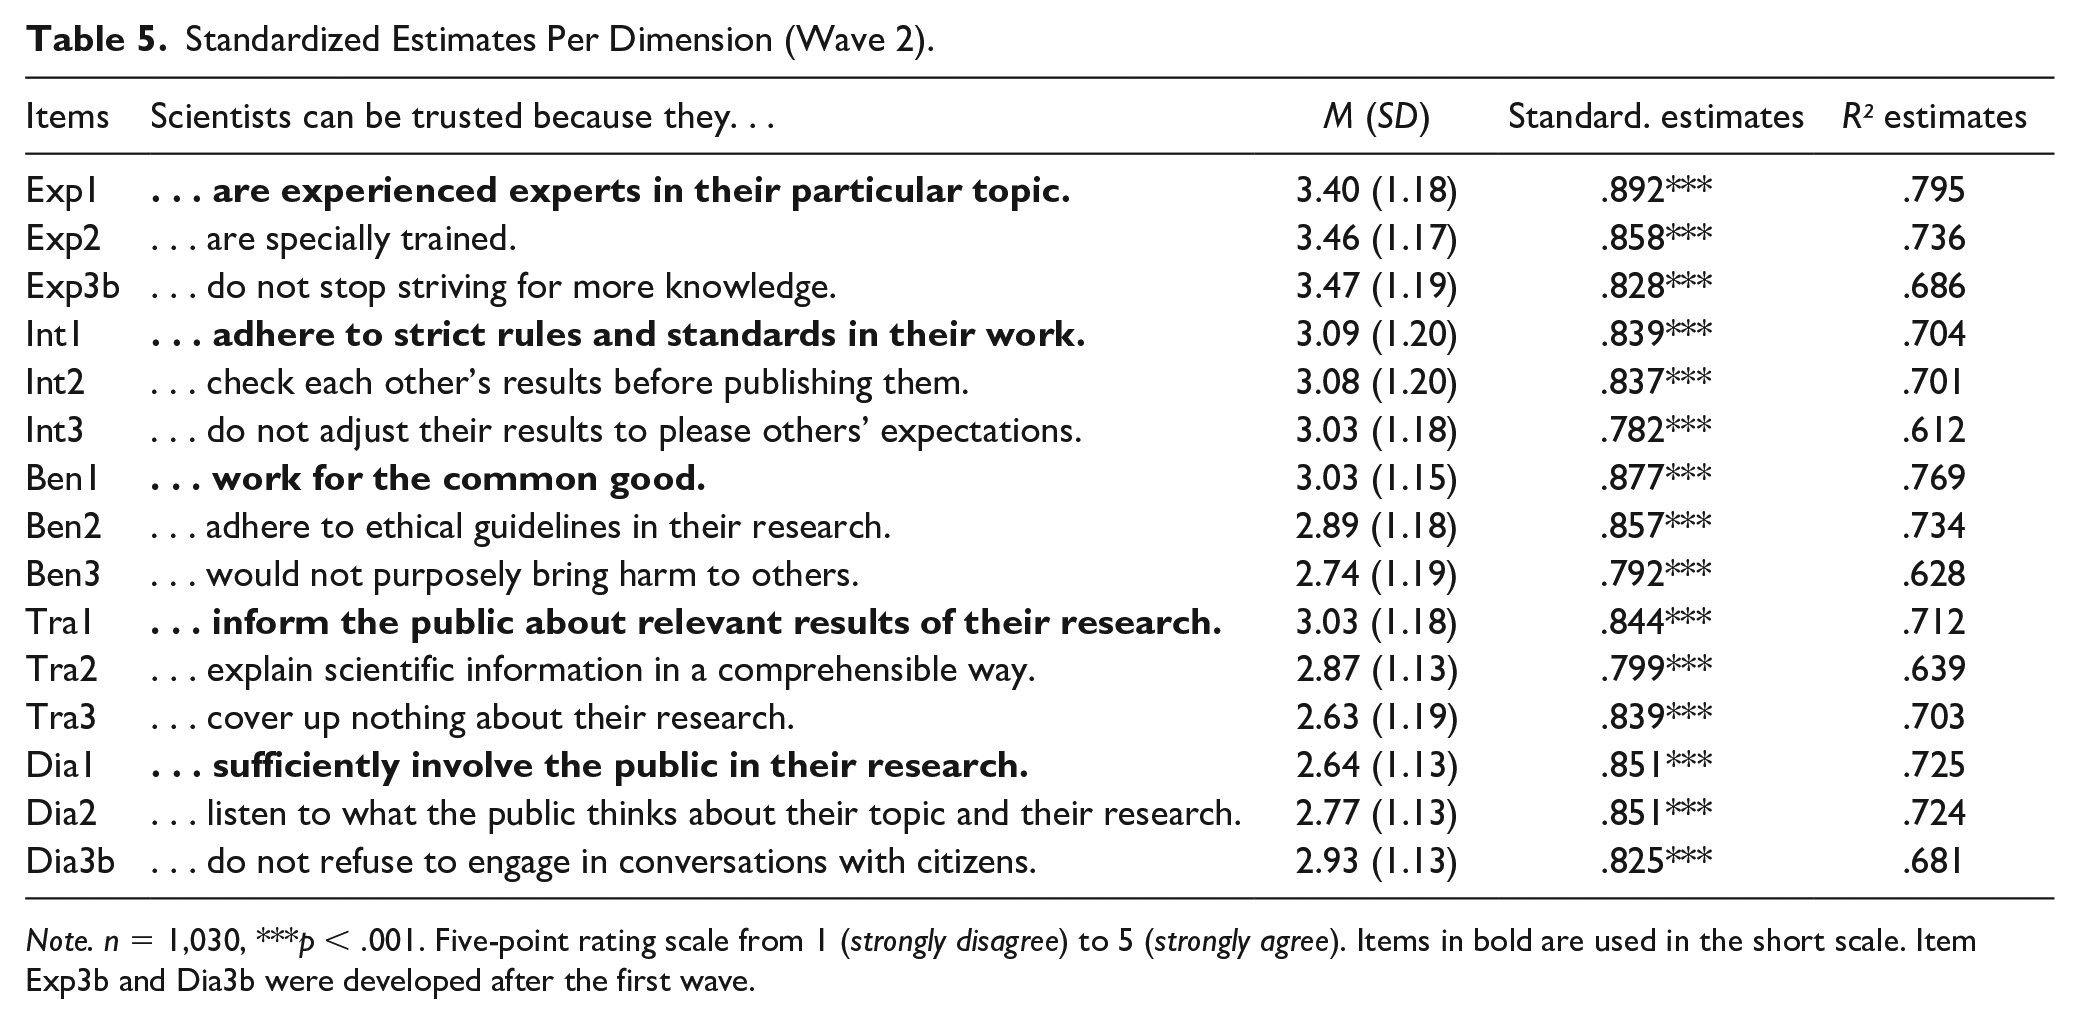
Note. n = 1,030, ***p < .001. Five-point rating scale from 1 (strongly disagree) to 5 (strongly agree). Items in bold are used in the short scale. Item Exp3b and Dia3b were developed after the first wave.
Correlation Between Trust Levels and Dimensions (PuTruS, PuTruS-5)
For reduced measures, we propose a short scale that includes one item per dimension. Based on theoretical considerations and the highest estimates per dimension (Table 5), we selected one item per dimension in the proposed five-item short scale of PuTruS-5. For the first and second waves, we found stronger correlations among all trust levels and dimensions; thus, the potential issue of multicollinearity for the dimensions was greater than in the first wave. However, when looking at the short PuTruS-5 Scale, the correlations between the dimensions are all <.8, reducing the risk of multicollinearity (Table 6). Regarding the links among the dimensions and levels of trust, we found very similar correlations using the full or short scale. A full correlation table for all measured items can be found in the Supplemental Material (Supplemental Table 5).
Zero-Order Correlations Between the Dimensions of the Public Trust in Science (PuTruS) Scale [Short Scale: PuTruS-5] (Wave 2).
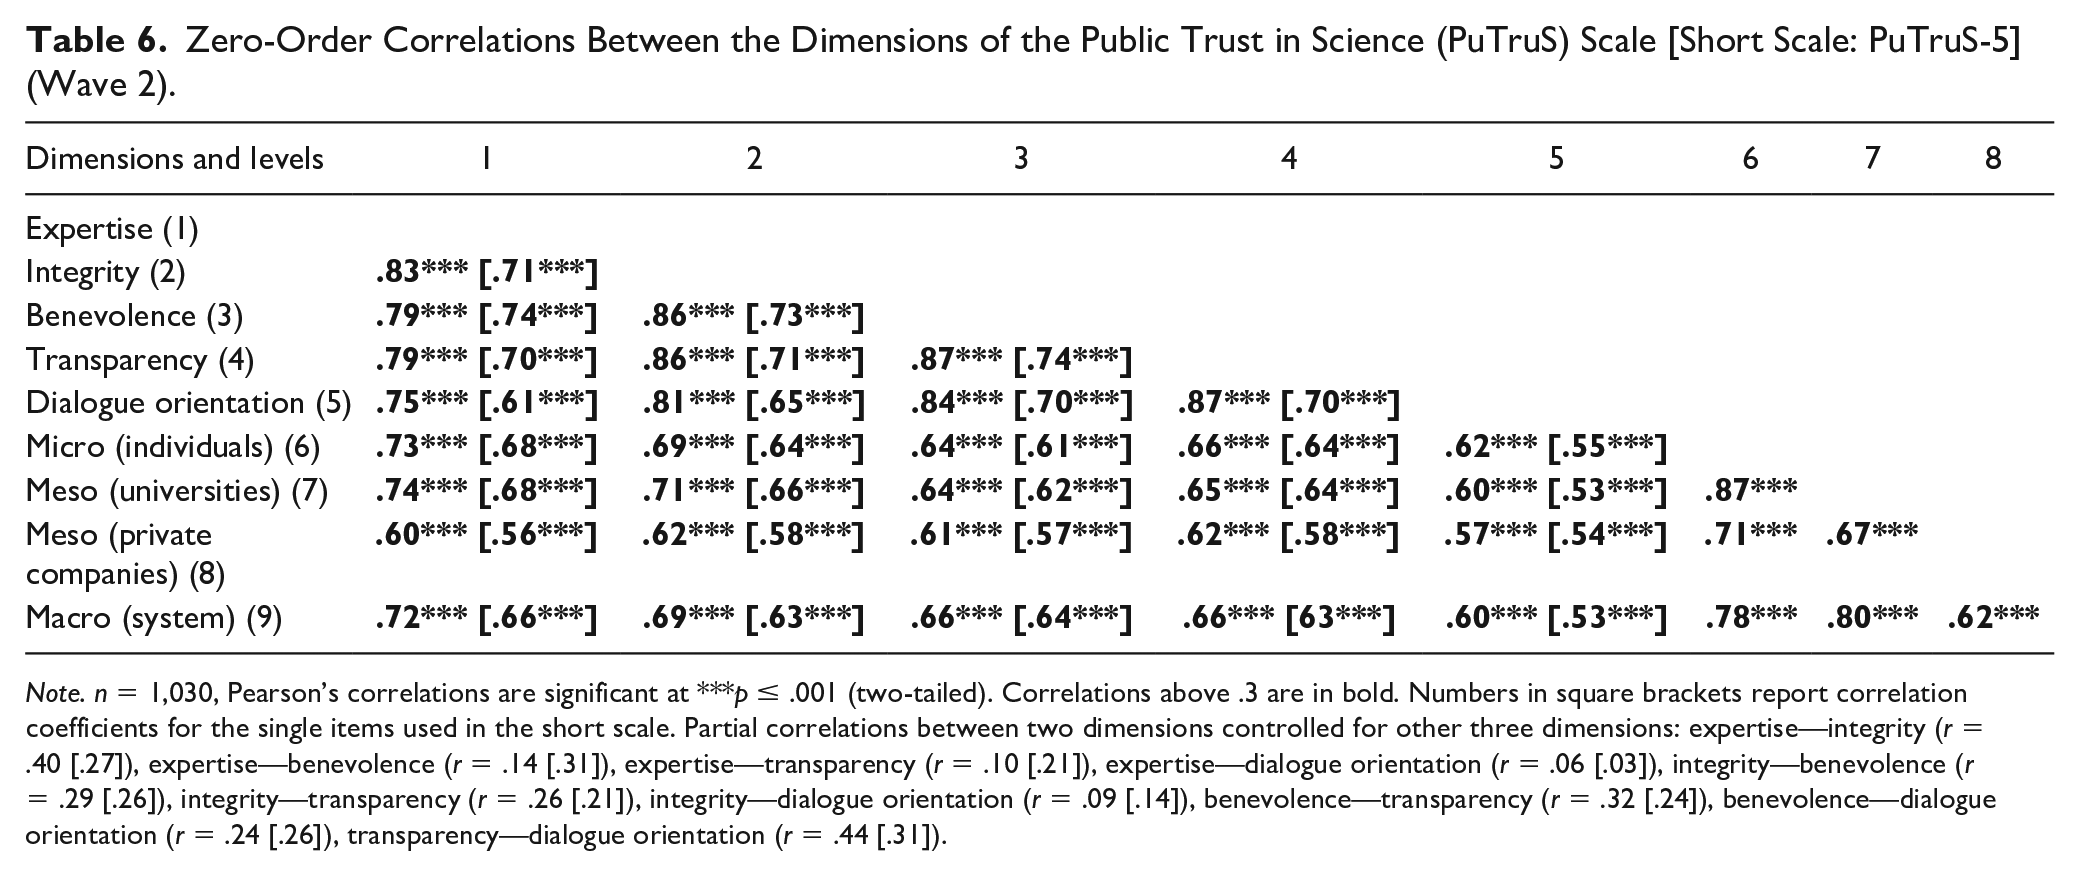
Note. n = 1,030, Pearson’s correlations are significant at ***p ≤ .001 (two-tailed). Correlations above .3 are in bold. Numbers in square brackets report correlation coefficients for the single items used in the short scale. Partial correlations between two dimensions controlled for other three dimensions: expertise—integrity (r = .40 [.27]), expertise—benevolence (r = .14 [.31]), expertise—transparency (r = .10 [.21]), expertise—dialogue orientation (r = .06 [.03]), integrity—benevolence (r = .29 [.26]), integrity—transparency (r = .26 [.21]), integrity—dialogue orientation (r = .09 [.14]), benevolence—transparency (r = .32 [.24]), benevolence—dialogue orientation (r = .24 [.26]), transparency—dialogue orientation (r = .44 [.31]).
External Validity for the PuTruS and PuTruS-5 Scale
We found strong positive correlations between trust in science across all dimensions and deference to scientific authority for both waves. Contrary to our assumptions, there were no major differences in the level of correlations. There were slightly weaker correlations between deference and the four single-item measures of trust in science (see Table 7).
Zero-Order Correlations Between the Public Trust in Science (PuTruS) Scale [Short Scale: PuTruS-5] and (Un)Related Constructs (Waves 1 and 2).
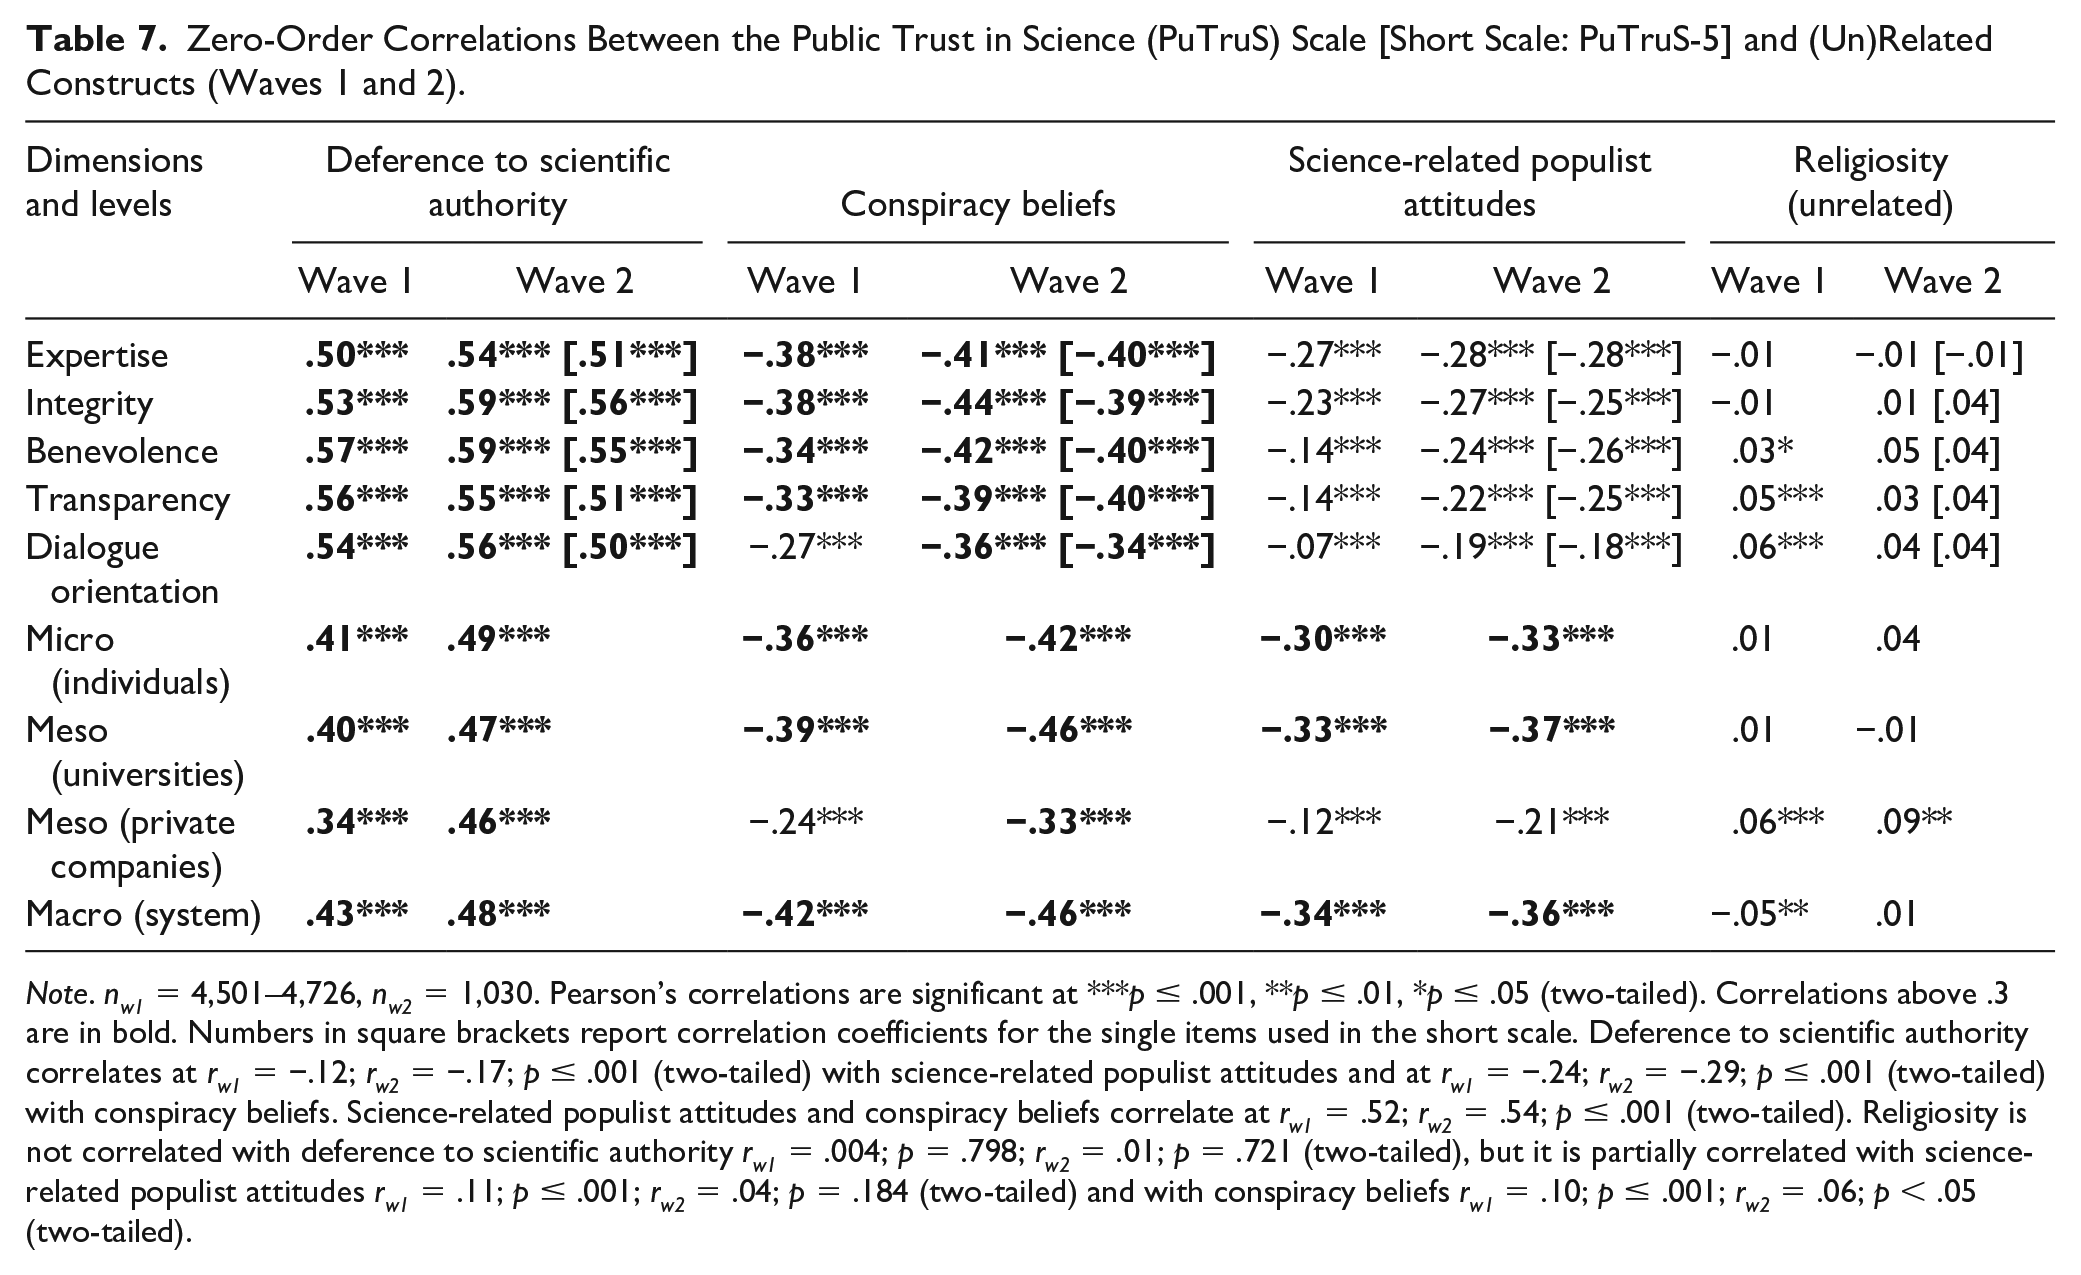
Note. nw1 = 4,501–4,726, nw2 = 1,030. Pearson’s correlations are significant at ***p ≤ .001, **p ≤ .01, *p ≤ .05 (two-tailed). Correlations above .3 are in bold. Numbers in square brackets report correlation coefficients for the single items used in the short scale. Deference to scientific authority correlates at rw1 = −.12; rw2 = −.17; p ≤ .001 (two-tailed) with science-related populist attitudes and at rw1 = −.24; rw2 = −.29; p ≤ .001 (two-tailed) with conspiracy beliefs. Science-related populist attitudes and conspiracy beliefs correlate at rw1 = .52; rw2 = .54; p ≤ .001 (two-tailed). Religiosity is not correlated with deference to scientific authority rw1 = .004; p = .798; rw2 = .01; p = .721 (two-tailed), but it is partially correlated with science-related populist attitudes rw1 = .11; p ≤ .001; rw2 = .04; p = .184 (two-tailed) and with conspiracy beliefs rw1 = .10; p ≤ .001; rw2 = .06; p < .05 (two-tailed).
As expected, trust in science was significantly negatively correlated with conspiracy beliefs across all levels of trust and for all dimensions at the micro level. All correlations are moderate, with expertise and integrity showing slightly stronger correlations than dialogue orientation. Regarding the relationship between science-related populist attitudes and trust in science, we found moderately negative correlations for all levels except for trust in scientists working for private companies, where we observed only a weak relationship. Across different dimensions, we observed the strongest correlations for expertise and integrity, smaller links for benevolence and transparency, and a very small link for dialogue orientation. Therefore, we confirm the external validity of our survey instrument.
For religiosity, we did not expect to find significant correlations with trust in science, given the focus of our study in Germany. All significant correlations found in the first wave were very weak and only significant due to the large sample size. In the second wave, we observed only one weak but significant relationship between people’s religious beliefs and their trust in scientists working for private companies. Therefore, we can conclude that, generally, trust in science is not (strongly) associated with religiosity.
Compared to the first wave, we found similar but stronger correlations in the second wave and in the reduced sample. The short scale mirrored all correlations almost perfectly.
Discussion and Conclusion
We introduced and tested an updated multidimensional scale of PuTruS. In addition to the established dimensions of expertise, integrity, and benevolence, we incorporated transparency and dialogue orientation to reflect changes in science communication influenced by modern communication environments (Reif & Guenther, 2021). All dimensions were assessed at the micro level, focusing on scientists, which is pivotal for trust formation and change (Giddens, 1990). Recognizing that PuTruS can also encompass science as a functional system (macro level) or various scientific organizations (meso level), potentially perceived differently in quality by the public, we included additional direct (single-item) measures of trust in science. Using data from a two-wave online survey (nW1 = 3,439; nW2 = 1,030), first wave representative of the German population in terms of age, gender, and place of residence (federal state), we conducted CFAs to assess how well our theoretically proposed five-dimensional model aligned with empirical data. We compared these results with alternative models featuring fewer dimensions (e.g., competence, integrity, benevolence, and openness as suggested by Besley et al., 2021). To streamline the instrument for large-scale surveys, we proposed a short scale comprising one item per dimension. Finally, for external validation of both the full PuTruS Scale and the short PuTruS-5 Scale, we presented correlations demonstrating how the dimensions as well as single-item direct measures on different levels of trust in science were associated with deference to scientific authority, science-related populist attitudes, conspiracy beliefs, and religiosity.
PuTruS: Factor Structure
For both samples, the data showed a good fit with the theoretical model of PuTruS. In comparing models, both the four-factor and five-factor solutions demonstrated a good global fit, with a significantly better fit observed for the five-factor solution. Thus, we empirically tested the five theoretically proposed dimensions at the micro level. However, the improvement in global fit between the four-factor and five-factor models was small. Similar to findings by Besley et al. (2021), we identified issues of collinearity among some dimensions.
We found strong positive correlations between all dimensions and our four single items directly measuring trust in science at different levels (micro, meso, and macro level). However, trust in scientists in private companies/industry showed lower correlations with all dimensions compared to the other items. This notable distinction between trust in science, scientists in general, and scientists at universities and research institutes versus those in private industry may suggest that respondents do not perceive the latter as “real” scientists, potentially reflecting cultural specificities in Germany. Similarly, this disparity might also reflect the high value placed on scientists’ expertise. Nonetheless, the five dimensions may exhibit varying correlation patterns and values across different scientific issue (see Besley et al., 2021; Besley & Tiffany, 2023).
Relations to Other Variables
In correlation with related constructs, the single items measuring different levels of trust demonstrated significant explanatory power. At the micro level, the varying effect sizes observed in the correlations between dimensions and science-related populist attitudes or conspiracy beliefs underscore the importance of distinguishing between the five dimensions. Although our findings revealed stronger negative correlations with science-related populist attitudes compared to those reported by Mede et al. (2021), validating the new scale for general science skepticism could potentially offer further insights, as noted by Meier and Krämer (2022), who found strong correlations with trust in science. While Anderson et al. (2012) and Brossard and Nisbet (2007) reported moderate positive associations between deference to scientific authority and trust in science, our data indicated strong positive correlations, still suggesting that while related, these constructs are not identical. In contrast, religious beliefs in Germany showed minimal to no connection with trust in science.
Short Scale
Despite slightly weaker correlations between the dimensions and levels of trust in science, the introduced short scale proved adequate, demonstrating comparable associations with the related constructs used for validation. Therefore, the abbreviated version of the PuTruS Scale, consisting of five items (PuTruS-5), seems suitable for inclusion in survey studies prioritizing breadth and facing limitations in incorporating the full version. The short scale still offers more insights into PuTruS compared to direct single-item measures. However, it is important to acknowledge that using five instead of 15 items does not yield the same depth of information.
Possible Future Directions
Beyond exploring the connection between PuTruS and other concepts, such as general science skepticism (Meier & Krämer, 2022), it is important to consider the relationship between trust and levels of online activity. Takahashi and Tandoc (2016) demonstrated a negative link between internet use and people’s perceptions of scientists and their trust in the media. The consumption of information from social media is particularly relevant to the trust relationship, as social media are often perceived as sources of science-critical comments, misinformation, and disinformation (e.g., Gierth & Bromme, 2020). However, Huber et al. (2019) identified a small but significant positive association between trust in science and the frequency of social media use. Overall, the existence of diverse platforms and the various ways social media are used have frequently been overlooked in prior research (Taddicken & Reif, 2016). The link between these variables may depend on the specific platforms and content found on social media, as well as how individuals engage with them.
Limitations
This study has several limitations. First, we focused on theoretical and conceptual aspects in the scale development process. While trust in science was clearly the central construct, our surveys contextualized trust within broader sociological, communication, and psychological approaches. To achieve this objective, we designed our items based on theoretical considerations rather than employing an exploratory approach that captures a wide array of items for empirical reduction. However, we identified some overlap between dimensions and items of different dimensions, indicating the need for further refinement of the PuTruS Scale. This also includes to acknowledge that we could have opted for the development of items with semantic differentials, thus, item-specific response scales (see Besley et al., 2021; Hendriks et al., 2015; Saris et al., 2010). We rather decided in favor of a higher level of detail of the items similar to Nadelson et al. (2014). In addition, our conclusions were based on self-reported data, which introduces the potential for social desirability bias. Participants may have indicated a higher level of trust in science than they genuinely possess, especially since the first wave of data collection occurred during the COVID-19 pandemic. Moreover, while our study benefited from a substantial sample size, the representativeness of this sample applies only to the first wave, and the cross-sectional design precluded establishing causal relationships. Another limitation is the exclusion of cases with numerous “don’t know/no response” answers, which were also not considered for the second wave of data collection. While we generally advocate for providing additional response options, treating these responses as missing values and the critical stance toward imputation required their exclusion for scale development purposes. Furthermore, our study was confined to Germany, which limits the generalizability of our findings to different cultural, scientific, media, and political contexts. Future research should explore commonalities and variations in PuTruS across diverse cultural settings. This limitation also extends to external validation, which in our study focused on religiosity as discriminant construct and three closely intertwined constructs: deference to scientific authority, conspiracy beliefs, and science-related populism. What we have not tested was how the measured perceptions (five dimensions) relate to behavioral trust measures. Instead, we focused on a comparison of the developed scale to single-item direct measures of trust in science commonly used in large-scale surveys by which we have captured the idea of trust in science as multilevel concept derived from sociological theory. Future research could study the connection between our measures and behavioral trust in science. Moreover, the PuTruS Scale was applied in the German language, the items have not yet been validated in English, requiring validation of our translations. The definition and classification of dimensions assumed in the German context are subject to international debate. We encourage further exploration of cultural and linguistic aspects and critical discussion regarding the methodological appropriateness of excluding respondents who self-identify as scientists from the analysis. Finally, the scale assumes that trust in science is a generalized attitudinal variable applied in specific situations and contexts. Further research should explore how generalized PuTruS relates to trust in specific scientific issues.
Conclusion
This study aimed to develop a new 15-item instrument for PuTruS that reflects a five-factor solution and to test the developed scale in two waves. These five factors represent expertise, benevolence, integrity, transparency, and dialogue orientation. With this validated solution, the PuTruS Scale takes a stand against the often criticized trust deficit assumption (Gauchat, 2012) by including the idea of individual patterns and, thus, reasons for trust in scientists. It also extends existing approaches by acknowledging the increased relevance of science communication activities, public engagement and, thus, reciprocity expectations. We hope that this proposed scale will stimulate conceptual and empirical enhancement in the field of science communication research.
In addition, we introduced a shorter five-item version of the scale (PuTruS-5), which facilitates broader usage—even in evaluation questionnaires employed by science communication practitioners—to gauge audience or visitor perspectives on various science communication formats, such as expert debates, science cafés, or exhibitions. We encourage practitioners and researchers to use our developed PuTruS Scale to gain deeper insights into the dynamics of trust between the public and science, investigate potential factors contributing to a decreased trust, and devise strategies to address these concerns.
Supplemental Material
sj-docx-1-scx-10.1177_10755470241302758 – Supplemental material for The Public Trust in Science Scale: A Multilevel and Multidimensional Approach
Supplemental material, sj-docx-1-scx-10.1177_10755470241302758 for The Public Trust in Science Scale: A Multilevel and Multidimensional Approach by Anne Reif, Monika Taddicken, Lars Guenther, Justin T. Schröder and Peter Weingart in Science Communication
Footnotes
Acknowledgements
The authors thank Friederike Hendriks and Evelyn Jonas for fruitful discussions on the initial analyses for this paper and for commenting on the first draft of the manuscript.
Declaration of Conflicting Interests
The author(s) declared no potential conflicts of interest with respect to the research, authorship, and/or publication of this article.
Funding
The author(s) disclosed receipt of the following financial support for the research, authorship, and/or publication of this article: This research is part of the project “The trust relationship between science and digitized publics” (TruSDi), funded by the Deutsche Forschungsgemeinschaft (DFG, German Research Foundation) – 456602133. Grant applicants are Lars Guenther (GU 1674/3-1) and Monika Taddicken (TA 712/4-1). The project is coordinated by Anne Reif and supported by Peter Weingart in an advisory capacity. Further members of the research group are Justin T. Schröder, Evelyn Jonas, and Janise Brück.
Notes
Author Biographies
References
Supplementary Material
Please find the following supplemental material available below.
For Open Access articles published under a Creative Commons License, all supplemental material carries the same license as the article it is associated with.
For non-Open Access articles published, all supplemental material carries a non-exclusive license, and permission requests for re-use of supplemental material or any part of supplemental material shall be sent directly to the copyright owner as specified in the copyright notice associated with the article.