
Abstract
Examining the dissemination of evidence on social media, we analyzed the discourse around eight visible scientists in the context of COVID-19. Using manual (N = 1,406) and automated coding (N = 42,640) on an account-based tracked Twitter/X dataset capturing scientists’ activities and eliciting reactions over six 2-week periods, we found that visible scientists’ tweets included more scientific evidence. However, public reactions contained more anecdotal evidence. Findings indicate that evidence can be a message characteristic leading to greater tweet dissemination. Implications for scientists, including explicitly incorporating scientific evidence in their communication and examining evidence in science communication research, are discussed.
In times of crisis, evidence-based communication is considered important, as laypeople need easily accessible scientific evidence to make informed decisions (Burns et al., 2003). This evidence can be provided by scientists, who can become a firsthand source of evidence, especially on social media (Szczuka et al., 2024). During the COVID-19 pandemic, scientists also communicated via their own social media channels to the public (Utz et al., 2022) and were able to make scientific research accessible (Claassen, 2021). On those platforms, the involvement of multiple actors not only leads to the intertwining of different online public arenas (Lörcher & Taddicken, 2017; Schmidt, 2013) but also implies different forms of evidence and levels of knowledge (Neuberger et al., 2023; Taddicken et al., under review). Evidence can be generally understood “as verifiable and systematically gathered information about the world” (List, 2023, p. 2). It can be broadly divided into scientific evidence, which is obtained through scientific research, and anecdotal evidence, which is based on experience and personal stories (Hinnant et al., 2023). However, the inclusion of different forms of evidence in social media discussions is unclear.
On social media, various information circulates, including alleged evidence (Taddicken et al., under review) and even misinformation and rumors (Boberg et al., 2020; Schug et al., 2023). During the COVID-19 pandemic, there was even talk of an “infodemic” (World Health Organization [WHO], 2020). Hence, it is important to understand how and to what extent scientists’ evidence-based communication spreads on social media in the context of socioscientific issues that involve problems of social relevance and controversy (Sadler et al., 2007; Taddicken & Krämer, 2021). While the opportunities for public engagement with science (López-Goñi & Sánchez-Angulo, 2018) and the significant participatory potential for science communication via social media (O’ Neill & Boykoff, 2011) have often been highlighted, there is a lack of research on the prevalence and negotiation of evidence on social media. Under certain exceptional circumstances, such as the COVID-19 pandemic, individual scientists become the center of public attention (Joubert et al., 2023; Peters, 2021). These prominent scientists, referred to as “visible scientists” (Goodell, 1977), particularly exert a considerable influence on public debates (Fahy, 2017; Joubert et al., 2023). Therefore, it is necessary to examine a) how visible scientists include scientific evidence in their social media communication, b) how visible scientists’ content influences the public’s subsequent behavior, and c) how the public itself includes evidence in their reactions to visible scientists’ posts. In particular, Twitter/X 1 has become a popular platform for scientists to meet with other scientists and science-affiliated actors, science journalists, and political actors (Brossard & Scheufele, 2022) and to directly communicate with the public (Della Giusta et al., 2021). Even though this has been acknowledged, the dynamics of the spreading of scientific evidence have yet to be analyzed in detail.
Against this background, we analyze evidence-based communication and user engagement from the perspective of online public engagement with scientific information (Taddicken & Krämer, 2021). We aim to examine the prevalence of visible scientists’ evidence-based communication and their elicited reactions over time. To comprehensively capture this and to be able to include a large number of posts, we apply a combination of manual and automated coding. Using the example of COVID-19 pandemic communications by visible scientists on Twitter/X, we examine how they included evidence in their communication, how their provided evidence spread, and what reactions were elicited.
Literature Review
The Role of Evidence in Science and Public
In today’s “knowledge society” (Heidenreich, 2003), scientific knowledge permeates all areas of society. Scientific knowledge is characterized by its tentative nature, and science itself is not simply a source of “transcendental truths [. . .], but [of] evidence” (Ruhrmann et al., 2015, p. 682). In other words, it is based on scientific evidence, which is broadly defined as knowledge produced by experts using “accepted analytical approaches as defined by professional peers” (Weible, 2008, pp. 615–616). Scientific evidence is considered a precondition for sustained accurate prediction and is produced based on rigorous scientific methods (Merton, 1942). Thus, scientific evidence is central and immanent to science and refers to “scientific facts and the use of factual assertions and data” (Flemming et al., 2017, p. 751).
In the literature, different types of scientific evidence are distinguished (e.g., Hoeken & Hustinx, 2009; Hornikx, 2005) and can be used differently as evidence of a certain statement or fact. This study concentrates on three types of scientific evidence: statistical, studies/methods, and expert evidence. Hoeken and Hustinx (2009) define statistical evidence as “a numerical summary of a series of instances” (p. 94). Hence, it comprises database-driven figures and statistics. Moreover, scientific evidence can also become prevalent through presenting studies and the corresponding methods, i.e. studies/methods evidence, which does not necessarily involve reporting numerical characteristics (Kessler, 2016). In comparison, expert evidence is based on the testimony of an expert and not on evidence collected by means of a specific research method (Hoeken & Hustinx, 2009). Experts are distinguished by their special skills and knowledge. When experts are cited as evidence, it is recognized that they can provide relevant information to the public (Kinnebrock & Bilandzic, 2023).
Laypeople often lack the in-depth knowledge required to fully understand the scientific methods in various fields of science (Duncan et al., 2018; Hendriks et al., 2020). To be able to evaluate scientific evidence, it is central for them to understand scientists’ use of evidence, even though their scientific understanding is limited (Duncan et al., 2018). Yet, laypeople might integrate evidence into their decision-making process independent of its objective validity, which becomes crucial for risk judgment during a crisis (Lu et al., 2021).
Unlike scientific evidence, anecdotal evidence draws on stories or narratives based on people’s everyday experiences and personal testimonies with subjective expertise (Flemming et al., 2017; Moran et al., 2016). As anecdotal evidence appeals to emotions rather than cognition (Hinnant et al., 2016), it can offer opportunities for laypeople to engage in scientific discourses without having in-depth scientific knowledge and contributing to (scientific) knowledge through situational expertise from their own experiences and anecdotes (Moore & Stilgoe, 2009). It is also arguable that anecdotal evidence is more tangible through everyday salience by allowing laypeople to quantify singular examples to multiple instances (Dahlstrom, 2014; Zillmann, 2006). In the context of journalistic evidence practices, Kinnebrock and Bilandzic (2023) speak of narratives in which scientific knowledge is transformed into representations to transfer scientific facts into everyday communication. Hence, narratives can contextualize scientific knowledge and translate it into a language that is accessible to the broader public (Schug et al., 2023). Due to the increased vividness of examples used within anecdotal evidence, laypeople might be more likely to adapt information supported by anecdotal evidence without questioning the evidence (Zhao & Tsang, 2023). At the same time, studies show that individuals evaluate claims containing anecdotal evidence lower than those including scientific evidence (Hoeken & Hustinx, 2009; Hornikx, 2005; List, 2023).
Engagement With Evidence in Intertwining Online Public Arenas
The internet has become a major source of information for the public on scientific issues (Su et al., 2015; Wissenschaft im Dialog [WiD], 2023). As a wide range of content can be found online, the public can inform themselves and consume content from various sources differing in levels of expertise (Taddicken & Krämer, 2021). Therefore, scientists no longer depend on traditional gatekeepers to make information available to the public (Roedema et al., 2021). Since scientists increasingly turn to social media to communicate with the public (Della Giusta et al., 2021), they contribute to the body of available and consumable information to the public. Hence, while science has historically produced and discussed its findings mainly within the scientific community, social media enables actors beyond the scientific community to engage in scientific discourses on different levels (Neuberger et al., 2023; Taddicken & Krämer, 2021). Although engagement can be defined and operationalized in many ways, we use the classification by Taddicken and Krämer (2021) as it provides a functional structure for capturing different forms of engagement with evidence on social media.
The first form of engagement is the consumption of content where users are silent readers and do not actively engage in the discourse. This is followed by participation, where users react without actively involving themselves in it. This covers actions such as liking content or sharing. Finally, generating comprises the most elaborate form of engagement in which users actively engage by producing and contributing their content to the discourse, for instance, by writing comments, tweets, or blog posts (Taddicken & Krämer, 2021). Using this classification, we examine the role of evidence in the online public discourse on COVID-19.
The social media platforms on which online public engagement takes place are characterized by “an intermingling and integration of the different partial public spheres” (Lörcher & Taddicken, 2017, p. 4). This is especially true for Twitter, where actors from different arenas come together and share various content. Multiple audiences meld together into one, which leads to a “context collapse” (Marwick & boyd, 2010). On the one hand, Twitter/X serves as a personal or professional arena for many scientists to share their research findings and connect with their scientific network and friends (Collins et al., 2016). On the other hand, the platform’s architecture allows scientists to engage in the broader public discourse (Biermann et al., 2023; Jahng & Lee, 2018). Due to their prominence, “visible scientists” (Goodell, 1977) in particular can shape (online) public discussions (Fahy, 2017; Joubert et al., 2023) and become sources of evidence for the broader public. For this reason, it is crucial to analyze which forms of evidence are communicated by visible scientists, as different forms of evidence exert different effects on social media users’ attitudes and intentions (see for review: Zebregs et al., 2015).
Hinnant et al. (2016) found that conservative individuals with low need for cognition can reduce their uncertainty about climate change through anecdotal evidence provided in user comments to a news story. In line with that, anecdotal evidence in comments on a medical news report has been shown to generate more credibility and sympathy for the report, regardless of the direction of the argument (Hinnant et al., 2023). Particularly, people with lower confidence in their ability to evaluate evidence and lower belief that their opinion can be changed are more likely to be influenced by personal stories than by scientific evidence (Hinnant et al., 2023). However, irrespective of the type of evidence (anecdotal or scientific), supporting evidence increased perceived relevance and credibility, sympathy for the story, and willingness to share the story with others (Hinnant et al., 2023). This circumstance suggests that the inclusion of supporting evidence in comments has an impact on the perception of the original message and on subsequent behavior.
To gain deeper insights into the negotiation processes of evidence in public discourse, it is relevant to scrutinize the presence of evidence in its different forms over time. Little factual evidence about COVID-19 was available in the early phases of the pandemic. Given the lack of evidence in the early stages of the pandemic (Aviv-Reuven, & Rosenfeld, 2021), an important question arises about how visible scientists refer to evidence in their communications in the absence of solid scientific evidence. Our first research question is therefore:
Research Question 1 (RQ1): How much scientific evidence was included in visible scientists’ communications on Twitter/X during the COVID-19 pandemic?
One opportunity that social media platforms, such as Twitter/X, offer is the interaction among users with the ability to share content (Oeldorf-Hirsch & Sundar, 2015). Taddicken and Krämer (2021) describe this form of engagement as participation. In addition to sharing content, participation as a form of engagement also includes liking content. Since we are primarily concerned with the dissemination of scientific evidence, we focus here on sharing as a significant indicator of the engagement form of participation. By retweeting evidence-based content on Twitter/X, users can contribute to the distribution of evidence-based information.
In the context of research on misinformation on COVID-19, Zhao and Tsang (2023) examined how misinformation about COVID-19 vaccines, varying in terms of its truth content and type of evidence, affected intentions to share and verify the misinformation. The results of the online experiment showed that misinformation with narrative evidence was perceived as less false compared to that with statistical evidence and led to lower verification intentions and higher sharing intentions (Zhao & Tsang, 2023). A study using a general Twitter dataset on one keyword (“coronavirus”) to examine the spread of false and science-based information at an early point of the pandemic showed that false information was posted twice as much as science-based information and fact-checked tweets in their sample (Pulido et al., 2020). Nonetheless, science-based information and fact-checked tweets were proportionally retweeted more often than false tweets (Pulido et al., 2020). As the findings are not consistent with studies that found users who consume fake news are more likely to share this type of news, while users who consume science-based information are more likely not to share it, the authors conclude that information consumption and the tendency to share information on social media may be different in health emergencies (Pulido et al., 2020).
Previous research identified characteristics that make a message more likely to be shared on social media. For instance, these cover the inclusion of emotions (e.g., Stieglitz & Dang-Xuan, 2013; Yuan et al., 2022) or the perceived trustworthiness of the sender (Shi et al., 2017). While scientific knowledge only emerged gradually, the COVID-19 pandemic caused a high need for scientific information (Lu et al., 2021). We therefore assume that evidence is also one of the characteristics that make participation in the form of sharing more likely, as laypeople are looking for explanations. Further, they may not only have a high need for information but are also willing to share the evidence provided. This circumstance may have promoted the spread of evidence-based tweets since a high personal interest and a high informational value can also promote retweets (Rudat & Buder, 2015; Shi et al., 2017). As it is not well understood the extent to which evidence-based scientists’ posts are more likely to be shared, we ask:
Research Question 2 (RQ2): How did visible scientists’ tweets with scientific evidence spread, compared to visible scientists’ tweets without scientific evidence, on Twitter/X during the COVID-19 pandemic?
Moreover, social media allows the public to generate content, which is considered the most active form of engagement because the public can share their views, thoughts, or knowledge (Taddicken & Krämer, 2021). Laypeople can, for example, comment on scientists’ original posts and can thus engage directly in scientific discourses. In doing this, they can integrate evidence into their generated content. Hence, evidence might be (re)negotiated by the public (Neuberger et al., 2023).
Most studies dealing with evidence from the laypeople’s perspective analyze the impact of evidence on laypeople and its processing (e.g., Lu et al., 2021; O’Keefe, 2015) but do not examine the use of evidence by laypeople themselves. Considering that comments can change recipients’ attitudes toward the original message (e.g., Gierth & Bromme, 2019; Winter & Krämer, 2016), it is worthwhile exploring the prevalence of evidence in the public’s reactions to scientists’ posts. Their use of evidence can provide insights into the overall nature of the discourse (Pulido et al., 2020). By analyzing the extent to which evidence is a prevalent element in users’ comments, statements about the reasoning and willingness to engage in knowledge-enhancing exchanges between scientists and the public can be derived. Hence, we ask:
Research Question 3 (RQ3): How much evidence was included in replies and quotes to visible scientists’ communications on Twitter/X during the COVID-19 pandemic?S
Research Design
To explore scientists’ communication-induced discussions on social media, we focus on the microblogging platform Twitter/X, as it is widely used by scientists (e.g., Walter et al., 2019). To collect a fitting data sample, we first identified visible scientists in the field of virology and tracked their accounts at six time periods crucial during the pandemic. After finishing the data collection, we conducted a manual content analysis and used these results for supervised automated coding (Figure 1). In the following, each step of the research design is described in detail.

Research Design.
Identification of Visible Scientists and Periods
To determine visible scientists, we applied a multistaged procedure (Supplemental Material). First, we reviewed the websites of all German virology research institutes and focused on scientists who met the criteria of academic tenure (completed PhD), affiliation to an official research organization, and publication activity in scientific peer-reviewed journals to generate an initial list (N = 311). Of those, 64 scientists had a Twitter account. To ensure that the scientists reached a broad public and thus represented “visible scientists” in the discourse (Goodell, 1977), we focus on scientists with more than 10,000 followers at the time of data collection (n = 7). Hence, we operationalize the analytical concept of visibility, which originally referred to scientists present in the mass media (Fahy, 2017; Goodell, 1977) as scientists who were particularly visible in social media during the COVID-19 pandemic. Looking at the list of followed accounts by the seven visible scientists, we identified one further virologist from another country but who was active in the German-speaking sphere and met all the aforementioned criteria. Therefore, we decided to include this person in the selection. Out of the eight identified visible scientists, three were female and five were male. At the time of data collection, they had an average of 207,473 followers, SD = 319,934.90, ranging from 15,553 to 988,736.
To determine the analysis periods, the timeline of the COVID-19 pandemic in Germany was scanned to find periods that covered relevant pandemic events (e.g., lockdowns), assuming that scientists were particularly encouraged to share their expertise with the public during these times. Following this approach, we identified six periods, each lasting for 14 days after the start of the respective event (see Figure 2).

Timeline of the Derived Six Time Periods Each Lasting 14 Days.
Data Collection
For data collection, an account-based approach was pursued for the six periods. The data were collected by a self-developed crawler based on the social media analytics framework (Stieglitz et al., 2018) and utilized the open-source library Twitter. In detail, tweets, retweets, replies, and quotes were captured for each visible scientist. By that, the whole Twitter activity from the scientists themselves and around the scientists was collected (including mentioning of scientists in tweets by using the @ operator), allowing a broad view of their communication patterns.
In total, we collected 582,964 posts. On average, the scientists posted over all six periods 246.88 times, SD = 221.34, ranging from 18 to 622. As retweets are duplicates of the original tweets in terms of content, we removed them from the analyses, which initially led to a sample size of 273,039 tweets, replies, quotes, and tweets from other users that mentioned the visible scientists. As we were only interested in the reactions to the scientists’ posts, we also excluded tweets from other users that only mentioned the visible scientists (n = 230,399), resulting in a final sample size of 42,640 posts for our analysis.
Since we used the outcome of the manual coding of scientists’ communications as training data sets for application of supervised machine learning algorithms, we first randomly draw a subsample of 120 tweets and quotes for each period. 2 This allowed us to ensure a feasible amount for manual coding and a sufficient number for the following automatic analysis (Figure 3, Subsample MCS). We focused on tweets and quotes as we wanted to gain a deeper insight into scientists’ original content that can be considered as a starting point for further discussions. The vast majority (n = 615) of all considered posts (n = 686) included a COVID-19 reference (89.7%). For automated coding, we extended the data set of the manual coding (Figure 3, Subsample ACS). We analyzed all the scientists’ tweets, replies, and quotes over all six periods (n = 1,975).
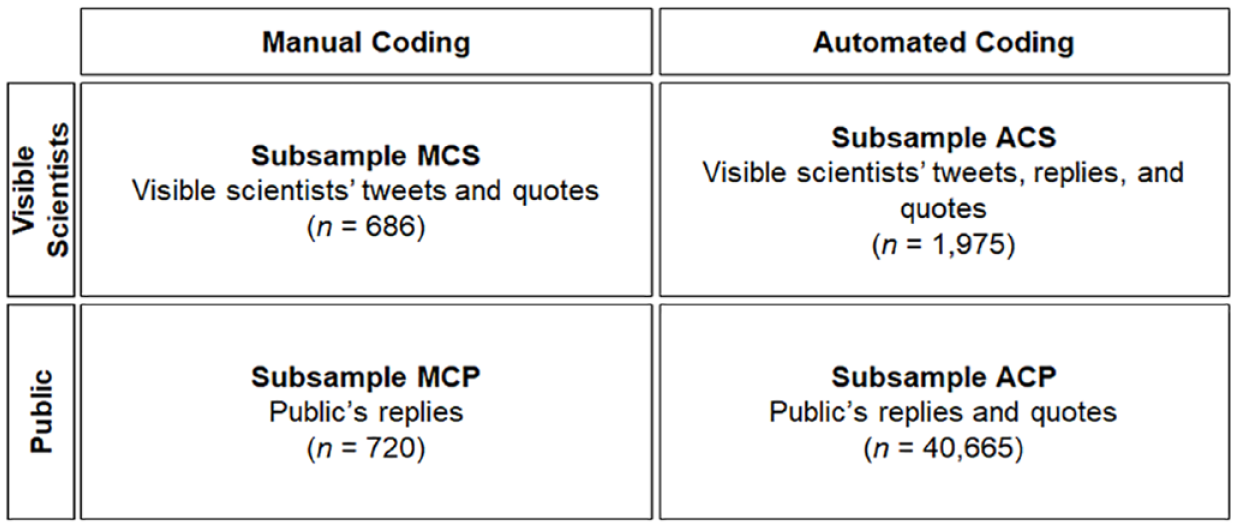
Division in Subsamples (N = 42,640) of the Overall Sample of Visible Scientists’ and Public’s Posts (N = 273,039).
As we were also interested in the reactions, we manually selected all replies to the manually analyzed scientists’ posts via the ID of the original post (Figure 3, Subsample MCP). The number of replies to scientists’ posts varied among the periods (M = 4,007, SD = 4,184.37). For each period, we randomly sampled 120 replies of the 24,024 replies for manual coding (n = 720). The vast majority of replies were identified as the general public (93.3%). Actors from science (2.9%) and practical experts from the health sector (2.8%) each accounted for almost three percent, followed by actors from the media (0.8%). One account was coded as belonging to a civil society actor (0.1%). Thus, the social media discussions following scientists’ posts seem to be dominated by the general public. For the automated coding, we included all public responses on posts shared by the scientists (Figure 3, Subsample ACP). This led us to a subsample of 40,665 quotes and replies shared by the public as reactions to scientists’ posts.
Manual Coding
For the manual content analysis, we developed a coding scheme for both the analysis of scientists’ posts and replies to them (Supplemental Material). Besides formal categories (e.g., period, type of tweet), our standardized codebook included variables with subcategories to capture the use of evidence in scientists’ posts and the replies to them.
We first coded the prevalence of scientific evidence and differentiated between statistical evidence, evidence by studies/methods, and expert evidence (as defined earlier). Multiple codes were possible. Besides scientific evidence, we also coded the prevalence of anecdotal evidence (e.g., stories of personal experiences). We defined anecdotal evidence as concrete and experience-based information, such as experience reports. All variables referring to evidence were coded as binary variables (0 = not present, 1 = present).
The manual coding was carried out by two coders who underwent extensive training and adjustment processes until a mutual understanding of the categories was assured. To ensure reliability, Krippendorff’s alpha intercoder reliability was calculated on two random subsets of 100 scientists’ posts and 100 replies. The coefficients varied between 0.75 and 1.00 across all variables and showed overall acceptable reliability (Supplemental Material B).
Automated Coding
With automated coding, we aim to extend manual coding to be able to process a large amount of data with supervised machine learning. In supervised machine learning, the system learns with the help of learning data, which the developer creates and provides to train the system (Pang et al., 2002). To detect evidence in our collected data, we decided to apply supervised learning, which is more applicable than unsupervised learning since the outcome variable is predefined and does not change regularly (Pang et al., 2002). We applied Support Vector Machines (SVM) since testing various machine learning algorithms has proved that SVMs provide better results than other techniques for Twitter data (Dilrukshi & De Zoysa, 2013).
Before running the SVM algorithm, we preprocessed the data to be analyzed to reduce noise with the help of the Natural Language Toolkit (NLTK) (Birjali et al., 2021). Accordingly, we used the following features to prepare the data: tokenization, filtering, the removal of stop words, and stemming. Tokenization involves separating the words in a sentence and removing all punctuation and special characters. In the filtering phase, important words are selected from the token result. The most frequently used words are unrelated, so-called stop words (e.g., “and,” “a,” “in,” “the,” etc.). The dictionary of German stop words was applied to our data using Python NLTK stop words (https://pythonspot.com/nltk-stop-words/). Finally, a stemming method is used to find the root of a word (e.g.,” studying,” “studies,” “study,” to “studi”). The objective of stemming is to identify both inflectional and occasionally derived forms of a word and subsequently reduce them to a shared base form (Chai, 2023; Jivani, 2011). Stemming is additionally performed to minimize the number of different document indexes. This reduction in the space of word representation enhances the performance in information retrieval and automatic text summarization (Chai, 2023). As training data, we used the manual coding of the visible scientists’ posts. During the manual coding, only 20 cases were found in which anecdotal evidence was present, so the SVM model was only trained to predict scientific evidence. While we differentiated the three different types of scientific evidence during our manual coding, we decided to train the SVM algorithms to only differ between the presence (present = 1) or absence (not present = 0) of scientific evidence. In this way, we ensured that the algorithm was trained as efficiently as possible, since it only needs to distinguish between two cases, although by making this decision, we limited the insights in the data. Classifiers were built using the SVM package in the sci-kit-learn library. The dataset used to make the training model is 70%, and the remaining 30% of the data is used to test the model and get an accuracy value from the classifying algorithm. We adjusted and improved our algorithm and finally reached an accuracy score of 82.69%.
Results
RQ1: How Much Scientific Evidence Was Included in Visible Scientists’ Communications on Twitter/X During the COVID-19 Pandemic?
To answer the first research question, we analyzed how many posts of visible scientists contained scientific evidence (Subsample ACS). According to the results of automated coding, only every tenth tweet, 10.5% (n = 207) of the posts contained scientific evidence. Thus, in most of the posts, the selected scientists did not include cues of scientific evidence (89.5%, n = 1,767). However, differences occur between different types of posts; scientists included in their tweets (15.7%; n = 66) and quotes (19.3%, n = 110) significantly more scientific evidence than in their replies (3.1%, n = 31), χ2 (2) = 116.34, p < .001, Cramer’s V = .243 (Table 1). An example of posts by visible scientists that do not contain evidence is the following post in which one of the visible scientists criticizes the German tabloid Bild: Very good summary of the @hartaberfair broadcast [German talk show] in @faznet [German newspaper]. Unfortunately, @BILD [German tabloid] tries to bait with a misleading quote from me . . . [. . .] (visible scientist 4, period 1, own translation).
Scientific Evidence in Visible Scientists’ Posts According to Post Types (n = 1,975).
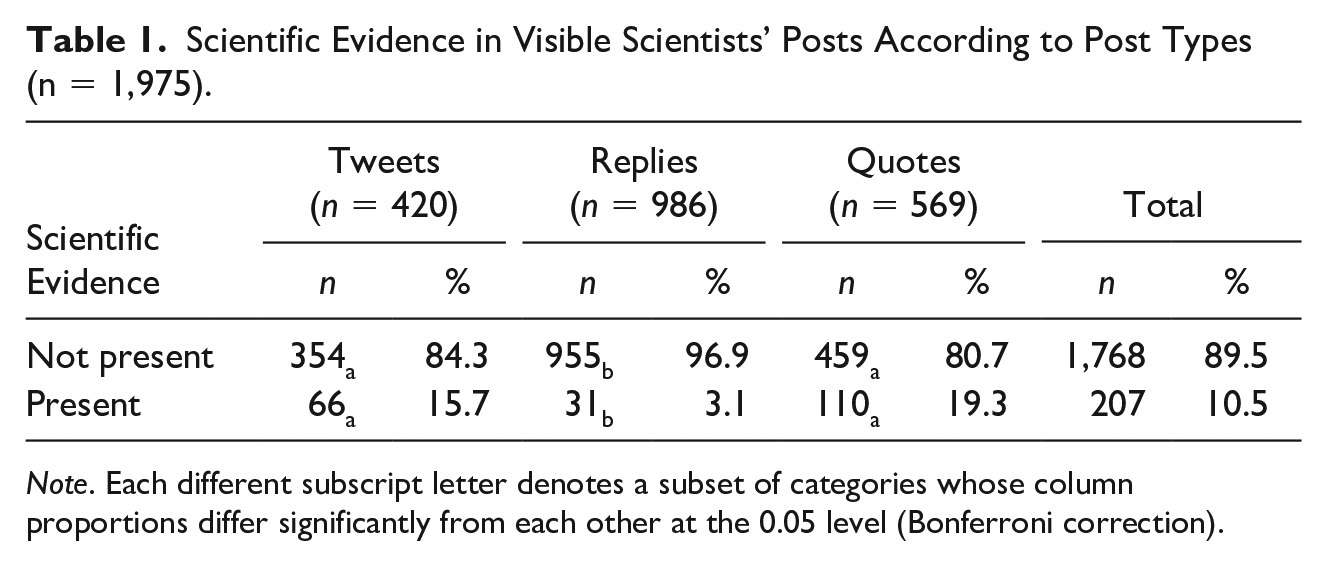
Note. Each different subscript letter denotes a subset of categories whose column proportions differ significantly from each other at the 0.05 level (Bonferroni correction).
The prevalence of anecdotal evidence was only examined with our manual coding (subsample MCS). It shows that only 2.9% (n = 20) of the posts of visible scientists (n = 686) referred to anecdotal evidence. Thus, it was almost absent, indicating that visible scientists do not lend evidence through personal experiences and narratives. One of the exceptions is the following post from visible scientist five, who refers to her own experiences in the university hospital: It is astonishing with what conviction people without insight into the health system explain to me that there is no problem with #Omicron. I am a doctor, work at a university hospital, see the findings in the lab & patient numbers & staff situation #SARSCoV2 #COVID1 period every day. (visible scientist 5, period 6).
To gain a more detailed insight into the different types of scientific evidence, we additionally analyzed the manually coded evidence types of visible scientists’ posts containing scientific evidence (n = 181) (Subsample MCS). The most frequently used type of scientific evidence was expert evidence (quoting other experts as sources of evidence), which was present in more than half of all posts that included scientific evidence (n = 103, 56.9%). As an illustration for sharing statements from their colleagues, the following post can be cited as an example: Thank you @[name of an Austrian virologist]… for taking the time to present your data here and for sharing those valuable reagents! (visible scientist 2, period 1).
Expert evidence was followed by evidence from studies/methods (n = 88, 48.6%). This evidence type can be illustrated by the following example referring to a study on immunity against coronaviruses: Very interesting study on existing T-cell immunity against the cold coronaviruses, which can also protect against #SARRSCoV2 or against severe courses of #COVID19 (visible scientist 2, period 5, own translation).
Statistical evidence was the least prevalent scientific evidence type in visible scientists’ posts (n = 43, 23.8%). In the following post of visible scientist 2 including statistical evidence, she refers to statistical key figures in the context of hospitalization: Vaccinated people are therefore hospitalized 1/0.081= approx. 12 times less often than unvaccinated people, calculation: (45/55)/(91/9)=0.081. The illustration seems a little strange, but that is exactly how it is to be expected at the moment (visible scientist 2, period 5, own translation).
Taken together, our results of the manually coded posts suggest that the visible scientists mostly used other experts and studies as evidence sources in their posts. Moreover, we ran a chi-square test with Bonferroni correction for the automatically coded sample of scientists’ posts (Table 2). The results showed a significant positive association between scientific evidence and period in visible scientists’ posts, χ2 (5) = 25.95, p < .001, Cramer’s V = .114. Scientific evidence in visible scientists’ posts started on a low level and increased over time (Figure 4).
Scientific Evidence in Visible Scientists’ Posts Over Time (n = 1,975).
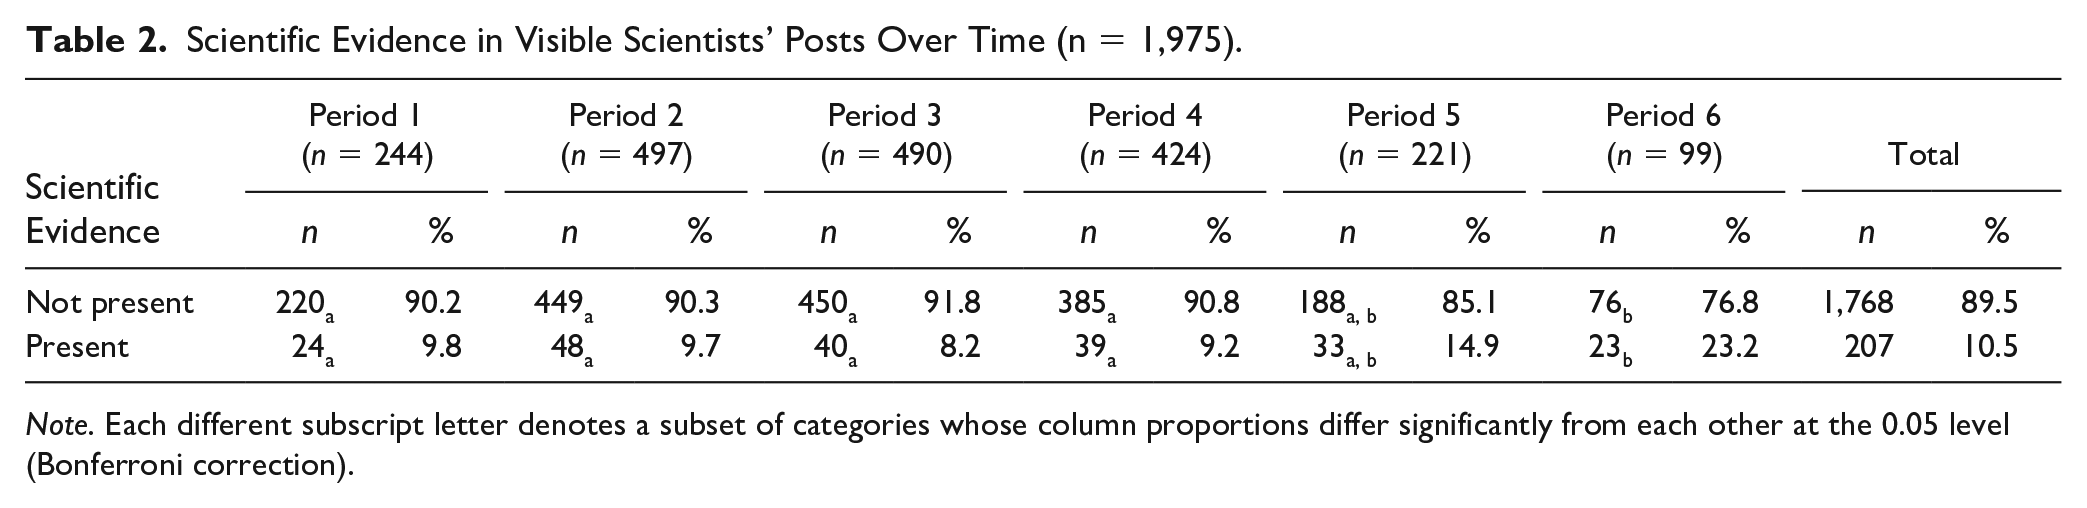
Note. Each different subscript letter denotes a subset of categories whose column proportions differ significantly from each other at the 0.05 level (Bonferroni correction).
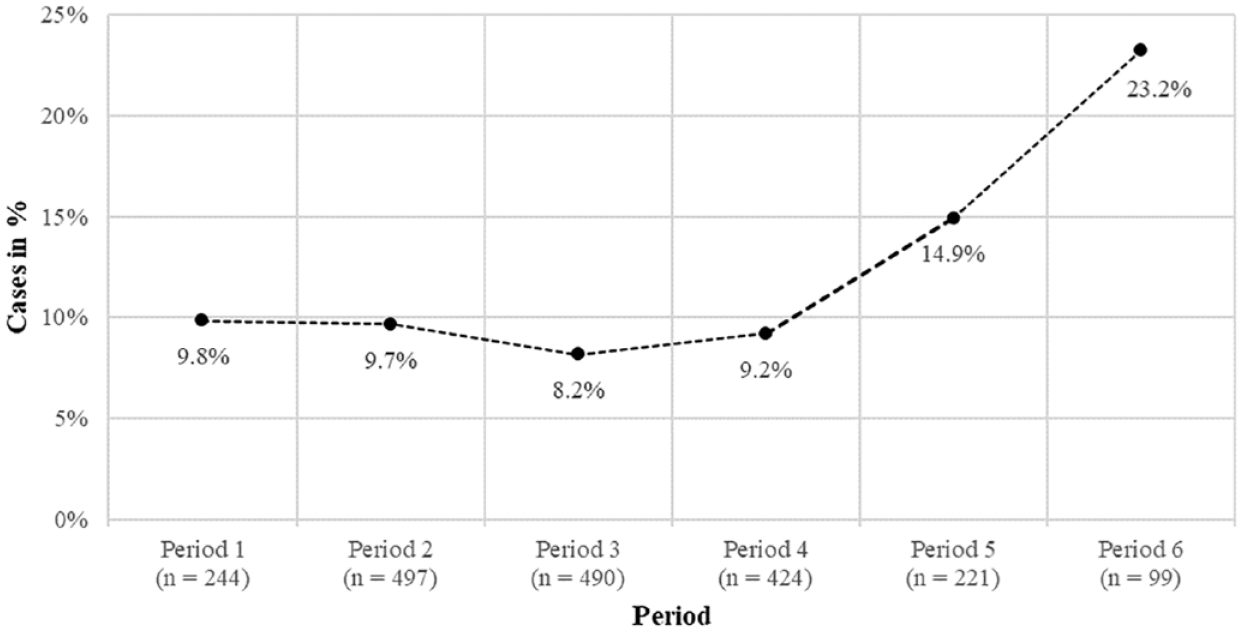
Prevalence of Scientific Evidence (n = 207) in Visible Scientists’ Posts Over Time (n = 1,975).
We further ran several chi-square tests with Bonferroni correction to analyze the association between period and scientific evidence type in the manually coded subsample (Subsample MCS). A significant relationship between expert evidence and period was found, χ2 (5) = 23.89, p < .001, Cramer’s V = .363. More precisely, our results showed that expert evidence occurred significantly less frequently in the sixth period than in the first and second periods (Table 3). Our results also demonstrated a significant relationship between the prevalence of evidence by studies/methods and period, χ2 (5) = 17.57, p = .004, Cramer’s V = .312. Evidence by studies/methods was significantly more visible in the last than in the first and fourth periods. The same applies to evidence by statistics, which was significantly more present in the last and fourth periods than in the second period, χ2 (5) = 18.21, p = .003, Cramer’s V = .317.
Evidence Types in Visible Scientists’ Posts including Scientific Evidence Over Time (n = 181).
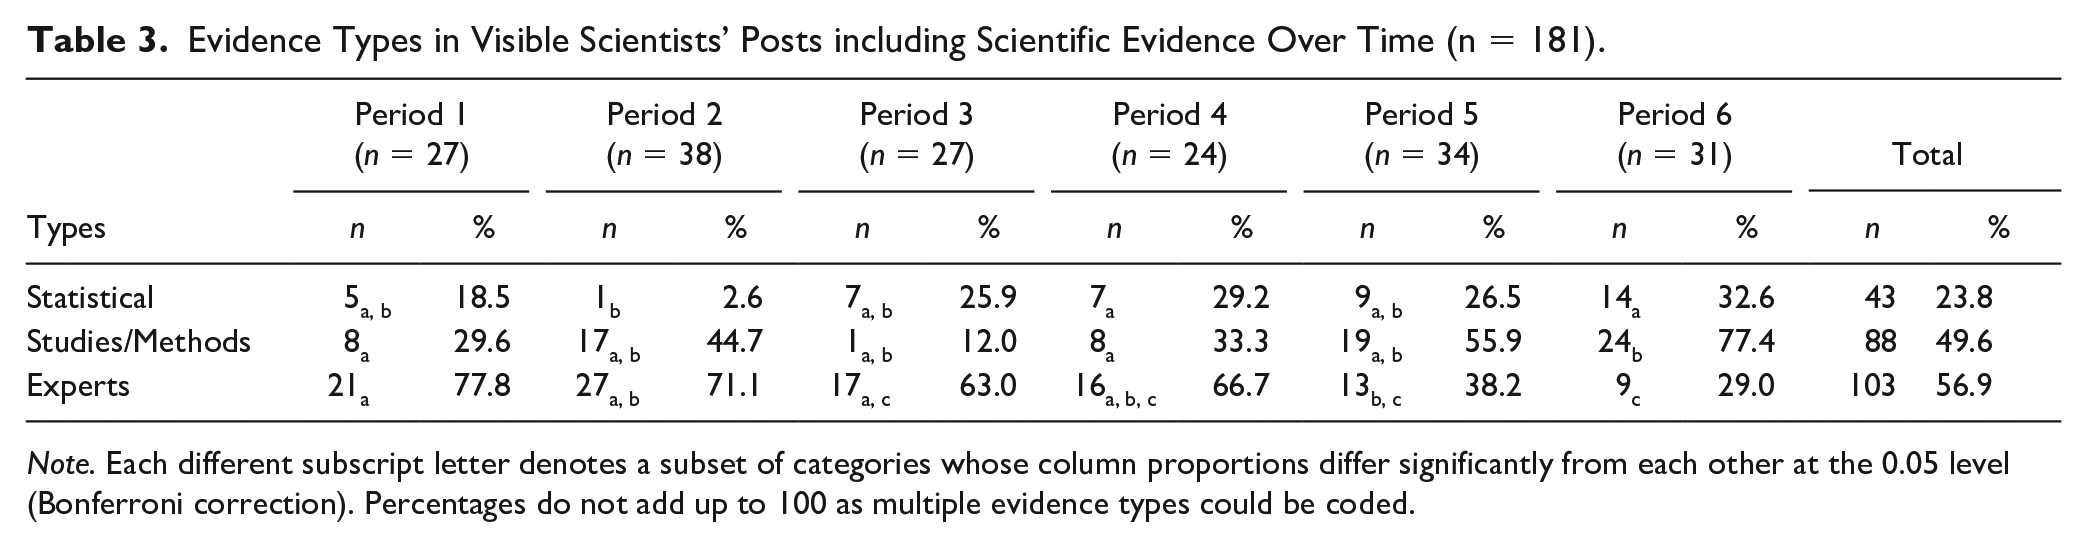
Note. Each different subscript letter denotes a subset of categories whose column proportions differ significantly from each other at the 0.05 level (Bonferroni correction). Percentages do not add up to 100 as multiple evidence types could be coded.
Overall, our results indicate that the visible scientists rarely draw on scientific evidence. Moreover, the results of our manually coded posts suggest that different types of evidence were used by the visible scientists in different time periods. The use of scientific evidence and types of scientific evidence thus seems to be subject to change over time.
RQ2: How Did Visible Scientists’ Tweets With Scientific Evidence Spread, Compared to Visible Scientists’ Tweets Without Evidence, on Twitter/X During the COVID-19 Pandemic?
To investigate how posts containing scientific evidence were distributed in contrast to the ones without scientific evidence, we looked at the retweet count of each post (Subsample ACS). The retweet count of each post shows how many times the post was shared by others. The posts containing scientific evidence were, on average, more often retweeted (M = 128.29, SD = 28.84) than the ones without scientific evidence (M = 80.59, SD = 9.52). According to the Kruskal–Wallis test, the difference is statistically significant with a strong effect size, χ2 (1) = 78,41, p < .001, ηp2 = .628. Thus, visible scientists’ tweets presenting scientific evidence were clearly more often shared on Twitter/X than those without scientific evidence (Figure 5).
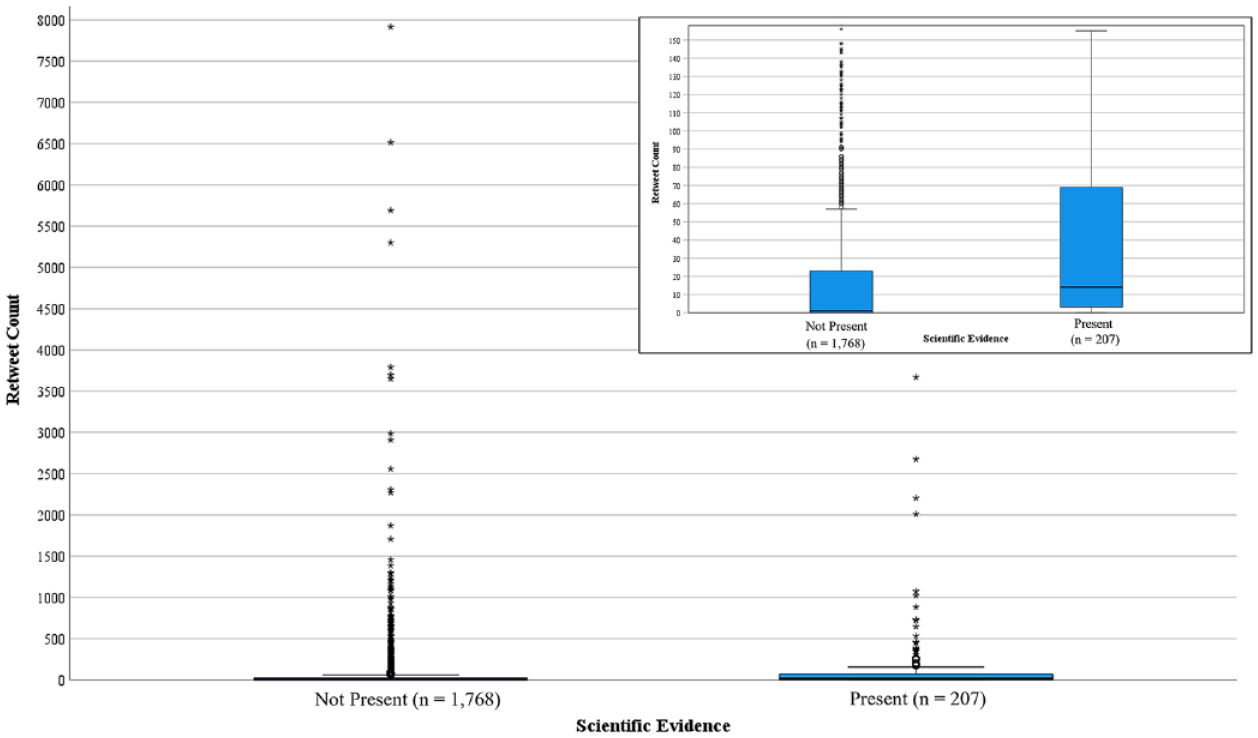
Retweet Count by Visible Scientists’ Posts Without Scientific Evidence (n = 1,768) and Visible Scientists’ Posts With Scientific Evidence (n = 207).
RQ3: How Much Evidence Was Included in Replies and Quotes to Visible Scientists’ Communications on Twitter/X During the COVID-19 Pandemic?
Further, we aimed to analyze how the public included evidence in their generated content in reaction to scientists’ tweets. For that, we applied the SVM algorithm to the replies and quotes shared by the public during the six time periods (Subsample ACP) to identify evidence-based communication. The results shown in Table 4 reveal that most posts generated by the public over the six time periods did not contain scientific evidence. Only a minority of posts (on average 0.7% of the posts) indicated the existence of scientific evidence. In comparison, 10.5% of the visible scientists’ posts were identified as evidence-based communication. Therefore, this shows that, in general, the scientific evidence from visible scientists’ posts was hardly echoed in the public’s posts. As with the scientists, anecdotal evidence was only manually coded (MCP). We found that 10% (n = 72) of the manually coded public’s replies (n = 720) contained anecdotal evidence.
Scientific Evidence in Public’s Replies and Quotes Over Time (n = 40,665).
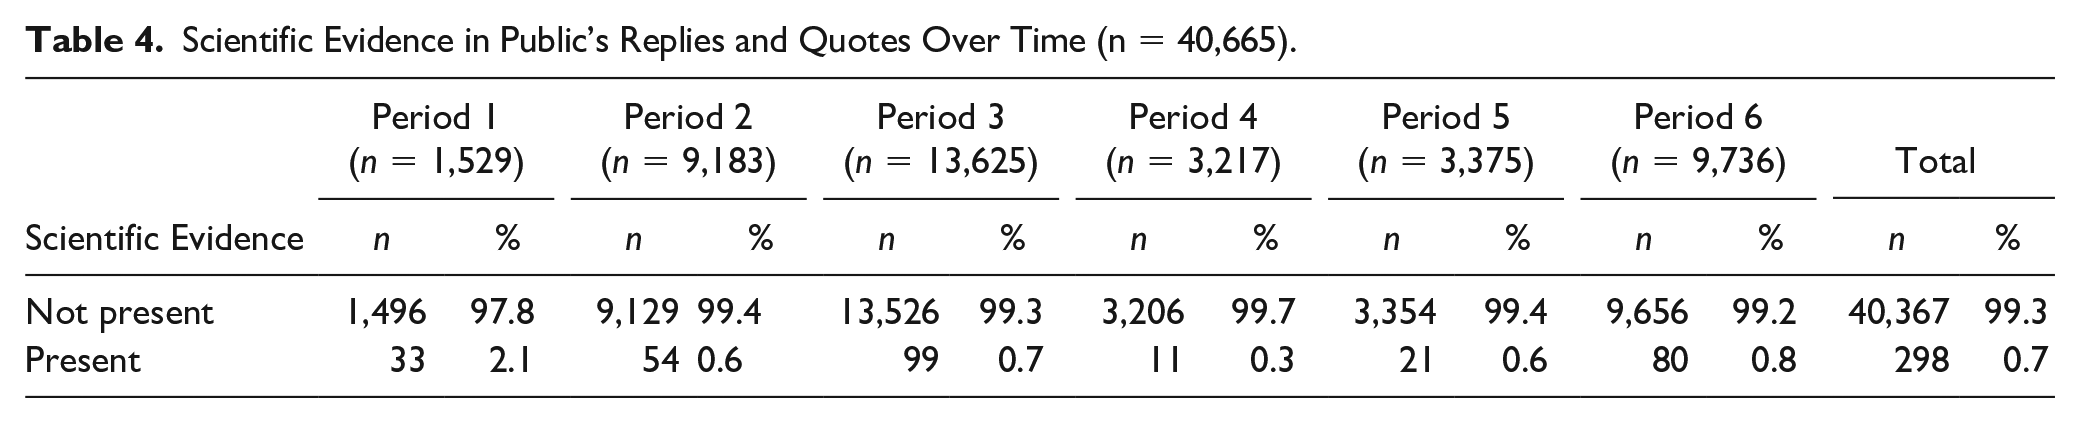
Moreover, we were interested in whether the prevalence of scientific evidence in posts shared by the public depends on the prevalence of scientific evidence in the visible scientists’ posts (Subsample ACP). In detail, we calculated the count of scientific evidence in all responses to each visible scientist’s post, summing up the occurrence of scientific evidence in the responses. With this data, we ran a Kruskal–Wallis test, comparing the prevalence of scientific evidence in responses to visible scientists’ posts with scientific evidence to scientific evidence in responses to visible scientists’ posts without scientific evidence. Responses to posts with evidence contained on average more evidence (M = .35, SD = 1.15) than to posts without evidence (M = .13, SD = 0.84). Relying on the Kruskal–Wallis test, the difference is statistically significant with a moderate effect size, χ2 (1) = 10.99, p = .001, ηp2 = 0.371. The following reply shows how visible scientists’ evidence was negotiated by the public in their replies: If, according to @virologist_5, B117 is around 100% in Switzerland: What does this tell us about the spread of the South African variant? Will it remain underrepresented despite its immune escape or become dominant as immunization against B117 increases? (reply, period 4, own translation).
Moreover, we compared visible scientists’ and the public’s use of anecdotal and scientific evidence. Therefore, we calculated several chi-square tests of independence from our manually coded data where anecdotal evidence and scientific evidence were captured (Subsample MCS and Subsample MCP). While scientists’ posts contained significantly more scientific evidence (n = 181) than the replies to them (n = 38), χ2 (1) = 141.10, p < .001, anecdotal evidence was significantly more common in the replies (n = 72) than in the original posts (n = 20), χ2 (1) = 23.54, p < .001. Cramer’s V indicated that the strength of the association between the type of post (scientists’ tweets vs. publics’ replies) and scientific evidence was moderately strong, Cramer’s V = .323, p < .001, compared to the rather small association between type of post and anecdotal evidence, Cramer’s V = .133, p < .001. Therefore, the results of the manual analysis indicate that scientists and the public differ significantly in their use of evidence. The following example of a reply by the public questioning the effectiveness of the vaccine illustrates the way the replies include anecdotal evidence referring to individual experiences: But you have already noticed what is going on here. In the case of an acquaintance, almost no antibodies are detectable after 3 months. Expensive fun (reply, period 5, own translation).
Discussion
In crises, in particular, the public needs to process information in a way that contributes to informed judgments and decisions, which is likely to involve the use of different types of evidence (Lu et al., 2021). Through social media, scientists can share scientific information and communicate directly with various actors (Della Giusta et al., 2021; Walter et al., 2019), thus providing evidence to the public (Claassen, 2021). We set out to investigate the prevalence of evidence shared by eight visible scientists on Twitter/X during the COVID-19 pandemic. Further, we aimed to examine how visible scientists’ posts containing evidence were distributed and which reactions they yielded. We found, however, that only the minority of all visible scientists’ posts contained scientific evidence. Anecdotal evidence was barely prevalent in the manually coded random sample of the selected scientists’ posts (RQ1). Current data indicate that during the peaks of the COVID-19 pandemic, visible scientists mostly shared their content or responded to other users’ posts without backing up their information with scientific evidence. Interpreted differently: public communication of scientists on Twitter/X did not solely rely on evidence-based content but extended beyond it (e.g., media criticism, own views on political measures, and call to actions) (Biermann & Taddicken, 2024).
Concerning the development of evidence use over time, in the first year of the pandemic (period one to four), about one-tenth of all posts shared by visible scientists contained scientific evidence. Afterward, the number of posts containing scientific evidence increased. In the sixth period, approximately one-third of all shared tweets, quotes, and replies distributed by visible scientists contained scientific evidence. The use of scientific evidence in visible scientists’ posts increased over time and appeared in parallel to the emerging scientific progress regarding the COVID-19 virus (Aviv-Reuven & Rosenfeld, 2021). As the manual analysis revealed, the visible scientists mostly relied on expert evidence in their tweets by quoting other experts as sources (Hoeken & Hustinx, 2009). Analysis over time showed that this was especially the case at the beginning of the pandemic. The visible scientists seemed to compensate for the lack of data and studies by sharing statements from their colleagues. In the later periods of our analysis, the visible scientists included scientific evidence in a higher number of posts and additionally relied more on evidence from studies and statistics than on other experts.
Concerning RQ2, we analyzed how evidence was distributed in visible scientists’ communications on Twitter/X during the COVID-19 pandemic. The analyses revealed that posts that initially contained scientific evidence received more retweets than posts without scientific evidence. Thereby evidence-based tweets were more likely to reach more users. By retweeting posts including scientific evidence, users actively participate in the discourse and contribute to the faster and wider dissemination of evidence on Twitter. As indicated by prior research (Pulido et al., 2020), this finding highlights that if the visible scientists were available as firsthand sources of evidence, they were adopted as such, as messages containing scientific evidence gained more attention than those without scientific evidence.
To answer RQ3, we analyzed the prevalence of evidence in reaction to visible scientists’ posts. Indeed, compared to visible scientists, the general public used much less scientific evidence when they generated their content in reaction to visible scientists’ posts. Thereby, the amount of scientific evidence shared by the public varied little throughout the pandemic except in period 1. One possible explanation could be the significantly lower total volume of comments during this period. In contrast to later periods when scientists gained greater visibility in the public sphere, comments during this period may have been generated mainly by other scientific actors, as Twitter/X serves as a platform for most scientists to network within their professional peer groups. In contrast to scientific evidence, the public used anecdotal evidence more frequently. In doing so, the use of anecdotal evidence by the public differed significantly from the use of anecdotal evidence in visible scientists’ posts. Our findings suggest that the public processes and communicates information in front of the background of personal stories and experiences, which is in line with previous research on information processing (Hinnant et al., 2016; Zillmann, 2006). However, our results also indicate that the prevalence of scientific evidence in scientists’ posts influences the use of scientific evidence in the reactions, as significantly more scientific evidence was found in reactions to posts with scientific evidence compared to reactions without scientific evidence. One explanation for this phenomenon is rooted in public reactions in form of quotes, as the scientific evidence of the visible scientists are disseminated directly in these. More specifically, if the visible scientists’ posts contain scientific evidence, these are also always visible in the public’s quote in addition to the public comment. Furthermore, studies have shown that specific message characteristics of original contributions influence follow-up communication in digital communication environments (e.g., Kluknavská et al., 2023; Ziegele et al., 2018). For instance, in the context of political communication on Facebook, it could be shown that emotions in the original posts also led to emotional expressions in the elicited reactions (Zerback & Wirz, 2021). Therefore, scientific evidence, especially in times of crisis, also appears to represent such a message characteristic that not only leads to a greater dissemination of a post, but is also increasingly taken up in follow-up communication. Despite these observed patterns, it remains unclear to what extent the evidence presented is negotiated or even contested in responses that contain evidence (Zachmann et al., 2023). Further research into these dynamics is crucial for a nuanced understanding of the interplay between scientific evidence and online public engagement.
Taken together, our results emphasize differences between visible scientists’ and the public’s use of evidence. In this regard, visible scientists and the public might negotiate evidence differently, yet since different online public arenas are intertwined Twitter/X (and other social media platforms) offers an environment where scientists and the public can both present and negotiate evidence (Neuberger et al., 2023; Taddicken et al., under review). The results indicate that using scientific evidence by visible scientists affects the use of scientific evidence in induced discussions. Although the relative proportion is small, our results give reason to believe that evidence in visible scientists’ posts encourages users to argue alike and to take up the evidence presented. Hence, evidence-based information seems to favor evidence-based discussions. This finding supports the call for evidence-based science communication and highlights that scientists should explicitly state scientific evidence and reflect on their communication when engaging with the public, as recommended in science communication training (Baram-Tsabari & Lewenstein, 2013; Besley & Dudo, 2022; König et al., 2023). Our finding that posts with scientific evidence spread faster reveals that in times characterized by uncertainty, the public does indeed seem to primarily seek out content with scientific evidence to make informed decisions (Burns et al., 2003). Therefore, it is important for laypeople to be able to assess the evidence provided, respectively, the trustworthiness of the source (Bromme & Goldman, 2014), to avoid spreading false evidence.
As we were able to give insights into the distribution of scientific evidence on social media and its relevance for online public engagement with science, our research offers starting points for theoretical considerations on the role of evidence in social media discussions that need to be addressed in science communication research. It seems essential to take a closer look at the conceptualization, construction, processing, and negotiation of evidence in digital communication environments (Neuberger et al., 2023). What does it ultimately mean for science that different actors can refer to various forms of evidence in their social media communication and that evidence is also taken up and negotiated by laypeople (Zachmann et al., 2023)? This requires a thorough understanding of how diverse participation opportunities shape the public discourse on science. These inquiries relate to the role of different actors and their use of evidence and its contextualization.
Limitations and Outlook
When looking at the spread of evidence on Twitter/X, the platform’s characteristics cannot be ignored. Individual tweets are limited to 280 characters, 3 which makes it quite difficult, if not restrictive, to fit anecdotal or scientific evidence within one post. Thus, the increased complexity of classifying evidence manually and automatically within tweets should be remembered when analyzing the results. Caution is also required when interpreting the results of our manual coding regarding the different evidence types, as the absolute numbers were relatively small.
Our analysis focused on detecting scientific evidence but did not evaluate its quality or scientific accuracy. Therefore, our results provide insights into the prevalence and distribution of content considered as evidence based on indicators but do not verify its correctness or alignment with current knowledge. In addition, the sample should be addressed. The initial sample of tweets focused on eight visible scientists to ensure the potential for broad reach; therefore, it is reasonable to assume that overall engagement was higher compared to less visible scientists. As our analysis is limited to eight visible scientists in a particular field, the findings cannot be generalized to all communicating scientists’ evidence practices. Moreover, it should be noted for the manually coded data that these only represent a subset of all posts per period, which inevitably entails a sampling error; since the relative sample size varied per period, this is also accompanied by different error rates per period. Nevertheless, our combination of manual and automatic coding offers insights into the dissemination of evidence in a highly visible discourse, taking into account a large number of posts over a long period of time. Regarding participation as an online public engagement form (Taddicken & Krämer, 2021), it is important to point out that we exclusively focused on participation via the retweet count; future studies ought to examine additional participation indicators, such as likes.
Another critical limitation to consider is the potential influence of social bots in our analysis. Previous research has demonstrated the substantial role of bots in magnifying discussions related to COVID-19 on platforms such as Twitter/X (e.g., Weng & Lin, 2022; Zhang et al., 2023). Zhang et al. (2023) found that social bots constituted a considerable portion of Twitter activity related to COVID-19 discussions, primarily focusing on disseminating objective information, contrasting with human users who often engaged more with personal and societal topics. Consequently, social bots may have significantly contributed to the dissemination of tweets containing scientific evidence during the pandemic. Their active involvement in online discourses, along with their ability to centrally retweet and amplify specific themes (Weng & Lin, 2022), poses a challenge in accurately capturing the public’s use and negotiation of evidence within social media discussions.
Above all, the exceptional situation of COVID-19 must be considered when interpreting all the results. It remains questionable if the results are transferable to times of less threat and uncertainty or other matters with more or less social interest. However, the importance of evidence-based decisions in times of crisis stays essential (Lu et al., 2021) and should still be assessed in future research. Future research should therefore analyze the potential impact on the dissemination of information and encompass the intertwined role of evidence negotiators in detail. It should be more deeply elucidated whether and how evidence motivates users to respond with evidence. Experimental studies should include different motivations and other influencing factors, such as situational factors, to gain insights into the interplay of evidence with other possible drivers of engagement. Accordingly, future research should also examine the emotions evoked by such communication to better understand the processing of evidence-based information on Twitter/X as emotionalization expands a message’s distribution (Stieglitz & Dang-Xuan, 2013). As features of the social media profile such as blue check mark can have an impact on the dissemination of posts (e.g., Weng & Lin, 2022), future research on visible scientists and the distribution of evidence should increasingly consider changing platform environments, such as the new payment-based verification system of Twitter/X, which is no longer based on well-known accounts of public interest as at the time of analysis. Moreover, given the influence of source cues on credibility judgments of the information (e.g., Metzger et al., 2010; Vraga & Bode, 2017; Wang, 2021), understanding how these changes affect perceptions of credibility becomes increasingly relevant.
Beyond that, if science communication research continues to identify the fostering of public engagement, future research should also pay more attention to scientists’ perspectives and challenges in communicating scientific evidence in digital communication environments. As scientists are not the only actors presenting evidence cues online, and their evidence may even be undermined (Schmid-Petri, 2017; Schug et al., 2023; Taddicken et al., under review), there is a risk of the destabilization of established evidence and expertise (Schug et al., 2023). Hence, it is indispensable to consider how laypeople can differentiate between the evidence provided by real experts and feigned experts on social media.
Conclusion
This study has shed light on the role of evidence in social media discussions during the course of the pandemic from the perspective of online public engagement with scientific information (Taddicken & Krämer, 2021). Deriving from our results, we can conclude that at the beginning of the pandemic scientific evidence cues were rarely present in visible scientists’ posts but increased over time. Our findings suggest that visible scientists engage in broader discussions in publicly visible online discourses because they do not limit their communication to scientific evidence. Consequently, the overall paucity of scientific evidence indicates that scientists have communicated beyond traditional science communication, which raises questions about their role conceptions on social media. However, the fact that tweets with scientific evidence received more retweets indicates a high demand for scientific evidence during the pandemic. Our study provides a starting point for further research analyzing evidence practices in digital communication environments where scientists and laypeople can consume, participate with, and generate (evidence-based) scientific content. Examining the evidence on social media can enhance our understanding of visible scientists’ public engagement and the public’s engagement with science in the context of socioscientific issues.
Supplemental Material
sj-docx-1-scx-10.1177_10755470241249468 – Supplemental material for Does Scientific Evidence Sell? Combining Manual and Automated Content Analysis to Investigate Scientists’ and Laypeople’s Evidence Practices on Social Media
Supplemental material, sj-docx-1-scx-10.1177_10755470241249468 for Does Scientific Evidence Sell? Combining Manual and Automated Content Analysis to Investigate Scientists’ and Laypeople’s Evidence Practices on Social Media by Kaija Biermann, Bianca Nowak, Lea-Marie Braun, Monika Taddicken, Nicole C. Krämer and Stefan Stieglitz in Science Communication
Footnotes
Declaration of Conflicting Interests
The author(s) declared no potential conflicts of interest with respect to the research, authorship, and/or publication of this article.
Funding
The author(s) disclosed receipt of the following financial support for the research, authorship, and/or publication of this article: This research is part of the project ‘Science communication during pandemics: The role of public engagement in social media discussions’, funded by the Deutsche Forschungsgemeinschaft (DFG, German Research Foundation) – 458609429. Grant applicants are Nicole C. Krämer, Monika Taddicken, and Stefan Stieglitz.
Notes
Author Biographies
References
Supplementary Material
Please find the following supplemental material available below.
For Open Access articles published under a Creative Commons License, all supplemental material carries the same license as the article it is associated with.
For non-Open Access articles published, all supplemental material carries a non-exclusive license, and permission requests for re-use of supplemental material or any part of supplemental material shall be sent directly to the copyright owner as specified in the copyright notice associated with the article.