
Abstract
Objective:
This study aimed to evaluate the effects of potential risk factors on antihypertensive treatment success.
Methods:
Patients with hypertension who were treated with antihypertensive medications were included in this study. Data from the last visit were analyzed retrospectively for each patient. To evaluate the predictive models for antihypertensive treatment success, data mining algorithms (logistic regression, decision tree, random forest, and artificial neural network) using 5-fold cross-validation were applied. Additionally, study parameters between patients with controlled and uncontrolled hypertension were statistically compared and multiple regression analyses were conducted for secondary endpoints.
Results:
The data of 592 patients were included in the analysis. The overall blood pressure control rate was 44%. The performance of random forest algorithm (accuracy = 97.46%, precision = 97.08%, F1 score = 97.04%) was slightly higher than other data mining algorithms including logistic regression (accuracy = 87.31%, precision = 86.21%, F1 score = 85.74%), decision tree (accuracy = 76.94%, precision = 70.64%, F1 score = 76.54%), and artificial neural network (accuracy = 86.47%, precision = 83.85%, F1 score = 84.86%). The top 5 important categorical variables (predictive correlation value) contributed the most to the prediction of antihypertensive treatment success were use of calcium channel blocker (−0.18), number of antihypertensive medications (0.18), female gender (0.10), alcohol use (−0.09) and attendance at regular follow up visits (0.09), respectively. The top 5 numerical variables contributed the most to the prediction of antihypertensive treatment success were blood urea nitrogen (−0.12), glucose (−0.12), hemoglobin A1c (−0.12), uric acid (−0.09) and creatinine (−0.07), respectively. According to the decision tree model; age, gender, regular attendance at follow-up visits, and diabetes status were identified as the most critical patterns for stratifying the patients.
Conclusion:
Data mining algorithms have the potential to produce predictive models for screening the antihypertensive treatment success. Further research on larger populations and longitudinal datasets are required to improve the models.
Introduction
Hypertension is one of the most important and preventable risk factors for cardiovascular and cerebrovascular diseases. 1,2 The uncontrolled hypertension is associated with an increased risk of serious cardiovascular outcomes including myocardial infarction, stroke, sudden death, heart failure, peripheral artery disease, and end-stage kidney disease. 3 It is estimated that globally 3.5 billion adults have non-optimal systolic blood pressure (SBP) and approximately 874 million adults have an SBP level higher than 140 mmHg. 4 According to the PATENT (Prevalence, awareness, treatment, and control of hypertension in Turkey) study, the prevalence of hypertension is approximately 32% in Turkey and the prevalence increases with age. The same study also reported that only 40.7% of the patients were aware of their hypertension, moreover, the proportion of patients whose hypertension is being controlled was only 20.7%. 5 In contrast to the well-known association between high blood pressure and cardiovascular morbidity/mortality, blood pressure is often insufficiently controlled in patients with hypertension. In addition to lack of blood pressure measurement and awareness, inappropriate and inadequate treatment is also an essential factor that leads to uncontrolled hypertension.
The antihypertensive drugs differ from each other in their mechanism of action, thus also differing in terms of choice criteria and safety. The renin-angiotensin-aldosterone system (RAAS) blockers including angiotensin-converting enzyme inhibitors (ACEi) and angiotensin receptor blockers (ARBs) are the major cornerstone in the treatment of several cardiovascular diseases whereas beta-blockers (BB) and diuretics are mainly used or added as an antihypertensive in specific conditions such as heart failure. 6 On the other hand, unlike BB and diuretic agents, calcium channel blockers (CCB) do not have any metabolic adverse effects such as disrupting glucose and lipid profile due to their mechanism of action and these drugs can be selected for the treatment of appropriate patients. The appropriate antihypertensive treatment as monotherapy or combination should be initiated and followed up according to the guidelines recommendations. 6,7 It is commonly encountered that monotherapies do not provide the required blood pressure-lowering effect in daily practice. For the patients with markedly high baseline blood pressure level, the guideline recommendation is to initiate the drug treatment with a combination of 2 drugs, usually an ACEi or ARB in combination with CCB or diuretics to prevent the patients from hypertension-related end-organ damage. 6,7
Nowadays, data-oriented research has gained significant momentum. Data mining is an analyzing technique to discover correlations, patterns, trends from large amounts of data that are stored in databases. Classification, clustering and association are the most widely-used data mining algorithms. Data mining approaches have important differences when compared to traditional statistical methods. While traditional statistical methods are hypothesis-testing, data mining methods are more inductive and generally defined as hypothesis-free. In addition to fundamentally used mathematical statistics, data mining methods include heuristic approaches in some measure to answer the research problem, particularly when working with categorical datasets. Therefore, data mining can be considered more flexible when compared with the rigorous mathematical approach of traditional statistical methods. 8
In this study, it is aimed to evaluate the risk factors associated with antihypertensive treatment success. The primary evaluation was based on the binary outcome of controlled/uncontrolled blood pressure levels using data mining algorithms. The data mining algorithms including logistic regression, decision tree, random forest, and artificial neural network using 5-fold cross-validation were applied. Additional statistical analyses were executed to compare the study parameters between the patients with controlled and uncontrolled hypertension. For secondary outcomes, regression analyses were performed to evaluate the effects of risk factors on SBP and diastolic blood pressure (DBP) levels.
Methods
Five hundred ninety-two patients with hypertension who had been receiving a stable regimen of antihypertensive therapy for at least 6 months and followed up in Istanbul Faculty of Medicine Division of Clinical Pharmacology Polyclinic were included in this study. Data from the last visit were collected and analyzed cross-sectionally and retrospectively. The laboratory findings of the patients were recorded from the last 1 month of last visit, if available. The present study was approved by Istanbul Faculty of Medicine Clinical Research Ethics Committee.
Sociodemographic parameters including gender, age; use of tobacco and alcohol; history of CV event; history of CV event in family; duration of hypertension; the antihypertensive medications; presence of diabetes mellitus; the use of lipid lowering treatment; presence of asthma and chronic obstructive pulmonary disease (COPD); the use of antiplatelet drug; the use of antidepressant drug; SBP and DBP levels and pulse rate; body mass index; compliance to follow-up visits (was defined as attendance at follow-up appointments at least once in a year); if available laboratory results within the last 1 month including fasting glucose, hemoglobin A1c (HbA1c), blood urea nitrogen (BUN), creatinine, uric acid, sodium, potassium, chloride, aspartate aminotransferase (AST), alanine aminotransferase (ALT), creatine kinase (CK), total cholesterol, triglyceride, HDL cholesterol, LDL cholesterol of eligible patients were anonymously recorded and evaluated.
The patients with SBP ≥140 mmHg and/or DBP ≥90 mmHg were considered to have uncontrolled hypertension.
Statistical Analyses
Statistical analyses were conducted using IBM’s Statistical Package for Social Sciences (SPSS) for Windows 21.0. The distribution normality of variables was evaluated using Shapiro-Wilk test. T-test and Pearson’s correlation analyses were used for normally distributed variables. Mann-Whitney U test and Spearman’s rho correlation analyses were used for variables without normal distribution. Chi-square test was used to analyze discontinuous (frequency) data. The multiple comparisons were conducted by one-way ANOVA followed by Tukey post hoc test. Univariate and multivariate regression analyses were conducted to evaluate the risk factors associated with SBP and DBP levels. The independent variables that demonstrated a significant association with a dependent variable (as dependent variables, SBP and DBP levels were evaluated separately) in univariate linear regression analysis were included in multivariate regression analyses. Stepwise model was used for multivariate regression analyses. The results were considered significant if P < .05. The results were presented as mean ± standard deviation (SD) and median (25th-75th percentiles).
Data Mining Algorithms
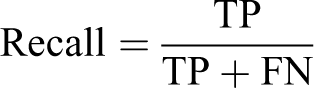
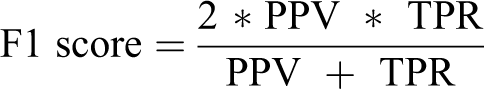
In our study, the data preprocessing part was carried out as the stages of data analysis, cleansing, and transformation. During the data clean-up phase, missing data and problem rows and attributes should be removed. In this study, a total of 43 features, 24 numerical and 19 categorical, were collected from 592 patients. Within the data analysis, 3.5% of these data were found to be missing for various reasons. Methods such as filling incomplete data with average, maximum, minimum, or fixed values can be found in the literature. In our study, missing data were completed by selecting the closest neighborhood method and used a parameter as K = 3. Nearest Neighborhood missing data completion algorithms effectively fill missing data, where missing values in some records are replaced with a preserved value in relevant cases throughout the record set. 9 Additionally, the categorical variables were converted to numerical form for the analysis. The patients with SBP ≥140 mmHg and/or DBP ≥90 mmHg were considered to have uncontrolled hypertension. Logistic regression, Decision Trees, Random Forest, and Artificial Neural Networks were selected as classification algorithms in this study. After performing the preprocessing steps, 80% of the data is reserved for training and the remaining 20% for testing. Five-fold cross-validation was used to evaluate the performance of all algorithms. The 5-fold cross-validation equally divided the dataset into 5 subsets. The data mining flow chart was presented in Figure 1. For evaluation; accuracy, F1 score, recall and precision metrics were used. In order to evaluate the performance of classification models, confusion matrix including the numbers of true positive (TP), true negative (TN), false positive (FP) and false negative (FN) examples was used. Accuracy is related to overall effectiveness of a classifier. Recall is also called as sensitivity and true positive rate (TPR). Precision is also defined as positive predictive value (PPV) that is the proportion of the true positive examples among all of the examples labeled as positive. F1 score provides an opportunity to evaluate precision and recall metrics together and is formulated as their harmonic mean. 10 The performances of algorithms were calculated using following formulas:


Study flow chart for data mining algorithms.
Additionally, the predictive value (based on the correlation with the binary outcome) of the independent variables were evaluated.
In accordance to the rules of defined decision tree algorithm, the decision tree classification figure was drawn for all patients including the patients in train and test datasets. The interventional variables of antihypertensive medication were excluded from the leaf nodes of the tree to figure out the non-interventional factors affecting the antihypertensive treatment success in patients with hypertension.
Results
Patients’ Characteristics and Differences Between Patients With Controlled and Uncontrolled Hypertension
The data of 592 patients (374 Female/218 Male; age 63.43 ± 11.84) were consecutively recorded and analyzed. According to the defined threshold of SBP/DBP levels, 56% (334/592) of the patients were considered to have uncontrolled hypertension, whereas blood pressure was controlled in %44 (258/592) of the patients.
The differences between controlled and uncontrolled patients were given in Table 1. In addition to higher SBP and DBP levels, significant differences in gender (P = .016), regular attendance at follow-up visits (P = .026), and alcohol use (P = .028) were detected. Among antihypertensive medications, the number and percentage of the patients using at least on calcium channel blocker was significantly higher in uncontrolled group (P < .001). Although patients having uncontrolled blood pressure have older age, higher body mass index (BMI), and longer duration of hypertension, these differences did not reach a significant level.
The Differences Between Groups According to Controlled and Uncontrolled Blood Pressure Levels.a

Abbreviations: BMI, body mass index; SBP, systolic blood pressure; DBP, diastolic blood pressure; HT, hypertension; CV, cardiovascular; COPD, chronic obstructive pulmonary disease; ACE, angiotensin converting enzyme; ARB, angiotensin receptor blocker; CCB, calcium channel blocker; BB, beta blocker.
a The results were given as mean ± standard deviation (SD) and median (25th-75th percentiles).
b P < .05.
The differences in laboratory findings between controlled and uncontrolled patients were presented in Table 2. When compared to patients with controlled blood pressure, uncontrolled patients had significantly higher levels of fasting glucose (P = .001), HbA1c (P = .001), creatinine (P = .018), blood urea nitrogen (BUN) (P = .012) and uric acid (P = .002).
The Laboratory Findings in Patients With Hypertension, Controlled Versus Uncontrolled.a

Abbreviations: HGB, hemoglobin; HCT, hematocrit; MCV, mean corpuscular volume; PLT, platelet; BUN, blood urea nitrogen; HbA1c, hemoglobin A1c; AST, aspartate aminotransferase; ALT, alanine aminotransferase; CK, creatine kinase; HDL, high-density lipoproteins; LDL, low-density lipoproteins.
a The results were given as mean ± standard deviation (SD) and median (25th-75th percentiles).
b P < .05.
The control rate among female patients was 177/374 (47%) whereas the control rate among male patients was 81/218 (37%). Despite having significantly longer duration of hypertension (P = .003) and higher BMI (P = .004); both SBP (P = .005) and DBP (P < .001) levels were significantly lower in female patients compared to male patients. Additionally, the rate of prescription of CCBs, diuretics and beta-blockers were significantly different between genders (Supplementary Table S1). The differences in blood pressure levels and control rate between the patients age <65 and ≥65 were presented at supplementary material (Supplementary Table S2). The patients were also stratified according to the use of different antihypertensive drug classes, as at least one ARB or ACEi or diuretic or CCB or BB use and then SBP and DBP levels were compared (Supplementary Table S3). There was only a significant difference in SBP levels between the patients using at least one CCB and non-users (P < .001).
The Differences in Blood Pressure Levels and Control Rate According to the Use of Different Antihypertensive Treatment Regimens
The proportions of different classes of drugs across the treatment regimens from monotherapy to 4-drug combination were presented at Table 3. In the present study, the blood pressure control rate did not increase due to the number of antihypertensive medications. Additionally, the control rate was at the lowest in patients using 4 antihypertensive drugs. The control rate in patients using antihypertensive treatment as monotherapy, 2-drug combination, 3-drug combination and 4-drug combination were 55%, 42%, 44% and 19%, respectively. When compared to monotherapy arm, the patients receiving 4-drug combination had significantly higher SBP levels (P < .001). On the other hand, the patients receiving 4-drug combination had significantly higher DBP levels, when compared to monotherapy arm (P = .006), 2-drug combination (P = .024) and 3-drug combination (P = .007). The hypertension control rate, SBP and DBP levels in monotherapy and combination treatments were presented at Table 4.
The Proportions of Different Classes of Drugs Across the Treatment Regimens From Monotherapy to 4-Drug Combination.a

Abbreviations: RAAS, renin angiotensin aldosterone system; ACE, angiotensin converting enzyme; ARB, angiotensin receptor blocker; CCB, calcium channel blocker; BB, beta blocker.
a The results were given as number (percentage).
The Differences in Control Rate and Blood Pressure Levels Between Different Treatment Regimens.

a P < .001 when compared to monotherapy.
b P = .006 when compared to monotherapy.
c P = .024 when compared to 2-drug combination.
d P = .007 when compared to 3-drug combination.
Performance of Data Mining Algorithms
The success rates obtained as results of Logistic regression, Decision Trees, Random Forest, and Artificial Neural Networks algorithms are shown as accuracy, F1 score, recall and precision, scores in Table 5. The highest scores were achieved with random forest algorithm (accuracy = 97.46%, precision = 97.08%, F1 score = 97.04%).
Classification Results of Selected Data Mining Algorithms.

To provide a readable and simple visual information, a decision tree with excluding the interventional variables of antihypertensive medications was drawn to show the non-interventional factors affecting the antihypertensive treatment success in patients with hypertension. The classification tree was given at Figure 2. The classification started with the separation of the patients according to the age (as >76 or ≤76 years). In the patients with age >76 years, the influence of regular attendance at follow-up visits was the most important factor. On the other hand, in the vast majority of the patients (age ≤ 76 years), the influence of gender was remarkable. Subsequently, the regular attendance at follow-up visits was the most critical factor in male patients with hypertension whereas the presence of diabetes mellitus was the most important factor in female patients with hypertension.

The classification tree model for antihypertensive treatment success. Data were shown in the number (n) and percentage (%). The patients with SBP/DBP level ≥140/90 mmHg were considered to have uncontrolled hypertension. The figure showed only the variables with high associations with control rate.
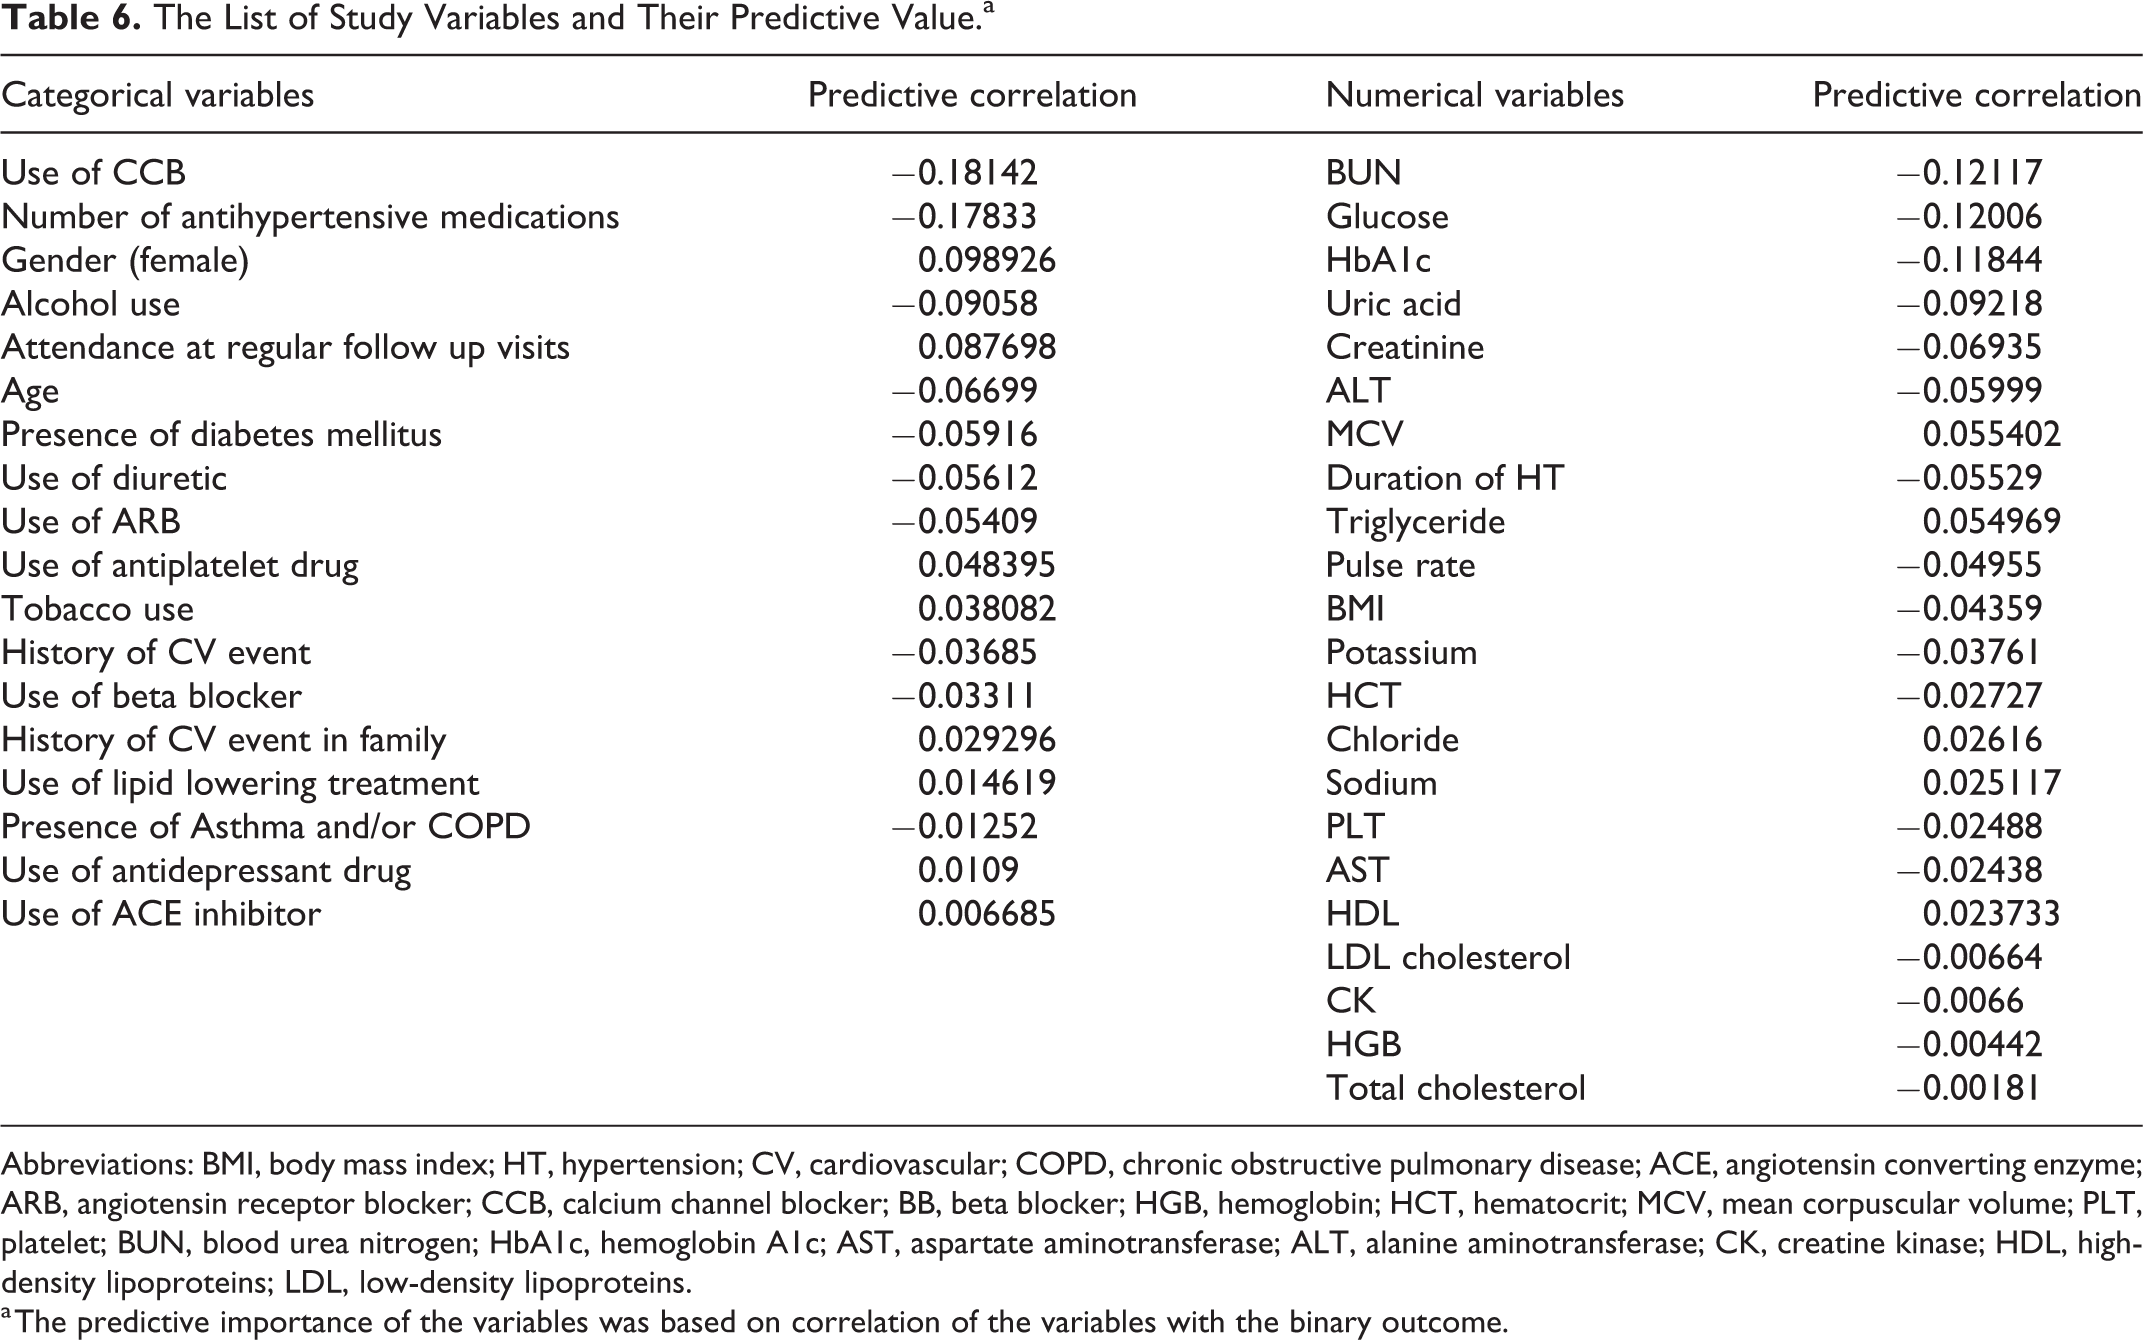
The relative predictive importances (based on their positive or negative correlations with the main binary outcome (SBP ≥ 140 mmHg and/or DBP ≥ 90 mmHg) of the variables were listed in Table 6. The top 5 important categorical variables contributed the most to the prediction of antihypertensive treatment success were use of CCB (−0.18), number of antihypertensive medications (0.18), female gender (0.10), alcohol use (−0.09) and attendance at regular follow up visits (0.09). The top 5 numerical variables contributed the most to the prediction of antihypertensive treatment success were BUN (−0.12), glucose (−0.12), HbA1c (−0.12), uric acid (−0.09) and creatinine (−0.07).
The List of Study Variables and Their Predictive Value.a
Abbreviations: BMI, body mass index; HT, hypertension; CV, cardiovascular; COPD, chronic obstructive pulmonary disease; ACE, angiotensin converting enzyme; ARB, angiotensin receptor blocker; CCB, calcium channel blocker; BB, beta blocker; HGB, hemoglobin; HCT, hematocrit; MCV, mean corpuscular volume; PLT, platelet; BUN, blood urea nitrogen; HbA1c, hemoglobin A1c; AST, aspartate aminotransferase; ALT, alanine aminotransferase; CK, creatine kinase; HDL, high-density lipoproteins; LDL, low-density lipoproteins.
a The predictive importance of the variables was based on correlation of the variables with the binary outcome.
The Results of Regression Analyses for Secondary Endpoints
Two separate regression analyses were conducted for SBP and DBP levels which were taken as dependent variables. Age, Gender (Female), BMI, tobacco use, alcohol use, presence of previous CV event history, duration of hypertension, presence of diabetes mellitus, use of lipid lowering treatment, use of anti-platelet drug, use of antidepressant drug, adherence to follow-up visits and all laboratory findings listed in Table 2 (except HbA1c levels) were evaluated in univariate linear regression analyses separately. For SBP level as a dependent variable, univariate analyses revealed that gender (female), age, duration of hypertension, adherence to follow-up visit, glucose level, BUN and uric acid levels had a significant effect. Then stepwise method was applied to evaluate the effects of those variables in multivariate regression model. Among those variables, glucose level (P = .002), age (P = .003) and uric acid level (P = .017) being positively associated; and gender (female) (P = .031) and regular attendance at follow-up visits (P = .004) being inversely associated, remained as factors demonstrating significant association with SBP level (Table 7). For DBP level as a dependent variable, univariate analyses showed that gender (female), age, alcohol use, adherence to follow-up visits, HGB, HCT, AST and ALT levels had significant effects. In stepwise multivariate regression model, HCT (P = .004), alcohol use (P = .001), and ALT (P = .05) being positively associated; regular attendance at follow-up visits (P < .001) and age (P = .046) being inversely associated, remained as factors having significant association with DBP level (Table 8). Additionally, HbA1c levels were not included in regression analysis due to a relatively low number of patients having HbA1c results available (n = 405); however, a correlation analysis was conducted between HbA1c levels and SBP/DBP. A positively significant correlation between HbA1c levels and SBP was detected (r = 0.181, P < .001), but not with DBP (P = .525).
The Variables Which Effect Systolic Blood Pressure Levels According to Multiple Regression Analysis.a

aDependent variable: Systolic blood pressure (SBP). BUN was excluded from the model due to not presenting significant association with SBP level (P > .05).
The Variables Which Effect Diastolic Blood Pressure Levels According to Multiple Regression Analysis.a

Abbreviations: DBP, diastolic blood pressure; HCT, hematocrit; ALT, alanine aminotransferase.
a Dependent variable: Diastolic blood pressure (DBP). HGB, gender (female), HGB and AST were excluded from the model due to not presenting significant association with DBP level (P > .05).
Discussion
Hypertension is a chronic disease with a global burden affecting millions and the successful management of hypertension requires a multi-factorial approach. Despite well-known influence of hypertension on cardiovascular and cerebrovascular mortality and morbidity, the control of blood pressure in most of the patients with hypertension have not reached the target levels according to guideline recommendations. In our study, the overall blood pressure control rate was approximately 44% which was slightly higher than the findings in another Turkish study, 5 however, the present study data came from the patients who were already aware of their disease and treated.
In this study, the treatment success in female patients with hypertension was superior to male patients. Regression analysis results have demonstrated that female gender by itself is associated with a decrease in SBP by 3.7 mmHg (P = .031). When compared to male patients, the female patients were more likely to receive diuretics (51% vs 35%) and BB (50% vs 40%) and less likely to be treated with calcium channel blockers (42% vs 53%). Several reasons can influence the drug choice among female and male patients. Gender differences in hypertension treatment and drug utilization patterns were also reported in previous studies. 11,12 On the other hand, it was demonstrated in regression analyses that an increase in age significantly associated with an increase in SBP (P = .003) and decreased in DBP (P = .046). This result was compatible with existing literature since it is known that increased pulse pressure is one of the important risk predictors in elderly patients. 13
The use of artificial intelligence in medical research gained a great momentum. The data mining methods and machine learning algorithms may have a potential to enable early diagnosis and management of many diseases. With the data mining approach, hidden patterns can be accessed from multidimensional data sets. Hypertension is a disease that is affected by many factors. Thus, blood pressure control is dependent on different determinants. Predicting the factors affecting antihypertensive treatment success with data mining approach is limited in the literature. The previous data mining works were mainly focusing on the prediction of hypertension diagnosis. As an example, in a longitudinal study on 6205 participants, not having hypertension at baseline with no history of cardiovascular disease, classification-based data mining approaches were used to identify the risk patterns for hypertension. In that study, SBP, age, DBP and waist circumference were reported as common predictors of hypertension for the whole included population. 14 In an interesting systematic review, 15 different hypertension prediction models from 11 studies were evaluated. In addition to blood pressure variables, age, gender, BMI, diabetes status, parental history of hypertension and smoking were reported as the most common predictors in included final prediction models. 15 In our study, differently from previous studies, the primary objective was defined as the evaluation of potential risk factors affecting the antihypertensive treatment success. In addition to traditional statistical methods, the data mining approach was applied. In our study, among all data mining algorithms, random forest algorithm achieved the best performance scores (accuracy = 97.46%, precision = 97.08%, F1 score = 97.04%). The random forest is an ensemble classification algorithm. There is a directly proportional relationship between the number of trees in the forest and the results it can achieve. When the number of trees increases, the accuracy of the algorithms’ performances rises. 16 Therefore, the higher performance scores with random forest than decision tree algorithm may be an expected result when the high number variables in our study (probably resulting in an increase in number of trees and decrease in the variance within the outcome).
The performance of decision tree algorithm was slightly lower than other data mining algorithms, however, decision trees may be the most widely used classification algorithm due to readable results and guidance for the whole community and its ease to use features. 17 In this study, we drew the tree for whole patient pool with the rules of defined decision tree algorithm. The importance of regular attendance at follow-up visits and influence of gender were also evidenced by the classification tree model. In regression analysis, the effect of fasting glucose levels on SBP was demonstrated, however, there was not a statistical difference in the diabetes mellitus status between controlled and uncontrolled patients. However, the decision tree model revealed that the effect of diabetes status on treatment success in female patients with hypertension as a hidden pattern.
The multilayer perceptron or most commonly known as artificial neural networks consists of an input layer where neural networks are input neurons, the output layer where the exit neurons are located, and one or more hidden layers. The input layer receives the inputs from the multi-layer network and transmits them to the intermediate layer, the transaction elements in the intermediate layer are connected to all the processing elements in the next middle layer and the algorithm works this way. This algorithm is generally used for solving nonlinear problems. 18 In our study, the performance of neural network algorithm (accuracy = 86.47%, precision = 83.85%, F1 score = 84.86%) was relatively lower than random forest and similar to logistic regression. On the other hand, the purpose of using logistic regression is the same as other model construction techniques used in statistics: to establish a biologically acceptable model that can define the relationship between dependent and independent variables in the best fit using the least variable. 19 When using logistic regression in data mining and machine learning algorithms, it predicts the risk by validating and learning from the data. Additionally, data mining in our study provided that the variables contributed the most to the prediction of antihypertensive treatment success. The results were more or less similar to the results of traditional multiple regression analysis. The results demonstrated that use of CCB (−0.18), number of antihypertensive medications (0.18), female gender (0.10), alcohol use (−0.09) and attendance at regular follow up visits (0.09) were the most critical categorical pattern. On the other hand, BUN (−0.12), glucose (−0.12), HbA1c (−0.12), uric acid (−0.09) and creatinine (−0.07) were top 5 critical laboratory parameters contributed to outcome.
Only 38% of the patients in the present study were reported to have attendance at regular follow-up visits which was not satisfactory. The present study results have supported the importance of follow-up appointments. It was demonstrated that the compliance to follow-up visits was directly and independently related to successful blood pressure control. According to the results of multiple regression analyses, the attendance at regular follow-up visit provided a significant decrease in both SBP and DBP by 4.9 mmHg and 3.7 mmHg, respectively. Therefore, intensive follow-up should be encouraged and recommended for all patients with hypertension. Both European Society of Cardiology (ESC) and American Heart Association (AHA) guidelines also recommend scheduling follow-up visits. 6,20
In this study, an increase in blood fasting glucose (P = .002) and uric acid levels (P = .017) were related to increased SBP. Additionally, HbA1c level was positively correlated with SBP levels (P < .001). The earlier studies have also pointed out that the patients with high SBP levels had higher mean glucose levels. 21 On the other hand, the need for further studies on the effect of high uric acid levels on hypertension is a highlighted. 22 The contribution of asymptomatic hyperuricemia to the development of hypertension was previously reported in cohort studies conducted in Japan. 23,24 The present study results support the previous findings. The blood uric acid levels was associated with the antihypertensive treatment success.
According to regression analysis, in addition to gender, age and regular visit condition; alcohol use, HCT, and ALT levels were also associated with DBP. The effect of alcohol consumption on blood pressure was specifically evaluated in previous studies. In a systematic review and meta-analysis, reducing alcohol use was reported to decrease the blood pressure in a dose-dependent manner. 25 In another study, it was demonstrated that alcohol consumption led to increase in both SBP and DBP levels, however only an increase in DBP reached a significant level. 26 In conjunction with the existing literature, our results supported that the alcohol use may influence the antihypertensive treatment success. The relationship between liver enzymes and hypertension is another topic to be investigated. In a study, the increased serum levels of ALT and GGT were found in association with hypertension. 27 In another case–control study, it was reported that the elevated ALT levels may have been a risk factor for hypertension. 28 In the present study, ALT level was significantly associated with an increase in DBP, but not with SBP. Although a relationship between ALT and SBP was not detected, it could be concluded that an increase in DBP may be enough to be clinically significant for antihypertensive treatment success. However, both the association alcohol use and liver enzymes with blood pressure control still need to be further investigated.
In the multiple regression analysis, HCT levels were found to be associated with DBP (P = .004). Elevation in HCT levels is one of the predictors of blood hyper viscosity and thus is related to the development of hypertension. When compared to normotensive patients, it was demonstrated that the patients with hypertension had a markedly higher level of HCT which also reported to be an independent risk factor for hypertension. 29 However, the relative predictive importance of HCT levels in data mining algorithms was only −0.0027 and slightly lower than other laboratory parameters.
Resistant hypertension is a challenging situation in daily practice and generally defined as uncontrolled blood pressure in a patient using ≥3 antihypertensive drugs of different classes. Before the diagnosis of resistant hypertension, blood pressure measurement technique, white-coat hypertension, patient adherence and compliance, undertreatment and use of the medications at the maximum tolerated doses should be thoroughly evaluated. 30 Although these pre-evaluations were not possible in the present study, it was demonstrated that the blood pressure control rate was at the lowest in patients receiving 4 antihypertensive drugs. In addition to the challenges in the treatment of resistant hypertension, these results may possibly be related to poor adherence of the patients to the high number of medications and prescribing the antihypertensive drugs at lower doses than maximally tolerated. However, we could not reach a definitive conclusion on this point because the adherence and compliance of the patients to the medications, and also the dose information was not evaluated in our study. These parameters should be comprehensively investigated in future studies. We can only conclude that the management of antihypertensive treatment in this population needed to be much more intensive due to the very low control rate.
One of the most remarkable findings of the present study was the significant difference in blood pressure control rate between the patients receiving at least one CCB and the patients not receiving CCBs. However, this result should not be interpreted as CCBs being inefficient. It is greatly known that CCBs is an important class of antihypertensive drugs which have favorable safety profile. The possible explanation of this result may be related to the utilization of CCB as a third or fourth drug in patients with resistant hypertension; the use of CCB as monotherapy in young patients who may not seem to require intensive management; and the possible recommendation by physicians as to using CCBs in case of need. However, it was not possible to evaluate all these options in detail since the present study was conducted on retrospective data. The data should be thoroughly evaluated in further long-term studies.
Limitations
In this study, the data were collected from the real-world conditions that allow us to evaluate the management of hypertension in daily practice. However, there are some limitations in our study. The analyses of the data were based on a cross-sectional design. It would be useful to obtain a long-term longitudinal dataset to evaluate the change in blood pressure before and after the treatment. Secondly, this study was conducted on a relatively small dataset of a single center (selection bias), therefore, the conclusion on some outcomes such as control rate of hypertension may not be generalized to the whole population of Turkey or to populations outside of Turkey. In the present study, sample size and participants from single center had an overall effect on the performance of the selected data mining algorithms due to common challenges such as overfitting and underestimation that was faced when using data mining algorithms. Lack of the variables related to adherence and doses of antihypertensive drugs was an important limitation.
Conclusions
Data mining algorithms have a potential to produce predictive models for screening the antihypertensive treatment success. Further research on larger populations and longitudinal datasets are required to improve the models. Our results highlighted the importance of encouraging patient compliance for follow-up appointments for successful antihypertensive treatment. In statistical analyses, we observed that antihypertensive treatment had a higher success rate in female patients; this might be because female patients were more likely to be treated with beta blocker and diuretic agents. There are several reasons for gender difference in prescription of antihypertensive medications and there is a need for further evaluation on this. Additionally, the variables contributed the most to the prediction of antihypertensive treatment success should be thoroughly investigated in future studies on larger cohorts.
Supplemental Material
Supplemental Material, sj-docx-1-cpt-10.1177_10742484221136758 - Evaluation of Risk Factors Associated With Antihypertensive Treatment Success Employing Data Mining Techniques
Supplemental Material, sj-docx-1-cpt-10.1177_10742484221136758 for Evaluation of Risk Factors Associated With Antihypertensive Treatment Success Employing Data Mining Techniques by Selçuk Şen, Denizhan Demirkol, Mert Kaşkal, Murat Gezer, Ayşenur Yaman Bucak, Nermin Gürel, Yasemin Selalmaz, Çiğdem Erol and Ali Yağız Üresin in Journal of Cardiovascular Pharmacology and Therapeutics
Footnotes
Authors’ Note
This work was conducted at Istanbul Faculty of Medicine, Istanbul University.
Author Contributions
Conception: SŞ and AYU; Design: SŞ, MG, ÇE, and AYU; Supervision: SŞ, MG, NG, ÇE, and AYU; Data collection and/or processing: SŞ, DD, MK, MG, AYB, YS, and ÇE; Analysis and/or interpretation: SŞ, DD, MK, MG, AYB, NG, YS, ÇE, and AYU; Literature search: SŞ, DD, MK, MG, AYB, NG, YS, ÇE, and AYU; Writing: SŞ; Critical review: SŞ, DD, MK, MG, AYB, NG, YS, ÇE, and AYU. All authors approved the final version of the manuscript.
Declaration of Conflicting Interests
The author(s) declared no potential conflicts of interest with respect to the research, authorship, and/or publication of this article.
Funding
The author(s) received no financial support for the research, authorship, and/or publication of this article.
Supplemental Material
Supplemental material for this article is available online.
References
Supplementary Material
Please find the following supplemental material available below.
For Open Access articles published under a Creative Commons License, all supplemental material carries the same license as the article it is associated with.
For non-Open Access articles published, all supplemental material carries a non-exclusive license, and permission requests for re-use of supplemental material or any part of supplemental material shall be sent directly to the copyright owner as specified in the copyright notice associated with the article.