
Abstract
Drug-induced long QT increases the risk of ventricular tachyarrhythmia known as torsades de pointes (TdP). Many biomarkers have been used to predict TdP. At present, however, there are few biomarkers for arrhythmias induced by QT-shortening drugs. The objective of the present study was to identify the best biomarkers for predicting arrhythmias caused by the 4 potassium channel openers ICA-105574, NS-1643, R-L3, and pinacidil. Our results showed that, at higher concentrations, all 4 potassium channel openers induced ventricular tachycardia (VT) and ventricular fibrillation (VF) in Langendorff-perfused guinea pig hearts, but not in rabbit hearts. The electrocardiography parameters were measured including QT/QTc, JT peak, Tp-e interval, JT area, short-term beat-to-beat QT interval variability (STV), and index of cardiac electrophysiological balance (iCEB). We found that the potassium channel openers at test concentrations shortened the QT/QTc and the JT peak interval and increased the JT area. Nevertheless, even at proarrhythmic concentrations, they did not always change STV, Tp-e, or iCEB. Receiver operating characteristic curve analysis showed that the JT peak interval representing the early repolarization phase and the JT area reflecting the dispersion of ventricular repolarization were the best predictors of VT/VF. Action potential recordings in guinea pig papillary muscle revealed that except for pinacidil, the potassium channel openers shortened APD30 in a concentration-dependent manner. They also evoked early or delayed afterdepolarizations at fast pacing rates. Patch-clamp recordings in guinea pig ventricular cardiomyocytes showed that the potassium channel openers enhanced the total outward currents during the early phase of action potential repolarization, especially at proarrhythmic concentrations. We concluded that the JT peak interval and the JT area are surrogate biomarkers identifying the risk of proarrhythmia associated with the administration of QT-shortening agents. The acceleration of early-phase repolarization and the increased dispersion of ventricular repolarization may contribute to the occurrence of arrhythmias.
Keywords
Introduction
Certain compounds prolong QT interval by blocking the rapid delayed rectifier potassium current (IKr) component. This effect has been associated with the life-threatening ventricular tachyarrhythmia known as torsades de pointes (TdP) and is of major concern in drug development. 1 As a result, in 2005, the International Conference on the Harmonisation (ICH) of the Technical Requirements for the Registration of Pharmaceuticals for Human Use issued the guidelines ICH S7B and E14. 2 According to the regulatory strategies, new drug candidates must be assessed for their potential effects on cardiac electrical activity using in vitro and in vivo preclinical studies and thorough QT clinical trials. To date, several strategies for screening compound-induced TdP have been extensively evaluated. Significant advances have been made in understanding the mechanisms of TdP associated with congenital long QT syndromes. Drug-induced long QT and the risk of TdP are well known, and many biomarkers have been used to predict TdP. These include IKr inhibition, QT/QTc (heart rate–corrected QT) prolongation, increase in the transmural dispersion of repolarization (TDR), the triangulation of the action potential (AP), and the beat-to-beat repolarization variability. 3,4
During the drug screening process, many compounds have been discovered that actually shorten the action potential duration (APD) and/or QT interval. 5 Adenosine triphosphate (ATP)-dependent potassium channel openers, antiepileptic drugs affecting the voltage-gated sodium channels, and delayed rectifier potassium current activators (including the rapid and slow components IKr and IKs) shorten the QT interval by accelerating cardiac repolarization. 6 -8 Theoretically, shortening the APD and the effective refractory period (ERP) is associated with potential proarrhythmic risks. On the other hand, there is increasing evidence that congenital short QT syndromes (SQTs) are new primary electrical diseases associated with high risks of sudden cardiac death resulting from ventricular tachycardia (VT)/ventricular fibrillation (VF). 9 Six mutations associated with SQT have been identified. They include gain-of-function mutations in the genes KCNQ1, KCNH2, and KCNJ2 encoding cardiac potassium channels and loss-of-function mutations in the genes CACNA1C, CACNB2, and CACNA2D1 encoding L-type calcium channels. 10 These mutations increase the ventricular repolarizing current and shorten APD and ERP. The existence of hereditary SQTs suggests that drug-induced QT shortening may be proarrhythmic. Some experts have expressed their concern that drug-induced QT shortening must be a very important consideration in drug development. 11 However, progress in addressing the potential proarrhythmic risk of drug-induced QT shortening has been slower than that of drug-induced QT prolongation since the former has received relatively little attention. Nevertheless, preclinical studies have indicated that the ATP-dependent potassium channel openers pinacidil (PINA) and levcromakalim and the IKr channel activator NS-1643 (NS) shorten APD and are profibrillatory. 5 Our previous study showed that the IKr channel activator ICA-105574 (ICA) induced VF in isolated guinea pig heart. 12 Preliminary data pointed to a relationship between drug-induced short QT and VT/VF. Nevertheless, there are few known biomarkers of arrhythmias induced by QT-shortening drugs. Multiple proarrhythmic parameters associated with drug-induced TdP are easily analyzed in isolated Langendorff hearts. Therefore, this preclinical model is invaluable in assessing the proarrhythmic risk associated with certain compounds. 13 By recording electrocardiography (ECG) in isolated rabbit or guinea pig hearts and AP in guinea pig papillary muscles, we evaluated proarrhythmic risk of 4 QT-shortening agents including ATP-sensitive potassium channel opener PINA, IKr channel activators ICA and NS, and IKs channel activator R-L3. Moreover, ECG parameters were analyzed so as to identify superior predictors of arrhythmias induced by those QT-shortening agents.
Methods and Materials
Animals
Thirty-two male New Zealand white rabbits weighing 2.0 to 2.5 kg and 45 male Hartley guinea pigs weighing 200 to 250 g were used in this study. The experiments were performed at the Department of Pharmacology, Hebei Medical University, Shijiazhuang, China. Before the experiments, the animals were housed at 24°C ± 1°C, 50% to 60% relative humidity, and a 12-hour:12-hour light–dark cycle. All animals were fed a standard laboratory diet and had filtered tap water ad libitum. This study was carried out in accordance with the recommendations of the Guide for the Care and Use of Laboratory Animals (National Research Council, 2011). The protocol was approved by the Animal Care and Use Committee of Hebei Medical University (approval number: 1604087, Shijiazhuang, China).
Langendorff-Perfused Heart Preparations
Langendorff-perfused hearts were prepared as previously described. 12 Briefly, adult rabbits or guinea pigs were injected with heparin (1000 IU/kg, intraperitoneally [IP]) and anesthetized after 5 to 10 minutes with sodium pentobarbital (30-35 mg/kg, IP). The hearts were quickly excised from the animals and fixed to a Langendorff perfusion apparatus (Radnoti Inc, Monrovia, California). They were retrogradely perfused with Tyrode solution (140 mM NaCl, 5.4 mM KCl, 1 mM MgCl2, 2 mM CaCl2, 10 mM HEPES, and 10 mM glucose, pH 7.4 adjusted with NaOH) at a constant flow rate of 6 mL/min. The solution was continuously bubbled with O2 at 36°C ± 1°C. The hearts were allowed to beat spontaneously. The in vitro equivalent lead II ECG waveforms were recorded. 14 All data were acquired using the Biopac System MP150 (Biopac Inc, Goleta, California). The hearts were placed in a thermostatic chamber and allowed to equilibrate for ≥1 hour to ensure stable ECG recordings before drug testing. Hearts were discarded if their ECG recordings displayed erratic rhythms after the equilibrium period. The hearts were perfused with vehicle (0.1% vol/vol dimethyl sulfoxide [DMSO]) for 20 minutes followed by 3 escalating concentrations of the test drugs.
The ECG Parameter Analysis
AcqKnowledge v. 4.2 (Biopac Inc) was used to analyze the ECG waveforms. Multiple parameters were either directly measured or derived from the ECGs to determine the effects of the compounds on the cardiac electrophysiological and proarrhythmic propensities. The mean QRS complex, the QT, and the RR intervals were measured and averaged for 10 consecutive beats either 15 to 20 minutes after the administration of the test compound or solvent vehicle or 5 minutes before the occurrence of the VT/VF. The QT interval was defined as the time between the first deviation from the isoelectric line during the PQ interval to the end of the T-wave. The JTpeak and Tp-e intervals were defined as the time from the end point of the QRS complex to the peak of the T-wave and from the peak to the end of T-wave. These represent the early and late repolarizations, respectively. The JTpeak was measured from the QRSoffset to the global T-wave peak. 15 The S-wave was defined as the first negative wave after the R-wave. 16 Both the QT and JTpeak intervals were corrected for the heart rate using the parabolic equation QT (333/RR).0.601 17 In addition, the JT area was measured. It reflects the spatial dispersion of repolarization. 18,19 The JT area per beat was defined as the total planimetric area between the curve and the baseline from the J point to the T end point (Figure 1A). 19,20 The short-term beat-to-beat QT interval variability (STV) was calculated according to the formula described previously where STVQT = Σ [QTn+1 − QTn]/[30 ×√2]. 21 The index of cardiac electrophysiological balance (iCEB), that changes may reflect an imbalance in cardiac electrophysiology, was also calculated using the QT/QRS ratio as cited in an earlier report. 22 The VT was defined as ≥3 successive ventricular extrasystoles. The VF was defined as a ventricular tachyarrhythmia without any identifiable ECG wave. 23 To avoid the bias, the parameters were measured and analyzed by investigators blinded to the test compounds.

Diagram of ECG and action potential parameter measurements. A, Vertical dashed lines refer to the PR, QT, and Tp-e intervals and the JT peak, which corresponds to early repolarization. Shaded area indicates the assessment of the JT area. B, Dark area in the APD30 measurement corresponds to the early repolarization. Light area in the APD90-30 measurement corresponds to the late repolarization. APD indicates action potential duration ECG, electrocardiography.
Standard Glass Microelectrode Recordings in Papillary Muscle
Papillary muscles were isolated from the hearts of adult male guinea pigs as described previously. 24 In brief, the hearts were quickly excised and transferred to ice-cold oxygenated Tyrode solution. The right ventricular papillary muscles (∼1 cm in length) were fixed in the perfusion slot and perfused with oxygenated Tyrode solution (8 mL/min) for 2 hours at 36°C ± 1°C. The papillary muscles were paced by an electrical square pulse (0.2, 1, and 2 Hz, 1.5× threshold intensity) generated by an electronic stimulator (YC-2; Chengdu Instrument Factory, Chengdu, China). After an initial stabilization period of 1 hour, the transmembrane AP from the papillary muscles was recorded with a glass microelectrode filled with 3 M KCl (tip resistance 10-20 MΩ) and connected to a high-input impedance amplifier (SWF-2W; Chengdu Instrument Factory). The amplified signals were transmitted to a multichannel physiological signal collecting and processing system (RM 6240; Chengdu Instrument Factory). Action potential durations at 30% and repolarizations at 90% (APD30, APD90) were measured using custom-written software. The APD90-30 was calculated to reflect AP triangulation and late repolarization (Figure 1B). 25 Effective refractory periods were determined as follows: the papillary muscles were alternately stimulated by 8 consecutive single stimuli and 1 double stimulus. The double stimulus interval was then reduced by 5 milliseconds until no capture was observed. This coupling interval was defined as the ERP. 26 All of the aforementioned data were measured with investigators blind to the experimental procedures. Mean data were obtained from the average of 10 beats.
Guinea Pig Ventricular Cardiomyocyte Isolation
Single ventricular myocytes were enzymatically isolated from adult male guinea pig hearts as previously described. 27 In brief, the hearts were quickly excised and mounted on a Langendorff apparatus. Retrograde aortic perfusion was performed with a modified Ca2+-free Tyrode solution composed of 140 mM NaCl, 5.4 mM KCl, 1 mM MgCl2, 10 mM HEPES, and 10 mM glucose (pH 7.4; adjusted with NaOH). After 5 minutes perfusion, the Tyrode solution was replaced with another containing type II collagenase (Worthington, 0.4 mg/mL). The hearts were removed from the perfusion apparatus after the ventricular tissue was softened by 10 to 15 minutes perfusion. The softened heart was opened to remove the right ventricle, the interventricular septum, and the basal and apical regions of the left ventricle. Tissue sections ∼1/3 of the distance from the epicardial and endocardial sides were removed. The mid-myocardial region was immersed in a high-K+ solution containing 80 mM KOH, 40 mM KCl, 25 mM KH2PO4, 3 mM MgSO4, 50 mM glutamic acid, 20 mM taurine, 0.5 mM EGTA, 10 mM HEPES, and 10 mM glucose (pH 7.3; adjusted with KOH). The myocardium was then sectioned into small pieces. Cells were harvested and used in patch-clamp recordings within 4 to 6 hours after isolation.
Patch-Clamp Recordings
The AP waveforms were first recorded from ventricular cardiomyocytes in I-clamp mode by applying steady-state stimulation at 1 Hz frequency. The AP waveform was used as the command voltage across the cardiomyocyte to elicit the outward K+ current in V-clamp mode. 28 Patch pipettes were prepared using a horizontal micropipette puller (P-97; Sutter Instruments, Novato, California) and fire-polished. The recording electrodes had tip resistances of 2 to 4 MΩ when filled with a pipette solution composed of 140 mM KCl, 1 mM MgCl2, 5 mM EGTA, 4 mM magnesium–ATP, and 10 mM HEPES (pH 7.2; adjusted with KOH). The external solution contained 130 mM NMG, 5 mM KCl, 1 mM CaCl2, 1 mM MgCl2, 10 mM glucose, and 10 mM HEPES (pH 7.4; adjusted with HCl). CdCl2 (300 μM) was added to the external solution to block ICa. Patch-clamp recordings were done using an EPC10 patch-clamp amplifier (HEKA Electronic, Lambrecht, Germany). The acquisition rate was 10 kHz and the signals were filtered at 2.5 kHz. Voltage-pulse protocols were generated and data were acquired and analyzed with pClamp v. 10.2 (Molecular Devices, Union City, California).
Data Analysis and Statistics
Data were expressed as means ± standard error of the mean. SPSS v. 16.0 (IBM Corp, Armonk, New York) was used for data analysis. Statistical comparisons were made on the same samples using paired t tests for the data measured before and after drug administration. One-way analysis of variance with Dunnett post hoc tests were used for multiple-group comparisons. The χ2 test was used for incidence rate comparisons. A value of P < 0.05 was considered statistically significant. Receiver operating characteristic (ROC) curve analysis was performed to determine the predictive power of the ECG parameters. 29 The area under the ROC curve (AUC) was calculated, and AUC >0.9 was considered to be highly accurate in predicting the occurrence of VT/VF.
Reagents
The ICA (Pharmacology and Toxicology Laboratory for New Drugs, Hebei Medical University, purity ≥98%, experimental use only), NS (Tocris Bioscience, Bristol, United Kingdom), RL-3 (Dextrorotatory; Tocris Bioscience), and PINA (Sigma-Aldrich Corp, St Louis, Missouri) were prepared as stock solutions in DMSO (TKI) and kept at −20°C. Stock solutions were diluted to their final concentrations in bath solution. The highest final concentration of DMSO in the bath solution was 0.05%, which did not affect the current, the APD, or the ECG parameters.
Results
Proarrhythmic Effect of 4 K+ Channel Openers in Isolated Guinea Pig and Rabbit Hearts
Isolated rabbit or guinea pig hearts are commonly used preclinical models for testing the proarrhythmic potential of new drugs under development. We examined the proarrhythmic effects of 4 K+ channel openers in isolated guinea pig and rabbit hearts. The results showed that all 4 different potassium channel openers induced VT or VF at higher concentrations in guinea pig hearts, whereas at the same test concentrations, these agents had no apparent proarrhythmic effect on rabbit hearts with the exception of the IKr channel activator ICA (Figure 2). The 4 agents except for ICA induced significantly higher incidences of VT or VF in guinea pig hearts than in rabbit hearts (Figure 3). To understand this discrepancy, we compared QTc (heart rate–corrected QT) shortening induced by the highest concentrations of the individual agents between the guinea pig and rabbit hearts. As shown in Figure 4, QTc shortening in both species almost overlapped in response to all potassium channel openers. The results indicated that the 4 agents produced comparable QTc shortening in both species, but guinea pig hearts had higher susceptibility to arrhythmias. Therefore, guinea pig hearts were used in the subsequent experiments.

Effects of potassium channel openers on ECG recordings in Langendorff-perfused rabbit hearts and guinea pig hearts. The ECG waves were recorded before and after administration of various concentrations of the potassium channel openers. ECG indicates electrocardiography.
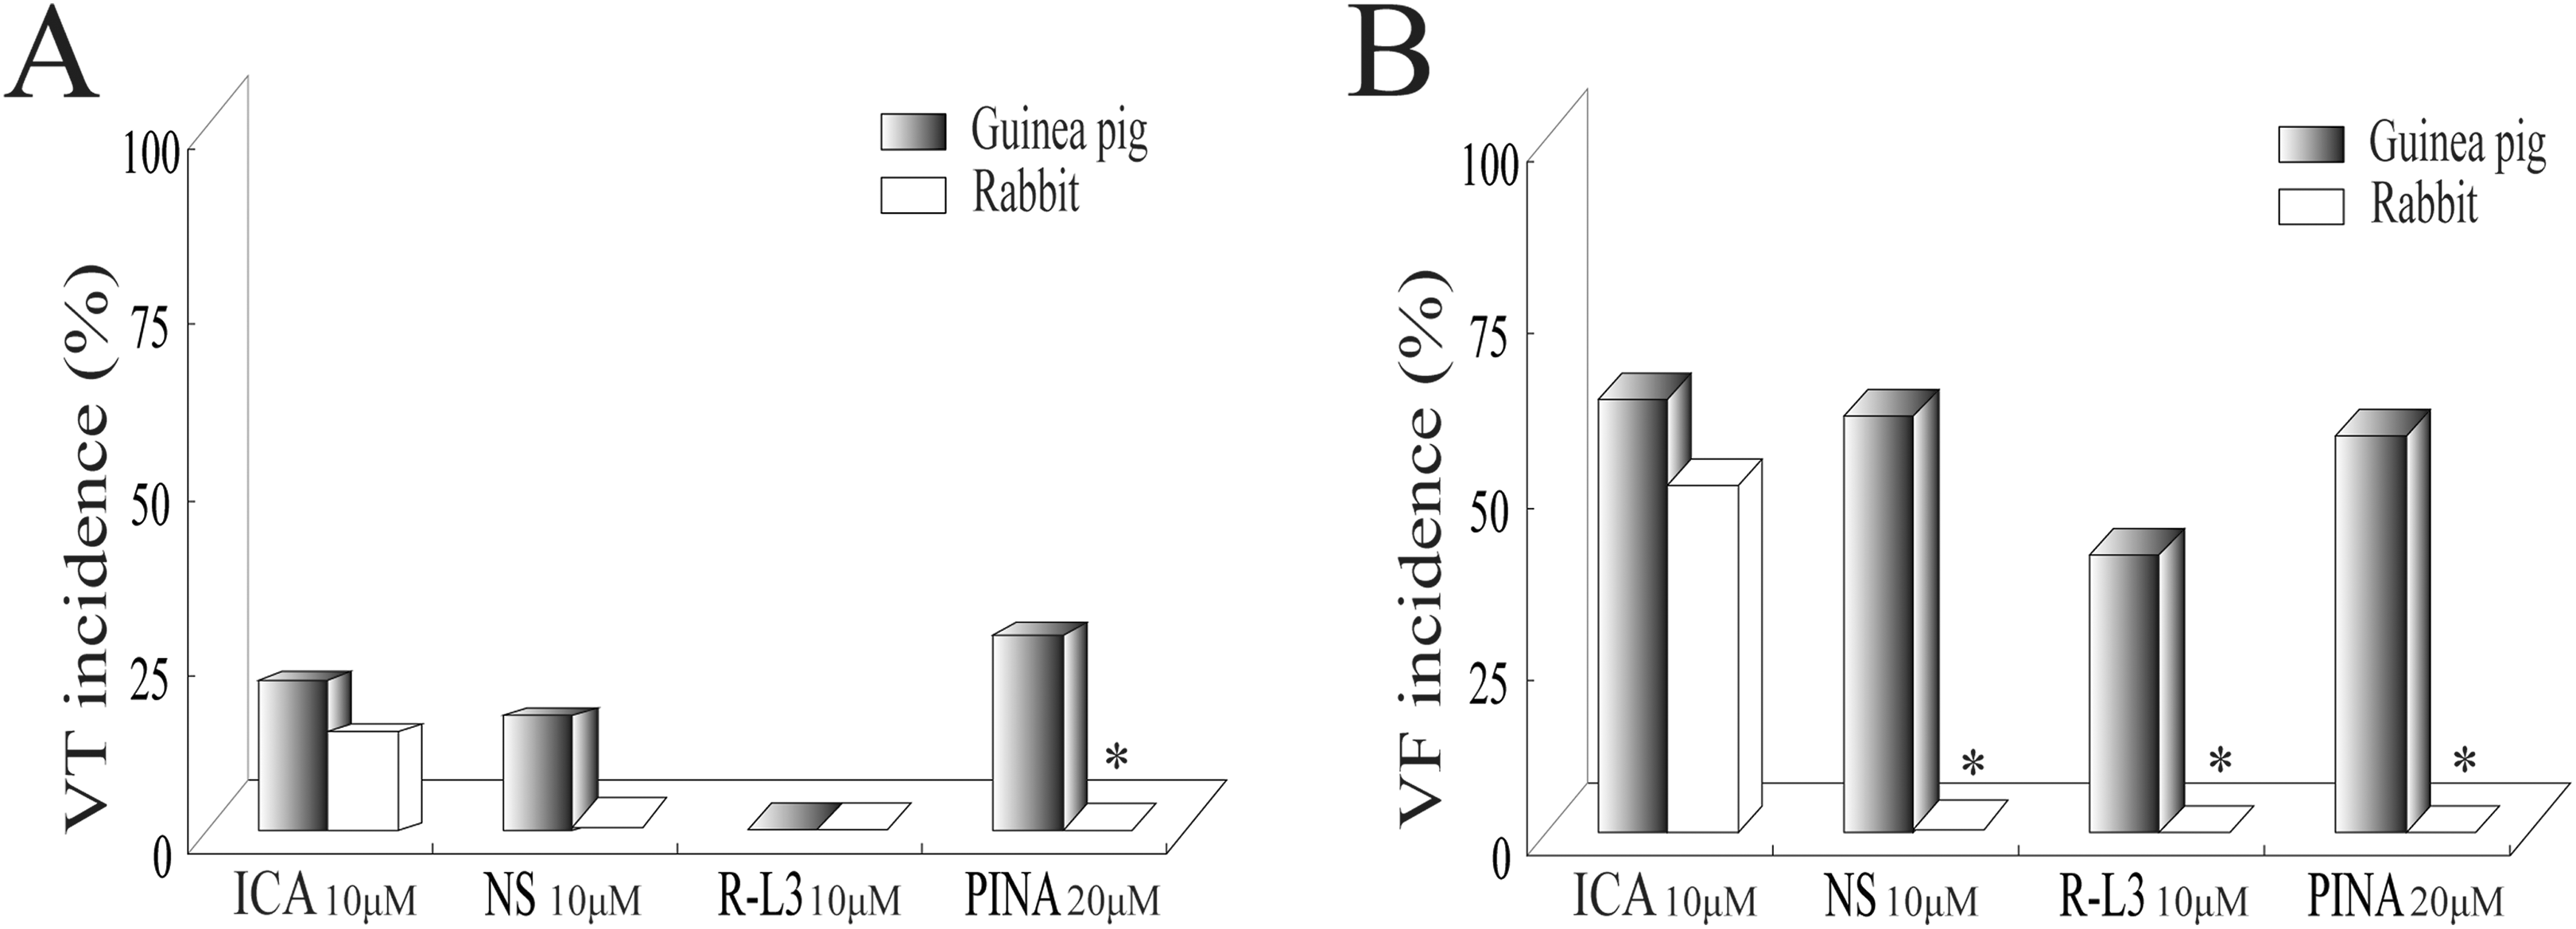
The incidence of VT (A) and VF (B) induced by QT shortening agents in guinea pig (n = 8, 5, 5, and 7 for ICA, NS, R-L3, and PINA, respectively) and rabbit hearts (n = 6, 5, 5, and 6 for ICA, NS, R-L3, and PINA, respectively). *P < .05 versus guinea pig hearts. VF, ventricular fibrillation; VT, ventricular tachycardia.

Percentage changes in QTc in the presence of the highest tested concentrations of potassium channel openers in rabbit (circle) and guinea pig (square) hearts. Numbers of rabbit hearts were 6, 5, 5, and 6 for ICA, NS, R-L3, and PINA, respectively. Numbers of guinea pig hearts were 8, 5, 5, and 7 for ICA, NS, R-L3 and PINA, respectively.
Effect of Potassium Channel Openers on ECG Parameters In Vitro
We analyzed the effects of potassium channel openers on the ECG parameters in guinea pig hearts to identify the best surrogate biomarkers for arrhythmia risk. The effects of those agents on ECG parameters including QTc, JTpeak, Tp-e, JT area, iCEB, and STV are shown in Supplemental Table 1 and the changes of those parameters from the solvent control were calculated and shown in Figure 5.
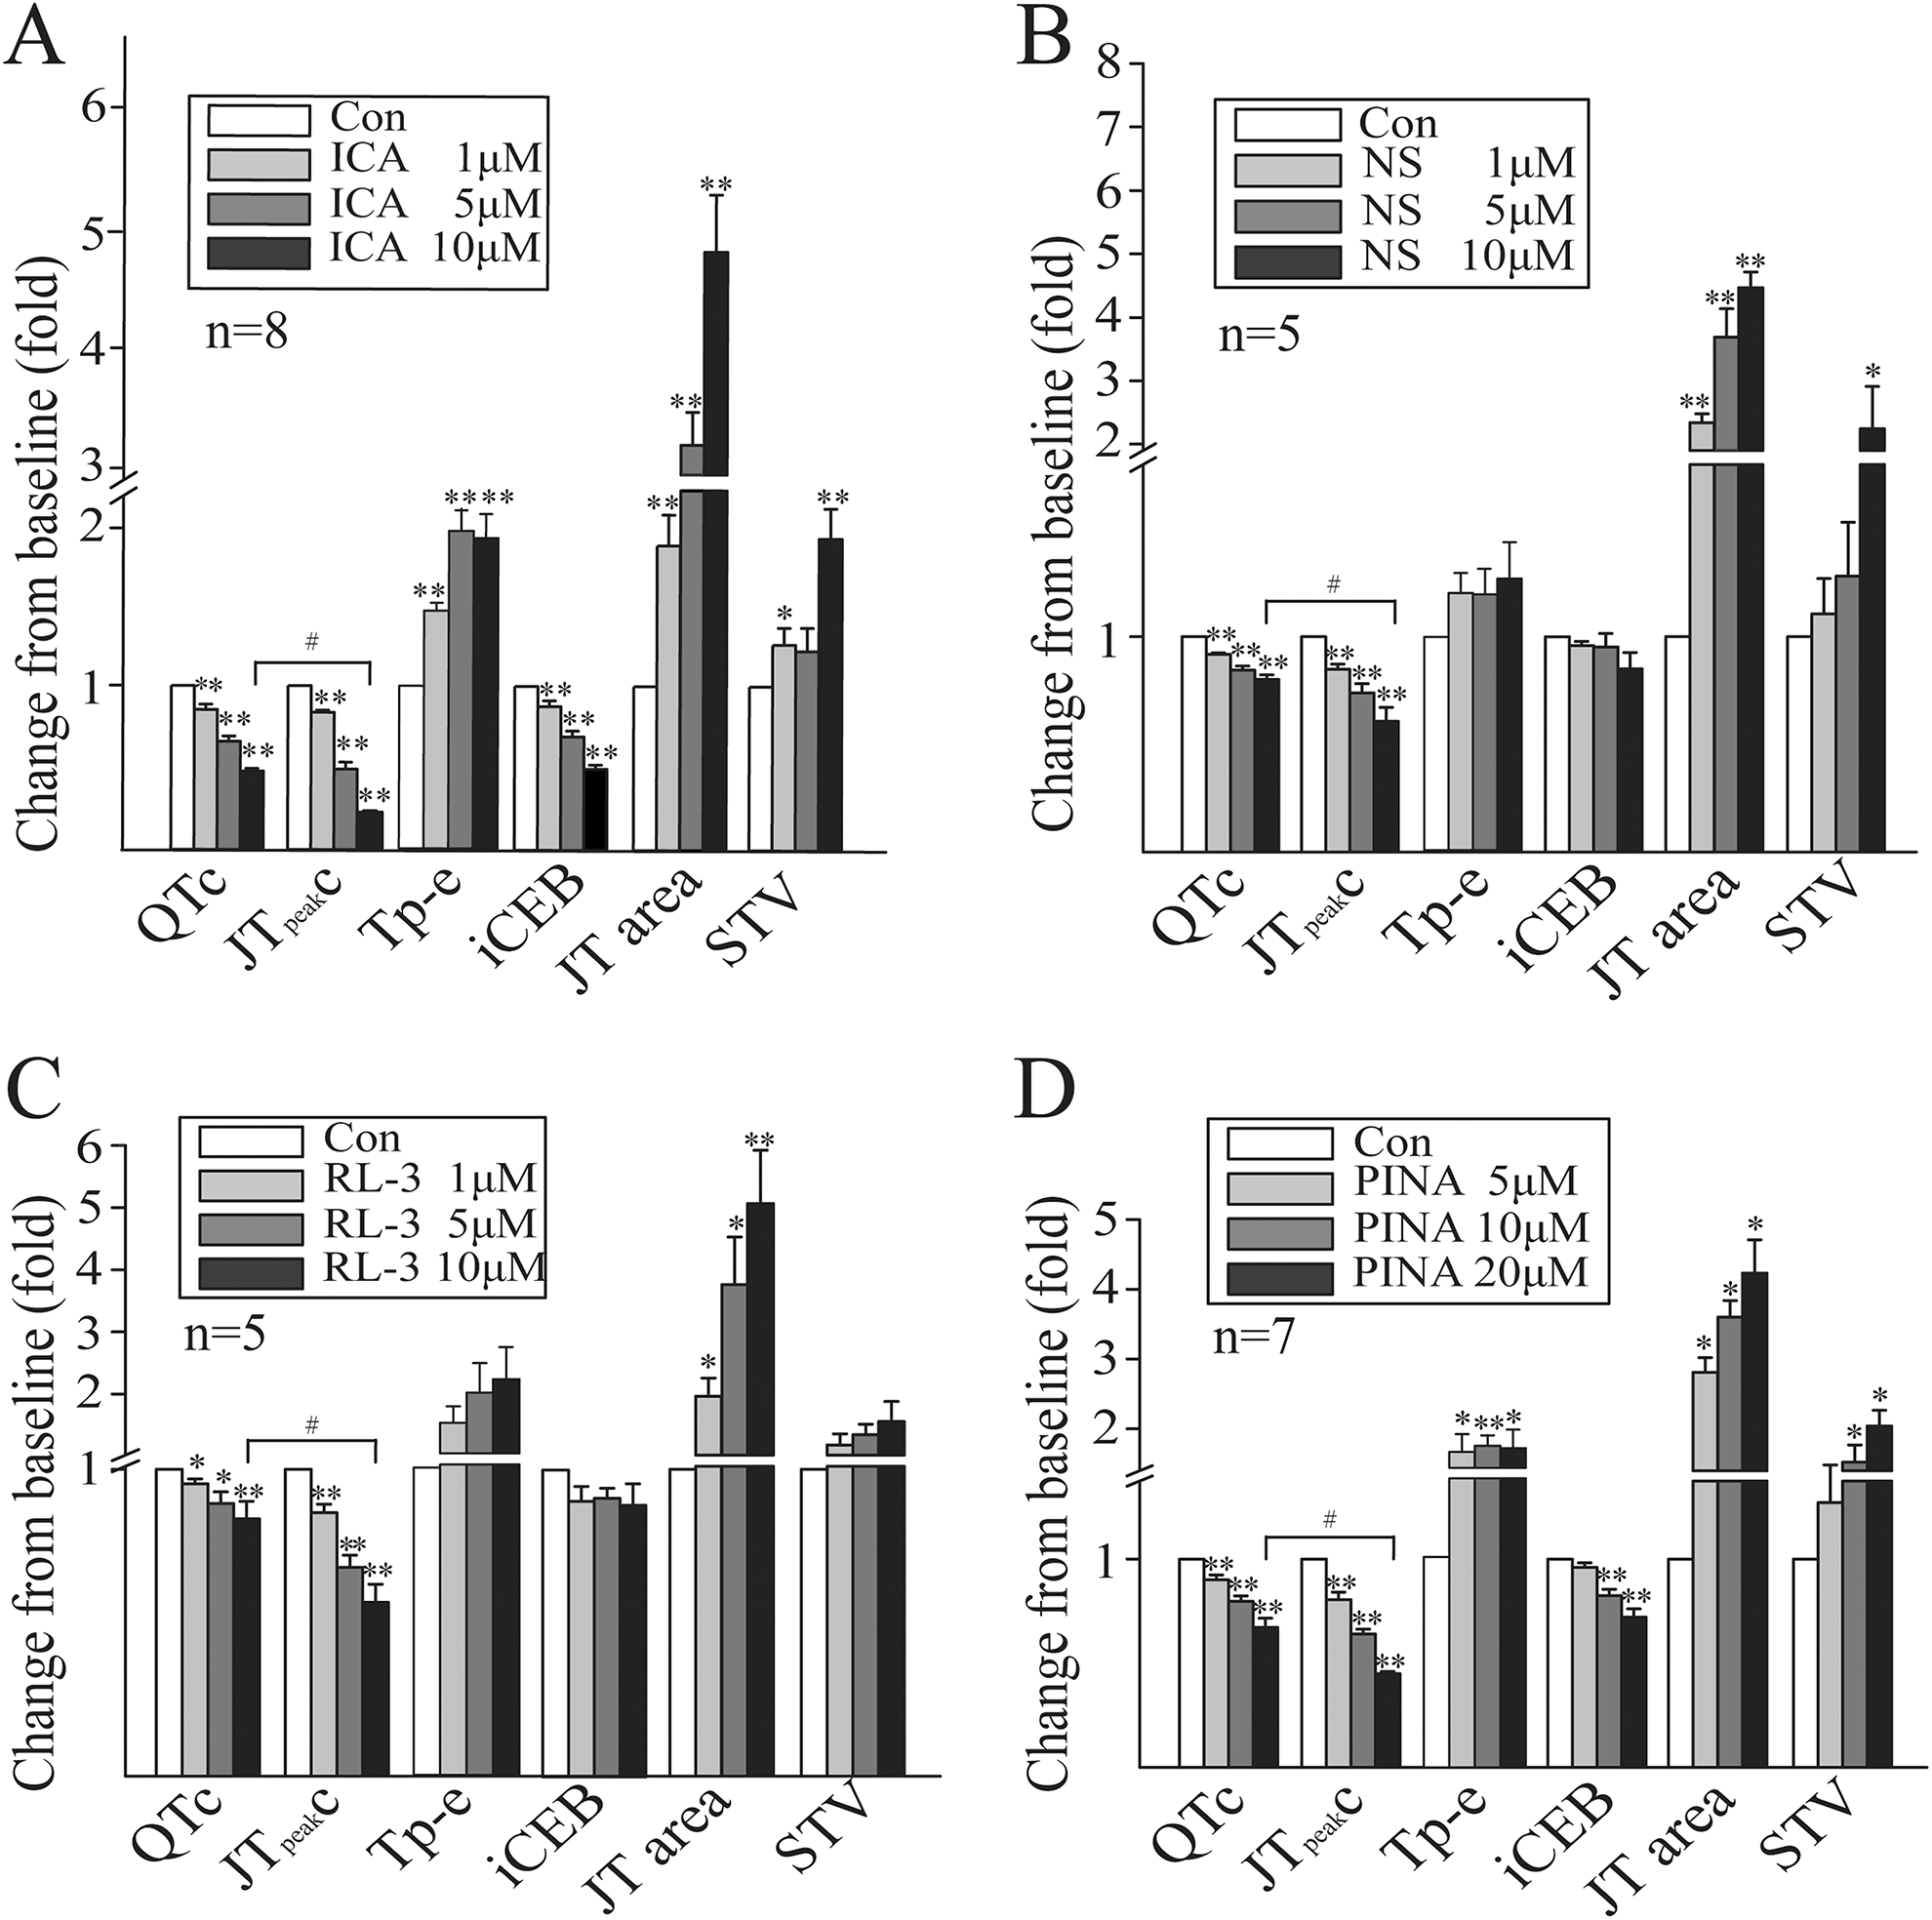
Summary data for changes in guinea pig heart ECG parameters in the presence of various concentrations of potassium channel openers (*P < .05, **P < .01 vs control; #P < .05). ECG indicates electrocardiography.
IKr Activators
Both ICA and NS enhance IKr current. The former removes channel inactivation, while the latter attenuates it. 30 As shown in Figure 5A, ICA significantly shortened QTc, the JTpeak interval, and the iCEB in a concentration-dependent manner. It increased Tp-e and JT area in the same way. At higher concentrations (10 μM), ICA significantly increased STV. The ROC analysis showed that the JTpeak interval, the Tp-e, and the JT area had AUC >0.9. Therefore, they were highly predictive of VT/VF (Table 1).
The Area Under ROC Curve of Parameters Measured From ECGs.

Note. The area under the ROC curve (AUC) was calculated, and AUC>0.9 was considered to be highly accurate in predicting the occurrence of VT/VF. Therefore, the values more than 0.9 are in bold in this table.
Abbreviations: AUC, area under the ROC curve; ECG, electrocardiography; iCEB, index of cardiac electrophysiological balance; ROC, receiver operating characteristic curve; STV, short-term beat-to-beat QT interval variability.
The NS significantly shortened QTc and the JTpeak interval at all of the 3 test concentrations (ranging from 1 to 10 μM). However, NS did not significantly change Tp-e and iCEB. It increased JT area in a concentration-dependent manner (Figure 5B). At higher concentrations (10 μM), NS significantly increased STV. The ROC analysis showed that the JTpeak interval and the JT area had the highest AUC values in response to NS treatment (Table 1).
IKs Activator
Relative to DMSO, R-L3 decreased QTc and the JTpeak interval in a concentration-dependent manner. There was no change in iCEB, Tp-e, or STV at any of the 3 test concentrations. R-L3 increased the JT area in a concentration-dependent manner (Figure 5C). The ROC analysis showed that the JTpeak interval and the JT area had the highest AUC values in response to IKs activator treatment.
Adenosine Triphosphate–Dependent Potassium Channel Opener
In the presence of PINA, QTc, the JTpeak interval, and the iCEB were decreased in a concentration-dependent manner. In contrast, Tp-e and the JT area were significantly increased (Figure 5D). The ROC analysis showed that the QTc, the JTpeak interval, and the JT area had the highest AUC values in response to PINA treatment.
In summary, all 4 potassium channel openers decreased QTc and the JTpeak interval and amplified the JT area in Langendorff-perfused guinea pig hearts. However, all 4 drugs shortened the JTpeak intervals more than they did QTc at profibrillatory concentrations (Figure 5). The ROC analysis showed that the JTpeak interval representing the duration of early repolarization and the JT area reflecting the dispersion of ventricular repolarization were the best predictors of VT/VF.
In addition, the changes in ECG parameters by 4 agents at high concentrations in isolated rabbit hearts were also calculated and compared with those in guinea pig hearts. It was noticed that compared to rabbit hearts, guinea pig hearts had more changes in the JTpeak interval and the JT area (exception of PINA; Supplemental Figure 1). The effects of the potassium channel openers on HR, the PR interval, and QRS were also examined. Except for ICA, the mid and high concentrations of the potassium channel openers slowed HR in guinea pig hearts (Supplemental Table 2). None of the potassium channel openers affected the width of QRS.
Effect of Potassium Channel Openers on AP Parameters
The AP assay is another frequently used preclinical model to assess the risk of proarrhythmia induced by drugs. We tested the effects of potassium channel openers on AP in isolated guinea pig papillary muscle at stimulation frequencies of 0.2, 1, and 2 Hz, since APD is frequency dependent. Figure 6A-D displays representative AP traces recorded before and after the application of various concentrations of potassium channel openers at 2 Hz. The corresponding changes in APD90 from the baseline at 3 stimulation frequencies are shown in Figure 6E-H. The results demonstrated that all potassium channel openers shortened APD90 in a concentration-dependent manner, but they did not influence the frequency dependence of APD90. Abnormal electrical activities, including early afterdepolarization (EAD) or delayed afterdepolarization (DAD), were detected at the maximum stimulation frequency (2 Hz; Figure 6A-C). These abnormalities were not observed at lower pacing frequencies, either 0.2 Hz or 1 Hz. The finding was consistent with a previous study, which demonstrated that QT-shortening drugs (the ATP-sensitive potassium channel opener levcromakalim and the IKr activator mallotoxin) only elicited non-TdP-like VT/VF at 2 Hz (but not at lower frequencies) in isolated, arterially perfused rabbit left ventricular wedges. 23 The ICA evoked EAD in 4 of 6 preparations. Both NS and R-L3 induced DADs in 4 of 5 and 5 of 5 preparations, respectively. The APD30, APD90-30, and ERP were also measured. Summary data are shown in Figure 7. All potassium channel openers significantly shortened APD90, APD30, and ERP. The APD30 and APD90-30 represent the early and late repolarization phases, respectively. As shown in Figure 7, none of the potassium channel openers significantly changed APD90-30. Therefore, APD90 shortening resulted from the change in APD30. This finding was consistent with the aforementioned results of the ECG recordings.

Action potential recordings in guinea pig papillary muscles using standard glass microelectrodes. (A-D) Representative action potential recordings at a stimulatory frequency of 2 Hz in the absence or presence of potassium channel openers. Arrows represent abnormal electrical activities, including early or delayed afterdepolarizations. (E-H) Summary data for changes in APD90 at various stimulatory frequencies in the absence or presence of potassium channel openers (*P < 0.05, **P < 0.01 vs. control).

Effects of potassium channel openers on action potential parameters, including APD90, APD90-30, APD30, and ERP after perfusion with various concentrations of potassium channel openers (*P < .05, **P < .01 vs control). APD indicates action potential duration; ERP, effective refractory period.
Effect of Potassium Channel Openers on Outward K+ Currents
To explain the findings at the organ and tissue levels, we examined the effect of potassium channel openers on the outward K+ current during an AP process induced by an AP clamp in guinea pig ventricular cardiomyocytes. Figure 8A shows representative outward current traces before (control) and after the administration of potassium channel openers. The shape of the outward K+ currents varied among the 4 potassium channel openers because they target different ion channels. Except for PINA, the potassium channel openers elicited the maximum outward current increment in the phase 2 repolarization. In contrast, PINA uniformly increased the current throughout the entire repolarization process. We determined the (shaded) area under the current trace to calculate the outward current amplification (expressed by the relative increase over the control) during the early repolarization section which corresponded to APD30. As shown in Figure 8B, all 4 potassium channel openers increased the early repolarization of the outward currents in a concentration-dependent manner. This enhancement was significantly higher at concentrations evoking VT/VF than at lower concentrations not inducing VT/VF (Figure 8C).

Effects of potassium channel openers on the outward potassium current recorded in action potential clamp mode. A, Representative outward potassium current traces in the presence of potassium channel openers at low (L), middle (M), and high (H) concentrations. Outward potassium currents were evoked by pulse protocol (top panel). B, Summary data for changes in shaded area corresponding to early repolarizing total current at various potassium channel opener concentrations versus control (**P < .01 vs control). C, Summary data for current changes at various potassium channel opener concentrations with or without VT/VF (*P < .05 vs concentrations without VT/VF). “n” represents the number of cardiomyocytes. VF indicates ventricular fibrillation; VT, ventricular tachycardia.
Discussion
Sensitive Models in the Assessment of Drug-Induced Arrhythmogenic Risk
To date, many studies have been conducted to assess the proarrhythmic risk about QT-prolonging drugs in models with intact repolarization. To increase the susceptibility to drug-induced TdP, some of proarrhythmic models have the attenuated repolarization reserve either by pharmacological predisposition or through pathological remodeling. 31 The most commonly used models include the isolated canine or rabbit left ventricular wedge preparation, the isolated rabbit or guinea pig heart, the methoxamine-pretreated anesthetized rabbit, and the complete, chronic atria–ventricle-blocked dog/rabbit. 32 In addition, some transgenic LQT or SQT models have been constructed for testing proarrhythmic risk and/or for investigations of mechanisms underlying arrhythmias. 33 -36 The susceptibility to arrhythmia in response to the administration of QT-prolonging drugs varies with species. In the present study, then, the proarrhythmic effects of QT-shortening drugs were compared in isolated, spontaneously beating guinea pig and rabbit hearts. Consistent with the findings for inherited SQT, our results demonstrated that higher concentrations of potassium channel openers induced non-TdP-like VT/VF. Guinea pig hearts were more susceptible to arrhythmias than rabbit hearts. Nevertheless, all 4 potassium channel openers induced comparable QT shortening in both species. Comparison of ECG parameters between 2 species showed that 4 agents at high concentrations induced greater changes of the JTpeak interval and the JT area in the guinea pig than in the rabbit heart model. A similar study revealed that QT-prolonging agents like calcium channel activators, sodium channel inactivation inhibitors, and IKs inhibitors may be more likely to induce TdP in isolated guinea pig hearts than in rabbit hearts. 37 Species differences in arrhythmia susceptibility may be explained by different K+ current profiles, which, in turn, result from species-dependent channel subunit expression. 38 Overall, our results demonstrated for the first time that the isolated, spontaneously beating guinea pig heart is a useful model for predicting the risk of QT-shortening drugs inducing proarrhythmia.
Biomarkers Predicting Arrhythmogenic Risk of VT/VF Induced by QT-Shortening Drugs
QT interval prolongation is associated with TdP, but it is a poor biomarker of the risk of TdP. 39 Much research has been dedicated to identifying new TdP biomarkers. 40 Increases in the TDR, instability of the QT interval, and triangulation and reverse use dependence of the cardiac AP are highly predictive of drug-induced TdP. 41 However, it is unknown whether these parameters predict the potential risks of arrhythmias-induced QT shortening. One ECG biomarker analysis was performed on conscious dogs, but it was based on arrhythmia-free ECG. 42 In the present study, we found that all 4 potassium channel openers shortened QT/QTc and APD in a concentration-dependent manner, although previous studies have shown that NS1643 may be likely to inhibit IKs, and R-L3 blocks IKr and L-type Ca2+ current ICa. 43,44 Further analysis demonstrated that the shortened QT/QTc was derived from the acceleration of the early repolarization phase, which manifested as the shortening of the JTpeak intervals. In accordance with this finding, 4 agents shortened APD30 in a concentration-dependent manner, but had essentially no influence on APD90-30. On the other hand, patch-clamp recording showed that during the early phase of the AP, the potassium channel openers significantly enhanced the outward repolarizing currents. Especially, the increment of outward current amplitudes was more marked at the concentrations inducing VT/VF than those not evoking VT/VF. Our findings support the concept that potassium channel openers accelerate cardiac early repolarization and shorten both QT/QTc and APD. Nevertheless, the present study also showed that the occurrence of arrhythmias did not correlate with the extent of QT shortening. Arrhythmias did not occur in hearts with maximal QTc shortening induced by ICA, NS, or RL-3 (Figure 4). Therefore, our study suggests that QT shortening per se is a poor predictive biomarker of VT/VF. The ROC analysis suggested that the JTpeak interval has very high VT/VF prediction power. It has been demonstrated that the JTpeak interval is helpful in differentiating pure IKr blockers from those concomitant with inward current (such as late sodium and calcium) inhibition. 16 A recent study has shown that the diagnostic performance of the JTpeak interval is similar to QTc in LQT1 and LQT3 patients, but inferior in LQT2 patients. 15 We provided the first experimental evidence for the usefulness of the JTpeak interval in the proarrhythmia prediction of QT-shortening drugs. Several reports have shown that in various preclinical models, an increase in short-term QT interval variability precedes drug-induced TdP and is a better predictor of TdP development than QTc interval prolongation. 34 Our findings indicated that not all QT-shortening drugs increased STV, although all of them induced VT/VF at high concentrations in guinea pig hearts. The ROC analysis demonstrated that STV is not a good predictor of the VT/VF induced by QT-shortening drugs. This result is consistent with an earlier report that NS1643 and levcromakalim induce non-TdP-like VT/VF in rabbit wedge preparations. However, they were not associated with increases in QT interval instability. In contrast, instability of the QT interval effectively predicts the risk of TdP induced by QT-prolonging compounds. 22
Amplification of the spatial dispersion of repolarization in the form of TDR is the basis for the development of life-threatening ventricular arrhythmias. The TDR is usually detected by the interval from the peak to the end of the ECG T-wave (Tp-e). 45 QT-prolonging drugs induce TdP and increase TDR. Therefore, Tp-e is generally considered an excellent marker for drug-induced TdP. Several studies have also proposed that the area of the total T-wave (the JT area), including the repolarization amplitude and time components, reflects spatial dispersion in the heart. 20 In this study, two of the potassium channel openers did not change Tp-e even at concentrations inducing VT/VF. In contrast, all 4 potassium channel openers increased the JT area in a concentration-dependent manner. The ROC analysis showed that the JT area was excellent at predicting the occurrence of VT/VF. Transmural, transseptal, and apicobasal heterogeneities in the final repolarization of the AP within the ventricular myocardium are responsible for T-wave inscription. In a dog model of complete, chronic atrioventricular block and acquired long-QT syndrome, the increase in the heterogeneity of the ventricular repolarization was often associated with alterations in the JT area. 19 Our results, then, suggested that the JT area reflecting T-wave shape may better represent the dispersion of ventricular repolarization than Tp-e.
A novel surrogate marker, iCEB, has been proposed to be more useful than the current biomarkers (transmural dispersion and instability) at predicting the potential risks of drug-induced arrhythmias in the rabbit left ventricular arterially perfused wedge preparation. 22 Nevertheless, we found that not all of the QT-shortening drugs changed iCEB even at the concentrations inducing VT/VF. This discrepancy may be explained by the differences between the 2 experimental models. In addition, the AP recordings showed no reversal frequency-dependent APD changes with any of the potassium channel openers (Figure 6). The APD90-30 disturbance represents the triangulation of the APs. 46 Therefore, the present study indicated that augmentations of the triangulation and reverse use dependence of the AP are not suitable biomarkers for predicting arrhythmias induced by QT-shortening drugs.
Overall, our results suggest that both the JTpeak interval and the JT area are better predictors of non-TdP-like VT/VF induced by QT-shortening drugs than QTc, Tp-Te, STV, or iCEB. In addition, the study found that the JTpeak interval and the JT area underwent greater change in the guinea pig than in the rabbit heart model. The finding provided further evidence to support this notion.
Possible Proarrhythmic Mechanism Underlying Drug-Induced QT Shortening
The amplification of spatial dispersion and the development of EAD-induced activity are the substrate and the trigger for the development of TdP observed under LQT conditions, respectively. 47 The mechanism of arrhythmogenesis in SQTs is less well understood than that in LQTs. Mechanistically, enhancement of cardiac K+ channels will shorten APD and ERP, thereby increasing the likelihood of reentry. 48 Experiments on canine wedge preparations have shown that PINA shortens APD significantly more in the epicardium than the endocardium. This phenomenon increases transmural repolarization gradients culminating in phase 2 reentry. 49 We found that the QT-shortening agents significantly increased the JT area, reflecting the dispersion of ventricular repolarization. Nevertheless, we did not directly test for heterogeneity of AP repolarization among the various cardiac regions. The increased dispersion of ventricular repolarization may be the result of heterogeneity in accelerating cardiac early repolarization, which manifested as the shortening of the JTpeak interval. In addition, our study also directly provided evidence that potassium channel openers preferentially enhance the outward repolarizing currents early in the AP process and resulted in the acceleration of early repolarization.
The EADs and the activities they trigger may be the basis for the arrhythmogenesis observed in long QT syndromes. Therefore, in preclinical models, the EADs in AP recordings are end points in the evaluation of the potential proarrhythmic risk associated with drug-induced QT prolongation. 50 In previous studies, however, no triggered activities (EADs/DADs) were reported under SQT conditions. In the present study, 3 of the 4 tested QT-shortening drugs evoked EADs or DADs under fast-frequency pacing. One study has shown that rapid stimulation is essential in the detection of drug-induced QT shortening and its associated VT/VF. 23 Abnormal activity induced by EAD or DAD may be a trigger for the development of VT/VF under SQT conditions. However, the exact molecular mechanisms of EADs or DADs in SQTs are not known.
Conclusions
In conclusion, the present study indicated that QT/QTc shortening is associated with the severe VT/VF-type arrhythmias. Therefore, drug-induced QT interval shortening may be at least as precarious as QT prolongation. The noninvasive ECG parameters, JTpeak interval and JT area, may be useful surrogate markers to evaluate the proarrhythmia risk in the development of QT-abbreviating compounds and to clinically identify the risk associated with the administration of QT-abbreviating agents. Acceleration of early-phase repolarization and increased dispersion of ventricular repolarization contribute to the occurrence of arrhythmias. However, the mechanism underlying the species difference in arrhythmia susceptibility to K+ channel openers is not known in this study. It may be helpful to further make comparisons of pharmacological responses at AP and K+ current level between 2 species. In addition, relative expression of ionic channels in rabbit and guinea pig hearts differs from that of the humans, especially there is larger IKs in guinea pig than human hearts. Moreover, the conclusion obtained from this study was based on the healthy hearts and tissues that do not recapitulate clinical situations and patients with the highest arrhythmia susceptibility (with structural and/or electrical remodeling of the myocardium). Thus, caution is warranted when extrapolating experimental finding to the human heart.
Supplemental Material
supplement_Material_1 - Utility of the JT Peak Interval and the JT Area in Determining the Proarrhythmic Potential of QT-Shortening Agents
supplement_Material_1 for Utility of the JT Peak Interval and the JT Area in Determining the Proarrhythmic Potential of QT-Shortening Agents by Bo Qiu, Yuhong Wang, Congxin Li, Huicai Guo, and Yanfang Xu in Journal of Cardiovascular Pharmacology and Therapeutics
Footnotes
Author Contributions
Y.X. designed the experiments. B.Q., Y.W., and C.L. performed the experiments. B.Q., Y.W., and H.G. analysed the data. B.Q. and Y.X. wrote the paper.
Declaration of Conflicting Interests
The author(s) declared no potential conflicts of interest with respect to the research, authorship, and/or publication of this article.
Funding
The author(s) disclosed receipt of the following financial support for the research, authorship, and/or publication of this article: This work was supported by the National Natural Science Foundation of China (grant no. 81641135) and the Program for University Innovation Team Leading Talent of Hebei Province (grant no. LJRC019).
Supplemental Material
Supplemental material for this article is available online.
References
Supplementary Material
Please find the following supplemental material available below.
For Open Access articles published under a Creative Commons License, all supplemental material carries the same license as the article it is associated with.
For non-Open Access articles published, all supplemental material carries a non-exclusive license, and permission requests for re-use of supplemental material or any part of supplemental material shall be sent directly to the copyright owner as specified in the copyright notice associated with the article.