
Abstract
Background:
Angiotensin-converting enzyme (ACE) inhibitors (ACEI) are widely used in the management of cardiovascular diseases but with significant interindividual variability in the patient’s response.
Objectives:
To investigate whether interindividual variability in the response to ACE inhibitors is explained by the “ACE phenotype”—for example, variability in plasma ACE concentration, activity, and conformation and/or the degree of ACE inhibition in each individual.
Methods:
The ACE phenotype was determined in plasma of 14 patients with hypertension treated chronically for 4 weeks with 40 mg enalapril (E) or 20 mg E + 16 mg candesartan (EC) and in 20 patients with hypertension treated acutely with a single dose (20 mg) of E with or without pretreatment with hydrochlorothiazide. The ACE phenotyping included (1) plasma ACE concentration; (2) ACE activity (with 2 substrates: Hip-His-Leu and Z-Phe-His-Leu and calculation of their ratio); (3) detection of ACE inhibitors in patient’s blood (indicator of patient compliance) and the degree of ACE inhibition (ie, adherence); and (4) ACE conformation.
Results:
Enalapril reduced systolic and diastolic blood pressure in most patients; however, 20% of patients were considered nonresponders. Chronic treatment results in 40% increase in serum ACE concentrations, with the exception of 1 patient. There was a trend toward better response to ACEI among patients who had a higher plasma ACE concentration.
Conclusion:
Due to the fact that “20% of patients do not respond to ACEI by blood pressure drop,” the initial blood ACE level could not be a predictor of blood pressure reduction in an individual patient. However, ACE phenotyping provides important information about conformational and kinetic changes in ACE of individual patients, and this could be a reason for resistance to ACE inhibitors in some nonresponders.
Keywords
Introduction
Angiotensin-converting enzyme (ACE) inhibitors (ACEIs) are widely used for the treatment of cardiovascular diseases, 1∓2 yet their mechanism of action is incompletely understood. In general, it is believed that these drugs block angiotensin (Ang) II generation at tissue sites rather than Ang II generation in circulating blood. 3 ∓5 In addition, interference with the metabolism of ACE substrates other than Ang I (eg, bradykinin, N-acetyl-Ser-Asp-Lys-Pro, and angiotensin peptides) may contribute to their beneficial effects. 6 ∓9
Not all patients respond to ACE inhibitors, 10 ∓14 and it has been suggested that genetic variation might be a useful marker to predict the therapeutic efficacy of these drugs. 15,16 In particular, the ACE insertion (I)/deletion (D) polymorphism has been investigated in this regard, although no conclusive data have been obtained. This polymorphism associates with the ACE concentration in blood and tissues, patients with 1 or 2 D alleles having approximately 30% and 60% higher ACE levels, respectively, than patients with the II genotype. 17 Patients with the DD genotype are assumed to display increased Ang II generation and to require higher doses of ACE inhibitors to fully suppress ACE. However, despite decades of intensive research, involving the genotyping of thousands of patients, the prediction of blood pressure (BP) response based on ACE I/D genotyping remains controversial—see Discussion in studies by Mellen et al and Danser et al. 16,18 In dozens of publications, BP response to ACE inhibitors was greater in patients with DD genotype. 19 ∓22 However, in several studies that included several thousand patients, the ACE I/D polymorphism was not associated with cardiovascular benefits of ACE inhibition. 23,24
The most intensively studied I/D polymorphism accounts for less than 20% of plasma ACE variability 25 ∓28 ; therefore, we propose that ACE phenotype will have a much higher prognostic power to predict response of individuals to ACEIs when compared to ACE genotype alone, especially if such comparisons are based on just 1 polymorphism. 18,29
We performed ACE phenotyping during chronic and acute treatment of patients having hypertension with ACE inhibitor enalapril (E) in combination with either the AII receptor antagonist candesartan (chronic study) or with pretreatment using hydrochlorothiazide (HCT). We demonstrated that the BP drop after chronic ACE inhibitor treatment is larger in patients with high serum ACE levels. Thus, the parameters that compose our “ACE phenotype” determine, at least in large part, the hemodynamic response to ACE inhibitors in patients with hypertension. We also demonstrated that ACE phenotyping provides important information on kinetic properties and conformational changes in blood ACE in individual patients which partially explains resistance to ACE inhibitors in nonresponders, that is, nonadherence. In addition, kinetic and conformational aspects of ACE phenotyping allow us to identify easily, and objectively, whether patient actually took ACE inhibitors, that is, compliance, regardless of subjective patients’ self-reported compliance.
Materials and Methods
Chemicals
Benzyloxycarbonyl-L-phenylalanyl-L-histidyl-L-leucine (Z-Phe-His-Leu) was purchased from Bachem Bioscience Inc (King of Prussia, Pennsylvania). Hippuryl-L-histidyl-L-leucine (Hip-His-Leu), lisinopril, captopril, and other reagents (unless otherwise indicated) were obtained from Sigma (St Louis, Missouri). Enalaprilat was obtained from Apotex (Toronto, Canada).
Antibodies
The following antibodies to human ACE were used in this study: (1) sheep polyclonal antihuman ACE antibody, used in ACE enzyme-linked immunosorbent assay (ELISA) kit (Chemicon Int, Temecula, California), kindly provided by Dr I. Adamova (POCARD Ltd, Moscow, Russia); (2) mouse monoclonal antibodies to human ACE: mAb 9B9 30,31 and mAb 1G12 and 6A12,30,32 recognizing native conformation of the N domain of ACE.
Clinical Trial
The clinical part of both the studies (chronic and acute) was performed in the Erasmus Medical Center (Rotterdam, the Netherlands) and described in detail elsewhere. 33 The study protocol was approved by the ethical committee of the Erasmus MC, and written informed consent was obtained from all patients.
Chronic Study
This study was conducted as a double-blind, crossover trial lasting 11 weeks. A 3-week, single-blind placebo run-in period was followed by 8 weeks of double-blind active medication. Patients were recruited from the outpatient Hypertension Clinic of the Erasmus MC. Caucasian patients with uncomplicated hypertension, aged between 18 and 65 years, could participate if they were willing to give written informed consent. The BP at the end of the placebo run-in period should be between 140 and 180 mm Hg systolic and 90 to 100 mm Hg diastolic (SBP and DBP). After the placebo run-in period, the patients were randomized for treatment with E40 mg (E40) or E20 mg and 16 mg candesartan (E20 + C16) once daily. At the end of the placebo and active treatment periods, blood sampling and ambulatory BP measurements were performed.
Acute Study
For this study, patients were recruited from the outpatient Hypertension Clinic of the Erasmus MC. Male and female patients diagnosed with grade 1 or 2 essential hypertension (SBP: 140-180 mm Hg and/or DBP: 90-110 mm Hg, when not taking antihypertensive medication for at least 2 weeks), with an age between 18 and 70 years and of Caucasian or Asian ethnicity were included in the study. According to a randomization list, each patient was given in a double-blinded way a single dose of E20 mg or placebo without prior treatment with a diuretic. In addition, each patient was given a single dose of E20 mg, after pretreatment with a low dose of HCT, 12.5 mg daily for 1 week. Blood pressure was measured with the Spacelabs 90217 BP monitor (Issaquah, WA, USA). After baseline BP measurements, blood was sampled, and immediately after blood sampling the patient took his or her study medication. Blood sampling was repeated 1, 2, 4, 6, and 24 hours after intake of study medication.
Determination of ACE Activity
Heparinized human plasma or serum, usually 20 to 40 μL, diluted 1/5 with phosphate-buffered saline (PBS)/ bovine serum albumin (BSA, 0.1 mg/mL) were incubated at 37°C with 200 μL of substrate in phosphate buffer (0.1M, 0.3M NaCl, pH 8.3) for 2 hours, and ACE activity was assayed by fluorimetric method using 2 substrates: Hip-His-Leu (Bz-Gly-His-Leu, 5 mmol/L, 34 and Z-Phe-His-Leu (carbobenzoxy-Phe-His-Leu, 2 mmol/L. 35 Calculation of ZPHL–HHL ratio 26,36 was performed by dividing fluorescence of the sample with ZPHL to that with HHL
Quantification of ACE Level
Plate immunoprecipitation assay
The 96-well plates (Corning, Corning, New York) were coated with 50 µL (10 µg/mL) of goat antimouse immunoglobulin G (IgG; Pierce, Rockford, Illinois) overnight (4°C) and then, after washing with PBS/0.05% Tween 20, with anti-ACE mouse monoclonal antibodies (mAbs) 9B9 or 1G12 or 6A12 (2 µg/mL) in PBS/BSA for 2 hours at room temperature (RT). Wells were then incubated with 50 µL of heparinized plasma or serum diluted 1:5 in PBS (∼ 5 mU/mL of ACE) overnight (4°C) and then assayed for plate-bound ACE activity using HHL as a substrate. 26,36
ACE ELISA
The 96-well plates (Corning) were coated directly with 50 µL of mAbs to ACE (10 µg/mL) overnight at 4°C. After washing with PBS/0.05% Tween 20, the wells were incubated with 50 µL of diluted (1/5-1/10) serum/plasma samples overnight at 4°C. Plate-bound ACE activity was quantified using sheep polyclonal antibodies to human ACE, conjugated with horseradish peroxidase—from ACE ELISA Kit (Chemicon Int), based on the study by Danilov et al. 26
Inhibition of ACE activity by ACE inhibitors
Enzyme solutions (usually 180 μL) diluted in PBS/BSA (0.1 mg/mL) were incubated with 20 µL of ACE inhibitors—from 10−4 to 10−11 mol/L during 2 hours at RT in order to reach steady state equilibrium. After that, 20 to 40 µL of incubation mixture was incubated 1 to 4 hours with 200 µL of substrates, and ACE activity was determined as mentioned earlier. In this variant of the ACE activity assay, the concentration of the substrates (5 mmol/L for HHL and 2 mmol/L for ZPHL) was at least 3 times higher than Km. Relative extent of ACE inhibition was calculated via ZPHL–HHL ratio as described in detail. 36
Statistical Analysis
Values are provided as means and standard deviations or for data that are not normally distributed; data are presented as medians and ranges. For each patient, the SBP and DBP response to ACE inhibition for a period of 30 minutes through 6 hours after administration and for the entire 24-hour period, corrected for placebo and baseline BP, is calculated. For the situations with and without pretreatment, BP responses are plotted against baseline plasma ACE, and the extent of ACE inhibition (Z–H ratio) and correlation coefficients are calculated. Using multivariate analysis, it was subsequently determined to what extent the BP responses are dependent on plasma ACE and the extent of ACE inhibition.
Results and Discussion
Introduction to ACE phenotyping
ACE phenotyping in individual patients included the quantification of the following 3 parameters: ACE activity: Plasma ACE activity before treatment with E and candesartan was determined fluorometrically using 2 different substrates: HHL and ZPHL.
26,36
ACE ELISA: The concentration of ACE protein was determined using an ACE ELISA which was based on mAB to the epitope localized on the N domain of ACE (9B9) as a detecting antibody and polyclonal antibodies to human ACE conjugated to peroxidase as a revelation antibody. This method allowed us to determine the concentration of ACE protein in the plasma, despite the presence of EDTA or ACEIs.
26
In one of the variant of antibody-based plate precipitation assay, we were able to determine ACE activity in the presence of ACE inhibitors because after immunocapture of ACE by mAb 9B9, the ACE inhibitors were dissociated during the washing procedure.
26
Presence of ACE inhibitors in the blood of patients: Kinetic-based assay (ZPHL–HHL Ratio). The 2 domains of ACE hydrolyze the same range of natural and synthetic substrates but with different specificities.
37
∓40
Two substrates, ZPHL and HHL, were used for determination of ACE activity at fixed concentrations, 2 and 5 mmol/L, respectively. These substrates display some contrasting enzymatic properties: The C domain of human ACE hydrolyzes HHL at a much faster rate (9-fold) compared to the N domain 37, whereas ZPHL is hydrolyzed almost equally by both domains.
30
Previously, it was found that the ratio of the rates of the hydrolysis of 2 substrates (ZPHL–HHL ratio) is characteristic for each type of ACE: somatic (2-domain) human ACE ratio ∼ 1, N-domain ∼ 5 to 6, and C-domain ∼ 0.7.
41
Therefore, selective inhibition of the C domain in somatic ACE should increase this ratio above 1.0, for example, more characteristic for the N domain, whereas selective inactivation or inhibition of the N domain in somatic ACE should decrease the ratio as in the C domain; this change in ratio was demonstrated recently.
36
We estimated the inhibition of ACE activity in human plasma and ZPHL–HHL ratio after incubation with different concentration of enalaprilat (Figure 1A). The extent of ACE inhibition with HHL as a substrate was higher than with ZPHL as substrate, as reflected by lower IC50 values. As a result, ZPHL–HHL ratio increased dramatically with an increase in the concentration of active form of E (enalaprilat), with detection limits of 0.3 nmol/L for enalaprilat (Figure 1B). Therefore, measurement of ZPHL–HHL ratio can be used for the detection of the presence of ACEIs in human blood or other biological fluids.
36
The concentration of ACEIs in human blood varies from 50 nmol/L at peak to 5 nmol/L after 24 hours following a 10-mg dose
42
; thus, the sensitivity of the assay is more than enough to detect and follow the concentration of ACE inhibitors in the blood. The intra-assay and interassay coefficients of variation of the ZPHL–HHL ratio were less than 10%. Therefore, the calculation of ZPHL–HHL ratio allows one to distinguish, unambiguously, patients who have taken ACEIs from nontreated individuals.
36
Antibody-based assay (6A12–9B9 ratio). Previously, we demonstrated that precipitation of blood ACE by mAbs 6A12 and 1G12 increased dramatically in the presence of ACEIs; this allowed us to develop a very sensitive assay for the detection and quantification of active forms of ACEIs in the human blood
32
(and Figure 8 therein). As a parameter for characterizing the concentration of active ACEIs, we used the ratio of ACE activity precipitated by mAb 6A12 compared to that by mAb 9B9. Due to the variation in ACE levels in tested patients, for example, 5-fold for 95% of population,
26,43
the absolute values of ACE precipitation by mAb 6A12 might not be visibly higher in the patients with ACEIs in their blood, compared to healthy donors. Conversely, patients having ACEIs in the blood could be clearly separated from normal donors by the calculation of the ratio of ACE precipitation with mAbs 6A12 and 9B9 to another region on the N-domain (see Figure 8C in the study by Balyasnikova
32
). The sensitivity of this antibody-based assay for the detection of active forms of ACEIs was 0.03 nmol/L
32
and was one order of magnitude higher than the kinetic-based assay sensitivity of 0.3 nmol/L.
36
In the present study, we used this assay to quantify the level of enalaprilat in patient’s blood 3 and 24 hours after the last dose was taken (See Figure 2B). The degree of ACE inhibition in patients. In addition to detection and quantification of active form of ACEIs in the patient’s blood, the measurement of ZPHL–HHL ratio also allowed us to detect the extent of ACE inhibition in a particular individual. This parameter depends not only of the efficacy of the individual to convert the inactive form of ACEI (enalapril) into active form (enalaprilat) but also on the actual concentration of active form and the concentration of plasma ACE in a given individual. Therefore, ZPHL–HHL ratio is a more integral parameter of ACE phenotype than solely the concentration of plasma ACE. Figure 1C demonstrates that measurement of ZPHL–HHL ratio allows us to define the extent of ACE inhibition, using HHL as a substrate, at each time point after taking an ACEI. The advantage of this approach is that it allowed us to measure the extent of ACE inhibition without knowing of the initial ACE concentration/activity in a given patient.

Effect of angiotensin-converting enzyme (ACE) inhibitor (ACEI) on the Hip-His-Leu (HHL) and Z-Phe-His-Leu (ZPHL) hydrolysis by blood ACE. A, Human heparinized plasma diluted 1:5 with phosphate-buffered saline (PBS) was preincubated for 2 hours at 37°C with different concentrations of ACEI enalaprilat. B, The residual ACE activity (percentage relative to the samples without enalaprilat) with HHL and ZPHL as substrates. IC50, the concentration of enalaprilat resulting in 50% of ACE inhibition. C, The ratio of fluorescence of ZPHL to HHL (Z/H ratio). Data on panel C expressed as a percentage of ACE inhibition with HHL and ZPHL as a function of Z/H ratio. Results are shown as mean (SD) of several (3-4) experiments. *P < .05, in comparison to control without enalaprilat.

Angiotensin-converting enzyme (ACE) phenotyping on 2 representative patients from chronic treatment arm. First bar for each patient represent the data from patients 5 and 6 before treatment. Next bars represent the data from each patient 24 hours and 3 hours after E or EC treatment, respectively. A, ACE level was quantified by enzyme-linked immunosorbent assay (ELISA) and precipitation assay. Data expressed as a percentage from sample before treatment. B, Monoclonal antibodies (mAbs) 6A12/9B9 binding ratio shows the level of active form of angiotensin-converting enzyme inhibitor (ACEI; enalaprilat). C, Hip-His-Leu (HHL)–Z-Phe-His-Leu (ZPHL; Z/H ratio) shows the extent of blood ACE inhibition and also indicates on the level of enalaprilat. D, Percentage of blood ACE inhibition (with HHL) was calculated from the dependence of Z/H ratio on inhibition of HHL hydrolysis (Figure 1C). Data expressed as percentage of values from pooled serum from several healthy individuals. For patient #5, the value of Z/H ratio before treatment was higher than for patient #6 or for healthy pooled serum; therefore, an “apparent” ACE inhibition before treatment was shown only for patient #5. Results are shown as mean (SD) of 3 experiments. *P < .05, in comparison to control (without ACEI).
ACE Phenotyping in Patients During Chronic Treatment With ACEI
Figure 2 demonstrates the results of ACE phenotyping in 2 representative patients. Figure 2A demonstrates that the ACE protein concentration in the blood of patient #5 increased after treatment with E as well as with EC. Figure 2B and C demonstrates the much higher level of active form of E (enalaprilat) in patients 5 and 6, in the samples of serum taken 3 hours after the last medication dose, compared to serum samples taken at 24 hours. We used 2 different methods, mAb-based precipitation of ACE activity (Figure 2B) and calculation of the ratio of the rates of the hydrolysis of 2 substrates ZPHL/HHL (ZPHL–HHL ratio) shown in Figure 2C. Figure 2D demonstrates that the extent of ACE inhibition in a serum sample taken 3 hours after the last dose was significantly higher than in the serum samples taken 24 hours after the last dose. These results validate the 2 approaches for quantification of the active forms of ACEIs in a patient’s blood. Levels of enalaprilat in E-treated group were higher than that of the EC group (p < .05), which reflects exactly the additional dose of E given to patients in E group.
We performed ACE phenotyping in all 14 patients enrolled in the chronic study. Figure 3 demonstrates that the blood ACE concentration of most patients increased similarly, by approximately 40% in both groups after treatment with enalapril alone (40 mg; E group) or after treatment with E (20 mg) and candesartan (16 mg; EC group).

Angiotensin-converting enzyme (ACE) protein level in the serum of each patient was determined using antibody (mAb 9B9)-based plate precipitation assay and presented in (A) and (B) for enalapril (E) and enalapril + candesartan (EC) groups, respectively. Results are shown as mean (SD) of several (3-4) experiments and expressed as a percentage of sample before treatment. *P < .05, in comparison to control—sample before treatment with ACE inhibitor (ACEI).
It was found that patients treated with ACEIs demonstrate a significant increase in blood ACE levels, 44 and this was later confirmed in animal studies. 45 Despite the fact that ACE expression was found to be increased in many organs of animals after treatment by ACEIs, 46 ∓49 it is hard to imagine that a modest increase in ACE expression found in some tissues, including lung, could be responsible for the significant increase in blood ACE concentration after ACEI treatment.
There are at least 2 reasons why ACE inhibitors lead to increase in plasma ACE, and both of them are related to an effect of ACEIs on ACE conformation and, as a consequence, on the rate of shedding. We believe that, part of the increase in plasma ACE in ACEI-treated patients might be due to local changes in ACE conformation after binding to ACEI. 36 This leads to increased dimerization of ACE 50 and increased ACE shedding. 32,51 Recently, we showed that likely binding of ACEIs to ACE also induced dissociation of novel low-molecular-weight (LMW) ACE effector (bilirubin) perhaps in a concert with novel ACE-binding protein (lysozyme); this dissociation increases the conformational flexibility of ACE on the cell membrane, which leads to an increase in the rate of ACE shedding. 52
It is necessary to note that 1 patient (#6) of 14 tested in this study did not demonstrate an increase in plasma ACE concentrations following treatment with ACEI (Figures 2A and 3A and B). A possible reason for this finding is a mutation in the ACE of patient #6, which prevents conformational changes after binding ACEI. This would alter the extent of dimerization or prevent the dissociation of the putative ACE binding proteins/ACE effectors from ACE; both processes affect the rate of ACE shedding.
To investigate the possibility of conformational changes in the ACE of patient #6, we immunoprecipitated ACE from the serum of patient #6 with 16 different mAbs to different epitopes of human ACE and compared the ACE-binding pattern with the pattern from patients with “normal” response to ACEI. We call this pattern of ACE binding the “conformational fingerprint of ACE.” 53 The ability of each mAb to interact with and immunoprecipitate ACE is influenced by the ACE conformation, which can be influenced by changes of amino acid sequence induced by genetic mutations. We applied this approach to identify conformational changes in ACE due to several ACE mutations. 54 ∓59
The immunoprecipitation profiles of ACE from serum of patient #6 significantly differed from that of ACE from normal patients, especially by mAbs i1A8, 3G8, and 1B3 (Figure 4A). These data argue in a favor of an ACE mutation, which might be localized to the overlapping region of epitopes i1A8 and 3G8. 31 However, this pattern of ACE precipitation (Figure 4A) completely disappeared in the presence of ACEI E (Figure 4B). Data on ACE phenotyping of patient #6, presented in Figure 2B, demonstrated that amount of active form of prodrug E—enalaprilat—was comparable to that in patient #5. Therefore, the absence of blood ACE increase after treatment with ACEI in patient #6 at least could not be attributed to failure in intestinal prodrug absorption or in esterification by hepatic carboxylesterases. 60 However, the ability to be inhibited for ACE from patient #6 (reflected by kinetic ZPHL–HHL ratio—Figure 2C) was visibly lower than for ACE from patient #5. We suggest that binding of enalaprilat to ACE leads to the dissociation of a novel LMW ACE effector bilirubin and/or ACE-binding protein lysozyme (from human blood), which binds close to epitopes for these 2 mAbs 52 and eliminate the apparent conformational differences between ACE from patient #6 and ACE from other patients seen in Figure 4A. Therefore, possibility that the absence of blood ACE level increase after treatment with ACEI in patient #6 relates to mutation in putative LMW ACE effectors/ACE-binding proteins from human blood, rather than mutation in ACE itself. (Unfortunately, blood/tissue samples from patient #6 are not available anymore, and we could not find the actual genetic reason for such tolerance of ACE from patient #6 to ACEI treatment to fine structural details).

Conformational fingerprinting of serum angiotensin-converting enzyme (ACE) from patient #6. A, Serum samples from patient #6 and pooled serum from patients 3, 4, and 5 (as a representative of “normal” patients (ie, increasing blood ACE levels after treatment with ACE inhibitor [ACEI] treatment) before treatment were equilibrated to 5 mU/mL of the ACE activity (Hip-His-Leu [HHL] as a substrate). Then, precipitation of ACE activity by 16 monoclonal antibodies (mAbs) was quantified by plate precipitation assay. 53 Data are expressed as a ratio of ACE activity precipitation by mAbs from patient #6 to “normal” samples. B, The same analysis was performed on serum samples that were taken from the same patients but after treatment with ACEI. C, The same analysis was performed on serum samples from several pairs of sera from individuals with “normal” response to ACEI treatment. This ratio for any pair of samples with “normal” response was approximately 1.0 with no more than 10% of standard deviation (SD). The yellow-colored columns show those antibodies which binding to serum ACE from patient #6 was 20% lower (P < .05 than values for patients with “normal” response to ACEIs). The orange-colored columns show that antibodies that bind to serum ACE from patient #6 was 20% higher (P < .05 than for patients with “normal” response to ACEIs). Data are mean (SD) of 3 to 4 independent experiments (each in duplicates). *P < .05 in comparison to mean values for sera samples with “normal” response to ACEI treatment.
Hemodynamic Response to Chronic Treatment With E and ACE Phenotype
The main objective of this study was to investigate whether the interindividual variability in the response to ACEIs are explained by the “ACE phenotype,” for example, the plasma ACE concentration and the degree of ACE inhibition in each individual. The first objective was to determine whether initial levels of ACE were predictive of the BP response to ACEIs. This assumption is based on the simple law of mass action and the high variability in plasma ACE concentration between individuals, for example, a 3- to 4-fold range. 26,43 We hypothesized that the effect of ACE inhibition should be significantly higher in patients with low ACE (and low body weight) than in patients with high ACE (and high body weight) because ACE–drug ratio could reach 5- to 8-fold differences in some patients. Inverse correlation of the percentage of adherence and serum ACE activity in individual patients 61 strengthened our hypothesis. We also assumed that because blood ACE levels reflect tissue ACE expression, 62,63 measurement of plasma ACE should predict pressure response in a given individual.
We calculated a correlation between initial (pretreatment) blood ACE levels (eg, measured and total normalized to body weight) and all parameters characterizing BP drop in these 14 patients after chronic treatment with E or EC. Changes in BP were characterized as peak and trough drop in SBP (ΔSBP) and DBP (ΔDBP), expressed in mm Hg and percentage drop from initial measurement. The correlation for all 14 patients was found to be statistically significant, with an inverse correlations of initial ACE levels with trough ΔSBP for treatment (during 4 weeks) with 40 mg of E (Figure 5A). Patients treated with 20 mg of E and 16 mg of candesartan demonstrated the same trend in this correlation but did not reach statistical significance (Figure 5B). This inverse correlation of BP drop with an initial ACE levels corroborate with well-controlled studies, which observed that patients with DD genotype (ie, having high level of blood and tissue ACE) 62∓63 demonstrated a trend toward better response to ACEIs 19∓20 and reviewed in the study by Danser et al. 18

The initial angiotensin-converting enzyme (ACE) levels and blood pressure response to chronic ACE inhibition. The changes in the systolic blood pressure (through ΔSBP, mm Hg) as a function of the initial blood ACE levels presented in (A) and (B) for enalapril (E) and enalapril + candesartan (EC) groups, respectively.
The inverse relationship between plasma ACE and the BP response contradicts simple mass balance between a drug and its ligand. One possible explanation is that BP regulation in a given person is regulated by several systems. We can assume that in patients with very high ACE level (eg, 750 ng/mL), the proportion of BP homeostasis controlled via renin–angiotensin–aldosterone system (RAAS) will be significantly higher than in a patient with 250 ng/mL. In the former case, inhibition of the primary pressor-regulating system by ACEIs will lead to much greater drop in BP compared to a patient with low level of ACE (250 ng/mL), for example, where less proportion of BP regulation is controlled via RAAS.
Hemodynamic Response to Acute Treatment With E and ACE Phenotype
The results of chronic treatment arm confirmed a trend toward an association between initial plasma ACE levels and pressure-reducing effects of ACEIs. To understand this relationship over a shorter time period, we performed an acute study on ACEIs, where BP changes were monitored in 14 patients with hypertension each hour during 24 hours after intake of ACEI E with or without pretreatment with diuretic HCT.
Figure 6 demonstrates 3 types of acute BP responses to intake of E: good responders—as Pt. #1, intermediate responder—as Pt.#10, and nonresponder—as Pt. #5. On Figure 7A, we present the BP effects of E in all 20 patients, expressed as the drop in mean arterial pressure (MAP), and these are in good agreement with previously published responses to ACEIs. 10 ∓14 Responders and nonresponders are defined using an arbitrary threshold in the Gaussian distribution of BP response to drug treatment. 11 There are several approaches to define good responders, responders, and nonresponders described in above-mentioned publications. Regardless of the criteria, the aim of this threshold is to identify the subgroup of patients that do not respond to the drug. 11 The consequence of the existence of this subgroup of nonresponders, which may represent up to 30%, is that the assessment of drug effect, which includes nonresponders, may be misleading. 11,64
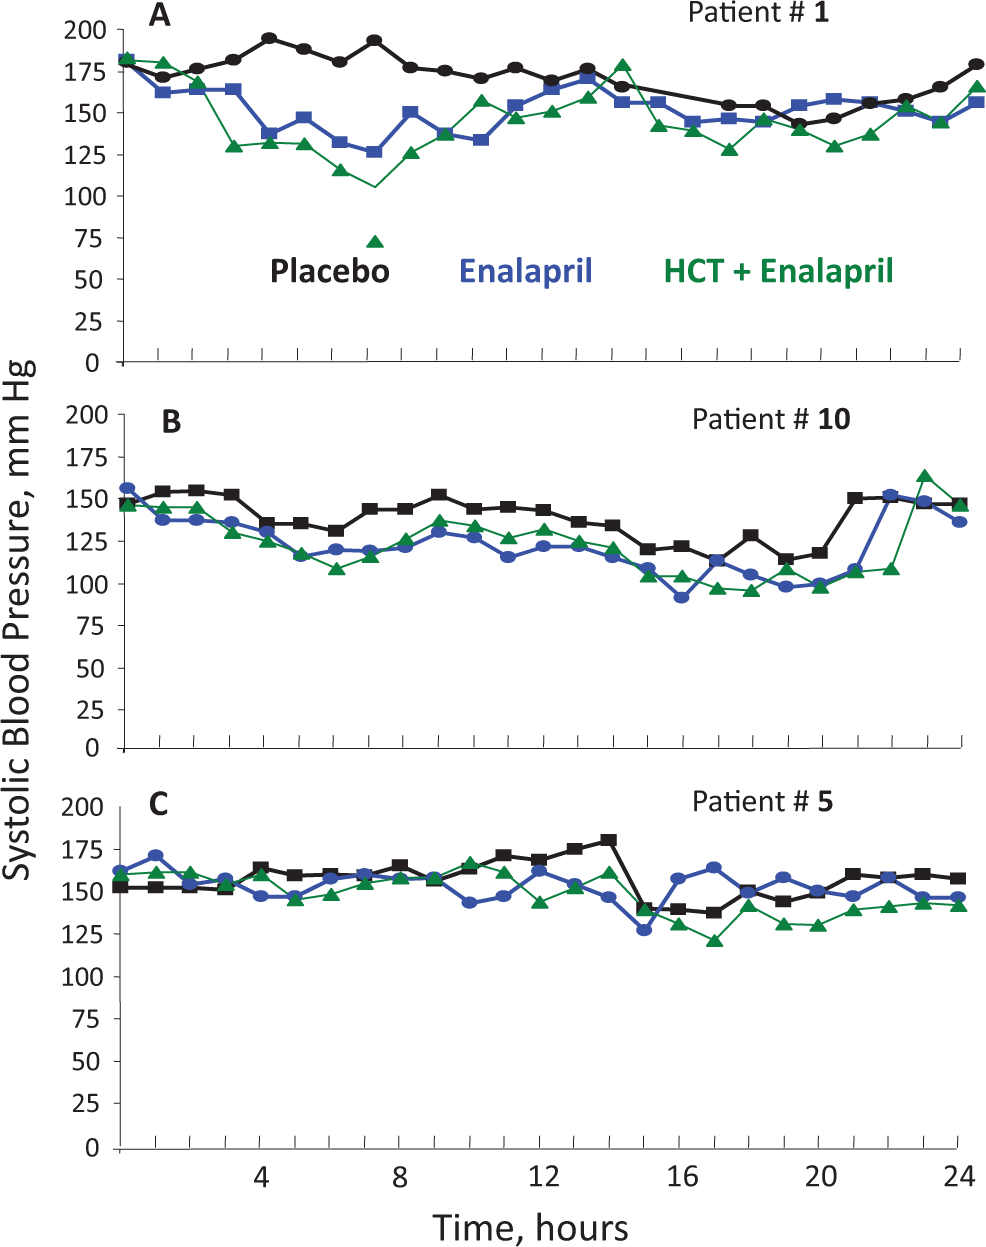
Blood pressure response to angiotensin-converting enzyme (ACE) inhibitor enalapril. Hourly systolic blood pressure profiles monitored in 3 patients representing good responders (A—patient #1), intermediate responders (B—patient #10), and nonresponders (C—patient #5) during acute treatment with placebo, enalapril, or enalapril after pretreatment with diuretic hydrochlorothiazide (HCT).

Blood pressure response and extent of angiotensin-converting enzyme (ACE) inhibition. A, The drop in mean arterial pressure (ΔMAP) after acute treatment with 20 mg of enalapril was expressed as percentage from the initial level. Values of this parameter for nonresponders, which were arbitrary defined as patients having drop in MAP less than 5% from initial, are highlighted in yellow. B, Correlation of systolic blood pressure drop (ΔSBP at peak between 1 and 6 hours after treatment and expressed as percentage from initial SBP) was calculated with drop in serum ACE activity at peak measured with Hip-His-Leu as a substrate. Coefficient of correlation of values in (A) and in (B) is −.736. The yellow-colored columns show patients in who blood pressure drop after enalapril treatment was lower than 5% of initial MAP (A) or patients whose correlation of ΔSBP with ΔACE (B) was statistically lower than mean correlation (0.74 ± 0.14) for responders from panel A.
For this particular study (Figure 7A), we arbitrarily choose a >5% reduction in mean artery pressure during the first 6 hours after treatment as the threshold for differentiating responders from nonresponders. With this definition, we identified 4 nonresponders or 20%, which correlated well with a previous study identifying 18% of individuals with >70% compliance to their ACEI administration plan. 61 We also found an inverse correlation of the SBP drop during first 6 hours with measurable ACE activity using HHL as a substrate (Figure 7B). For responders, this correlation was high −0.74 ± 0.14 (mean (SD), and the drop in MAP correlated well (r = −.74) with drop in SBP as a response to inhibition of ACE activity by E.
Figure 8 demonstrates another example of a more personalized analysis of BP response. Figure 8A shows initial MAP of 20 patients before taking ACEI, with threshold for hypertension, >140 mm Hg for SBP and >90 mm Hg for DBP, which will give threshold for MAP as 106 mm Hg. Figure 8B shows the maximal drop in MAP, expressed in percentage from initial MAP after E administration. The mean correlation of the maximal acute drop in MAP (induced by ACEI E alone or in combination with HCT) versus the initial BP at the time immediately before taking drug for whole group was between 0.179 and 0.362. However, when we divided the cohort into hypertensive (>140 SBP and >90 DBP) and normotensive, we found in most cases there were no correlation between drop in BP and initial BP for normotensive patients but much higher correlation for patients with hypertension. Further, when we excluded nonresponders (which we voluntarily refer as those who replied to drug by the drop in MAP less than 1/2 of the mean drop for cohort), we found that the correlation for patients with hypertension treated with E only was 0.88 and for normotensive 0.11. For patients treated with E and pretreated with diuretic, the corresponding values were 0.675 and 0.262.

Blood pressure monitoring and response to angiotensin-converting enzyme (ACE) inhibitors. A, Initial mean arterial pressure (MAP) before treatment. Values of this parameter, which were higher than 106.7 mm Hg, that correspond to higher than 140 mm Hg for SBP and higher than 90 mm Hg for diastolic blood pressure (DBP) and defined as patients with hypertension are highlighted with red. B, Maximal drop in MAP (ΔMAP) after enalapril treatment and expressed as percentage from initial MAP. The nonresponders, which we refer as those who responded to drug by a reduction in MAP less than 1/2 of the mean drop for cohort, are highlighted with yellow. The correlation of this parameter for patients with hypertension treated with enalapril with initial MAP was 0.88 and for normotensive was 0.11. C, Effect of pretreatment with diuretic hydrochlorothiazide on blood pressure response (ΔMAP). Patients with significantly (>20%) increased blood pressure to enalapril are highlighted with red. Patients with decreased blood pressure response to enalapril after pretreatment with diuretic are highlighted with yellow.
Figure 8C demonstrates an effect of pretreatment with diuretics on the acute BP response to E. As mentioned previously, an effect of diuretics showed a large interindividual variability. 65 In our study, 8 patients (∼40%) responded to addition of the diuretics to E, by an increase in the maximal BP reduction; 4 (∼20%) patients had a reduced decreased in BP response to E if they were pretreated with diuretic; in 7 (∼37%) patients, pretreatment with diuretic had no effects on BP response to E.
ACE Phenotyping in Patients During Acute Treatment With ACEI
We performed complete ACE phenotyping in all 20 patients enrolled in the acute study. The initial level of ACE activity and amount of immunoreactive ACE protein correlated with BP drop in these patients, when measured by different approaches, for example, drop in SBP, DBP, and MAP at peak and trough and after correction for placebo effect. When the correlation was performed for the entire group, we did not find a statistically significant correlation. However, when we excluded nonresponders (see Figure 7A), the correlation coefficient of initial blood ACE activity with ΔSBP at peak (% from an initial) improved from 0.081 to 0.334 (Figure 9). Such a relationship (albeit not reaching statistical significance, due to small number of patients) was opposite to the situation in chronic study, where a trend toward better response to ACEIs was found for patients with higher ACE levels. This result demonstrates that in the acute situation, BP response, or in chronic situation, when other effects were used as an end point, for example, out effects of ACE inhibition on albuminuria, 66 drop in ACE activity, or Fb level, 67 patients with low plasma ACE levels have a greater benefit from ACEI therapy, in accordance to the general principle of mass action. However, in the case of chronic treatment, an inverse correlation was noted, which can be explained by the hypothesis mentioned earlier.

The initial angiotensin-converting enzyme (ACE) levels and blood pressure response to acute ACE inhibition. The changes in the systolic blood pressure (peak ΔSBP, % from initial) as a function of the initial blood ACE levels presented in (A) and (B) for enalapril (E) and E + hydrochlorothiazide (HCT) groups, respectively.
In the chronic study arm, we found high interindividual variability in ACE concentrations supporting previous reports. 26,43 Patient #8 had increased concentration of ACE likely due to following reasons: (1) elevated ACE expression due to hyperthyroidism, glucocorticoid abnormalities, or treatment 68 or genetics; (2) extrapulmonary sarcoidosis and hidden sarcoidosis 53 ; (3) elevated ACE shedding due to (a) unknown mutations in ACE because known mutations in ACE lead to 5- to 14-fold of blood ACE levels increase 55 ∓57,69 and (b) mutations in as of yet characterized ACE secretase.
The analysis of ACE phenotype in each patient provides some insight toward understanding the reasons for low response to ACE inhibition among the nonresponders, as revealed in Figure 7A. Thus, the reason for nonresponding in patient #5 is different than in patients #14, 17, and 20 because in this patient, the effect of E or E + D on the extent of ACE inhibition (reflected by an increase of ZPHL–HHL ratio) do not exceed 300% during the peak, whereas for other nonresponders—#14,17, and 20—and in responders both E and E + D has much higher and similar effects on ACE inhibition (reflected by an increase of ZPHL–HHL ratio of 400% to 500% (data not shown). We can speculate that patient #5 has conformationally altered ACE that was not so sensitive to E. We have reported a subpopulation of patients, based on ACE-phenotyping, who have end-stage renal disease and responded less to ACE inhibition. 70
As we have already mentioned, there is a very significant correlation between the drop in BP and the drop in ACE activity after treatment with ACEI (Figure 7B); this correlation is approximately 0.750 (from 0.645 to 0.957). A novel finding is that this correlation is higher with substrate ZPHL; this finding makes sense because ZPHL is cleaved equally by N and C domain center, 30 in contrast to substrate HHL that is cleaved by C domain active center 9 times faster than by N domain active center. 37 Interestingly, this correlation was significantly lower for patient #8 (who had significantly elevated level of ACE), which gives additional argument for mass action principle in ACE inhibition or that patient #8 who may have unknown mutations in ACE or in the hypothetical ACE-binding protein, which relates to abnormal ACE shedding in this patient.
The level of serum ACE protein, measured by precipitation of ACE by mAb 9B9, did not increased after acute E administration; this is a sharp contrast to the situation with chronic inhibition (Figure 3), where 13 of 14 patients demonstrated approximately +40% increase in blood ACE (Figure 3). The pattern of the increase in precipitation of ACE activity by mAb 1G12 after E treatment is similar to patterns of increase in ZPHL–HHL ratio but should correlate with drop in BP less than ZPHL–HHL ratio (due to “saturation of the effect”). Nevertheless, even with this limitation, we think that such approach gives information that could be considered “personalized medicine”: (1) 2 nonresponders, patient #5 and #14, had the lowest ACE activity and initial 1G12 binding; (2) 2 patients had the highest noncorrespondence of 1G12 binding and ACE activity, that is, who has conformational changes in ACE before ACE inhibition has the lowest response in 1G12 binding after ACE inhibition (not shown). These results show that ACE phenotyping can help with clarification of the reasons for aberrant pressure response in a given patient.
Conclusion
Among responders, there was a trend toward better response to ACEIs in patients with higher plasma ACE concentrations in the chronic study arm with ACEIs and an inverse trend in the acute treatment arm. Due to the fact that up to 20% of patients do not respond to ACEIs by an effective drop in BP, determination of initial blood ACE levels do not allow a valid prediction regarding the BP response in an individual patient. However, ACE phenotyping before treatment, and especially, during treatment with ACEIs, provides important information about conformational changes in blood ACE levels in individual patients as a possible explanation for tolerance to ACEIs, that is, nonadherence in some nonresponders. In addition, ACE phenotyping allows us to easily and objectively identify those patients who actually took ACEIs, regardless of their self-reporting of medication compliance.
Footnotes
Acknowledgments
The authors thank Dr Jan Danser and Dr Anton van der Meiracker (Rotterdam University, the Netherlands) for providing samples for analysis and intensive and useful discussion of the results. The authors also wish to thank Joyce E.M. Schilders (Rotterdam University, the Netherlands) and Gouri Dharmavaram (University of Illinois at Chicago, Chicago, IL) for technical assistance.
Author contributions
Danilov contributed to conception and design, acquisition, analysis, and interpretation, drafted manuscript, critically revised manuscript, and gave final approval. Tovsky contributed to acquisition. Scwartz and Dull contributed to analysis and interpretation and critically revised manuscript.
Declaration of Conflicting Interests
The authors declared no potential conflicts of interest with respect to the research, authorship, and/or publication of this article.
Funding
The authors received no financial support for the research, authorship, and/or publication of this article.