
Abstract
Background:
Diabetes mellitus induces life-threatening cardiovascular complications such as cardiac autonomic neuropathy and ventricular dysfunction and is associated with hypomagnesemia. In this study, we investigated the short-term effects of magnesium (Mg2+) treatment on streptozotocin (STZ)-induced diabetic cardiac complications.
Methods:
Adult Wistar rats were treated once with STZ (50 mg/kg, intraperitoneally [ip]) or vehicle (citrate) and then daily for 7 days with MgSO4 (270 mg/kg, ip) or saline. On the eighth day, in vivo tail-pulse plethysmography was recorded for heart rate variability (HRV) analysis, and ex vivo Langendorff-based left ventricular (LV) pressure–volume parameters were measured using an intraventricular balloon. Measurements of plasma lipid and Mg2+ levels as well as blood glucose and cardiac tissue Mg2+ levels were also performed.
Results:
Treatment with Mg2+ prevented diabetes-induced alterations in the standard deviation of the averages of normal-to-normal (NN) intervals (SDANN), root mean square differences of successive NN intervals (RMSSD), heart rate, and low-frequency (LF) power–high-frequency (HF) power ratio. In addition, Mg2+ restored orthostatic stress-induced changes in SDANN, RMSSD, and LF–HF ratio in diabetic rats. In isolated hearts, Mg2+ reversed the diabetes-induced decrease in LV end-diastolic elastance and the right shift of end-diastolic equilibrium volume intercept, without altering LV-developed pressure or end-systolic elastance. However, Mg2+ did not prevent the elevation in blood glucose, total cholesterol, and triglycerides or the decrease in high-density lipoprotein cholesterol in diabetes. Plasma- or cardiac tissue Mg2+ was not different among the treatment groups.
Conclusion:
These results suggest that Mg2+ treatment may attenuate diabetes-induced reduction in HRV and improve LV diastolic distensibility, without preventing hyperglycemia and dyslipidemia. Thus, Mg2+ may have a modulatory role in the early stages of diabetic cardiovascular complications.
Introduction
Diabetes mellitus is a major health-economic burden worldwide 1 and has a high mortality rate mainly due to its cardiovascular complications. 2 Diabetic cardiovascular complications account for almost half of diabetic complications and include cardiomyopathy, arrhythmias, and vasculopathies like coronary artery diseases. 2 Such complications occur through pathological, structural, and electrical remodeling of the heart as well as through proatherosclerotic changes in blood vessels. 3 In addition, diabetes induces cardiac autonomic neuropathy, which manifests as impaired hemodynamic responses to stress and reduced heart rate variability (HRV), an independent risk factor for fatal myocardial infarction. 4 Although the onset of such complications may occur insidiously in asymptomatic patients, 5 the overall diabetic prognosis worsens once the complications become established, hence the importance of early intervention. Unfortunately, there is still a lack of effective treatment options to prevent or modulate the onset of cardiovascular complications.
Diabetes is associated with several electrolyte disturbances such as those involving sodium, magnesium (Mg2+), and potassium. 6 Among these disturbances, hypomagnesemia is common in diabetes 7,8 and is an independent cardiovascular risk factor. 9 In addition, hypomagnesemia in diabetes has been linked to atherosclerosis 10 and arrhythmogenesis. 11 Conversely, insulin deficiency in diabetes disrupts cardiac Mg2+ homeostasis. 12 Mg2+ is an essential cofactor for several enzymes involved in cellular metabolic processes and has beneficial effects in diabetes by improving insulin sensitivity and metabolic control. 13 Extracellular Mg2+ also minimizes cromakalim-induced arrhythmias during ischemia–reperfusion injury in diabetic hearts, 14 but the effects of Mg2+ on the onset and nature of diabetic cardiovascular complications are not fully understood. In this study, we therefore investigated the short-term effects of Mg2+ treatment on cardiac autonomic neuropathy and ventricular dysfunction in a streptozotocin (STZ)-induced diabetic rat model. Furthermore, in order to infer the possible underlying mechanisms, we evaluated changes in Mg2+ levels and metabolic markers such as glucose and lipids.
Materials and Methods
Animals
The study was approved by the Faculty of Health Sciences Animal Research Ethics Committee of the University of Cape Town and was performed in compliance with the Guide for the Care and Use of Laboratory Animals. Adult male Wistar rats (250-300 g) were obtained from the University of Stellenbosch Animal Unit and housed in an animal facility at the University of Cape Town under standardized conditions (12-hour light–dark cycle and temperature of ∼23°C) and had free access to food and water.
Treatment Protocols
Streptozotocin (dissolved in 0.1 mmol/L citrate buffer, pH 4.5) was used to induce diabetes mellitus, whereas MgSO4 (dissolved in physiological saline) was used for Mg2+ treatment. Streptozotocin has cytotoxic effects on insulin-secreting pancreatic β cells, and, at moderate doses (such as 50 mg/kg), it induces nonketotic diabetes in rats. 15 Seventy-one rats were randomly divided into 4 treatment groups (Figure 1A), and each rat was identified by a code. One subset of rats (n = 9-10 per group) was used to study HRV and cardiac ventricular function, whereas the other subset (n = 7-12 per group) was used for biochemical assays. An additional 33 rats (n = 7-10 per group) were used for cardiac tissue Mg2+ assays. On the first day of treatment, rats were fasted for 6 hours prior to intraperitoneal (ip) drug/vehicle injections. The STZ group was injected with a single dose of STZ 50 mg/kg on the first day and with saline daily for 7 consecutive days. The STZ solution was prepared on the day of treatment. The STZ + Mg2+ group was injected with a single dose of STZ 50 mg/kg on the first day and with MgSO4 270 mg/kg daily for 7 days. 16,17 The Mg2+ group was injected with a single dose of citrate buffer on the first day and with MgSO4 270 mg/kg daily for 7 days. The control group was injected with a single dose of citrate buffer on the first day and with saline daily for 7 days. Tail-prick blood samples were taken for measurements of blood glucose using a glucometer (Accu-Chek, Roche, South Africa), which was validated by comparison with blood glucose measurements performed on a Cholestech LDX system (Alere Healthcare, South Africa). A random blood glucose level (measured in nonfasted rats) ≥15 mmol/L was taken to indicate diabetes mellitus.

Treatment protocols and general parameters. A, In vivo treatment protocols for different groups of rats (control, streptozotocin [STZ], STZ + Mg2+ [STZ + Mg], and Mg2+ [Mg]). B, Daily random blood sugar concentrations. C, Body weight. Values are mean ± standard error of the mean (SEM); n = 16-22 per group; *P < .05 versus control; # P < .05 versus STZ.
In Vivo HRV Measurements
On day 8, HRV measurements were made using pulse plethysmography. 18 The rats were initially familiarized with the HRV recording process for 5 days. The HRV parameters were recorded on awake rats placed in a rodent restrainer in a quiet, temperature-regulated environment (∼23°C). Pulse plethysmography was recorded with a piezoelectric pulse transducer (TN1012, ADInstruments, Australia) placed over the ventral artery at the base of the tail. Measurements were first done in the horizontal position for 5 minutes, before orthostatic stress was induced by tilting the restrainer (70° angle head-up), 19 and recording for another 5 minutes. The HRV parameters were recorded using the PowerLab data acquisition system via LabChart 7 software (ADInstruments, Australia) and analyzed using the LabChart Pro HRV Analysis Module (ADInstruments, Australia). Ectopic beats and artifacts were manually excluded in the LabChart “Beat Classifier” view. The indices of HRV that were quantified included time domain parameters such as the standard deviation of the averages of normal-to-normal (NN) intervals (SDANN) and root mean square differences of successive NN intervals (RMSSD) as well as frequency domain parameters such as low-frequency (LF) power (0.2-0.8 Hz), high-frequency (HF) power (0.8-2.8 Hz), and LF–HF ratio.
Heart Isolation and Langendorff Perfusion
For ex vivo experiments, hearts were harvested and perfused as described previously. 16 Briefly, rats were anticoagulated with heparin (500 IU/kg, ip) and anesthetized with sodium pentobarbital (60 mg/kg, ip). Hearts were rapidly extracted and placed in cold, filtered, modified Krebs Henseleit (K-H) perfusate containing (in mmol/L) 118.5 NaCl, 4.7 KCl, 25 NaHCO3, 1.2 MgSO4, 1.8 CaCl2, 1.2 KH2PO4, and 11 glucose (pH 7.4). The aorta was immediately cannulated, and hearts were retrogradely perfused with the K-H solution on a constant pressure (74 mm Hg) Langendorff apparatus while suspended in a temperature-regulated organ chamber. Hearts were excluded if there were technical problems or delays (>3 minutes) during cannulation. The perfusate was gassed with carbogen (95% O2 and 5% CO2) and maintained at 37°C. Blood collected during heart excision was centrifuged to obtain plasma, which was stored at −80°C for assays performed later.
Ventricular Pressure–Volume Measurements
Left ventricular (LV) pressure was measured using an intraventricular balloon inserted through the left atrial appendage and mitral valve. The balloon was mounted at the tip of a catheter connected to a pressure transducer (MLT1199) and amplifier (Bridge Amp ML221, ADInstruments, Australia). After 20 minutes of stabilization, pressure–volume responses were assessed as described previously by Kameyama et al. 20 Briefly, incremental volumes (10 µL at a time) of bubble-free, distilled water were injected into the intraventricular balloon (starting from an empty balloon) using a Hamilton syringe (Sigma-Aldrich, South Africa). The heart was left to equilibrate at a given balloon volume for 3 minutes before the volume was changed. The maximum LV end-diastolic pressure (LVEDP) was limited to ∼30 mm Hg in order to avoid overdistension of the ventricle as was determined in preliminary experiments.
Hemodynamic parameters were recorded using the PowerLab data acquisition system via the LabChart 7 software (ADInstruments) and analyzed using the LabChart 7 Pro BP module (ADInstruments). The end-diastolic equilibrium volume intercept was read off as the balloon volume at an LVEDP of 0 mm Hg. The LV-developed pressure (LVDP) was calculated as the difference between LV end-systolic pressure (ESP) and LVEDP. The end-diastolic elastance was derived as the gradient of EDP–volume relationship, whereas end-systolic elastance was the gradient of ESP–volume relationship.
Lipid Profile Assays
The plasma concentrations of total cholesterol (TC), triglycerides (TG), and high-density lipoprotein cholesterol (HDL-C) were measured using colorimetric assays (Wako Chemicals GmbH, Germany). Both TC and TG were measured directly from plasma, whereas HDL-C was first separated from the other TC components (low- and very low-density lipoprotein cholesterol) by precipitation of apoB-associated lipoproteins using the sodium heparin sulfate–manganese chloride precipitation assay. 21 In each case, the final lipid concentration was measured by spectrophotometry (SpectraMax, Labotec, South Africa) as proportional to the absorbance of the pigment formed by the reaction between the chromogen dimethoxyaniline sodium salt (DAOS) and the hydrogen peroxide produced in the reactions described subsequently.
Total cholesterol and HDL-C were determined by a cholesterol oxidase-DAOS enzymatic reaction colorimetric assay (Wako Chemicals GmbH) as described by Allain et al. 22 In this assay, free cholesterol, formed from the decomposition of cholesterol esters by cholesterol esterase, was oxidized by cholesterol oxidase to produce hydrogen peroxide. Triglyceride was determined by glycerol-3-phosphate oxidase (GPO)-DAOS enzymatic reaction colorimetric assay (Wako Chemicals GmbH). In this assay, glycerol, formed from the hydrolysis of TG by lipoprotein lipase, was converted to glycerol-3-phosphate (G3P) by glycerol-kinase. The G3P was then oxidized by GPO to produce hydrogen peroxide.
Cardiac Tissue and Plasma Mg2+ Measurements
Ventricular tissue (0.1 g) was minced on ice in distilled water (1 mL) and sonicated (Soniprep, MSE, United Kingdom) twice for 15 seconds and cooled for 5 minutes between each round. Samples were then centrifuged at 10 000× g for 10 minutes, and the supernatant was collected for Mg2+ assay. Plasma Mg2+ was measured from samples obtained on the eighth day, 24 hours after the final MgSO4 or equivalent saline injection. Ionized Mg2+ concentration was measured using automated photometric assays (Beckman AU, PathCare, South Africa).
Chemicals and Reagents
Sodium pentobarbitone was purchased from Kyron Laboratories (Johannesburg, South Africa). All other drugs and chemicals were obtained from Sigma (Sigma-Aldrich, South Africa).
Data Analysis
Data are expressed as mean and standard error of the mean (SEM), with n indicating the number of rats studied under each condition. Statistical analysis was conducted using Prism 5 (GraphPad). Differences among multiple groups for data with normal distribution (Kolmogorov-Smirnov and Shapiro-Wilk normality tests) were evaluated using 1-way analysis of variance (ANOVA), followed by Tukey post hoc test. For data without normal distribution, a Kruskal-Wallis test was conducted followed by Dunn post hoc test. Serial measurements were compared using repeated measures ANOVA. Comparison of HRV data between the horizontal- and head-up tilt positions was carried out using paired t test. A 2-tailed P ≤ .05 was considered statistically significant.
Results
General Parameters
Streptozotocin induced a significant elevation in blood glucose concentration (Figure 1B) as well as decreased body weight (Figure 1C), starting from 2 to 3 days posttreatment (P < .05, STZ vs control). Treatment with Mg2+ did not prevent STZ-induced hyperglycemia (P > .05, STZ + Mg2+ vs STZ) but significantly minimized the STZ-induced loss in body weight (P < .05, STZ + Mg2+ vs STZ; Figure 1C). Mg2+ alone had no significant effect on blood glucose or body weight compared to control rats (P > .05, Mg2+ vs control; Figure 1B and C). The plasma Mg2+ concentrations measured on the eighth day were not significantly different among the treatment groups (plasma Mg2+ in mmol/L: 0.91 ± 0.05 for control, 1.04 ± 0.03 for STZ, 1.08 ± 0.05 for STZ + Mg2+, and 0.95 ± 0.04 for Mg2+; P > .05, n = 5-6 per group). There were also no statistically significant differences in the ventricular tissue Mg2+ levels (tissue Mg2+ in mmol/g: 0.62 ± 0.04 for control, 0.57 ± 0.01 for STZ, 0.62 ± 0.02 for STZ + Mg2+, and 0.65 ± 0.01 for Mg2+, P = .07, n = 7-10 per group).
Effects of Treatments on HRV Parameters
Streptozotocin significantly decreased the time domain HRV parameters RMSSD and SDANN compared to control (P < .01), and these STZ-induced effects were prevented by treatment with Mg2+ (P < .05, STZ + Mg2+ vs STZ; Figure 2A and B). Treatment with Mg2+ alone had no significant effect on RMSSD or SDANN compared to control.
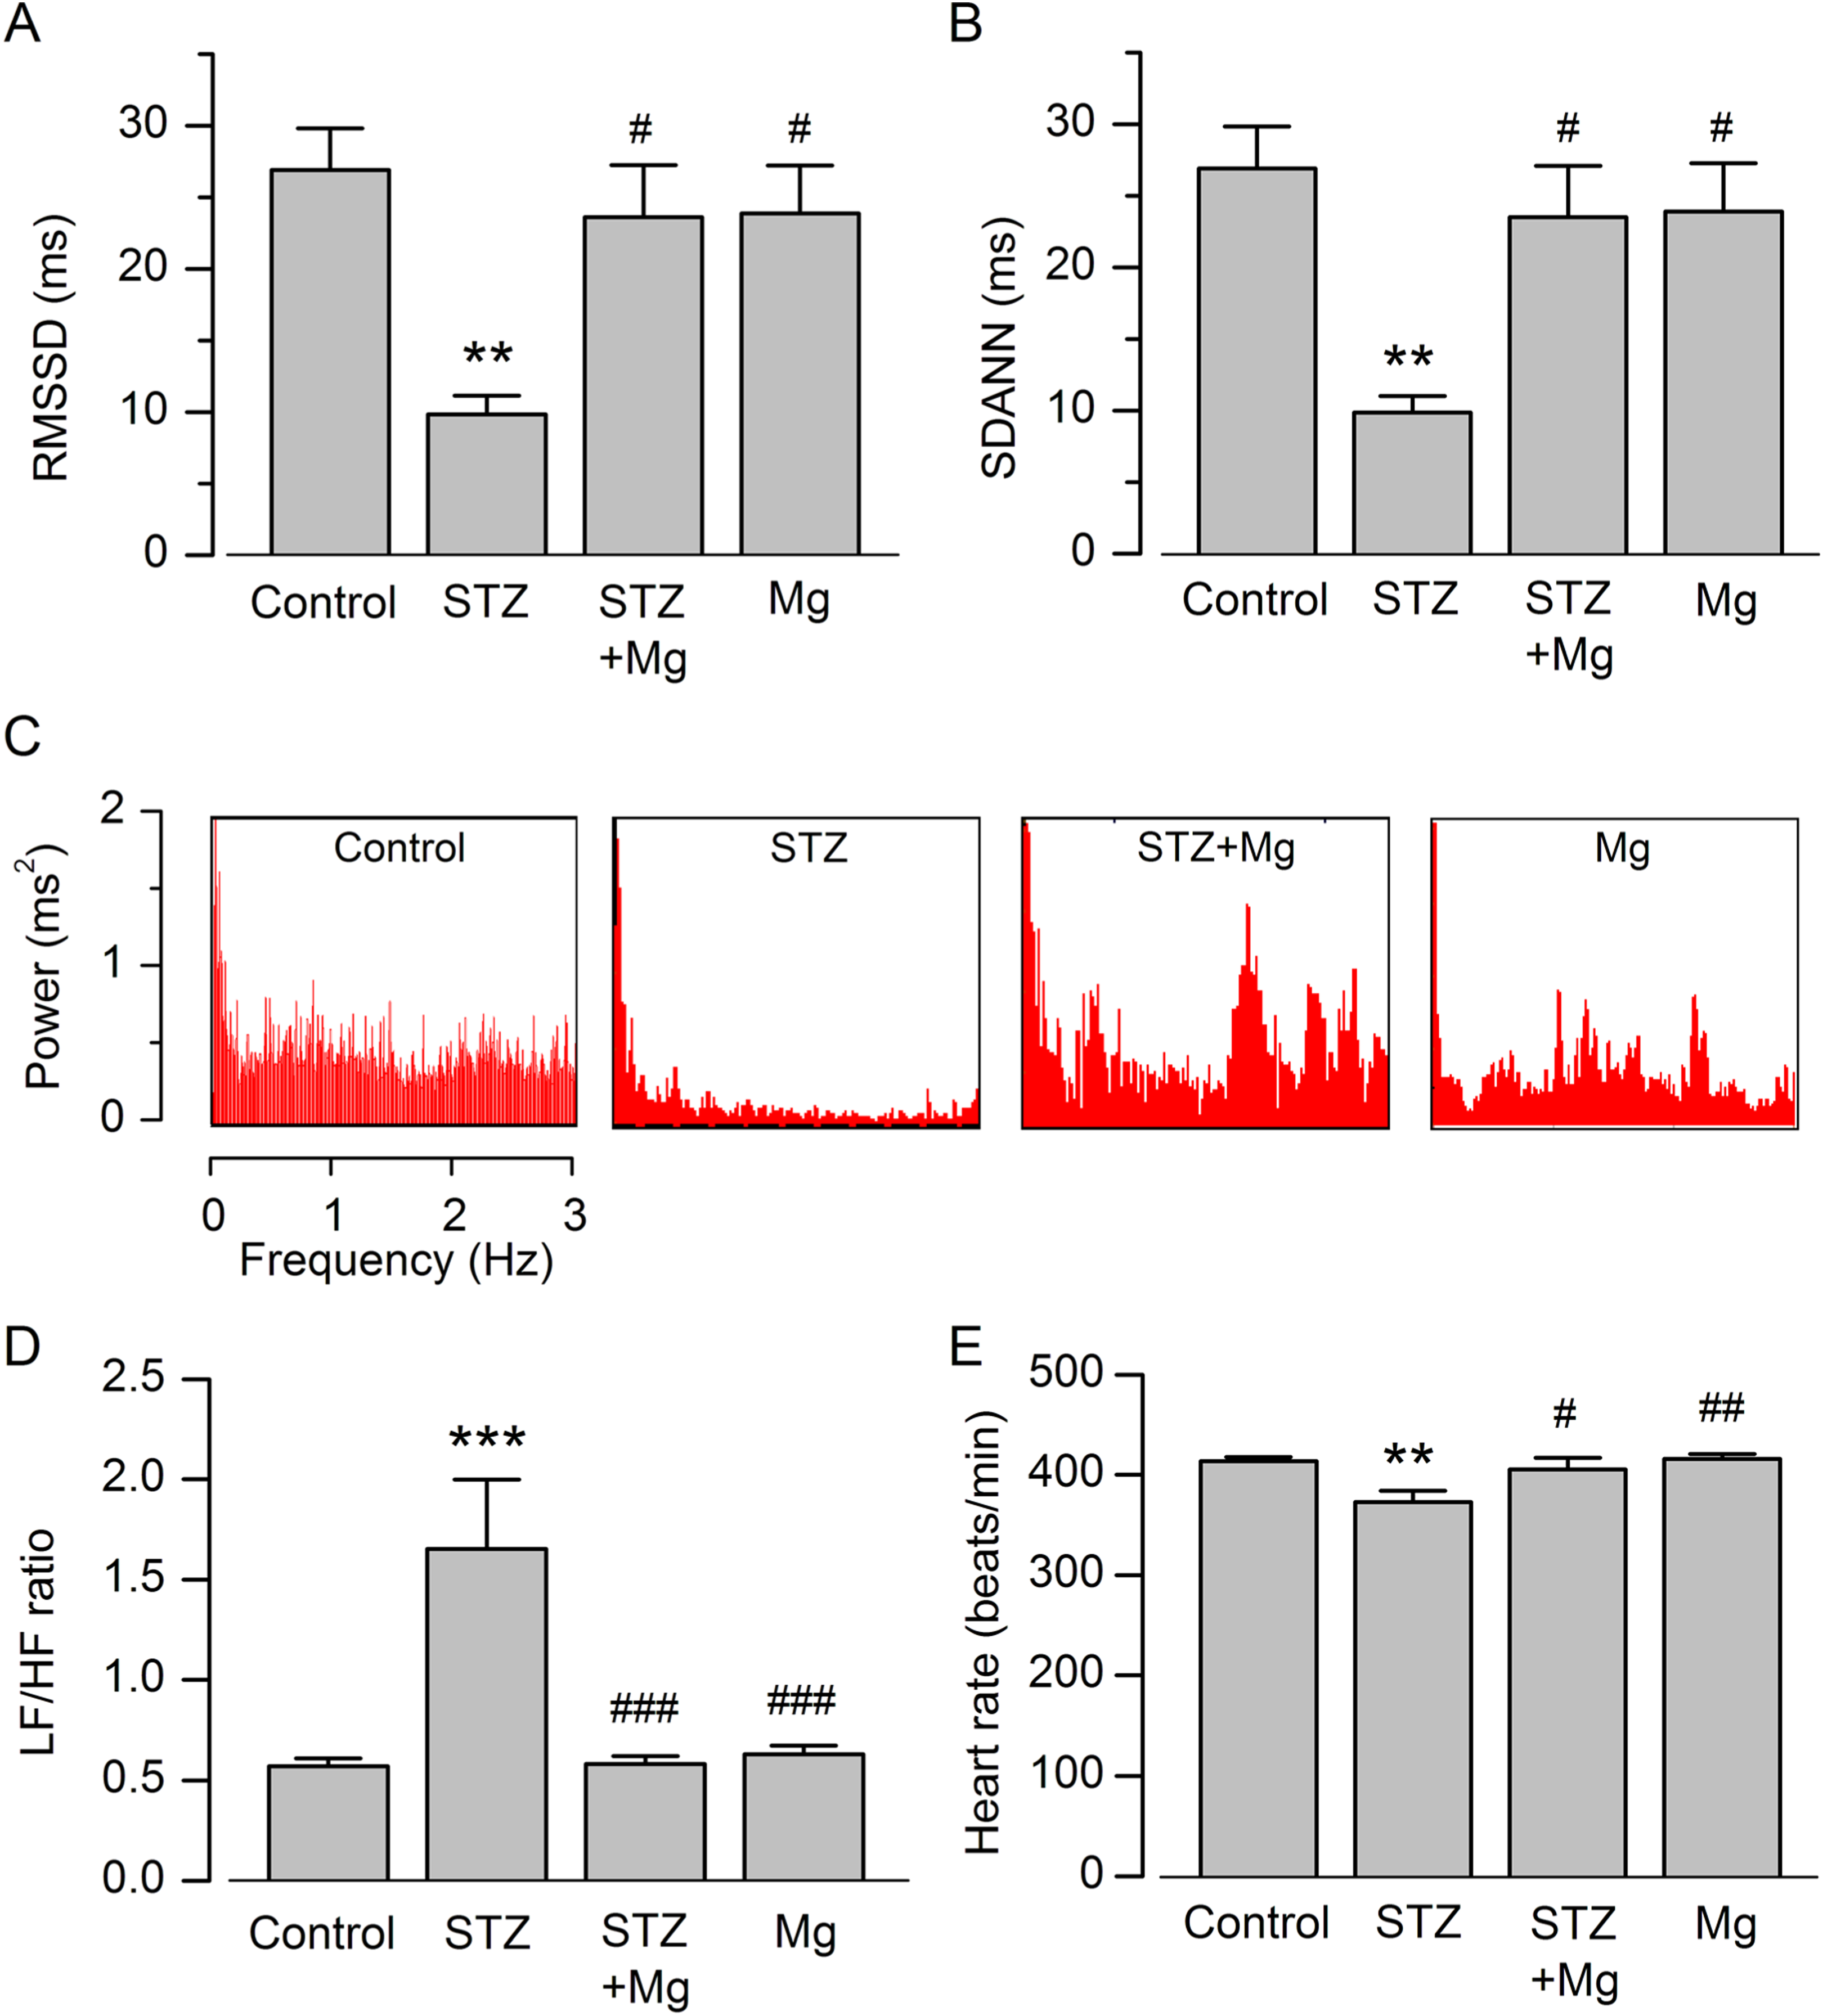
Effects of STZ and Mg2+ on heart rate variability (HRV) parameters. A and B, Summary data of root mean square differences in successive normal-to-normal (NN) intervals (RMSSD) and standard deviation of the averages of NN intervals (SDANN). C, Screenshot images of frequency power spectra. D, Ratios of low-frequency (LF) power to high-frequency (HF) power. E, Heart rate measurements. Values are mean ± standard error of the mean (SEM); n = 9-10 per group; **P < .01, ***P < .001 versus control; # P < .05, ## P < .01, ### P < .001 versus streptozotocin (STZ).
Representative screenshot images of the frequency power spectra (Figure 2C) highlight a decrease in power (especially HF power) in STZ-treated rats compared to the others. Streptozotocin significantly increased the LF–HF ratio compared to control (P < .001; Figure 2D). Treatment with Mg2+ prevented the STZ-induced increase in LF–HF ratio (P < .001, STZ + Mg2+ vs STZ). Treatment with Mg2+ alone had no significant effect on LF–HF ratio compared to control (P > .05). Streptozotocin also significantly decreased heart rate compared to control, and this effect of STZ was reversed by cotreatment with Mg2+ (Figure 2E). Treatment with Mg2+ treatment had no significant effect on heart rate compared to control.
Effects of Treatments on HRV Response to Orthostatic Stress
The responses of HRV parameters to orthostatic stress (Figure 3) showed that, in control rats, a change in body position from horizontal to head-up tilt resulted in a significant decrease in RMSSD and SDANN (P < .001) as well as a significant increase in LF–HF ratio (P < .01). In contrast, STZ-treated rats did not show a significant change in RMSSD, SDANN, or LF–HF ratio in response to head-up tilt position (P > .05, head-up vs horizontal position). Mg2+ cotreatment with STZ restored the head-up tilt-induced decrease in RMSSD and SDANN as well as the increase in LF–HF ratio (P < .001, head-up vs horizontal position in STZ + Mg2+ rats). Rats treated with Mg2+ alone showed responses to orthostatic stress that were similar to those in control rats (P < .05, head-up vs horizontal position in Mg2+ rats).

Effects of orthostatic stress on HRV parameters. A-C, Data of RMSSD, SDANN, and LF–HF ratios, measured from rats in the horizontal position (gray columns), followed by head-up tilt position (black columns). Values are mean ± SEM; n = 9-10 per group; *P < .05, **P < .01, and ***P < .001. HRV indicates heart rate variability; RMSSD, root mean square differences; SDANN, standard deviation of the averages of normal-to-normal intervals; LF/HF, low frequency to high frequency; SEM, standard error of the mean.
Ventricular Pressure–Volume Response
Representative LV pressure tracings recorded at the same ventricular filling volume (Figure 4A) show that the STZ-treated heart had a lower LVEDP compared to the others. The STZ treatment induced a right shift of LVEDP–volume relationship compared to control hearts (Figure 4B). Mg2+ treatment reversed the shift of LVEDP–volume relationship in STZ-treated rats by decreasing the end-diastolic equilibrium volume intercept from 49 ± 6 μL to 25 ± 5 μL (P = .014; Figure 4B). A similar pattern of results was obtained when the equilibrium volume intercept was normalized to heart weight (normalized equilibrium volume in μL/g: 16.9 ± 2.5 for control, 30.4 ± 3.6 for STZ, 16.1 ± 3.1 for STZ + Mg2+, and 13.8 ± 3.7 for Mg2+; n = 6-7 per group). Mg2+ also reversed the STZ-induced decrease in end-diastolic elastance (P < .05, STZ + Mg2+ vs STZ; Figure 4C), with similar results obtained when the end-diastolic elastance was normalized to heart weight. Mg2+ treatment alone had no significant effect on equilibrium volume intercept or end-diastolic elastance compared to control (Figure 4B and C). The LVDP–volume relationship and end-systolic elastance were not significantly different among the treatment groups (P > .05; Figure 4D and E).

Effects of treatments on left ventricular pressure–volume characteristics. A, Representative ventricular pressure tracings recorded at an intraventricular balloon volume of 70 µL. Note the relatively lower diastolic pressure in the STZ-treated heart compared to the others. B and D, Left ventricular (LV) end-diastolic pressure (LVEDP)–volume relationship and LV developed pressure (LVDP)–volume relationship in different treatment groups. Inset in B, End-diastolic equilibrium volume intercept. C and E, End-diastolic elastance and end-systolic elastance. Values are mean ± SEM; n = 6-7 per group; *P < .05 versus control; # P < .05 versus STZ. STZ indicates streptozotocin; SEM, standard error of the mean.
Lipid Profile Parameters
The plasma concentrations of TC and TG in STZ-treated rats were significantly elevated compared to those in control rats whereas that of HDL-C was significantly decreased (P < .05, STZ vs control; Figure 5A–C). However, Mg2+ treatment had no significant effect on these STZ-induced changes in plasma lipids (P > .05, STZ + Mg2+ vs STZ). Mg2+ treatment alone had no significant effect on the baseline lipid profile (P > .05, Mg2+ vs control).
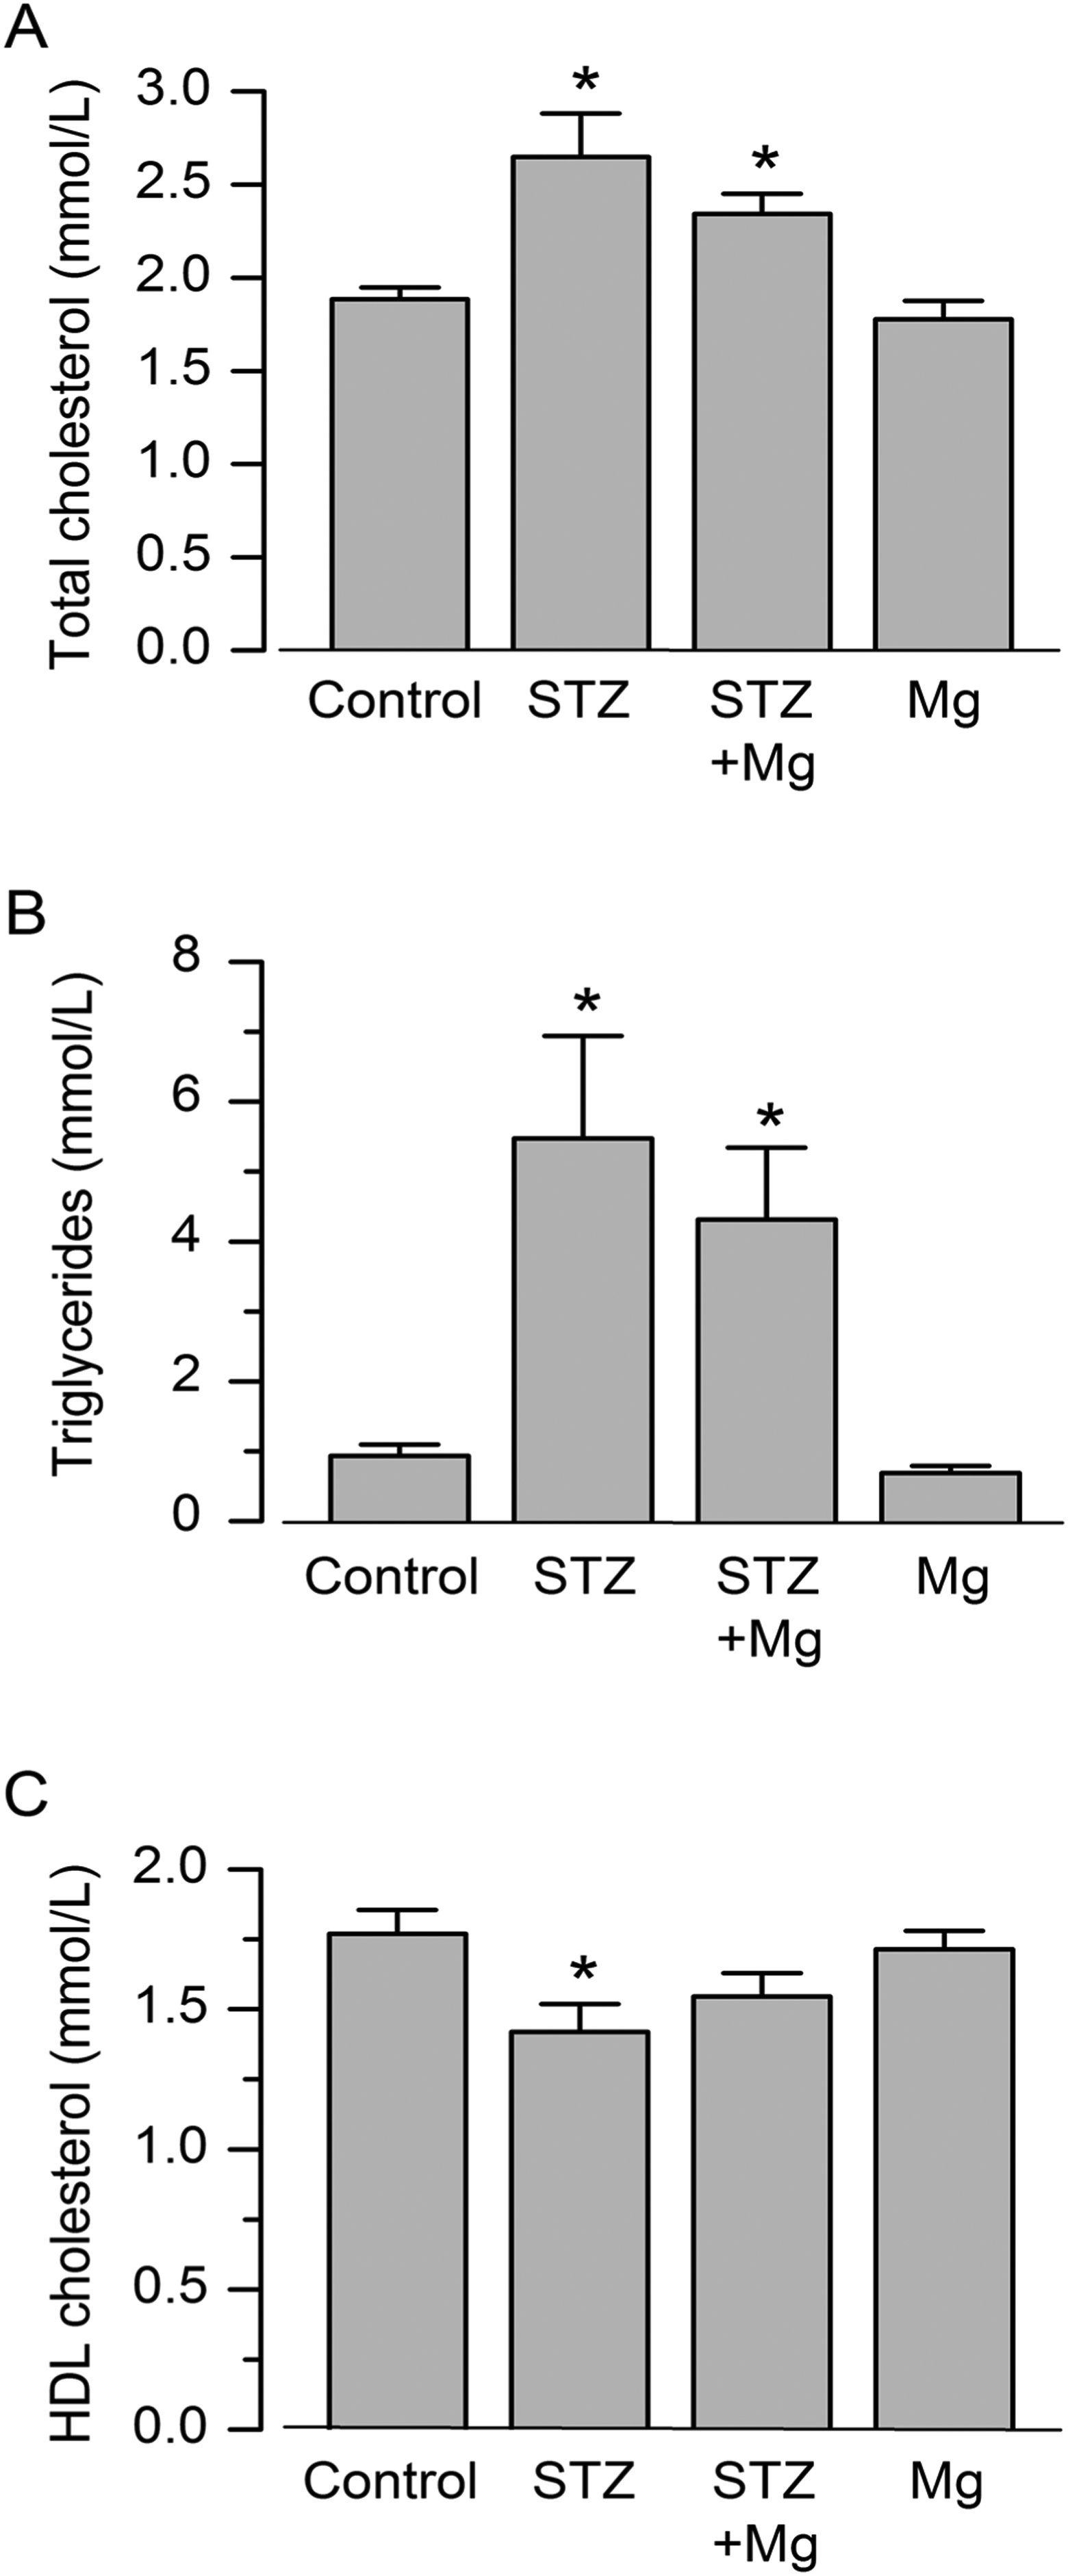
Effects of various treatments on the plasma lipid profile. A-C, Plasma concentrations of total cholesterol, triglycerides, and high-density lipoprotein (HDL) cholesterol, measured on day 8 in the different treatment groups. Values are mean ± SEM; n = 7-12 per group; *P < .05 versus control. SEM indicates standard error of the mean.
Discussion
In this study, we demonstrated that, even in the short term, diabetes induces abnormal HRV and ventricular diastolic dysfunction. These cardiovascular complications of diabetes were attenuated by Mg2+ treatment. However, Mg2+ did not prevent hyperglycemia and dyslipidemia in diabetes.
The STZ-induced diabetic rat model is known to mimic diabetic complications in humans. 15 The impaired orthostatic stress response in diabetic rats in our study indicated the early onset (at 1 week) of cardiac autonomic neuropathy. Further evidence for this neuropathy was the decreased RMSSD and SDANN, which suggest decreased vagal tone or enhanced sympathetic modulation of the sinoatrial node, as well as the increased LF–HF ratio, which indicates sympathetic dominance. 23,24 Therefore, the type of cardiac autonomic neuropathy observed in this study was that of a shift of the sympathovagal balance toward sympathetic predominance. Our results are consistent with those of studies showing the relatively early onset (at 3 weeks) of parasympathetic failure in STZ-induced diabetic rats. 25,26 In those studies, the mechanisms proposed to underlie autonomic neuropathy were depletion of cholinergic neurotransmitter vesicles in cardiac parasympathetic nerve endings 26 and autonomic nerve remodeling via the modulation of enzymes involved in neurotransmitter synthesis. 25 In our study, although there was no evaluation of the neuronal ultrastructural or biochemical changes, similar mechanisms are possibly taking place in the same type of diabetes model.
The reversal of the effects of STZ on HRV and orthostatic stress response in our study suggest that Mg2+ prevents diabetic cardiac autonomic neuropathy, possibly by attenuating the above-mentioned cardiac parasympathetic synaptic degeneration. A related effect (outside the context of diabetes) has been reported in rat brain tissue, where magnesium-
The STZ-induced decrease in heart rate observed in our study is not consistent with the above-mentioned evidence of parasympathetic failure, where tachycardia would be expected. The basis of this decrease in heart rate is uncertain, but a similar finding was also reported in STZ-induced diabetic rats at day 6 postinduction. 26 Nonetheless, our present results provided further knowledge regarding this condition by demonstrating its attenuation by Mg2+ treatment.
Our results also showed diastolic dysfunction in diabetes, as was evidenced by an increase in end-diastolic equilibrium volume intercept and a decrease in end-diastolic elastance, both of which are indicative of increased ventricular distensibility. In contrast, systolic parameters (end-systolic elastance and developed pressure) were unaltered in this diabetes model. Diabetic diastolic dysfunction is known to precede systolic impairment in type 1 diabetic patients 5 and STZ-induced diabetic rats 32 and occurs even in short-term conditions like gestational diabetes. 33 However, the nature of the diastolic pathology reported in most chronic diabetes studies is ventricular stiffness, 34 which has been attributed to hyperglycemia-induced deposition of advanced glycation end products (AGEs) and myocardial fibrosis. 35 The increased ventricular distensibility observed in our study is therefore a unique finding in short-term diabetes and may represent an early feature of cardiac remodeling. Thus, the reversal of this increased ventricular distensibility by Mg2+ in our study demonstrated a novel effect of Mg2+ in diabetes. The increased distensiblity is also consistent with the dilated cardiomyopathy (reported at 4 weeks in diabetic rats) that has been attributed to diabetes-induced oxidative stress, 36 but the effects of Mg2+ in that condition are not known.
The mechanisms underlying the cardioprotective effects of Mg2+ in our study seem to be unrelated to the prevention of key metabolic cardiovascular risk factors in diabetes, that is dyslipidemia and hyperglycemia, 3 despite Mg2+ being able to minimize the degree of loss of body weight. Similarly, in a neurological study, Mg2+ did not alter hyperglycemia in STZ-induced diabetic rats, despite modulating diabetic neuropathic pain. 28 In contrast, in chronic STZ-induced diabetic rats, magnesium valproate was found to prevent hyperglycemia and dyslipidemia as well as to decrease LV hypertrophy and fibrosis. 37 These antidiabetic effects of magnesium valproate were proposed to be mediated by a reduction in oxidative stress, but it remains unclear whether the active component in that case was the Mg2+ ion or the valproate moiety. In chronic spontaneously diabetic rats, Mg2+ also reduced the degree of hyperglycemia and the incidence of diabetes, 38 but the underlying mechanisms are unknown.
Furthermore, the effects of Mg2+ in our study were unrelated to a correction of plasma hypomagnesemia in diabetes, as there were no differences in plasma Mg2+ levels among the treatment groups at the time of measurement. The absence of hypomagnesemia was probably in keeping with the short-term diabetes model used in our study, because hypomagnesemia is reported to be more common in chronic, poorly controlled diabetes. 7,8 There was also no statistically significant difference in cardiac tissue Mg2+ concentrations, but diabetic hearts had the lowest Mg2+ levels (P = .07), suggesting the presence of a certain degree of Mg2+ deficiency in diabetic hearts that was probably correctable by Mg2+ treatment. However, this possibility still requires to be clarified in further studies.
A limitation of this study is that, although the STZ-induced rat diabetic model is known to mimic human complications, 15 it is an artificial model of diabetes and therefore the beneficial effects observed in this study may not be present in the natural disease model and may therefore not be corroborated by clinical trials in humans. Moreover, the sustainability of cardiovascular effects of Mg2+ in chronic diabetes or after stoppage of Mg2+ supplementation was not explored since only short-term benefits of Mg2+ were studied. Future studies therefore need to evaluate Mg2+ effects in chronic diabetes, especially in a disease model of the more commonly occurring type 2 diabetes. There is also uncertainty regarding the transferability of HRV results to clinical situations because of species-related differences in HRV responses and reference points. 24,39 Furthermore, although rodents have more rapid heart rates compared to humans, the short (5 minutes) HRV recording still makes the analysis of time domain parameters less definitive. 23 Finally, the exact mechanism underlying the beneficial actions of Mg2+ remains unestablished, albeit the indirect evidence in this study showing that it was unrelated to alterations in diabetic metabolic derangements or hypomagnesemia.
The results of this study suggest that Mg2+ treatment may attenuate diabetic cardiac autonomic neuropathy and improve left ventricular pressure–volume response, without preventing diabetes-induced dyslipidemia or hyperglycemia. However, the exact mechanisms underlying these cardiovascular preservation effects of Mg2+ in diabetes require further investigations. Clinically, the results imply that Mg2+ supplementation therapy in prediabetic states may attenuate the onset of cardiovascular complications in the early stages of diabetes.
Footnotes
Author Contributions
MA contributed to acquisition, analysis, and interpretation; critically revised manuscript; gave final approval, and agreed to be accountable for all aspects of work ensuring integrity and accuracy. RK-L contributed to design, analysis, and interpretation; critically revised manuscript; gave final approval; and agreed to be accountable for all aspects of work ensuring integrity and accuracy. DB contributed to acquisition and interpretation; critically revised the manuscript; gave final approval; and agreed to be accountable for all aspects of work ensuring integrity and accuracy. AG contributed to conception and design, analysis, and interpretation; drafted the manuscript; gave final approval; and agreed to be accountable for all aspects of work ensuring integrity and accuracy.
Declaration of Conflicting Interests
The author(s) declared no potential conflicts of interest with respect to the research, authorship, and/or publication of this article.
Funding
The author(s) disclosed receipt of the following financial support for the research, authorship, and/or publication of this article: MA was supported by the National Research Foundation (NRF) of South Africa Grant, RK-L by the UCT URC/Carnegie Research Development Grant, UCT Faculty of Health Sciences, and NRF (Grant No 85768), and AG by the UCT URC/Carnegie Research Development Grant, NRF (Grant No 91514) and ADInstruments (Australia) Grant.