
Abstract
The idea that the nervous system maintains a set point of network activity and homeostatically returns to that set point in the face of dramatic disruption—during development, after injury, in pathologic states, and during sleep/wake cycles—is rapidly becoming accepted as a key plasticity behavior, placing it alongside long-term potentiation and depression. The dramatic growth in studies of homeostatic synaptic plasticity of miniature excitatory synaptic currents (mEPSCs) is attributable, in part, to the simple yet elegant mechanism of uniform multiplicative scaling proposed by Turrigiano and colleagues: that neurons sense their own activity and globally multiply the strength of every synapse by a single factor to return activity to the set point without altering established differences in synaptic weights. We have recently shown that for mEPSCs recorded from control and activity-blocked cultures of mouse cortical neurons, the synaptic scaling factor is not uniform but is close to 1 for the smallest mEPSC amplitudes and progressively increases as mEPSC amplitudes increase, which we term divergent scaling. Using insights gained from simulating uniform multiplicative scaling, we review evidence from published studies and conclude that divergent synaptic scaling is the norm rather than the exception. This conclusion has implications for hypotheses about the molecular mechanisms underlying synaptic scaling.
Keywords
Homeostatic Synaptic Plasticity and Synaptic Strength
The ways in which changes in activity of the nervous system trigger changes in synaptic strength have been extensively studied but are still only partially understood. It has long been known that denervation or activity blockade leads to an increase in chemosensitivity of the neuromuscular junction (Axelsson and Thesleff 1959; Lomo and Rosenthal 1972; Miledi 1960). A similar response occurs in spinal neurons (O’Brien and Fischbach 1986) and hippocampal neurons (Segal and Furshpan 1990). In 1998, Turrigiano and colleagues demonstrated that such responses are associated with maintenance of network firing rates, and they termed the plasticity, which has the cardinal feature that changes in synaptic strength oppose persistent changes in network activity, synaptic scaling. This type of plasticity came to be known as homeostatic synaptic plasticity (Burrone and Murthy 2003; Turrigiano 2006). Since the groundbreaking description of homeostatic changes in synaptic strength in response to activity modification by Turrigiano and colleagues in 1998, this seminal work has been cited by >1500 articles as of the end of 2021.
The majority of homeostatic plasticity paradigms have involved relatively dramatic experimental manipulations of activity, such as complete block of action potentials with tetrodotoxin (TTX), a Na+ channel antagonist, or block of synaptic transmission and spontaneous synaptic signals with postsynaptic receptor antagonists for prolonged periods (24 h–4 d). These manipulations resemble the physiologic conditions following loss of inputs due to nerve injury, and it is thought that the plasticity homeostatically returns activity to the normal range to guard against synaptic dysfunction. In these situations, as synaptic gain is persistently increased due to input loss, it is possible that homeostatic compensation becomes maladaptive, driving networks to hyperexcitable states and potentially resulting in disease progression (Letellier and Cingolani 2021).
The potential contribution of synaptic homeostasis to pathology is supported by the host of nervous system disorders in which homeostatic synaptic plasticity is implicated. Homeostatic synaptic plasticity is disrupted in experimental models of neurodevelopmental disorders, including autism, Rett syndrome, Angelman syndrome, and fragile X mental retardation (Blackman and others 2012; Pastuzyn and Shepherd 2017; Soden and Chen 2010; Tatavarty and others 2020; Xu and others 2018; Xu and Pozzo-Miller 2017; Zhang and others 2018; Zhong and others 2012). It is also disrupted in mouse models of neurodegenerative diseases such as Alzheimer disease (Chang and others 2006; Galanis and others 2021; Gilbert and others 2016; Pratt and others 2011) and Huntington disease (Smith-Dijak and others 2019). Not surprising, homeostatic synaptic plasticity is induced in animal models of sensory deprivation, such as hearing abnormalities (Teichert and others 2017; Yang and others 2011) and eyesight loss (Barnes and others 2017; Blackman and others 2012; Desai and others 2002; Gao and others 2010; Gilbert and others 2016; Goel and others 2006; Goel and Lee 2007; Goel and others 2011; Moore and others 2018; Ranson and others 2012; Rodriguez and others 2019) and, as proposed in early studies, is implicated in epilepsy (Lignani and others 2020). Treatments used in neuropsychiatric illnesses, including lithium, ketamine, and serotonin reuptake inhibitors, induce homeostatic plasticity (Geddes and others 2015; Gideons and others 2017; Kavalali and Monteggia 2020; Suzuki and others 2021). Finally, homeostatic synaptic plasticity mechanisms may contribute to addiction (Carpenter-Hyland and Chandler 2006; Conrad and others 2008).
Although homeostatic synaptic plasticity was first proposed to be a mechanism to recover firing rates after pathologic perturbations in activity, it has been postulated to play an essential role in two normal physiologic functions: the early development of synapses and networks and the sleep-wake cycle. In the developing nervous system, synapses and network connectivity simultaneously undergo very dynamic structural and functional adaptations as new synapses are being formed and eliminated. This persistent activity-dependent synaptic modification has been suggested to require homeostatic plasticity mechanisms to protect against network instability while allowing for network reorganization (Goel and Lee 2007; Tien and Kerschensteiner 2018; Turrigiano 2012). The sleep-wake cycle is another condition in which there is a dramatic overall potentiation of synapses due to plasticity mechanisms (e.g., long-term potentiation) occurring during wakefulness across many brain circuits, which are homeostatically reset during sleep (Hengen and others 2016; Tononi and Cirelli 2006, 2014; Torrado Pacheco and others 2021).
As we begin to recognize the ever-expanding conditions under which the nervous system uses activity to sculpt nervous system synapses and circuits and how the dysregulation of activity-dependent plasticity contributes to pathologic states, it becomes increasingly clear that we need to better understand the mechanisms involved to preserve normal function. A key advance toward this understanding was the identification by Turrigiano and colleagues (1998) in cortical neurons and O’Brien and colleagues (1998) in spinal neurons that one mechanism contributing to homeostatic plasticity is a compensatory change in the amplitudes of miniature excitatory postsynaptic currents (mEPSCs).
mEPSCs: What They Tell Us
mEPSCs are the postsynaptic cell’s responses to spontaneous release of neurotransmitter from single synaptic vesicles and can be detected in whole cell voltage clamp recordings of membrane currents (Fig. 1). These single-vesicle events are revealed by blocking action potentials with TTX. The voltage clamp recordings of mEPSCs provide information about mEPSC amplitude, time course, and frequency, allowing for detailed functional investigation of activity-dependent synaptic modifications. The focus of this review is mEPSC amplitude, which is often used as a proxy for synaptic strength. As illustrated in Figure 2, the amplitude of a mEPSC is determined by 1) the number of receptors at the synaptic site, which in turn is a product of the density of receptors and the size of the receptor cluster; 2) the characteristics of receptors—single-channel conductance, kinetics of channel opening and closing, and desensitization time course; 3) proximity of the synapse to the cell soma and site of recording; and 4) sometimes overlooked, the amount of transmitter released by vesicle fusion (Auger and Marty 2000; Bekkers and Stevens 1996; Edmonds and others 1995; Lisman and others 2007; Liu and others 1999; Triesch and others 2018; Uteshev and Pennefather 1996; Wu and others 2007). mEPSCs are considered the unitary components that sum when vesicle release is synchronized to produce evoked responses, and changes in mEPSC properties are expected to translate to modifications in the efficacy of evoked synaptic transmission. This is often the case (Maffei and others 2004; Watt and others 2000; Wierenga and others 2005) but not always (Gerkin and others 2013; Pekala and Wenner 2022), likely because the number of vesicles that are released is also subject to activity-dependent plasticity. The measurement of mEPSCs is a powerful tool allowing for the investigation of functional changes, such as synaptic plasticity, occurring at the synapse.
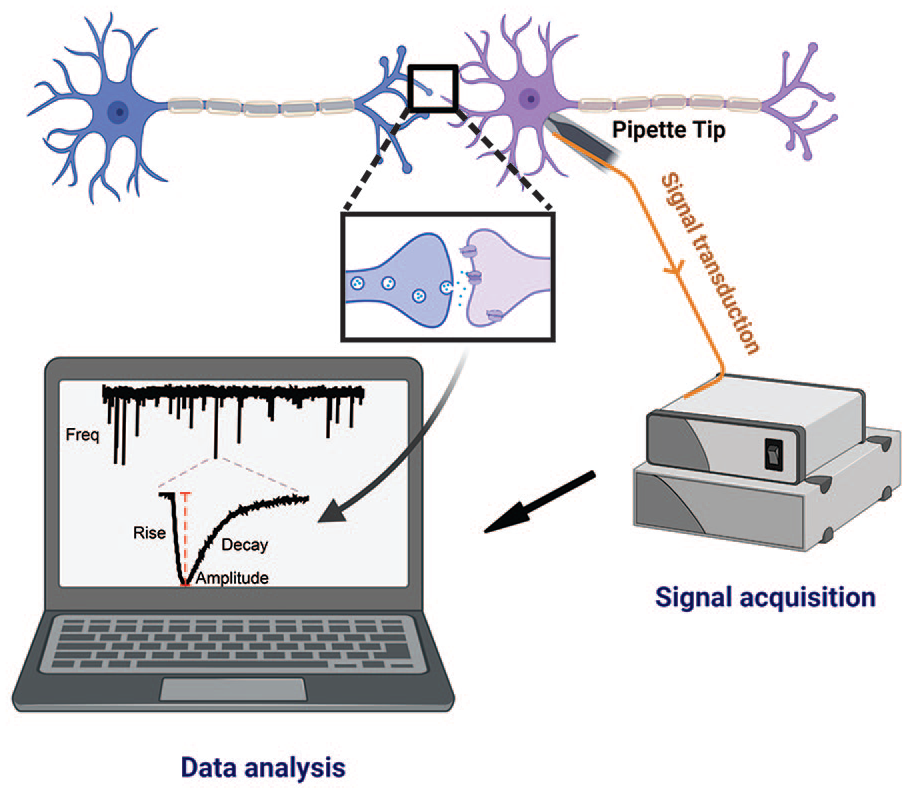
What is a miniature excitatory postsynaptic current (mEPSC)? The mEPSC is the response of one neuron to a single vesicle’s worth of neurotransmitter released by another neuron. The amplitude of the mEPSC is a measure of the synaptic strength of the synapse where the vesicle release event occurs. Synaptic vesicles are constantly being released at a low rate and can be detected via electrophysiologic approaches to record the current activated by binding of the neurotransmitter to postsynaptic receptors. To isolate the spontaneously occurring mEPSCs, glass coverslips containing cultured neurons are placed into a recording chamber on the stage of a microscope and continuously perfused with an extracellular solution containing tetrodotoxin (to block action potentials) and picrotoxin (to block GABA-mediated currents) to isolate glutamatergic mEPSCs. A glass pipette is filled with a solution mimicking the neuron’s internal ionic environment, connected to a patch clamp voltage clamp amplifier via a silver wire, and manipulated to the cell body of the neuron, with suction applied to form a seal of high resistance (i.e., gigaohm seal). The pipette potential is then set to the cell membrane voltage (–60 mV), and additional suction is applied to rupture the cell membrane, allowing electrical access to the interior of the cell. mEPSCs are recorded via an amplifier as an analog signal (current), digitized, and collected with P-Clamp software. In the computer panel, the top trace is a current recording of several seconds, showing the spontaneous rate of vesicle fusion and neurotransmitter activation of receptors; the frequency of mEPSCs can be monitored to assess presynaptic functions such as probability of release. The bottom trace is an expanded region of the recording and shows a single mEPSC; the characteristics of the mEPSC that can be analyzed through software detection programs such as MiniAnalysis include amplitude, rise time, and decay time. Created with BioRender.com (2022).
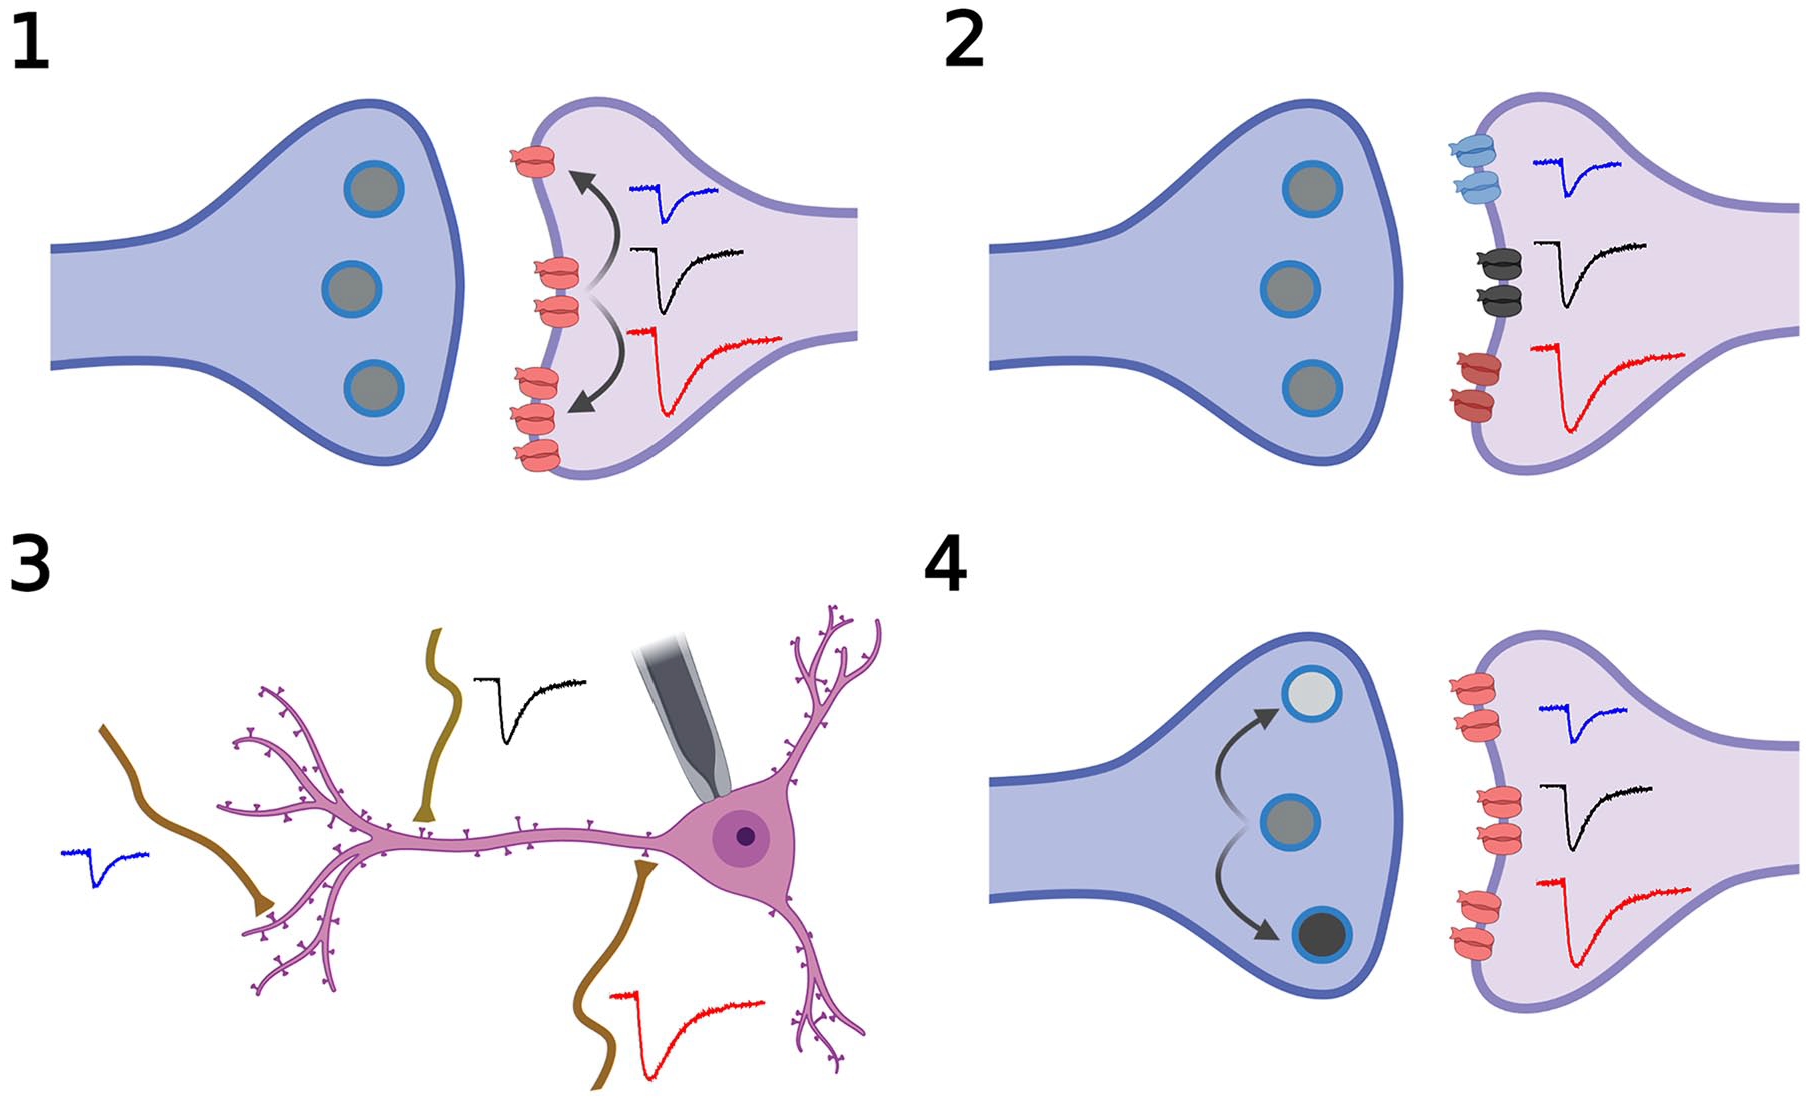
Potential mechanisms regulating miniature excitatory synaptic current (mEPSC) amplitude. Shifts in mEPSC amplitude could be due to 1) the insertion of postsynaptic receptors (red trace) or removal of receptors (blue trace) as compared with the control state (black trace); 2) a shift in receptor type from one (black receptor, black trace) to another (red receptor) that has larger single-channel conductance or longer open time (red trace) or, conversely, a shift to a receptor type (blue receptor) that has a smaller single-channel conductance or shorter open time (blue trace); 3) the location of a synapse more distal to the cell body (blue trace) as compared with that at an intermediate (black trace) or more proximal (red trace) location; or 4) presynaptic modulation of synaptic vesicle neurotransmitter released during vesicle fusion, by altering either vesicle size (not shown) or neurotransmitter content within a vesicle—high transmitter content (black circle, red trace), medium (gray circle, black trace), and low (light gray circle, blue trace). Adapted from “Synaptic Cleft (Horizontal),” by BioRender.com (2022).
Mathematical Description of Homeostatic Plasticity Generates the Global Hypothesis
As described in the introduction, homeostatic synaptic plasticity was first demonstrated by two independent laboratories in 1998. O’Brien and colleagues (1998) showed that mEPSC amplitudes recorded from neurons in dissociated spinal cord cultures increased following 72-h block of excitatory synaptic transmission with CNQX (antagonist of AMPA-type glutamate receptors) and APV (antagonist of NMDA-type glutamate receptors) and decreased following 72-h block of inhibitory synaptic transmission with picrotoxin (antagonist of GABA receptors) and strychnine (antagonist of glycine receptors). Turrigiano and colleagues (1998) showed that mEPSC amplitudes recorded from neurons in dissociated cortical cultures increased following 48-h block of action potentials with TTX and decreased following 48-h block of inhibitory transmission with bicuculline (antagonist of GABA receptors). The frequency distribution functions (O’Brien and others 1998) and cumulative distribution functions (CDFs) of mEPSC amplitudes (Turrigiano and others 1998) shifted in the opposite direction of the activity modifications. Figure 3 illustrates how the CDFs, which are running sums of the frequency distribution functions of mEPSC amplitudes, shift toward smaller and larger amplitudes with increases (solid blue line) and decreases (solid red line) in network activity, respectively. It was further shown that the changes were accompanied by parallel changes in the levels of glutamate receptors assayed with immunofluorescence imaging (O’Brien and others 1998) and responses to exogenously applied glutamate (Turrigiano and others 1998), suggesting that homeostatic synaptic plasticity of mEPSC amplitude is due, at least in part, to modulation of postsynaptic membrane receptor levels.
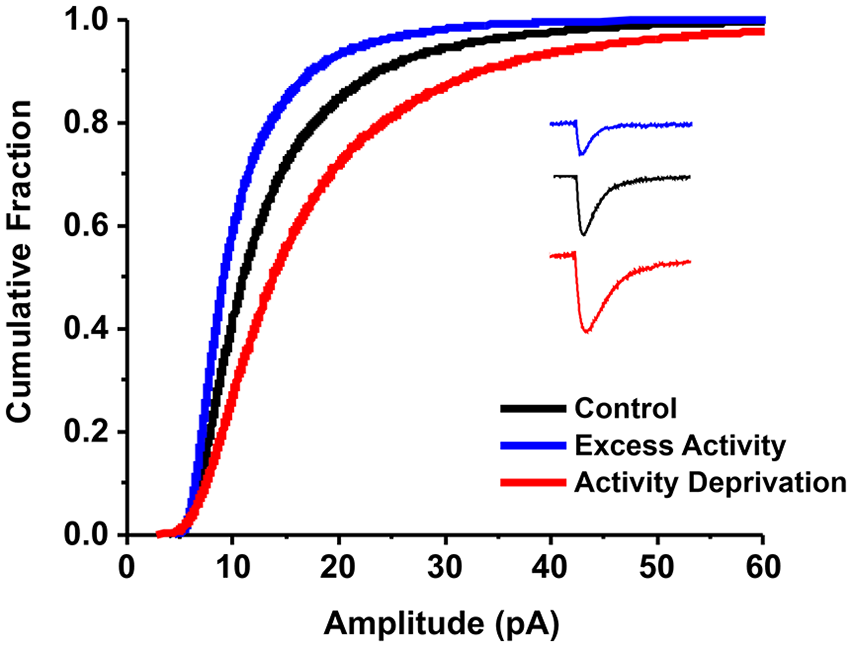
Cumulative distribution functions of miniature excitatory synaptic current (mEPSC) amplitudes shift in the opposite direction of the perturbation of network activity in dissociated neuronal cultures. Shifts in cumulative distribution functions are observed following prolonged exposure of cultured neurons to pharmacologic agents that cause activity deprivation (solid red line; red mEPSC trace) or excess activity (solid blue line; blue mEPSC trace). Solid black line and black mEPSC trace represent control values. Cumulative distribution functions are obtained by plotting the mEPSC amplitudes pooled across neuronal recordings and sorted from smallest to largest amplitude (x-axis) versus a cumulative sum of the frequency bins (y-axis).
One of the reasons for the growth of the field of homeostatic synaptic plasticity is the profoundly impactful mathematical approach taken by Turrigiano and colleagues in their 1998 article. Turrigiano and colleagues used a novel method to analyze mEPSC amplitudes before and after prolonged activity perturbations. They randomly sampled multiple mEPSCs from each cell recording, pooled the amplitudes, sorted them from smallest to largest, and plotted the control data versus the treatment data—a method that we refer to as the rank order process (Fig. 4). The plots produced by the rank order process as applied to homeostatic synaptic plasticity give the appearance of a straight line, with some messiness at the extreme low and high ends of the data. Similar to the process illustrated in Figure 4A and B, Turrigiano and colleagues fit their data with a linear regression function and obtained high R2 values (>0.98), supporting the conclusion that the transformation was linear. The parameters of the linear fit were applied to the mEPSC amplitude CDF of the treated cultures to scale it to the CDF of the untreated cultures, and the almost perfect visual superposition was taken by the authors as “suggesting that activity is globally scaling amplitudes in a multiplicative manner.” Furthermore, with the demonstration that responses to exogenous glutamate were modified in parallel, they concluded that “receptors must be inserted in proportion to the existing number.” Finally, they pointed out that “multiplicative scaling of synaptic strengths preserves the relative differences between inputs” and “helps counteract the destabilizing effects of Hebbian modifications.” Turrigiano and colleagues coined the term synaptic scaling to capture that the mathematical transformation induced by activity modification was multiplicative.
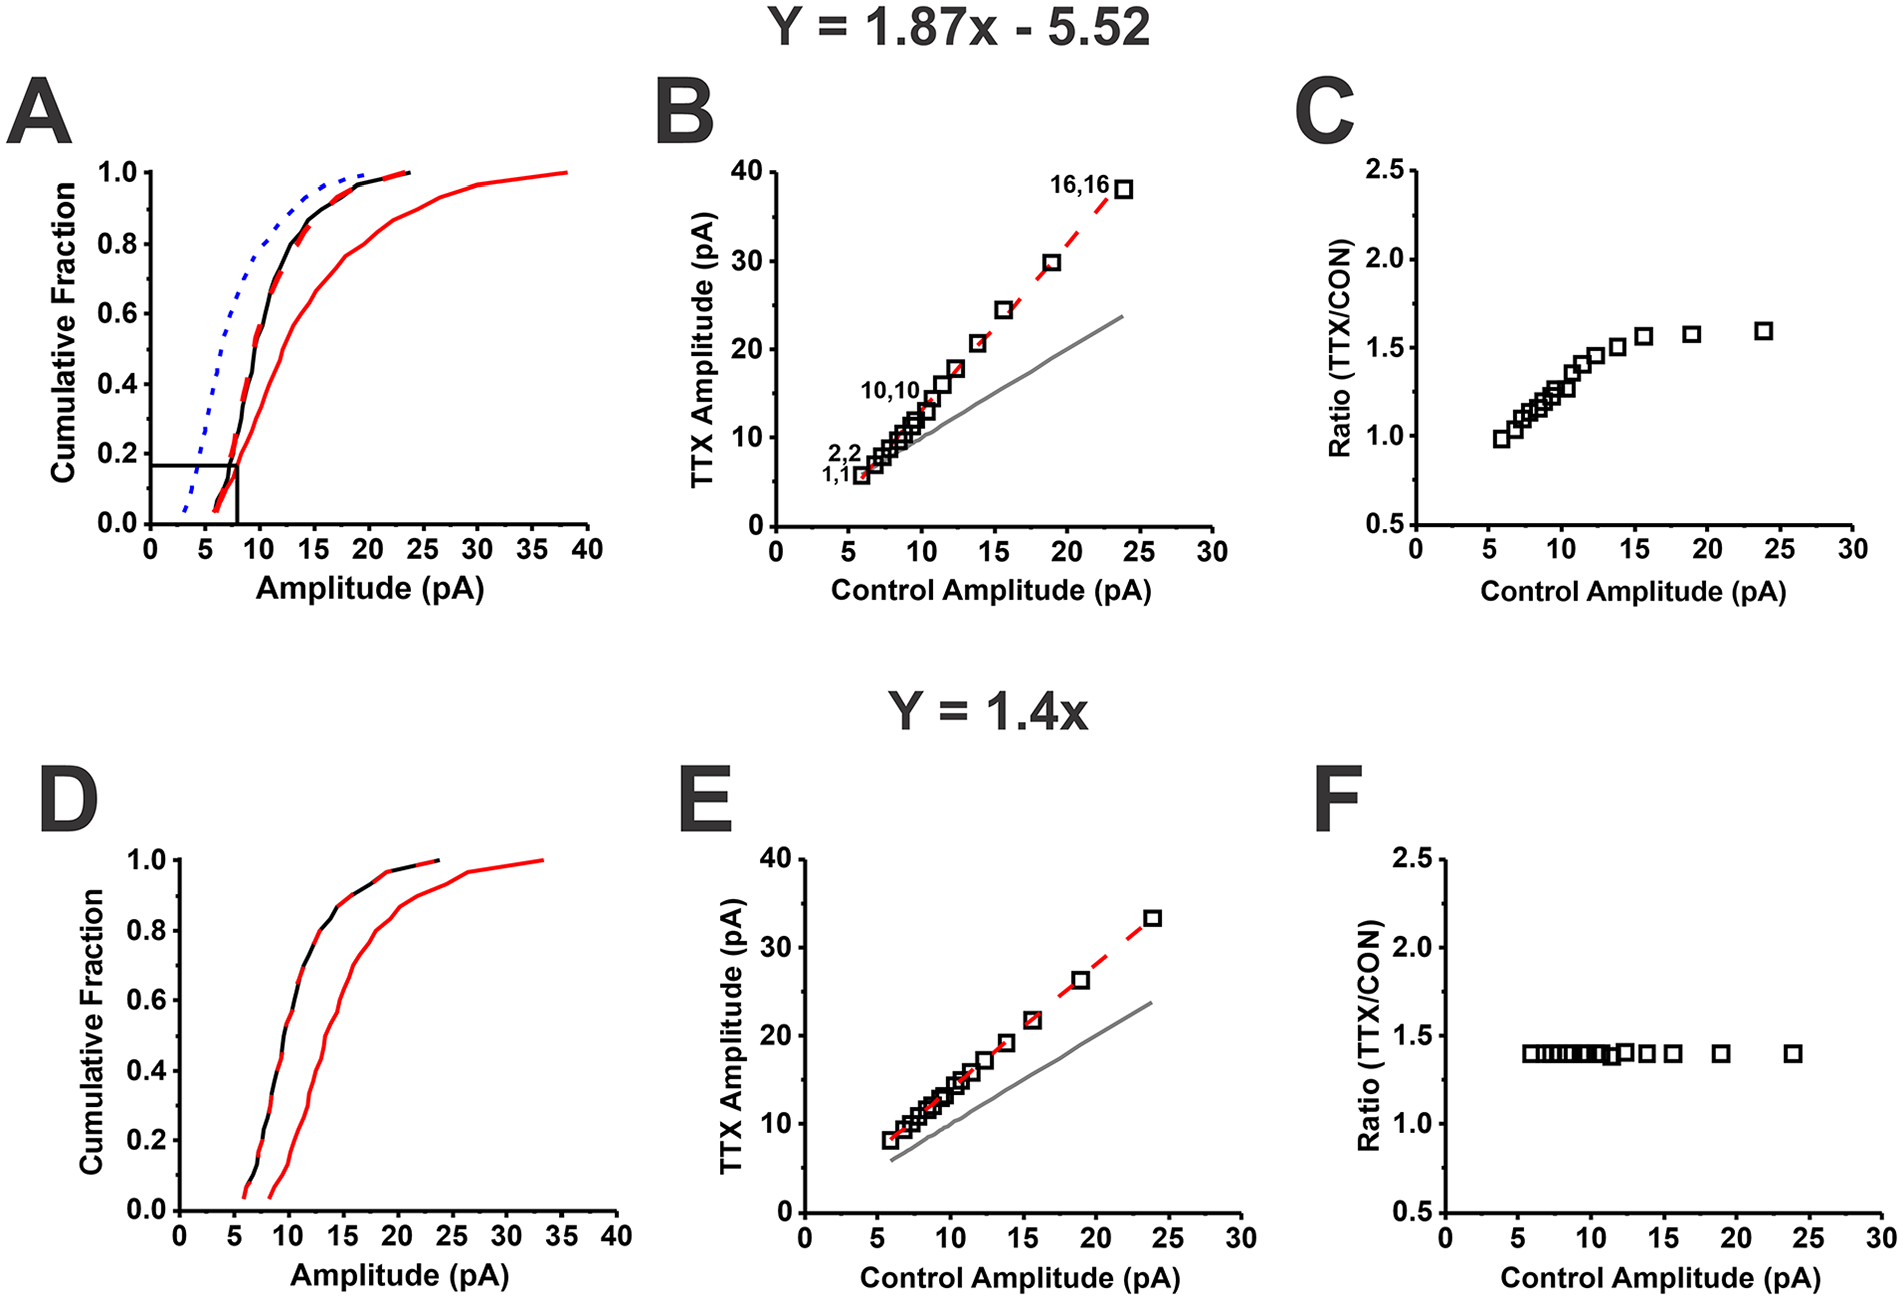
Comparison of divergent versus uniform multiplicative scaling per the rank order process (Turrigiano and others 1998). Block of action potentials with tetrodotoxin (TTX) for 48 h leads to a shift in the distribution of miniature excitatory synaptic current (mEPSC) amplitudes to larger values. (A) The cumulative distribution function (CDF) of amplitudes for mEPSCs recorded from an untreated cortical neuron (control CDF, solid black curve) and a cortical neuron treated with TTX for 48 h (TTX CDF, solid red curve). (B) The rank order process is used to determine the transformation caused by activity blockade. Sixteen quantiles evenly spaced across the distribution are shown. mEPSC amplitude quantiles were sorted from smallest to largest for the control and TTX-treated neurons, with the smallest quantile pair indicated as 1,1; the next smallest as 2,2; the 10th as 10,10; and the 16th as 16,16. The gray line is the line of identity. The rank-ordered data were fit with linear regression, allowing the intercept term to vary; the equation for the best fit is Y = 1.87X – 5.52 (dashed red line; R2 = 0.996). This equation was then used to scale the TTX CDF of mEPSC amplitudes to the control CDF of mEPSC amplitudes: (TTX CDF – b)/m (panel A, dashed red curve; Kolmogorov-Smirnov test, D = 0.067, P > 0.99). The importance of the intercept term b is demonstrated by the poor fit of the TTX CDF to the control CDF by using only the multiplicative term: TTX CDF/m (panel A, dashed blue curve; Kolmogorov-Smirnov test, D = 0.467, P = 0.0025). (C) The ratio of TTX to control mEPSC amplitude (TTX/CON) for each pair is close to 1.0 for the smallest amplitudes and continues to increase to a plateau value around 1.5. This divergent behavior is a mathematical result caused by the outsized effect of the intercept term on small mEPSC amplitudes. (D–F) How the CDFs, rank order plot, and ratio plot respectively appear for simulated uniform multiplicative scaling. (D) The simulated multiplicative scaling CDF (solid red curve) is shifted parallel to the right of the control CDF. In contrast, when the data are transformed with an equation containing an intercept term, the CDFs run together for approximately 18% of the cumulative fraction (panel A, black drop lines). As expected, the rank order plot shows that when the simulated uniform multiplicative scaling data are created by using a multiplicative term and no intercept (panel E), the data points do not run together and are always above the line of identity. Otherwise, the rank order data do not appear dramatically different for uniform scaling (multiplicative factor and no intercept term) versus divergent scaling (multiplicative factor and an intercept term). (F) Finally, the ratio is the same value across all control amplitudes for uniform multiplicative scaling.
Uniform multiplicative synaptic scaling remains the prevailing hypothesis in the field of activity-dependent plasticity induced by chronic alterations in activity (4–48 h) (Letellier and Cingolani 2021; Moulin and others 2020). As described earlier, most of its key tenets were laid out by Turrigiano and others (1998):
The transformation is multiplicative.
The multiplicative nature is consistent with a global mechanism.
The multiplicative scaling preserves established synaptic weights.
The final key tenet—that the cell must be sensing its own activity—was added in later reviews (Turrigiano 2008, 2011; Turrigiano and Nelson 2004).
A number of studies have gone on to report uniform multiplicative synaptic scaling based on applying the rank order process and the superposition of the scaled CDF from the treated condition on the CDF from the control condition, including studies in vitro (Altimimi and Stellwagen 2013; Blackman and others 2012; Cingolani and others 2008; Fong and others 2015; Gainey and others 2009; Hobbiss and others 2018; Kim and Ziff 2014; Xu and Pozzo-Miller 2017) and studies of in vivo activity disruption (Desai and others 2002; Goel and Lee 2007; Keck and others 2013; Santin and others 2017; Teichert and others 2017). However, it has been noted that there are situations in which the activity-dependent transformation is not uniformly multiplicative (Barnes and others 2017; Echegoyen and others 2007; Goel and Lee 2007; Lee and others 2013; Thiagarajan and others 2005).
Is Homoestatic Plasticity Induced by a Global Signal?
Multiple studies have examined whether synaptic scaling signals are sensed and expressed globally across the neuron. In support of a global signal, Ibata and colleagues (2008) demonstrated that block of activity by perfusion of TTX at the soma causes an increase in the accumulation of GFP-tagged GluA2 receptors on the dendrites, but when the dendrite alone is perfused, there was no change in receptor accumulation. However, it remains unclear whether an individual cell is sensing its own global activity and then proportionally changing the receptor levels/synaptic strength at all of its synapses. Two studies provide evidence against the idea that a cell senses its own activity: one showed that expression of the Kir2.1 potassium channel, which causes a neuron to be chronically hyperpolarized, does not cause an increase in mEPSC amplitudes in the transfected cell (Burrone and others 2002); the other demonstrated this manipulation does not cause GluA1 or GluA2 levels to be increased in the transfected cell (Hou and others 2008). However, in a third study, expression of a light-activatable cation channel to chronically depolarize the transfected cell did induce a decrease in mEPSC amplitudes in the transfected cell (Goold and Nicoll 2010). Finally, a study in which network activity was restored with optogenetic feedback following block of AMPA receptors with CNQX found that restoration of spiking to normal levels did not prevent upregulation of mEPSC amplitude (Fong and others 2015). This result is consistent with sensing of activity at the synapses rather than spiking of the cell body.
In contrast to the variable findings regarding global signals, there is consistent evidence that a local signal at the dendrite or synapse can cause compensatory modification of synaptic strength. When activity of presynaptic cells is increased via expression of light-activatable glutamate receptors (Hou and others 2011) or decreased via expression of the Kir2.1 channel (Beique and others 2011; Hou and others 2008), only sites postsynaptic to the modified presynaptic terminals are homeostatically modulated. In direct contradiction to the findings of Ibata and colleagues, it was demonstrated that local perfusion of dendrites with a pharmacologic combination that blocks action potentials and NMDA receptors induced a local increase in GluA1 receptors (Sutton and others 2006). Further support for local regulation of synaptic strength comes from studies in which homeostatic synaptic plasticity is observed following transection of dendrites, despite their being isolated from the cell soma (Ju and others 2004; Letellier and others 2014).
The evidence against the tenets of the global multiplicative homeostatic plasticity hypothesis has been acknowledged in multiple reviews. These stated that there are global and local homeostatic mechanisms (Chen and others 2012; Fernandes and Carvalho 2016; Lee 2012; Turrigiano 2008, 2011, 2012, 2017; Vitureira and Goda 2013; Yu and Goda 2009); that uniform multiplicative homeostatic plasticity may sometimes be obscured by other overlapping plasticity mechanisms (Turrigiano 2011, 2017); and that uniform multiplicative homeostatic plasticity may be developmentally regulated, occurring in young but not older networks (Fernandes and Carvalho 2016; Lee and others 2014; Queenan and others 2012; Turrigiano 2011; Turrigiano and Nelson 2004; Vitureira and Goda 2013; Wenner 2014). In sum, the contradictory evidence is attributed to experimental conditions outside the norm. It is not concluded that the hypothesis needs to be changed. This outlook was exemplified in a review by Turrigiano (2017), who stated that “if the response to a perturbation of activity is not a global scaling of synapses, then one is not studying synaptic scaling.” Because a multiplicative mathematical transformation is the finding that led to the global hypothesis, it is important to reexamine whether or not a uniform multiplicative transformation is the usual response to long-term changes in network activity.
Uniform Multiplicative Scaling Revisited
In the original 1998 study by Turrigiano and colleagues, the linear regression fit included an intercept, or additive factor. It is usually not stated explicitly, but it is almost certain that in this and other articles, the multiplicative and additive terms from the linear regression fit are applied to scale the CDF of treated neurons to the CDF of controls. In fact, we can observe what happens when only the slope term is used in scaling—this is the case in one of the most cited examples of nonmultiplicative scaling (Echegoyen and others 2007). The authors performed the rank order process and fit with a linear regression function that had a slope of 1.27 and an intercept of –2.14. According to the authors, “the post-TTX event amplitudes were then divided by the scaling factor (i.e., the slope).”
Without the additive factor in the scaling transformation, the scaled TTX CDF and control CDF are clearly different, with the scaled CDF being to the left of the control CDF at the lower amplitudes before joining the control CDF at the higher amplitudes (inset in Fig. 6A from Echegoyen and others 2007). Figure 4A (blue dashed line) illustrates the poor scaling that occurs with use of just the multiplicative factor, when the linear regression fit actually includes both a multiplicative and an additive factor. Other studies with intercept terms, or with linear regression fits that do not go through 0, are able to produce a good fit—visually or per a Kolmogorov-Smirnov (K-S) test—indicating that they likely included the intercept in the scaling process (Altimimi and Stellwagen 2013; Blackman and others 2012; Fong and others 2015; Santin and others 2017; Turrigiano and others 1998). Furthermore, some of those studies describe using “the equation,” which suggests that the additive term was included (Blackman and others 2012; Turrigiano and others 1998).
In 2012, Kim and colleagues took on the issue of the additive term, or intercept, recognizing that its presence meant that the transformation was not uniform. As they noted, an intercept will have a bigger offsetting effect for small-amplitude mEPSCs, effectively causing plasticity to be size dependent, being less for small-amplitude mEPSCs and more for large-amplitude mEPSCs. They attributed the requirement for an intercept to the mismatch caused by the physical limit of detection, or detection threshold, a combination of the interaction between a small signal size and a large baseline noise level. Kim and colleagues reasoned that if the intercept was caused by a threshold/detection issue, it could be addressed by iteratively applying multiplicative factors to scale the data from activity-blocked cultures down toward the control data and removing any scaled amplitudes that fell below the threshold detection limit (Fig. 5). In the data set that they analyzed, this iterative process was able to identify a scaling factor that matched the activity-blocked data to the control data based on a K-S test of the comparison (P = 0.044). The conclusion that the transformation is uniform depends on their somewhat arbitrary cutoff of P > 10-4, but a truly close match will have a large P value (i.e., >0.1). For example, when the intercept term was included, the P value for the comparison between control and scaled data was 0.53.
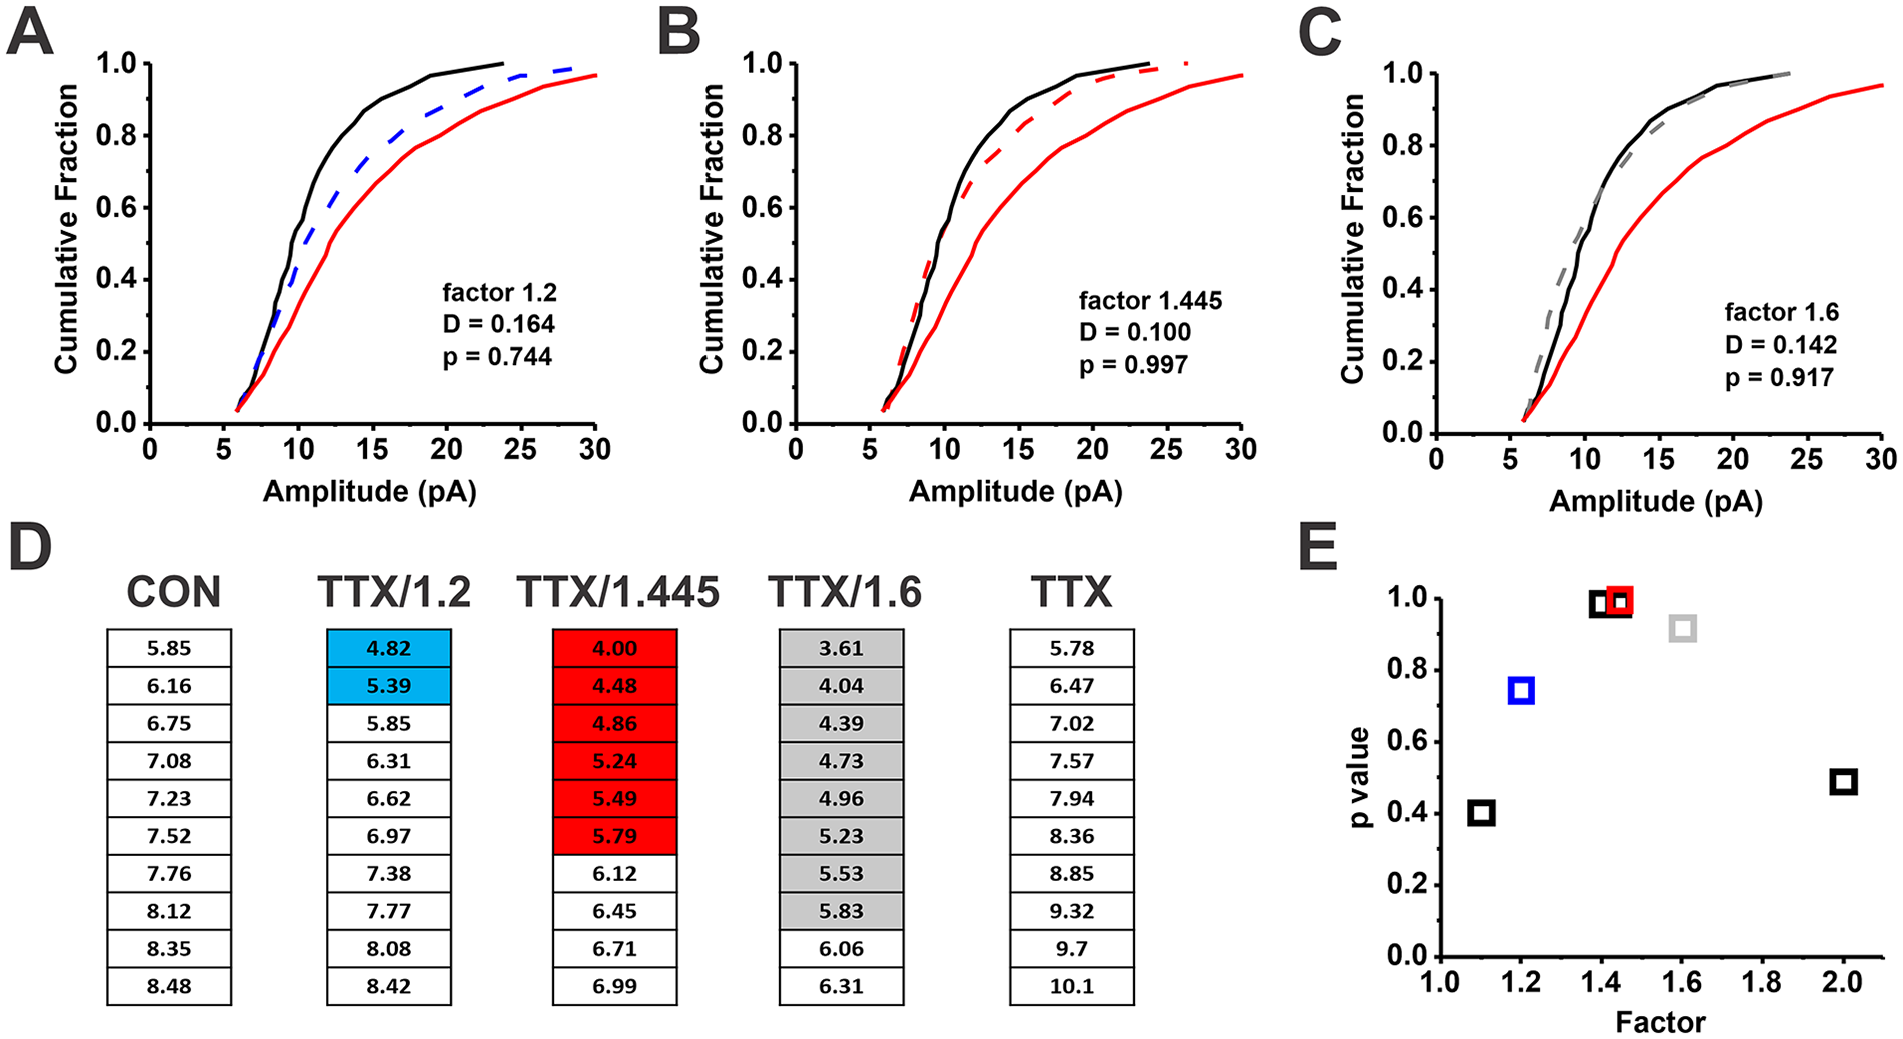
Finding the best multiplicative scaling factor via the iterative process (Kim and others 2012). In the iterative process, multiple scaling factors are tested in succession, stepping through the range from a small factor to a large factor. For each factor, the tetrodotoxin (TTX) cumulative distribution function (CDF) is divided by the factor; then, miniature excitatory synaptic current (mEPSC) amplitudes that fall below the smallest control mEPSC amplitude (method used here) or a threshold set by the noise (3 × root mean square noise) are discarded before comparing the two CDFs with a Kolmogorov-Smirnov (K-S) test. (A–C) The control (CON; black solid line) and TTX (red solid line) CDFs from Figure 4. (A) The factor 1.2 is applied, and the resulting scaled CDF (blue dashed line) is compared with the CON CDF per the K-S test (D = 0.164, P = 0.744). (B, C) The results for scaling factors 1.445 and 1.6, respectively. The best scaling factor, defined by the one producing the largest P value when comparing the scaled TTX CDF with the control CDF, was 1.445 (panel E, red; D = 0.100, P = 0.997). (D) The smallest 10 mEPSC quantiles for the CON, TTX, and scaled TTX CDFs (TTX/scaling factor), with shading to highlight the mEPSC quantiles that were discarded after scaling; the shading colors in panel D correspond to the indicated scaling factors (1.2, blue; 1.445, red; 1.6, gray) in panel E. (E) The P values as a function of scaling factor for a subset of factors that were applied to the TTX CDF to scale it to the CON CDF. Comparison of the tables shows that the larger the scaling factor, the greater the number of mEPSC quantiles discarded. Note that the K-S test analyzes the largest vertical distance between the CDFs being compared.
Discovery of Divergent Scaling
In our recent publication (Hanes and others 2020), we examined a large data set of 86 control and 77 TTX-treated mouse cortical neurons to determine the mathematical transformation accompanying homeostatic plasticity. Figure 6A and C show the CDFs for mEPSCs from control neurons (solid black lines) and mEPSCs from TTX-treated neurons (solid red lines). We found that the rank order process (Figure 6A, B) and the iterative process (Figures 6C, D) failed to scale the TTX CDF to the control CDF (Figure 6A, C, dashed red lines). With our sample size, the P values for the K-S test comparison between control and scaled data from TTX-treated cultures were very small (rank order, 1.3 × 10⁻⁵; iterative, 0.002). In the rank order process, the linear regression fit had an R2 of 0.989 (Figure 6B), indicating that a good linear fit was not a guarantee that the parameters from the linear regression would scale the data from treated cells to controls with a close match/large P value.
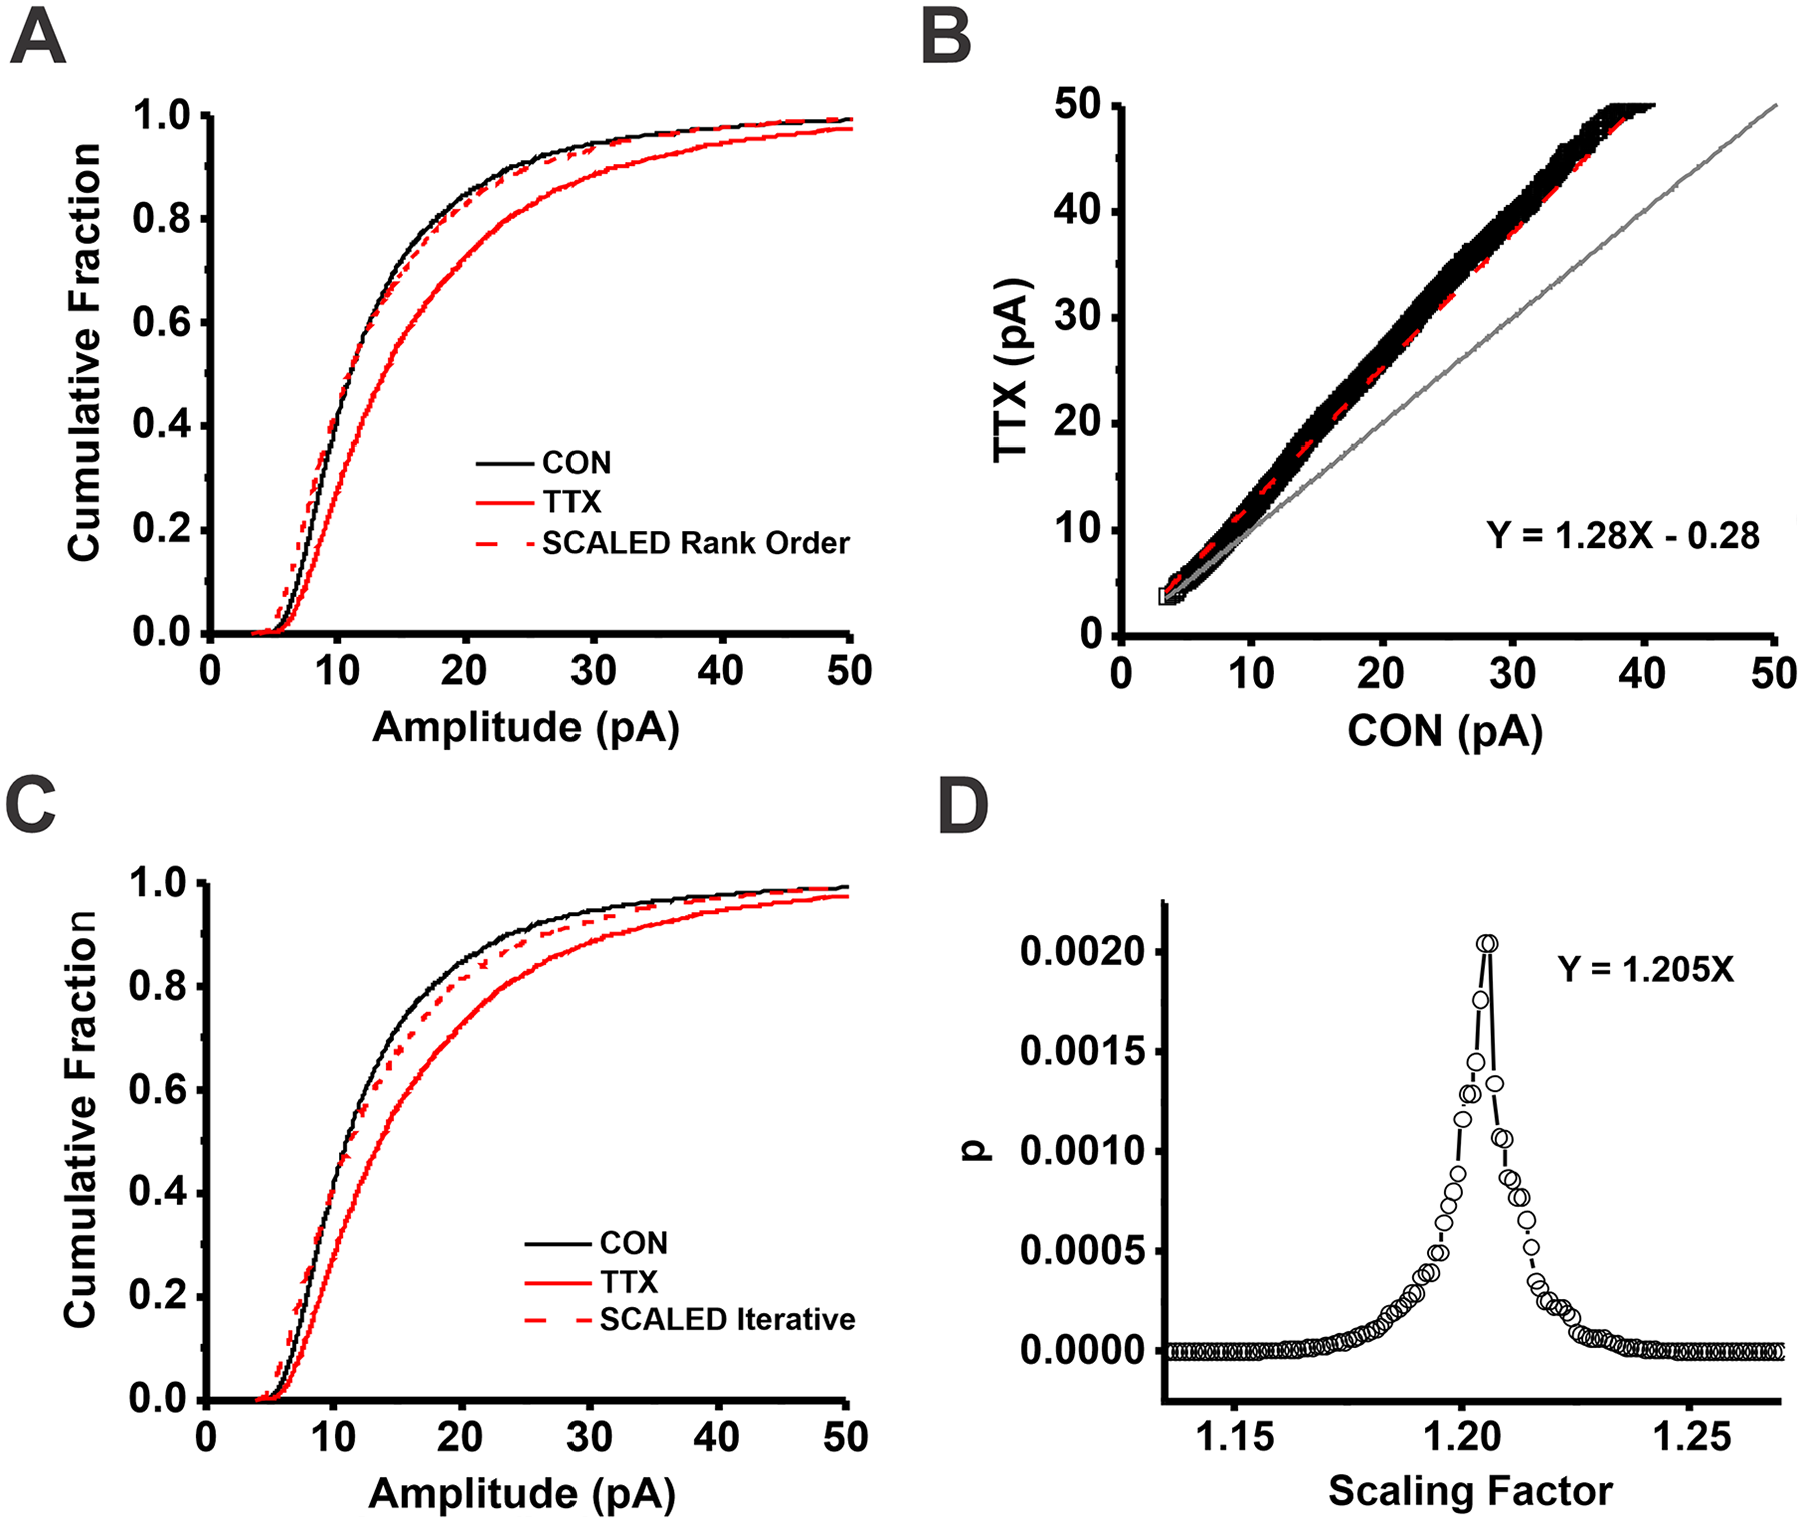
Cumulative distribution functions of miniature excitatory synaptic current (mEPSC) amplitudes following activity blockade with tetrodotoxin (TTX) in cortical cultures cannot be scaled with the rank order or iterative method. (A) Scaling the TTX (solid red line) to the control (CON; solid black line) CDFs with the parameters from a linear regression fit of rank-ordered data (Kolmogorov-Smirnov [K-S] test, D = 0.070, P = 1.3 × 10⁻⁵). (B) mEPSC amplitude quantiles from TTX-treated neurons were sorted from smallest to largest and plotted versus the sorted mEPSC amplitude quantiles from untreated control neurons. The resulting relationship was fit with linear regression allowing the intercept term to vary (Y = 1.28X – 0.28; red dashed line, R2 = 0.989). Gray line, line of identity. (C) Scaling the TTX (solid red line) to the CON (solid black line) CDFs with the best multiplicative factor determined per the iterative process. mEPSC quantiles in the scaled data set that fell below the smallest quantile in the control data set were discarded prior to comparing the distributions with a K-S test. (D) Plot of P values as a function of the multiplicative scaling factor used to scale the TTX to the CON CDFs. Maximum P value = 0.002, D = 0.053, multiplicative factor = 1.205. Figure modified from Figure 3 in Hanes and others (2020). Note that here sample sizes for the K-S tests are matched for the two methods (30 quantiles for 86 CON and 77 TTX-treated cells), whereas they were not in the original publication.
To further explore the relationship between the characteristics of the CDFs, we wanted to show how true uniform multiplicative scaling behaved in this analysis. Figure 7A shows simulated uniform multiplicative scaling produced by taking two random samples from the control data set (solid black [CON1] and red dashed [CON2] lines) and multiplying the second data set by 1.25 to serve as the simulated TTX data set (solid red line [simTTX]). Because in our experiment the CDFs run together for a significant span of mEPSC amplitudes at the beginning of the distributions (10%–15%; Figure 7C) and did so in previous studies of homeostatic plasticity (e.g., Fig. 1D in Turrigiano and others 1998), we were surprised that after simulated uniform multiplicative scaling, the CDFs were separated from the smallest amplitudes (Fig. 7A inset). Mathematically, this makes perfect sense—if the small amplitudes are multiplied by the same factor as the large amplitudes, the CDFs will be separated at the smallest amplitudes, and there should be only a modest spreading out of the two curves as the factor acts on the larger amplitudes (Fig. 4D). To directly address the influence of a threshold issue on CDF behaviors, we ran a second simulation in which mEPSC amplitudes below 7 pA were discarded from both data sets; the pairs of CDFs of mEPSCs from control (CON) and treated (simTTX) cultures still did not run together (Fig. 7B). The sole difference from the unthresholded data was that the two CDFs started from the same initial mEPSC amplitude, but the curves immediately separated (Fig. 7B inset).
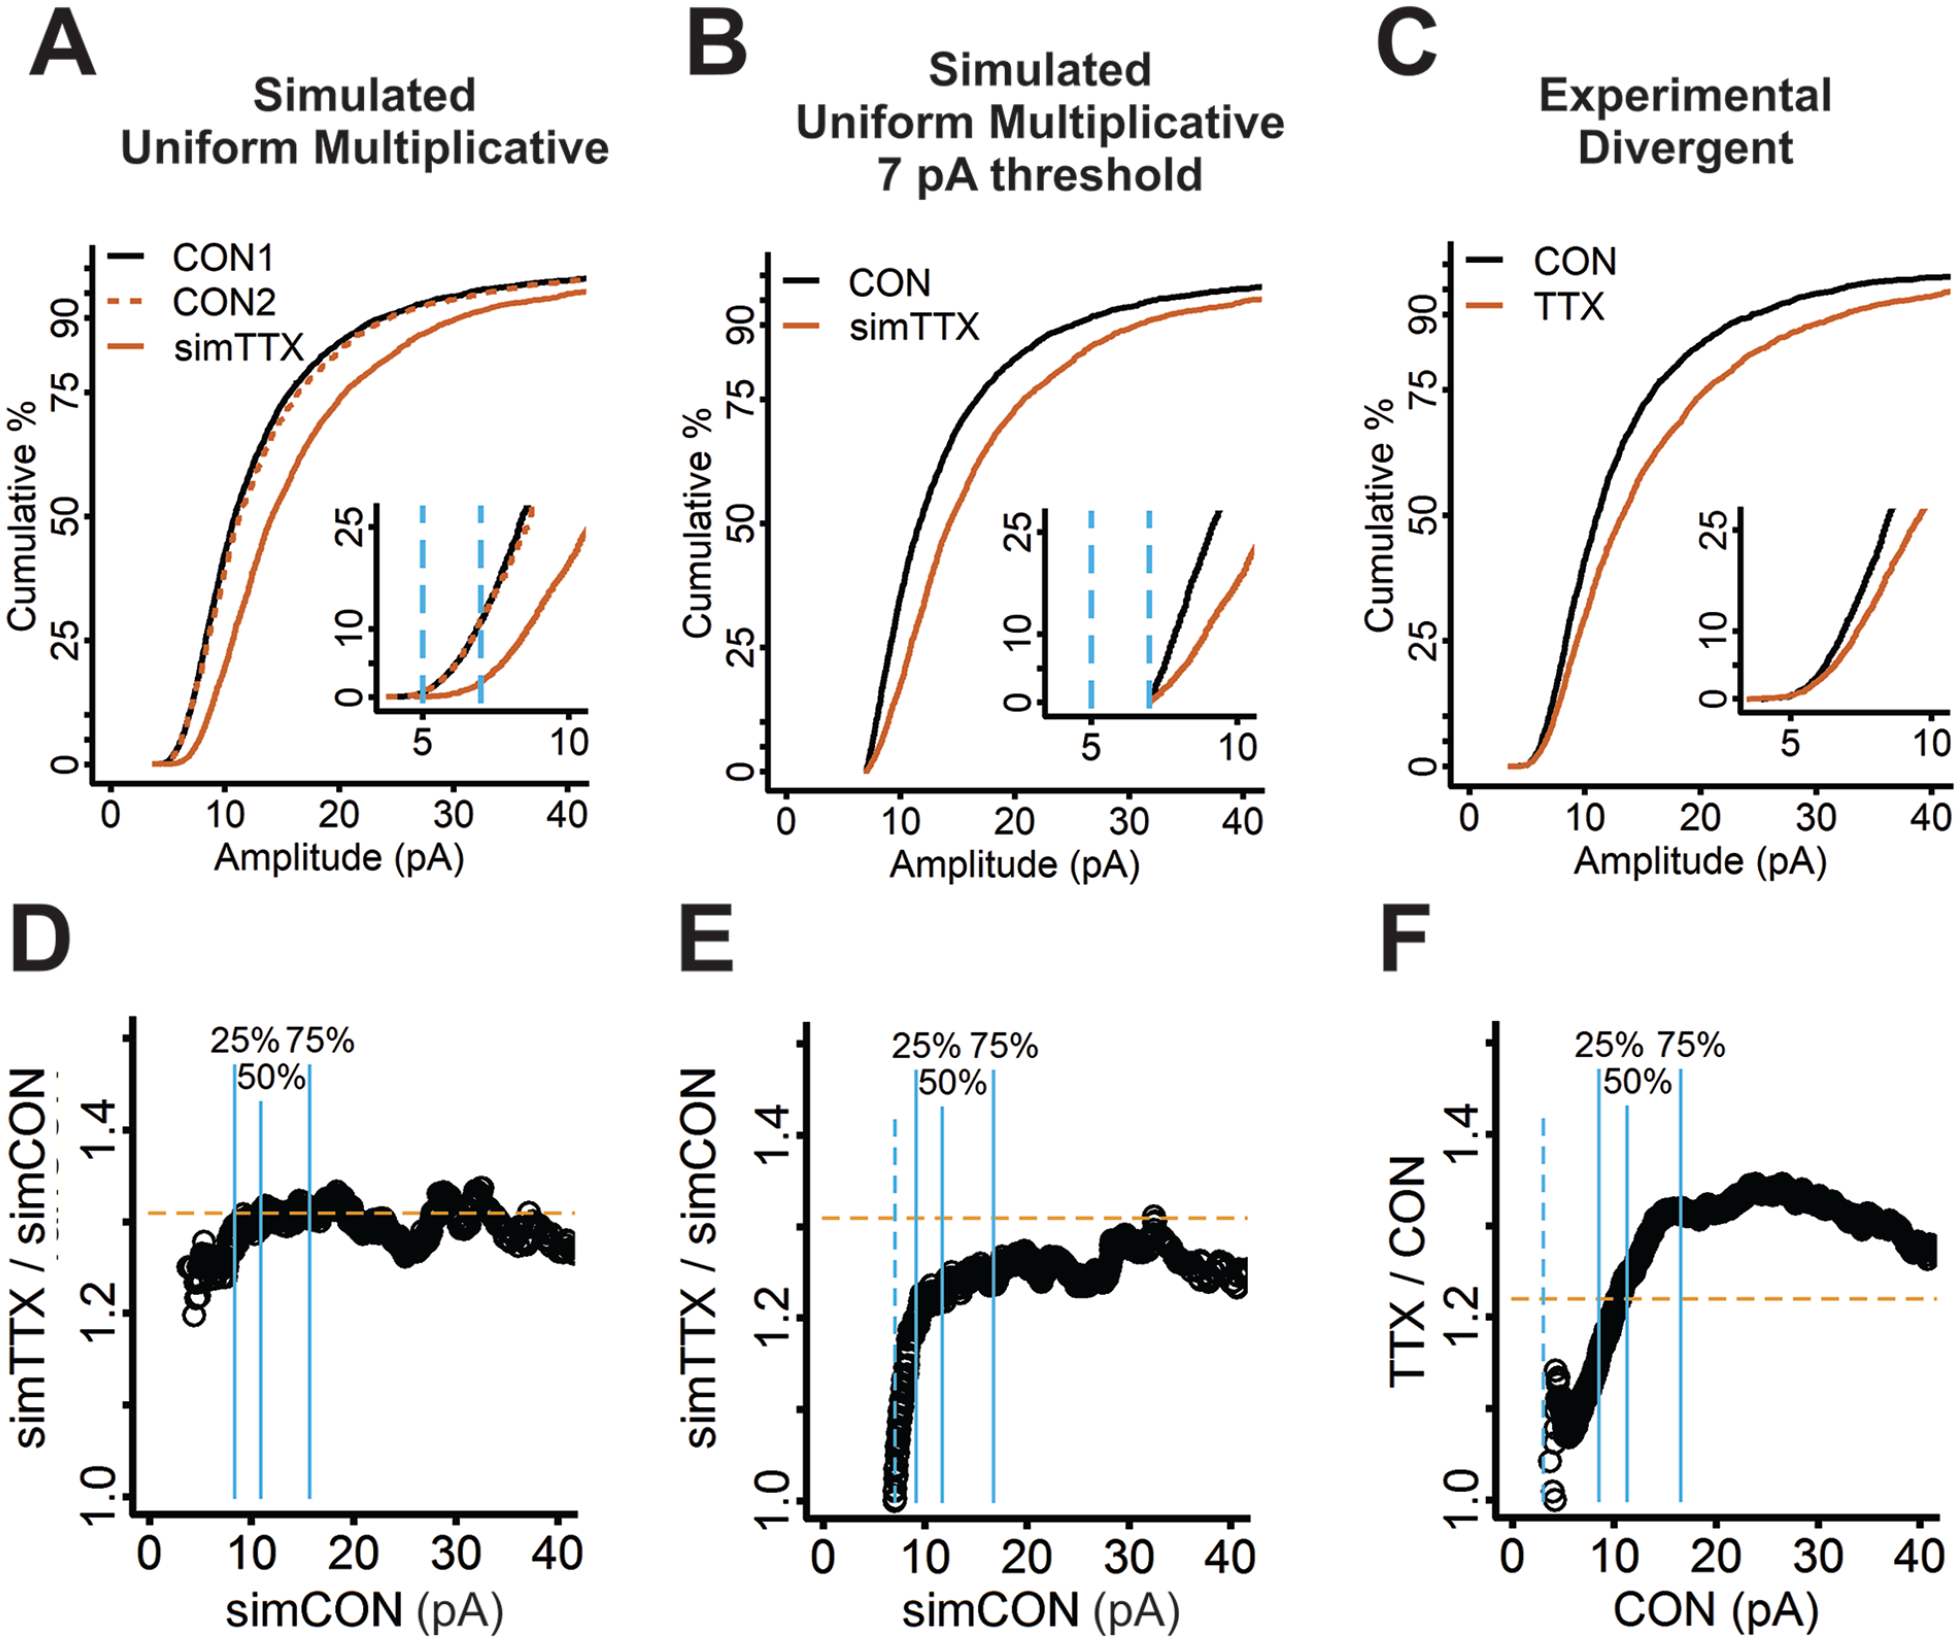
Behavior of miniature excitatory synaptic current (mEPSC) amplitudes following activity blockade in cortical cultures cannot be simulated by using uniform multiplicative scaling or that with a 7-pA threshold cutoff. (A) To simulate uniform multiplicative synaptic scaling, two slightly different control samples were generated by twice randomly sampling 30 mEPSCs from each of 86 control mouse cortical neurons (2580 samples; solid black curve, CON1; dashed red curve, CON2). To simulate the multiplicative effect of TTX, the second control cumulative distribution function (CDF) was multiplied by 1.25 (solid red curve; simTTX). (B) The effect of recording noise on the ability to detect the smallest mEPSC amplitudes was simulated by discarding all mEPSC amplitudes <7 pA in the control (solid black curve) and simulated TTX (solid red curve) samples. (C) CDFs produced by sampling 30 quantiles from each of 86 control (CON; solid black curve) and 77 TTX-treated (solid red curve) mouse cortical neurons ran close together for >15% of the data, indicating the experimental data displayed divergent scaling. (D) A ratio plot is produced by sorting mEPSC amplitudes from the CON1 and simTTX pooled samples in panel A from smallest to largest, calculating the ratio of simTTX mEPSC amplitude to CON1 mEPSC amplitude for each pair of amplitudes, and plotting the ratios versus the CON1 mEPSC amplitudes (circles). The plot shows a uniform multiplicative factor with variation from the random sampling process. (E) A ratio plot produced from the 7-pA truncated samples in panel B shows an abrupt increase in ratio over <5% of the data before reaching a uniform value. The dashed blue line indicates the 7-pA threshold cutoff, which overlaps with the region of changing ratio. (F) A ratio plot for the experimental data is produced by pooling 77 mEPSC amplitude quantiles from each of 86 control mouse cortical neurons and 86 mEPSC amplitude quantiles from each of 77 TTX-treated mouse cortical neurons to create two data sets matched for number of samples. The plot shows an increasing ratio over almost 75% of the data, demonstrating divergent scaling. Dashed blue line indicates 3 pA: the threshold cutoff used when detecting mEPSCs in MiniAnalysis. Insets for panels A, B, and C: first 25th quantile of data; light blue dashed lines indicate 5- and 7-pA threshold cutoffs. Solid blue lines in panels D, E, and F indicate 25th, 50th, and 75th quantiles. Figure modified from Figures 3 and 7 in Hanes and others (2020).
We concluded from the results described here that the rank order process could produce a reasonable linear regression fit with a high R2 value, yet the homeostatic synaptic plasticity was not uniformly multiplicative. Therefore, we looked for another way to show the transformation following activity block. Since we wanted to know the factor for every size of mEPSC amplitude, we took the data that were already sorted from smallest to largest amplitudes from the rank order process and calculated the ratio for each pair of samples. As shown in Figure 7D to F, a plot of the ratio TTX mEPSC/control mEPSC versus the control mEPSC amplitudes revealed an even more dramatic difference between simulated uniform multiplicative scaling and the experimental data than the CDF plots. For simulated uniform multiplicative scaling, the ratios are the same across the entire range of control mEPSCs (Fig. 7D). A threshold cutoff of 7 pA causes a rise in ratios from 1.0 to 1.2 over the first 5% of the mEPSC amplitudes, but the ratios stabilize thereafter (Fig. 7E). In contrast, for the experimental data, the ratios increase steadily across the majority of the mEPSCs, not reaching a plateau value until around the 75th percentile of mEPSC amplitudes (Fig. 7F). We termed this behavior divergent scaling. As shown in Figure 4A to C, divergent scaling can occur as the mathematical consequence of having a negative intercept term in the linear regression equation used to fit the rank order relationship. However, our experimental data did not require a large intercept in the linear regression fit of the rank-ordered data yet still exhibited divergent behavior on the ratio plot, indicating that a large intercept is sufficient but not necessary for divergent behavior. New experiments are needed to distinguish the biological mechanisms underlying divergent scaling that can be mathematically described by a linear equation with a negative intercept versus divergent scaling requiring a more complex function.
In Hanes and others (2020), we examined two additional data sets, previously published from the Wenner laboratory (TTX-treated rat cortical cultures; Fong and others 2015) and from the Stellwagen laboratory (TTX-treated mouse hippocampal cultures; Altimimi and Stellwagen 2013), and observed the same behavior of divergent scaling, where ratios increased with increasing control mEPSC amplitudes in the ratio plot (Fig. 9 from Hanes and others 2020). In the rank order linear plot for the two data sets, it is difficult to detect that there are different slopes for the smallest mEPSC amplitudes (Fig. 8 from Hanes and others 2020), further confirming the idea that the rank order process is not sensitive enough to pick up divergent scaling.
Since our description of divergent scaling, a study by Torrado Pacheco and colleagues (2021) has been published describing a similar simulation method to demonstrate the sensitivity of the rank order process. The authors generated two simulated distributions that matched the experimental control data in all statistical parameters but differed from each other at the P < 0.05 level. One of the two distributions was multiplied by a scaling factor of 1.20, and an artificial threshold of 5 pA was applied to both sets of data. The data were rank ordered and the control data plotted versus the simulated treated data to generate the rank order relationship, which was fit with a linear regression function of y = 1.22x – 0.852. Two pieces of evidence from this analysis were offered to support the sensitivity of the method: 1) that the real control CDF aligned very well with the artificially generated control CDF (Fig. S4A, right-most figure, in Torrado Pacheco and others 2021) and 2) that the linear regression fit produced a slope that closely matched the known transformation. We do not disagree that the rank order method is very good at detecting uniform multiplicative scaling when it occurs and can do so even with a threshold issue; we illustrated the same point in Figure 5 of Hanes and others (2020). What we have shown is that the ratio plot is sensitive enough to reveal divergent scaling even when the rank order process is well fit with a linear equation. This disparity arises 1) because the presence of an intercept term in the rank order linear regression fit indicates that scaling is divergent and 2) because slight deviations from linearity are not obvious in the rank order process. These deficiencies of the rank order process suggest that the ratio plot would be a better indicator of whether synaptic scaling is uniformly multiplicative or divergent.
Divergent Scaling Is the Norm
As described earlier, one way to distinguish divergent scaling from uniform multiplicative scaling is to examine the CDFs of the control and treated data sets and to identify whether they are separated at the smallest mEPSC amplitudes. Another characteristic of truly uniform multiplicative scaling is the ability to scale the treated data set to the control data set by using only a multiplicative factor. We examined 23 previously published studies with 27 distinct experimental manipulations and noted whether one or both of these criteria were met. We analyzed data just from publications that blocked activity, included CDFs, and either scaled the CDFs based on multiplicative scaling or provided the rank order plot (or both). We also included publications that used the iterative method (Kim and others 2012), where scaled data that fell below threshold were discarded. When provided, we note the P values for the K-S test of the comparison of the scaled treated data to control or scaled control to treated. Synaptic scaling was classified as divergent if 1) the CDFs for the control and treated groups ran together for >5% of the distribution, 2) scaling based on a single multiplicative factor was not a good fit to the data based on a significant P value for a K-S test, or 3) there was a nonzero intercept term in the rank order process. The droplines in Figure 4A indicate how we estimated the percentage running together. The point at which the two CDFs first separate was located; a horizontal line was drawn across the plot to the y axis to determine the cumulative fraction; and that was converted to a percentage. It should be noted that if CDFs run together for >5% of the data, the scaling is almost certainly divergent, but the opposite is clearly not true—that is, if the CDFs do not run together, the relationship is not necessarily uniformly multiplicative. We know this because of three cases: in two (Altimimi and Stellwagen 2013; Fong and others 2015), the CDFs do not run together for >5% of the data, but in our recent study (Hanes and others 2020) we found the scaling to be divergent on a ratio plot. In the third case (Barnes and others 2017), the CDFs do not run together for >5% of the data, but the authors were unable to find a single factor using the iterative process that scaled the treatment CDF to the control CDF with a nonsignificant P value until they discarded 50% of the data.
Our analysis comparing the CDFs of mEPSCs recorded from control and activity-blocked neurons is shown in Table 1. Remarkably, potentially uniform multiplicative scaling was identified in just 8 of 27 experiments (~30%; shaded gray). Of the 27 experiments, 2 were judged indeterminate because, while the CDFs ran together for only 5% of the distributions, there was other evidence that the data were divergent. In Figure 3D of Teichert and colleagues (2017), the multiplicatively scaled CDF clearly deviates from the control CDF at the lowest end of the distribution. For Figure 3 of Xu and Pozzo-Miller (2017), the linear regression fit of the rank-ordered data is constrained to go through the origin but has an obviously different slope than that of the data. The remaining 17 of 27 experiments (63%) were judged divergent based on the CDFs running together for >5% of the data. Notably, in the original study of Turrigiano and others (1998) that launched the global synaptic scaling hypothesis on the basis of how well the parameters of the linear regression scaled the data, the scaling for the homeostatic plasticity induced by TTX treatment of rat cortical cultures is divergent based on the behavior of the CDFs (running together for 15%–20% of the distribution) and the requirement for a large intercept (12.3). It should be noted that 30% of experiments demonstrating uniform multiplicative scaling is surely an overestimate, since as we indicated previously, scaling can be divergent based on the ratio plot even when the CDFs run closely together for only 5% of the data (data from the Wenner laboratory [Fong and others 2015] and data from the Stellwagen laboratory [Altimimi and Stellwagen 2013] published in Fig. 8 in Hanes and others 2020). Interestingly, of the experiments judged as showing uniform multiplicative scaling, 7 of 8 employed in vivo activity modification. However, 5 other experiments applied in vivo activity modification that clearly produced divergent scaling (Barnes and others 2017; Blackman and others 2012; Echegoyen and others 2007; Goel and Lee 2007; Santin and others 2017), so it is not yet clear what conditions produce uniform multiplicative scaling. There is no question that scanning the CDF comparisons by eye is an extremely rough estimate of the presence of uniform multiplicative or divergent scaling, making it essential to apply the more sensitive ratio plot analysis to accurately determine which type of scaling is occurring, for previously published data as well as in experiments going forward. This point is well illustrated in the recent study of fast and slow forms of synaptic scaling in embryonic chick spinal motor neurons (Pekala and Wenner 2022). The authors showed the following: uniform scaling, a uniform ratio of 1.3 for GABAergic miniature synaptic currents as compared with control miniature synaptic currents following prolonged activity blockade with a GABAergic antagonist, and nonuniform scaling, a ratio that gradually varied from 1.0 at the lowest amplitudes to a maximum of 1.6 at the highest amplitudes, for glutamatergic miniature synaptic currents following combined treatment with prolonged activity blockade with a GABAergic antagonist and brief treatment with an NMDA antagonist. They report other conditions in which part of the distribution was uniformly scaled and part was divergent. Such differences in behavior, which suggest distinct underlying mechanisms, would be impossible to detect by examining only the shifts in the CDFs or the linear regression fit of the rank-ordered data.
Selected Studies of Homeostatic Synaptic Plasticity in Which Activity Was Blocked in Rodent Models, Which Were Analyzed to Determine If the Transformation Was Uniformly Multiplicative or Divergent.
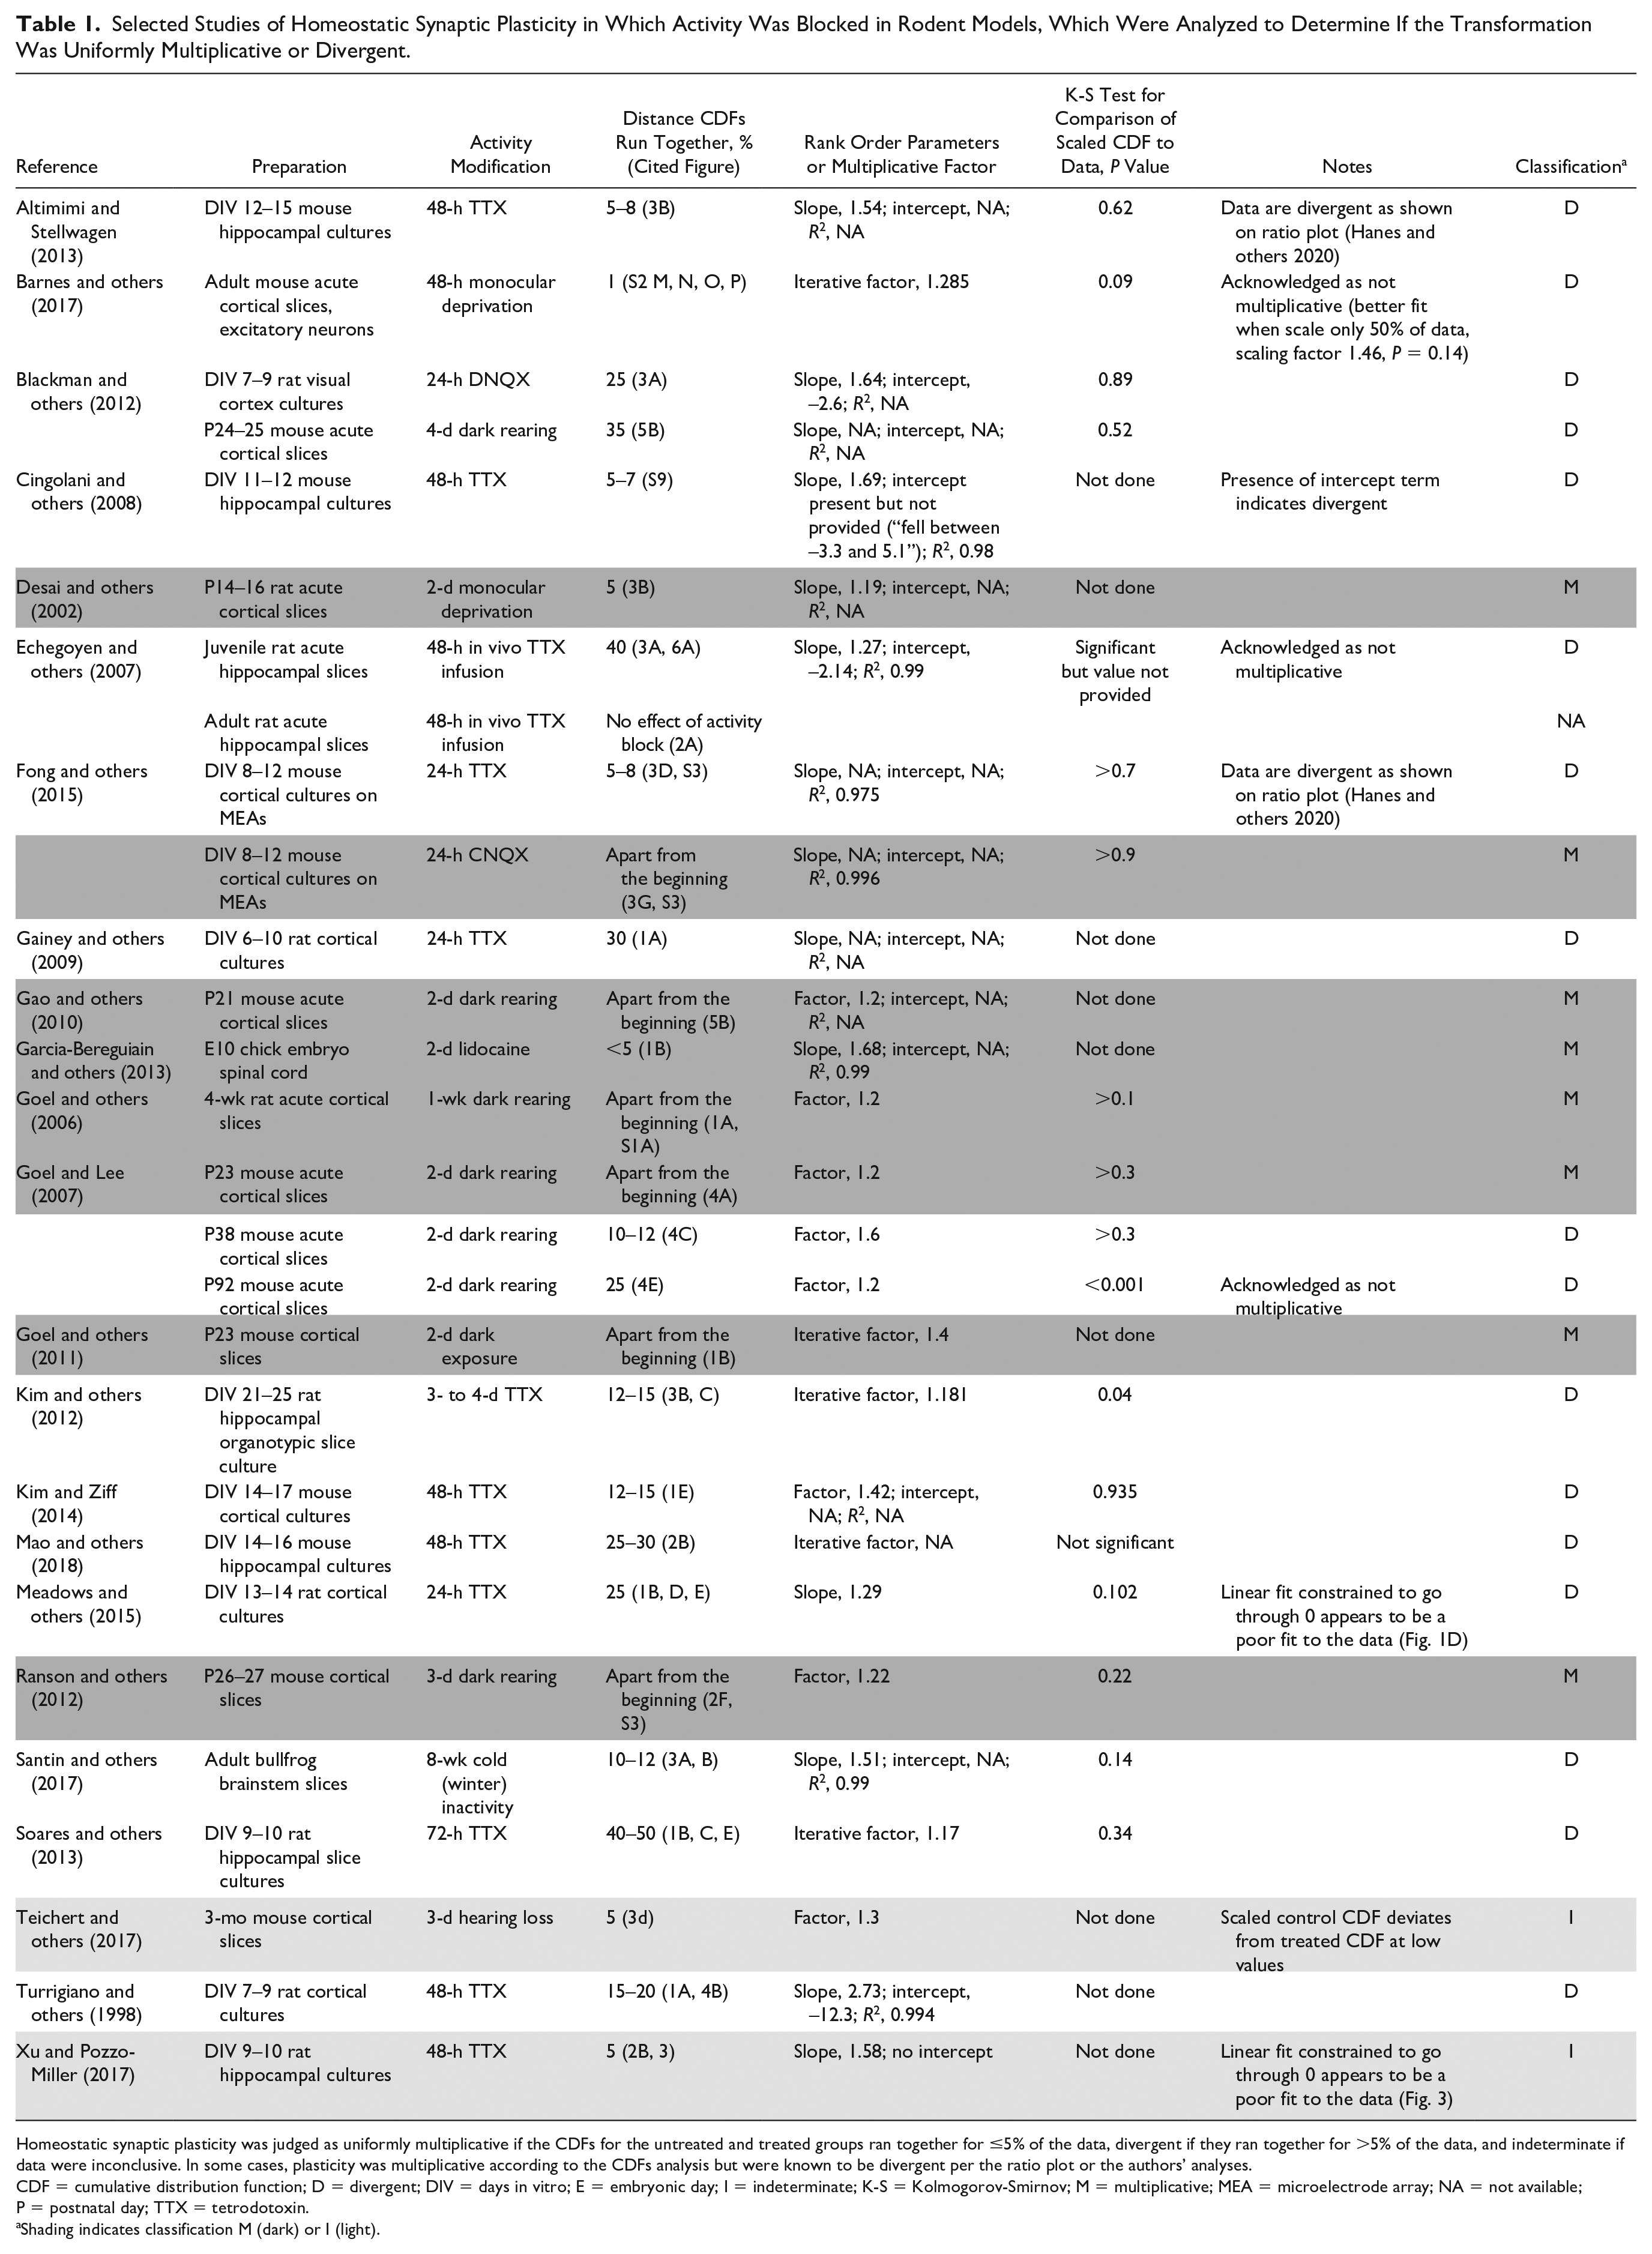
Homeostatic synaptic plasticity was judged as uniformly multiplicative if the CDFs for the untreated and treated groups ran together for ≤5% of the data, divergent if they ran together for >5% of the data, and indeterminate if data were inconclusive. In some cases, plasticity was multiplicative according to the CDFs analysis but were known to be divergent per the ratio plot or the authors’ analyses.
CDF = cumulative distribution function; D = divergent; DIV = days in vitro; E = embryonic day; I = indeterminate; K-S = Kolmogorov-Smirnov; M = multiplicative; MEA = microelectrode array; NA = not available; P = postnatal day; TTX = tetrodotoxin.
Shading indicates classification M (dark) or I (light).
Imaging of Individual Synapses Contradicts the Uniform Multiplicative Scaling Hypothesis
A prediction of the uniform multiplicative scaling hypothesis is that following activity blockade, individual synapses will increase in synaptic strength in proportion to their initial strength. We know of just three studies that have followed individual synapses over time to allow direct examination of this prediction (Minerbi and others 2009; Statman and others 2014; Wang and others 2019). An important and surprising finding is that under normal conditions, in the presence of network activity, individual synapses are dynamically changing, stochastically increasing and decreasing in size and/or intensity of postsynaptic markers (Minerbi and others 2009; Statman and others 2014). Interestingly, the changes in synaptic strength appear to be inversely related to starting characteristics (Minerbi and others 2009; Statman and others 2014). Once activity was blocked, Minerbi and colleagues (2009; see their Fig. 5) found that the inverse relationship was lost, but Wang and colleagues (2019; see their Fig. 6) reported a similar modestly inverse relationship between initial fluorescence and magnitude of fluorescence increase following activity blockade. Minerbi and others (2009) and Wang and others (2019) noted that some synaptic sites actually decrease in size after activity blockade. In sum, there is no evidence from these live imaging studies that individual synapses respond to activity blockade by proportionally increasing synaptic strength.
The inverse relationship between initial strength and changes seen in normal activity and under some experimental conditions after activity blockade seems to contradict not only a uniformly multiplicative scaling process but also a divergent scaling model in which the weakest synaptic sites have the smallest response to activity blockade. However, Statman and colleagues (2014) in their Figure 7A and Wang and colleagues (2019) in their Figure 4A to C illustrated that when the data are not matched for the same site before and after activity blockade but pooled and ranked from weakest to strongest for the control and treated data separately (as done in our physiologic experiments), the CDFs run close together in the low-magnitude range and widen with increasing strength of the control sites (i.e., a pattern suggesting divergent scaling). It is interesting that while these studies use a global activity modification, even those where the activity was decreased at individual synapses by expression of a potassium channel, the Kir2.1 CDF of the GluA1 cluster intensities shows a divergent shift from the control CDF (Hou and others 2008, see their Fig. 2D), suggesting that divergent behavior occurs regardless of paradigm.
While the imaging studies are powerful in that they allow individual synapses to be followed over time, which is not currently possible with electrophysiologic recordings of mEPSCs, there are limitations to the approach. In particular, all of studies cited here used exogenous recombinant synaptic markers to estimate synaptic size or strength. It was shown that overexpression of PSD-95 occludes long-term potentiation (Ehrlich and Malinow 2004) and can cause increases in spine number independent of activity (El-Husseini and others 2000). Therefore, it is possible that modification of synaptic markers to include fluorescent tags alters homeostatic plasticity, making it difficult to make conclusions about the mathematical transformation at the individual synapse level based solely on these types of studies.
Despite the caveats, imaging studies suggest two conclusions. First, divergent scaling is unlikely to be achieved by weak sites failing to respond to activity blockade, as though they are lacking the plasticity mechanism. It is more likely that weak sites arise when a subset of strong sites becomes weak during the treatment period. Said another way, our assumption that the control and treated data pair up by relative strength is likely wrong—the weakest sites do not represent the same synapses before and after treatment. Second, divergent scaling is a population behavior and may not be observable at a single synapse level.
Two key conclusions can be made on the basis of the results that we have to date. First, the stochastic changes in postsynaptic sites in the presence and absence of activity, paired with the consistent macroscopic shift in the distribution in the absence of activity, are reminiscent of other neuronal properties, such as stochastic ion channel openings and closings that sum to predictably voltage-dependent macroscopic currents and probabilistic vesicle release in low calcium that becomes predictably related to calcium concentration at high levels of calcium (resemblance pointed out in Statman and others 2014). This leads directly to the second point: although the idea that a neuron globally controls all of its synapses is not supported by our mEPSC data nor the imaging data, the consistency of the population behavior following activity blockade (and conversely in response to activity) suggests that the population behavior may reflect an important parameter being sensed, just as the voltage is sensed by individual ion channels and calcium influx is sensed by the transmitter release apparatus. It will be interesting to identify what aspect of activity or its absence is being sensed by the microscopic synaptic sites.
Where Do We Go from Here?
The uniform multiplicative scaling hypothesis has persisted in the face of growing evidence against it because a global plasticity process that preserves relative synaptic weights established by prior experience makes such strong intuitive sense. Figure 8A depicts the model of global uniform multiplicative scaling of synaptic strength as a proportional increase in size/strength of all synaptic sites, with small/weak (yellow), medium (green), and large/strong (purple) synapses getting larger by the same factor. However, despite its elegant simplicity, the evidence is overwhelming that the global uniform multiplicative scaling hypothesis is not an accurate depiction of homeostatic synaptic plasticity. Figure 8B illustrates the consequences of divergent scaling, in which the small/weak synapses are not enhanced and the medium synapses are modified with a smaller scaling factor than the large/strong synapses.
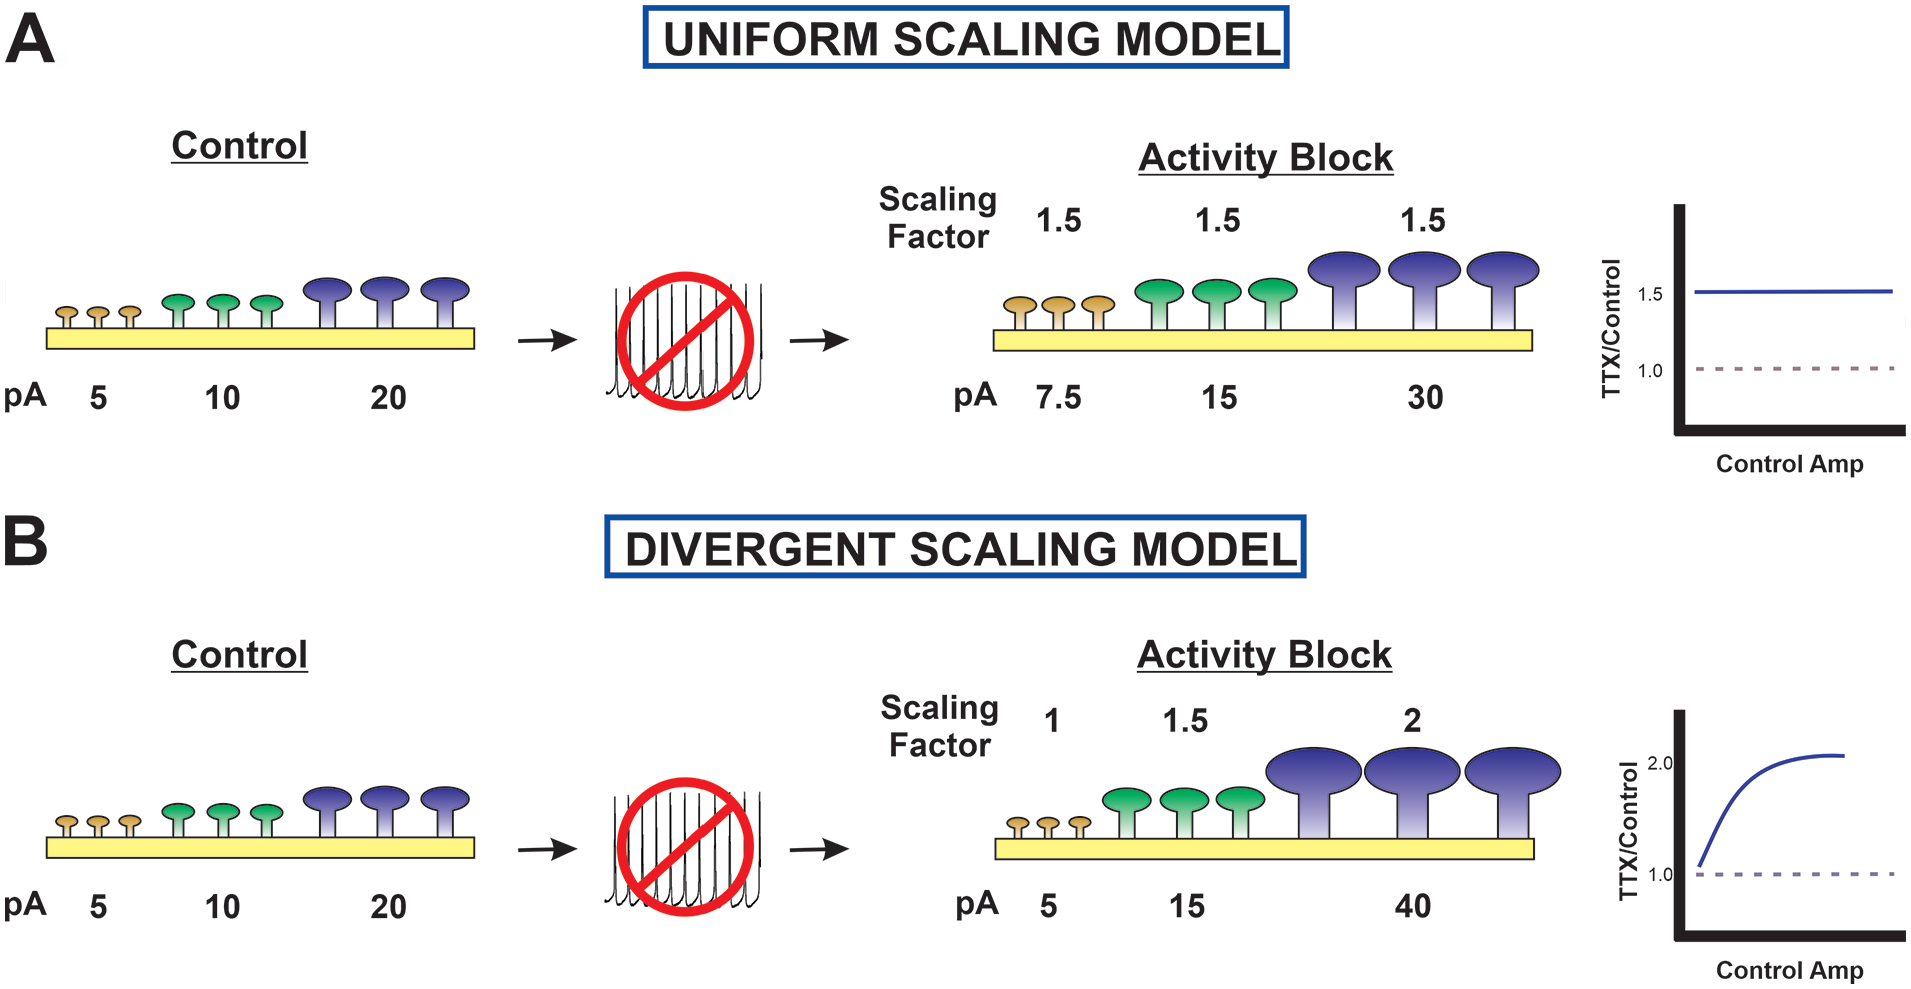
Comparison of uniform multiplicative and divergent scaling models. (A) In the uniform multiplicative scaling model, the size/strength of each synapse is modified by the same multiplicative factor as shown in the ratio plot on the right. For example, control synapses of 5 pA (weak/small, yellow), 10 pA (medium, green), and 20 pA (large/strong, purple) become 7.5, 15, and 30 pA after a uniform multiplication of 1.5. The colors are maintained to follow the fate of each synapse, but after activity block there are no small/weak synapses. (B) In the divergent scaling model, small/weak synapses show little change; the multiplicative scaling factor increases with initial strength/size (see ratio plot on the right); and the sample synapses become 5, 15, and 40 pA due to multiplicative factors of 1, 1.5, and 2, respectively.
The main difference between the originally proposed model of uniform multiplicative scaling and the divergent scaling model is the maintenance of the smallest/weakest synapses after activity blockade in the latter. The three possible ways that the population of smallest/weakest synapses would appear to remain unchanged by activity blockade are illustrated in Figure 9. In the first, no plasticity, the smallest/weakest synapses have no mechanism to respond to a change in activity. They are the same size/strength before and after activity blockade. In the second, de novo synapses, new synapses that arise during the treatment period are the smallest/weakest synapses, and they replace those that have been strengthened following the loss of activity. In the third, stochastic decrease, the smallest/weakest synapses after activity blockade are the result of a decrease in size/strength of larger/stronger synapses. Studies that follow labeled synapses by imaging them over time can provide evidence for the possible source of this seemingly identical pool of smallest/weakest synapses before and after activity blockade. As mentioned, such studies answered the question of whether synapses are modified in proportion to their starting characteristics, finding the opposite result: that the smallest/weakest synapses show the greatest increase; otherwise, the changes of any individual synapse appear to occur stochastically. There is no imaging evidence for small/weak synapses remaining unchanged (see Minerbi and others 2009; Statman and others 2014; Wang and others 2019). Multiple studies have shown that new synapses after activity blockade are the smallest/weakest (Ibata and others 2008; Minerbi and others 2009). Minerbi and colleagues (2009) and Wang and colleagues (2019) have shown a subset of large/strong synapses that become smaller/weaker during the period of activity blockade. It will be important to determine the computational impact of maintaining a pool of the smallest/weakest synapses to the overall behavior of the network, but there is no question that it exists.
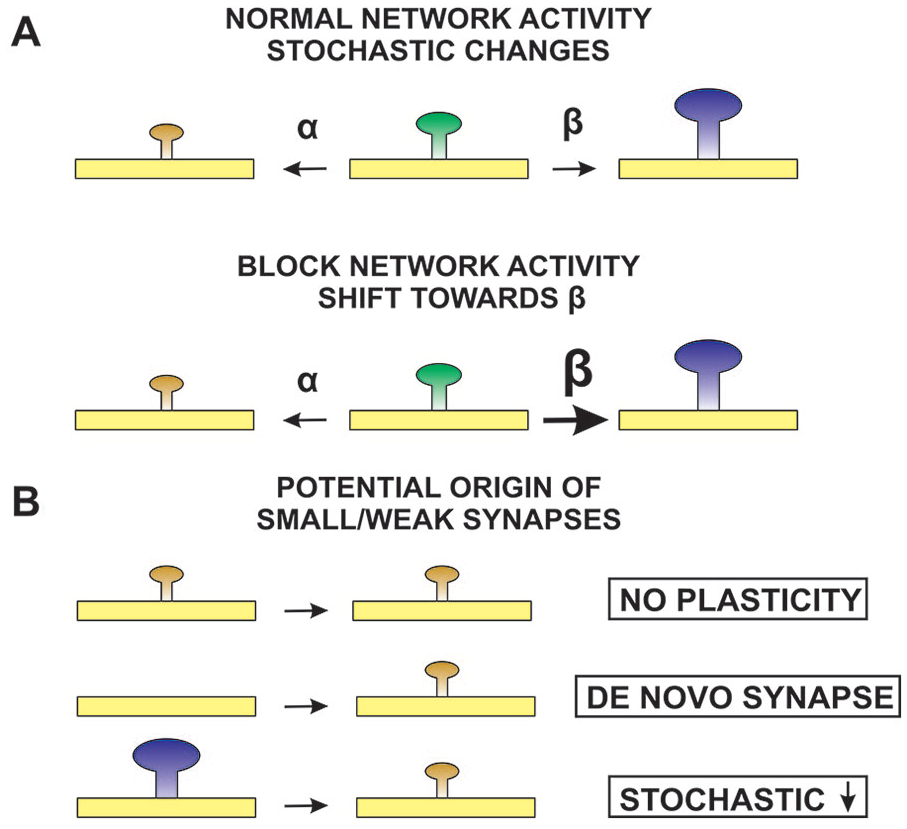
How a population of small/weak synapses could exist following activity blockade. (A, top) In the presence of normal network activity, synapse size/strength varies stochastically, with synapses increasing in size/strength with a rate constant β and decreasing with a rate constant α. Rate constants α and β are balanced, and the distribution of synaptic weights is stable. (A, bottom) When network activity is blocked, rate constant β increases or rate constant α decreases, and the distribution of synaptic weights shifts to higher values. (B) At least three mechanisms could produce a population of small/weak synapses after activity blockade: no plasticity, small/weak synapses lack a homeostatic plasticity mechanism; de novo synapse, small/weak synapses arise de novo during the activity blockade period; stochastic decrease, small/weak synapses could come from stochastic decreases experienced by larger/stronger synapses.
Why Does It Matter Whether Homeostatic Plasticity Exhibits Uniform Multiplicative or Divergent Scaling?
In conclusion, evidence is growing that places homeostatic plasticity at the crux of adaptive responses in health and disease, yet our understanding of the molecular mechanisms of homeostatic plasticity lags behind. Homeostatic plasticity was originally hypothesized to stabilize all synapses within a network to guard against extremes in activity while maintaining the relative synaptic strengths established by other plasticity mechanisms (Turrigiano and others 1998). Despite intense research efforts, its biological mechanism or mechanisms remain unclear, and its physiologic role has not been determined. The number of molecules that have been shown to be required for homeostatic plasticity in dissociated cultures or following dark rearing or monocular deprivation continues to grow. The majority of molecular disruption studies do not directly address whether the homeostatic plasticity being targeted is uniform multiplicative scaling or divergent scaling, often providing just bar graphs of effects rather than CDFs or rank order plots.
We identified 21 articles addressing a molecular mechanism that used the term synaptic scaling and measured mEPSC amplitudes before and after activity modification yet presented no scaling of CDFs or rank order plots fit with linear regression to support that the homeostatic synaptic plasticity was uniformly multiplicative (Table 2). The 7 studies that showed only bar graphs of effects are indicated with no data because the type of scaling cannot be determined. The other 14 articles provided paired CDFs from the wild type or unperturbed controls, so we could estimate whether the homeostatic synaptic plasticity appeared to be uniformly multiplicative or divergent. Again, just a subset (5/14, 36%) had CDFs that ran together for ≤5% of the distributions and therefore might be uniform multiplicative scaling (shaded gray). The remainder (9/14, 64%) were clearly divergent based on the CDFs running together for >5% of the distributions. However, it must again be acknowledged that judging the CDFs by eye rather than performing the ratio analysis leaves us guessing whether one set of molecules is required for uniform multiplicative synaptic scaling and another is required for divergent synaptic scaling.
Studies That Used the Term Synaptic Scaling and Manipulated Molecular Mechanisms but Did Not Use the Rank Order Process nor Scale the CDF Were Analyzed to Determine Whether Homeostatic Synaptic Plasticity Was Uniformly Multiplicative or Divergent.
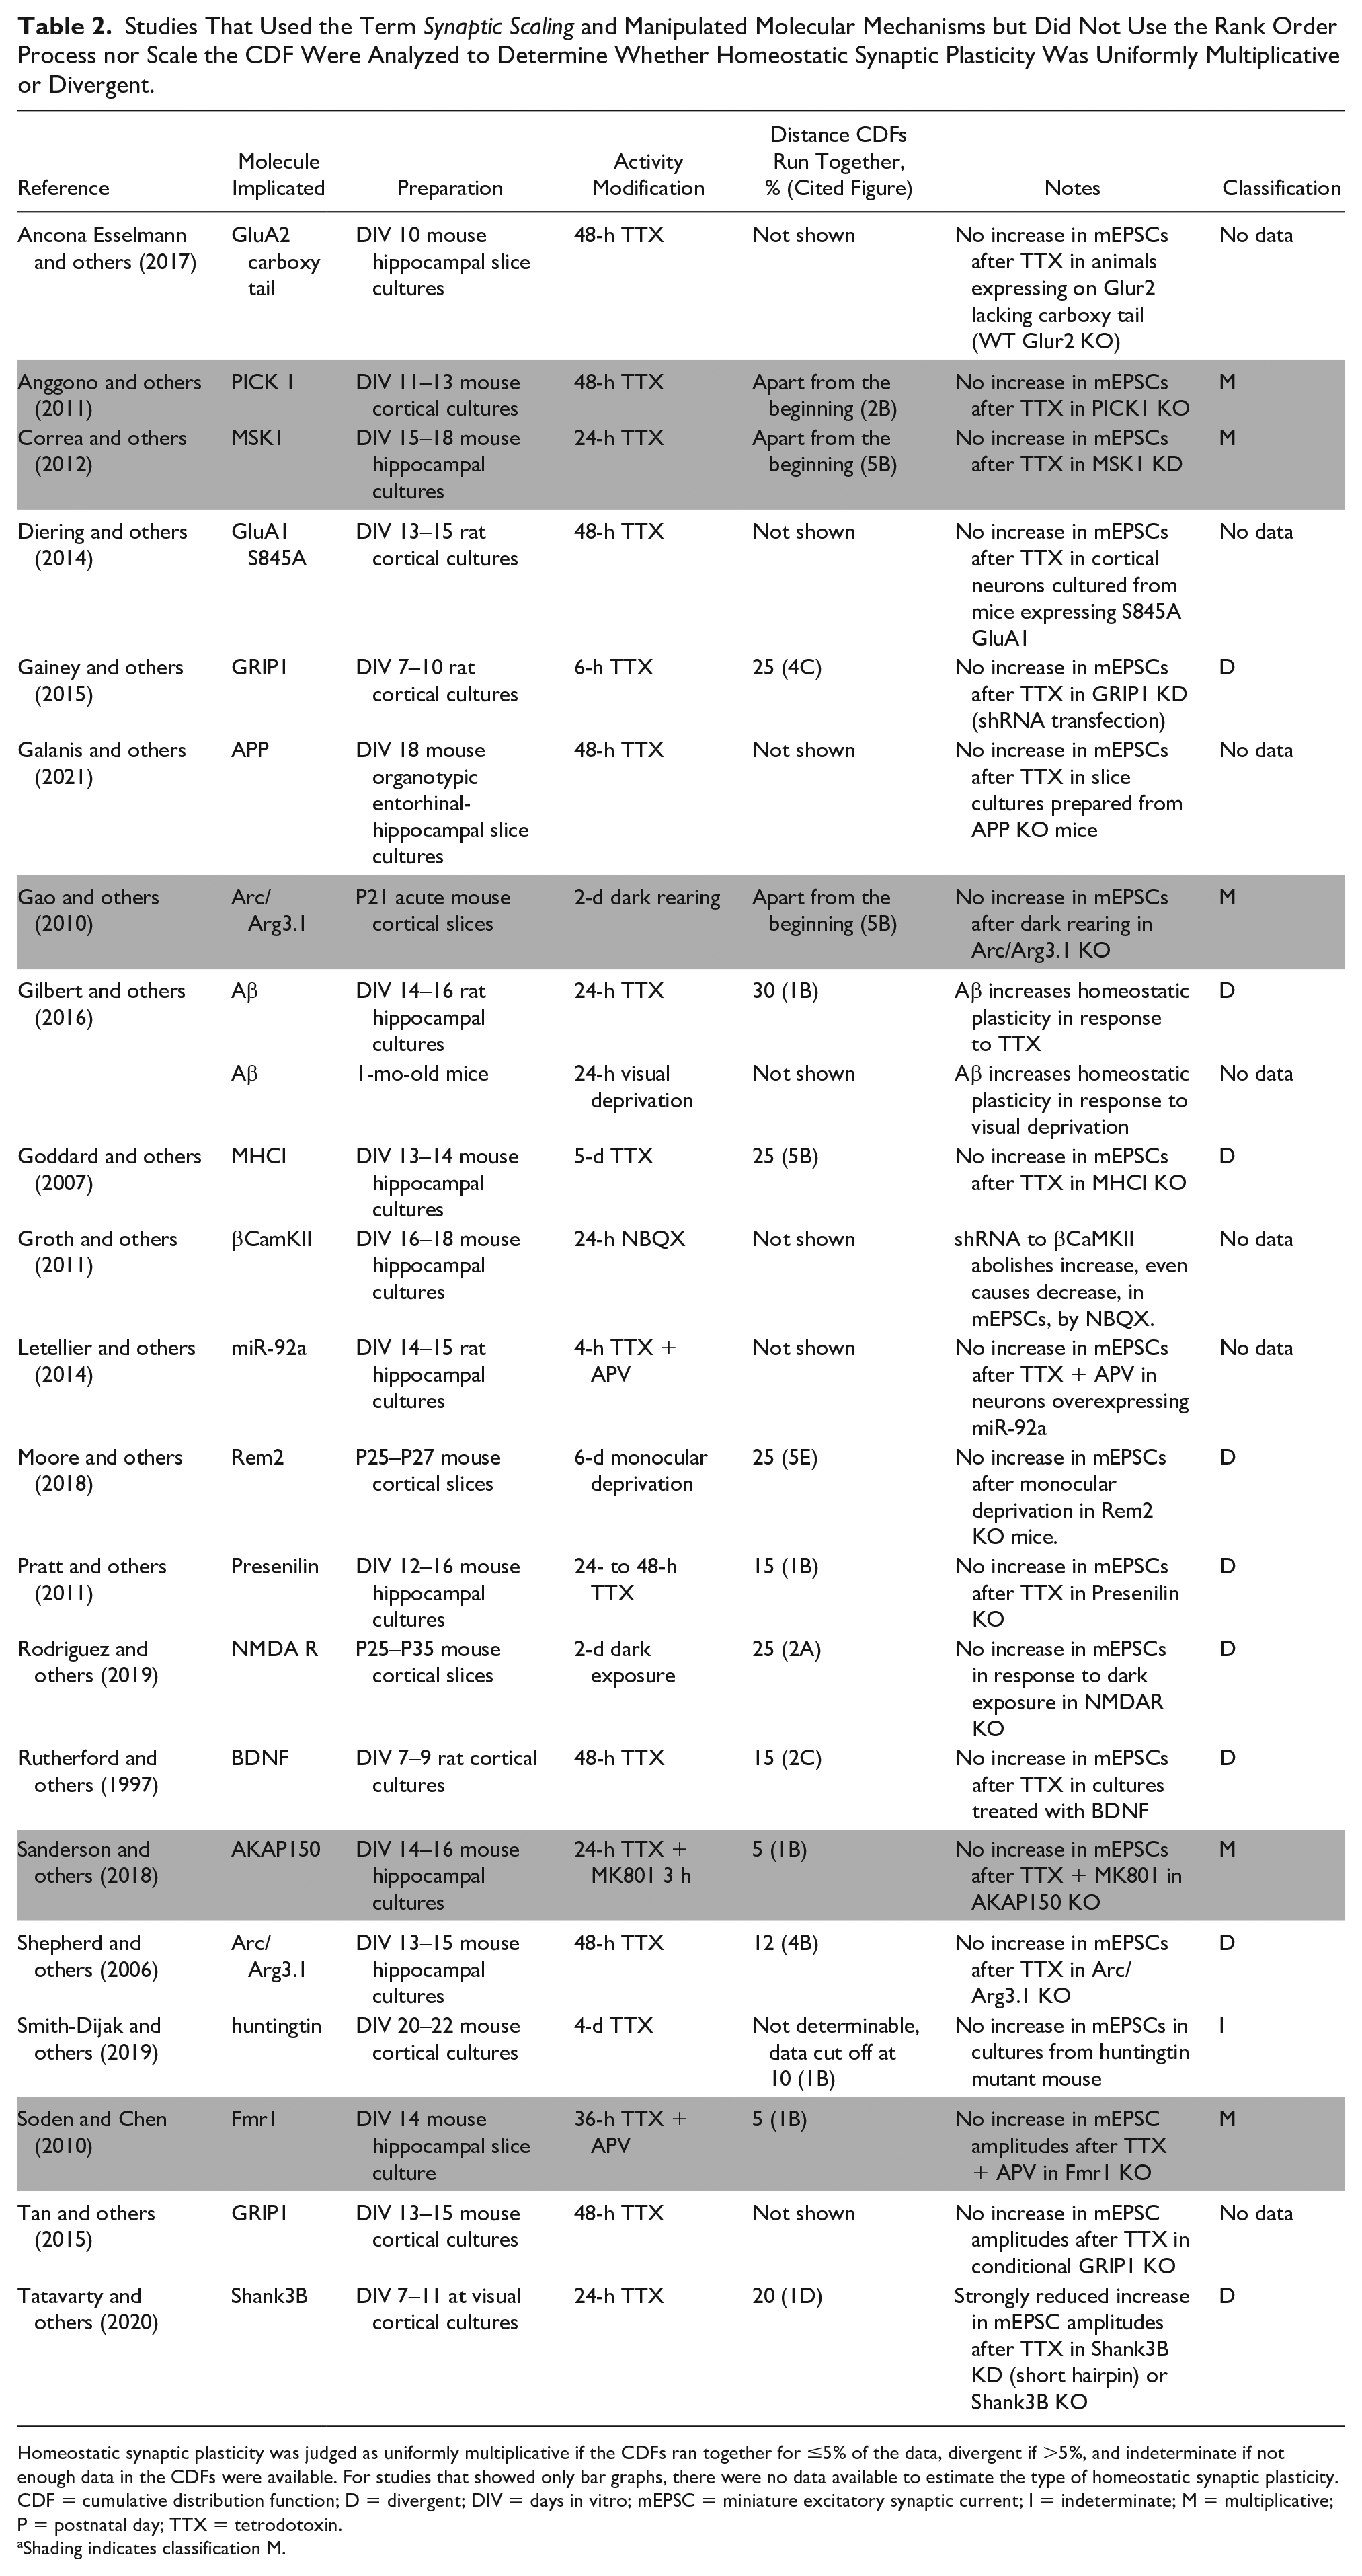
Homeostatic synaptic plasticity was judged as uniformly multiplicative if the CDFs ran together for ≤5% of the data, divergent if >5%, and indeterminate if not enough data in the CDFs were available. For studies that showed only bar graphs, there were no data available to estimate the type of homeostatic synaptic plasticity.
CDF = cumulative distribution function; D = divergent; DIV = days in vitro; mEPSC = miniature excitatory synaptic current; I = indeterminate; M = multiplicative; P = postnatal day; TTX = tetrodotoxin.
Shading indicates classification M.
What we do know, not surprisingly, is that proteins that participate in receptor trafficking are involved in homeostatic synaptic upscaling of mEPSCs, including Arc/Arg3.1 (Gao and others 2010; Shepherd and others 2006), GRIP (Gainey and others 2015; Tan and others 2015), Shank 3 (Tatavarty and others 2020), and glutamate receptors themselves (Ancona Esselmann and others 2017; Kim and Ziff 2014). Other studies have implicated kinase systems that regulate receptor trafficking, including βCamKII, AKAP, and PICK1 (Anggono and others 2011; Groth and others 2011; Sanderson and others 2018). Less understood is the link between activity changes and the modification of receptor trafficking. One possible reason for the slow progress on mechanism is the focus on identifying a global signal. In future studies, we should keep in mind that there are multiple types of homeostatic plasticity, including but not limited to uniform multiplicative or divergent, upscaling or downscaling, and rapidly inducible or requiring chronic treatment. We must also acknowledge that uniform multiplicative scaling is less common and divergent scaling is the norm; that synapse strength is always dynamically changing with or without activity; and, finally, that subtle modification of stochastic increases and decreases in synaptic strength leads to the emergence of the population homeostatic synaptic plasticity response. Only when we keep these complexities in mind will we be able to determine the molecular steps of homeostatic synaptic plasticity, from how activity changes are sensed to the final expression of altered synaptic strength.
Footnotes
Acknowledgements
The authors wish to thank Madison Yancey and Dr Amanda Hanes for their assistance in data presentation.
Declaration of Conflicting Interests
The authors declared no potential conflicts of interest with respect to the research, authorship, and/or publication of this article.
Funding
The authors disclosed receipt of the following financial support for the research, authorship, and/or publication of this article: This research was supported by the National Institutes of Health (P01 NS057228).