
Abstract
Background
Breast cancer (BC) incidence rates for First Nations (FN) women in Canada have been steadily increasing and are often diagnosed at a later stage. Despite efforts to expand the reach of BC screening programs for FN populations in Alberta (AB), gaps in screening and outcomes exist.
Methods
Existing population-based administrative databases including the AB BC Screening Program, the AB Cancer Registry, and an AB-specific FN registry data were linked to evaluate BC screening participation, detection, and timeliness of outcomes in this retrospective study. Tests of proportions and trends compared the findings between FN and non-FN women, aged 50–74 years, beginning in 2008. Incorporation of FN principles of ownership, control, access, and possession (OCAP®) managed respectful sharing and utilization of FN data and findings.
Results
The average age-standardized participation (2013-8) and retention rates (2015-6) for FN women compared to non-FN women in AB were 23.8% (P < .0001) and 10.3% (P = .059) lower per year, respectively. FN women were diagnosed with an invasive cancer more often in Stage II (P-value = .02). Following 90% completion of diagnostic assessments, it took 2–4 weeks longer for FN women to receive their first diagnosis as well as definitive diagnoses than non-FN women.
Conclusion
Collectively, these findings suggest that access to and provision of screening services for FN women may not be equitable and may contribute to higher BC incidence and mortality rates. Collaborations between FN groups and screening programs are needed to eliminate these inequities to prevent more cancers in FN women.
Keywords
Introduction
First Nations (FN) are one of the three population groups recognized in the 1982 Canada constitution as original peoples. 1 According to the 2016 census, they comprised 4.9% of the Canadian population and account for nearly 60% of Indigenous peoples. 2 Their numbers continue to steadily grow due to both natural population growth and changes in self-reported identification. 3 In recent years, cancer incidence among First Nations people has grown at a faster rate than the general population, with breast cancer (BC) being the second most common cancer among First Nations women. 4 While BC incidence is lower or similar among First Nations women in Alberta (AB) than non-First Nations women, it has increased over time and now approaches rates similar to the general population.5,6 This significant increase may be related to changes in modifiable risk factors such as diet and physical activity levels, other determinants of health, or initiatives to improve screening (eg mobile screening). Evidence suggests that First Nations women in Canada have historically been diagnosed with BC at a later stage than non-First Nations women.7–9
Randomized controlled trials have demonstrated that early detection of BC using mammographic screening reduces mortality,10,11 although the extent of the reduction varies widely. Only 37% of First Nations women living in Manitoba between 1999 and 2008 had a biennial mammogram, compared to 59% of the general population. 12 Similarly, a report from Cancer Care Ontario found that between 2007 and 2011 fewer than 60% of First Nations women reported having received a mammogram in the past 2 years, compared to nearly 70% of non-Indigenous women. 13 Women living on-reserve have reported less participation in mammography screening than non-Indigenous women,13,14 even compared with women living in rural areas. 15 These studies found reduced participation in BC screening programs and relied on self-report or administrative data, not service-level data.
The First Nations Information Governance Centre (FNIGC) became an independent, incorporated non-profit-entity on April 22, 2010. But its history can be traced back to 1996 when the Assembly of First Nations formed a National Steering Committee to design a new national First Nations health survey in response to a decision from the Federal Government to exclude First Nations people living on reserves from participating in three major population surveys. FNIGC was formed to strengthen First Nations control and capacity in ethical and relevant processes for research and was the first to adopt a First Nations governed national health survey in Canada. The Alberta Chapter, the Alberta First Nations Information Governance Centre (AFNIGC), was formed as a not-for-profit in 2011. In 2017, AFNIGC in partnership with the Ministry of Alberta Health Surveillance released a Health Trend 16 that reported the percentage of BC in First Nations women in AB as 15.1% vs 14.3% in non-First Nations women between 2006 and 2015, ranking BC as number 1 in the top 10 cancers in First Nations women. In addition, a 2015 AFNIGC report found that First Nations women in AB are diagnosed at later stages of BC (Stages III and IV) in larger proportions than Stages I and II, compared to non-First Nations women. 17
The Alberta Health Services Screen Test program has utilized mobile mammography trailers since 1991 to reach people living in rural and remote areas and has been expanding services to over 25 Indigenous communities on a regular cycle. Figure S2 shows the locations of the 48 First Nations in Alberta with most located in more rural areas of the province. Beyond increasing access to breast screening services, the impact of mobile screening efforts on First Nations women is unknown.
This study was initiated in response to a request from the AFNIGC to evaluate cancer screening as part of their desire to improve cancer prevention in their communities. It was a collaboration between the AFNIGC and AB Breast Cancer Screening Program (ABCSP) to investigate the current status of BC screening service provision for Alberta First Nations women. Using a program-level approach, standardized data elements based on complete reporting, and comprehensive screening program evaluation metrics, the quality and timeliness of screening and follow-up care among First Nations women in AB were compared to non-First Nations women. Specific study objectives were to (1) quantify BC screening uptake and screening outcomes and identify differences in the receipt and the effectiveness of screening services; (2) describe the screening follow-up care pathway, including service wait times, to identify potential inequities in receiving timely and efficient care; and (3) determine time trends in cancer screening and follow-up testing/care.
Methods
Data Sources
This retrospective cohort study linked existing population-based administrative databases from the ABCSP, the Alberta Health (AH) Personal Directory, the AB Cancer Registry (ACR) as well as the First Nations identifying dataset stewarded by the Government of Alberta (AH) to determine screening participation, results, follow-up tests, time to diagnosis, and cancer diagnosis at the individual level and then aggregated by year and age group. The ABCSP is a population-based breast screening “registry” which tracks all eligible individuals in the province from screening, diagnostic follow-up, and diagnosis regardless of where they live. It provides very accurate estimates of program performance metrics.
The ABCSP’s Provincial Cancer Screening (PCS) database houses screening and diagnostic information from 2012 onwards based on data obtained from the AB Society of Radiologists, Screen Test, and AB Health Services (AHS) Diagnostic Imaging centres. The AB Society of Radiologists represents 92% of radiologists practicing in AB, who perform approximately 85%–90% of screening mammography tests in the province. Screen Test operates the mobile units providing outreach services to remote and hard-to-reach AB populations (10%–12% of screening mammography tests). AHS Diagnostic Imaging provides the remainder (approximately 2%–3% of mainly diagnostic mammography). The ABSCP database includes client identifier, dates of mammography tests and results, facility identifier, type of additional exams (ie diagnostic mammograms, ultrasound, and biopsies), performed on women who have abnormal screening mammogram, and their results. It is essentially complete for the timeframe of this study, with the only potential data gap for newcomers to the province as their prior screening history is unknown. This would mainly affect results from the non-First Nations population. The AH Personal Directory is composed of data from all registered AB residents and used to determine screening eligibility. The ACR is responsible for recording and maintaining data on all new primary cancers (stage, method of diagnosis, date, and facility) and all cancer deaths in AB and is integrated into the PCS database with nightly updates.
The First Nations identifiers originated from the AB Health Care Insurance Plan (AHCIP) Adjusted Population Registry as the national Indian Register (IR) was unavailable. From 1969 to 2009, all AB residents were required to register for AHCIP coverage and pay monthly health care premiums to receive insured hospital and physician services. For First Nations individuals registered with the federal government, these premiums were covered enabling the identification of registered First Nations individuals residing in AB. These administrative records are stewarded by AB Health with records only current to 2009, when health care premiums were eliminated. However, since the AHCIP registry population size is very similar to the census data for AB First Nations women, it is an acceptable alternative to the national IR. Based on 2016 Canadian Census data, there was an estimated First Nations population of women aged 45 and older of 15,529 in AB which is very similar to the AHCIP registry population of 13,680 for women aged 50–74 years. The population estimate from the census data is overestimated in part due to including women aged 45–49 and over age 75 years in their summary. In contrast to these First Nations population estimates, the Alberta population of all women 45 years and older in 2016 was substantially larger at 1,254,000. 18
These various data sets were then deterministically linked using the unique client identifier by ABCSP analysts who created aggregated data sets on cancer screening activities for First Nations and non-First Nations populations prior to analysis and only included women eligible for BC screening each year during the project study time period. Study data were available from 2008 to 2018 with some results only available for part of this time period. Individual patients could not be identified in the aggregated data. The First Nations principles of ownership, control, access, and possession (OCAP®) were incorporated in this project through formal training of all study personal in these principles and by not disclosing data or findings to non-First Nations groups without explicit approval from the AFNIGC. These requirements were formalized in a Data Governance Agreement signed by all project leaders. The study outcomes for only routine (not diagnostic) screens are reported using the appropriate time intervals for each outcome based on eligibility criteria including age. The reporting of this study conforms to STROBE guidelines. 19
Study Outcomes
The ABCSP definitions used to measure study outcomes strictly adhered to the Canadian Partnership Against Cancer guidelines 20 with detailed descriptions given in Supplemental Tables S1 and S2. These stringent evaluation metrics are routinely measured and reported for quality assurance and quality improvement purposes by Canadian cancer screening programs. In brief, screening uptake includes participation by eligible individuals of primary screening tests and retention, which is a subsequent primary screening test, by eligible populations as measured by factors such as age, sex, and time (location of resident and proximity to health care facility). Screening effectiveness measures the impact of screening services on cancer outcomes such as the detection rate and stage distribution. Timeliness, as denoted by diagnostic intervals, evaluates access to follow-up tests or diagnosis without delay. The median and 90% completion of the wait times from an abnormal screen to have follow-up tests done or from follow-up tests to a diagnosis are typically reported. Lastly, the abnormal call rate measures the percentage of screening mammograms that are identified as abnormal. Collectively, these measures provide comprehensive, consistent indicators to evaluate key screening program performance components for monitoring and quality improvement. In summary, the study outcomes included screening uptake (participation and retention rates), screening follow-up care pathway (diagnostic time intervals and abnormal call rates), and screening outcomes (invasive cancer detection rates and stage distribution).
First Nations Engagement
It is important to note that in alignment with the Tri-Council Policy Statement 2 (TCPS-2), Chapter 9, for the ethical conduct for research involving the First Nations, Inuit, and Métis peoples of Canada, the results were shared with First Nations researchers and communities, including Elders. This contributed to a better understanding of the trends that were found to exist and possible areas of focus going forward, such as identifying barriers and facilitators to BCS in Alberta First Nations women.
Statistical Analyses
Statistical methods included descriptive tables, scatter plots, and trend analyses. A z-test of proportions for two independent samples without the small sample continuity correction was used to compare the two groups, using pooled standard errors. Standard errors for estimated proportions were used to calculate confidence intervals (CIs) for the participation and retention rates. Analyses were conducted separately for each screening outcome and age group. All analyses were carried out using RStudio v1.1447, Stata 16.0, and Joinpoint statistical software programs.
To ensure possible age distribution differences did not affect the various rates, we standardized them using the 2011 Canadian population for the appropriate age ranges. These are denoted in the figures as All Ages (ASR). For tables with cells having less than 10 values, the numbers are suppressed and replaced with a ‘*’. Data were aggregated over reporting years to ensure sufficient data values in specific categories. Joinpoint trend analyses were used in place of linear regression as a first-order autocorrelation could be incorporated. Comparability tests of the joinpoint models included tests of incidence and parallelism.
Results
The number of women eligible for breast cancer screening (target population) since 2013 for both First Nations and non-First Nations women is given in Supplemental Tables S3 and S4. Not surprisingly, the non-First Nations population of women eligible for breast cancer screening is nearly 40 times that of the First Nations population of women. However, the number of First Nations women who were screened out of the target population is still very large ensuring robust estimates.
Screening Uptake
In the All Ages (ASR) trend analysis of participation rates, the annual percentage change (APC) for the First Nations women was 3.48% (P-value = .004) compared to .71% (P-value = .01) for non-First Nations women (Figure 1). No joinpoints were identified for either group. A test for whether the two APC trends were identical (test of coincidence) was statistically significant (P-value = .0002) implying the trends were different. A test of whether the APCs were similar in terms of their direction and magnitude (test of parallelism) was not rejected at the significance level of .05 but was close (P-value = .0566). For women aged 50–59, non-First nations women had average participation rates from 2013 to 2018 of 65.6% compared to 44.1% for First Nations women, resulting in a difference of 21.5%. This was a similar difference (19.6%) for women aged 60–69, where the average participation rate was 63.9% for non-First Nations women compared to 44.3% for First Nations women over this same time period. For women aged 70–74 years, both groups had lower average participation rates, 56.6% and 31.7% for non-First Nations women and First Nations women, respectively. This resulted in an average difference of 24.9% for these older women from 2013 to 2018. The standard errors were very small (<.01) in large part because our sample size, n, was large so the point-wise 95% CIs were not visible if added to these plots. The ASR participation rates, their standard errors (SEs), and 95% CIs by First Nations status and year are given in Supplemental Tables S5a and S5b. Participation rates over the years 2013–2018 inclusive by age groups. All ages panel represents age-standardized rates.
The retention rates for First Nations women aged 50–67 years were 63.0% and 64.5% for 2013 and 2014, respectively. For non-First Nations women aged 50–67, they were 76.3% and 75.7% for the same two reporting years. This resulted in a difference in the retention rates averaged across the years for 2013–14 of 12.2% lower in the First Nations group than the non-First Nations group (z-test, P-value <.0001). For the reporting years 2015 and 2016, the retention rates for First Nations women aged 50–72 years were 64.8% and 62.4%, respectively. The retention rates for non-First Nations women aged 50–72 years were almost unchanged at 75.5% and 75.2% for 2015 and 2016, respectively. A similar difference of 11.8% in the averaged retention rates was also found, with First Nations women having lower retention rates in these 2 years (Figure 2, z-test, P-value <.0001). The 95% CIs were also not added to this plot as the standard errors were too small and the APC was not estimated due to the limited number of time points. The ASR retention rates by First Nations status and year are given in Supplemental Table S6. Retention rates from 2013 to 2016 inclusive by age groups eligible to return for screening.
Screening Follow-Up Care Pathway
Diagnostic Interval Averaged Over 2008–2014 for Women 50–69 years (Top) and 2015–2018 for Women 50–74 years (Bottom) for Weeks From Abnormal Screen to First Diagnostic Assessment (Target 3 weeks) and Weeks From Abnormal Screen to Definitive Diagnosis (Targets are 5 weeks for No Tissue Biopsy or 7 weeks if Tissue Biopsy Required), by First Nations Status. Standard Errors in Parentheses.

Abnormal Call Rates Averaged Between 2008 and 2018 in Percentages.
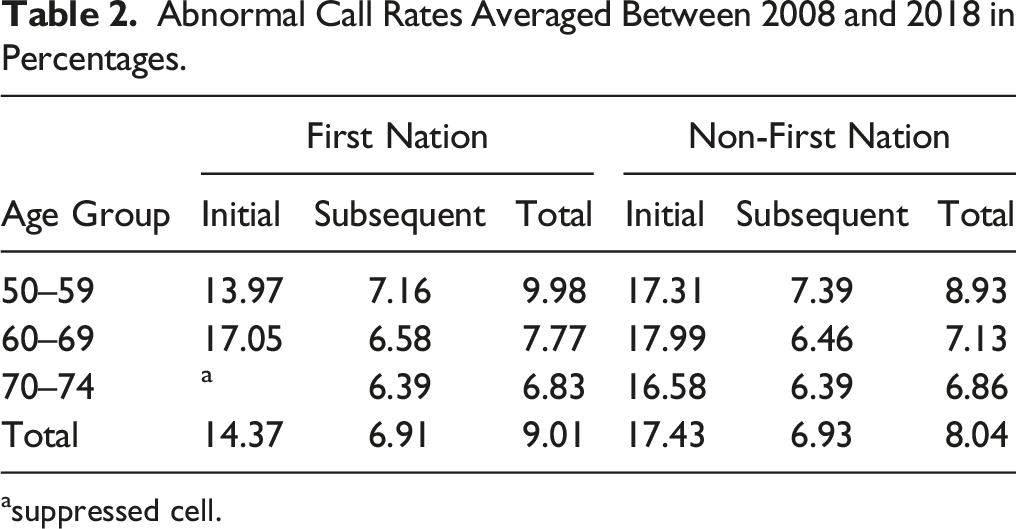
asuppressed cell.
Screening Outcomes
Invasive Cancer Detection Rates and 95% Confidence Intervals per 1000 Women Averaged Over 2008–2015 for Ages 50–69 and 2016–17 for Ages 50–74.

*statistically significant at P-value <.0001.
Counts and Percentages (95% Confidence Intervals) of Invasive Cancer Stage Distribution Averaged Over 2008–2017 With Stages III, IV, and Other Combined.
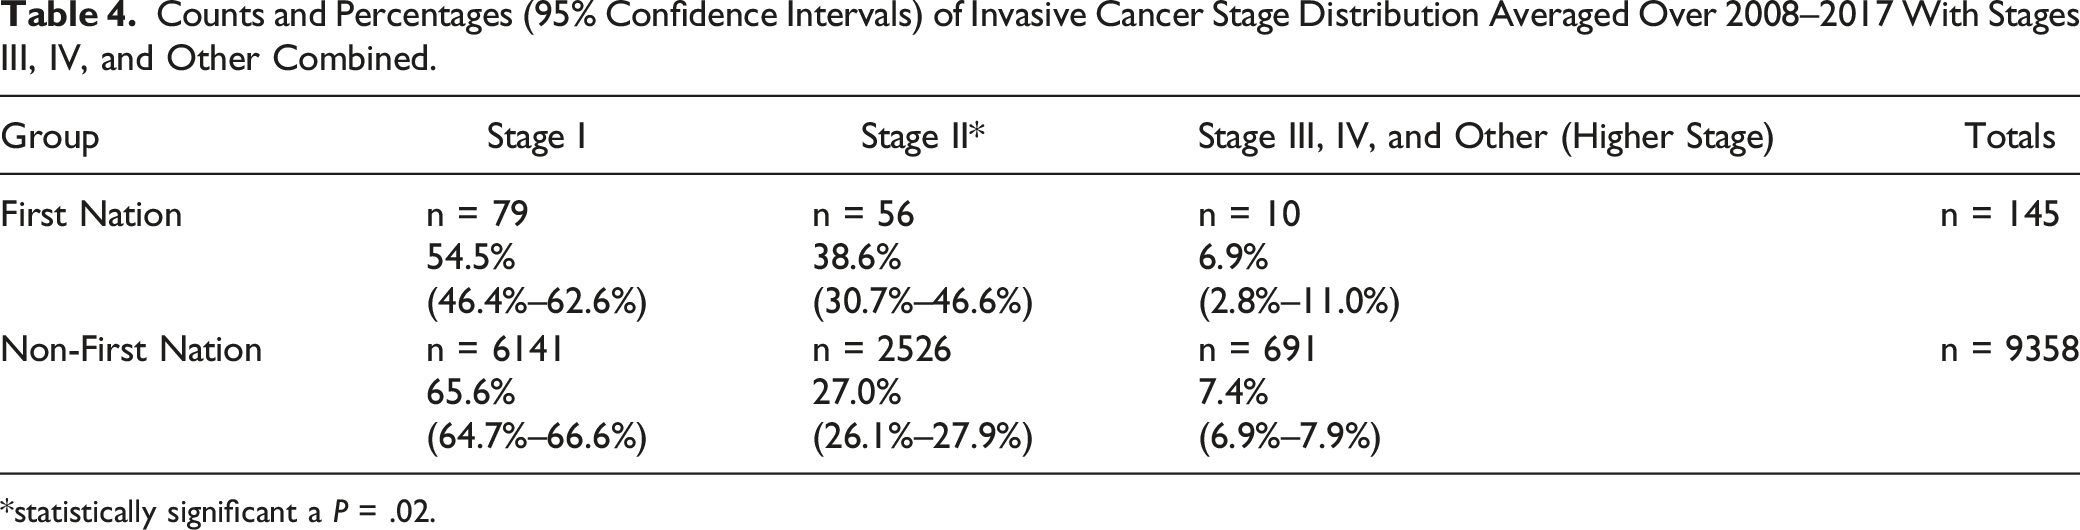
*statistically significant a P = .02.
Discussion
This study is the first of its kind to quantify screening uptake and follow-up care pathways, cancer outcomes, and abnormal call rates among First Nations women with BC in Alberta using population service-level data. Based on rigorous screening performance metrics, comparisons between First Nations and non-First Nations populations revealed both inequities and similarities in BC screening over the same time periods. In addition, this study identified differences in trends in these two populations of women, including notable upward trends in participation rates by First Nations women over time, suggesting this gap is slowly closing. The ABCSP and the mobile screening program made efforts during the study period to engage Indigenous leaders and communities in breast cancer screening. Information resources, such as pamphlets featuring Indigenous people and languages, as well as increasing the numbers of screening sites from 20 to 26 locations were two of the outcomes of these joint efforts. These efforts may have contributed to the increasing trends in the participation rates for First Nations women.
A key finding of this study was the substantially lower participation rate by First Nations women, who from 2013 to 2018 utilized BC screening 19.6% to 24.9% less on average compared to non-First Nations women. This was especially apparent in the 70–74-year age group, where non-First Nations women had an average participation rate 56.6% compared to just 31.7% for First Nations women over this time period. Ensuring access to and participation in organized BC screening programs are important first steps to lowering the stage at diagnosis and mortality from cancer in this population. Further, the participation rate limits the rate of screening retention, which was also lower in First Nations women but by a smaller gap, around 12%. This suggests that following initial enrolment in a BC screening program, First Nations women tend to follow-up at the appropriate intervals with regularity comparable to that of non-First Nations women.
Screening follow-up care is another important component in the BC screening pathway. After an abnormal screen, women are referred for a diagnostic mammogram, ultrasound, or biopsy. National targets for diagnostic intervals when 90% of the women referred for additional tests received them were generally met by non-First Nations women in Alberta from 2015 to 2018. In this same time period, First Nations women did not meet any of the national targets for diagnostic intervals or first diagnostic assessments. In fact, the time to a first diagnostic test and a definitive diagnosis not requiring a biopsy increased slightly from the 2008 to 2014 time period and the time to a first diagnostic test was more than double the 3-week target (6.43 weeks). The time to a definitive diagnosis when a biopsy was required took almost 2 weeks less time from 2015 to 2018 but still exceeded the national target time of 7 weeks by almost 4 weeks.
The proportion of subsequent abnormal call rates was higher for First Nations women aged 50–59 years compared to non-First Nations women, but similar for the other two age groups. The initial and total rates for the other two age groups are also similar. Differences of .5% or lower are not clinically meaningful, even if statistically significant, as there are many other factors that affect these rates, including providers, technology, and patient factors. Lastly, this study revealed more Stage II cancer diagnoses for First Nations women, than non-First Nations women. Both groups were most frequently diagnosed with Stage I disease, but First Nations women had 11.6% more Stage II diagnoses. This pattern could be due to lower participation rates among First Nations women, as screen-detected cancers tend to be most likely diagnosed as Stage I. 21 Lastly, First Nations women had a statistically significant higher cancer detection rate for ages 50–69 from 2008 to 2015 but were similar after 2015 when the screening age group was expanded to include women aged 70–74. Collectively, these findings suggest that access to and provision of screening services for First Nations women may not be equitable and may contribute to increased BC incidence rates at later stages and higher mortality rates.
Previous research carried out in AB and elsewhere has found increasing or even higher incidence and mortality rates of BC in First Nations women than their non-First Nations counterparts. In MB, incidence rates for First Nations women have been steadily increasing while the rates for non-First Nations have remained steady during the time period following implementation of a provincial BC screening program. 12 Although this MB study did not identify any age differences or trends, it found that First Nations women living in urban and rural south locations were even less likely to receive screening. Using the Canadian Community Health Survey (CCHS) pooled data, Withrow et al. (2014) found that the prevalence of self-reported mammograms was lower in the previous two years for First Nations women living off reserve (59.7%, 95% CI = (47.1%–72.3%)) than non-Indigenous women in Ontario (67.9%, 95% CI = (56.8%–69.9%)), although by a smaller amount than the present study. 13 A subsequent study by this research team that combined results from CCHS and First Nations Regional Health Survey also found First Nations women living on reserve had substantially lower uptake of mammography in the past 5 years than both First Nations women off-reserve and non-Indigenous women. 22 Survival following a BC diagnosis also tended to be poorer for First Nations women, potentially attributed to late stage diagnoses 9 and the presence of comorbidities. 23
A specific limitation of this present study is the use of potentially incomplete First Nations identifiers, as in the period following 2009 individuals migrating into AB were not assigned First Nations status. These individuals would be excluded from the analysis, but due to small migration numbers this was unlikely to introduce bias. In addition, the limited and varying follow-up time periods of screening program data may have reduced the generalizability of the results and ability to assess more complex trends. As only age and biological sex were available, more complex analyses adjusting for social determinants of health or residential location (on or away from their First Nations community) could not be conducted. Lastly, there is a scarcity of high-quality published research on this topic, particularly relating to use of objective data and focus on the First Nations population. As such, there is lack of knowledge relating to why gaps in screening outcomes exist and how these shortcomings may be mitigated. Knowing where the gaps are will enable the First Nations people to pursue solutions, although challenges resulting from racism, colonization, dispossession of land, and loss of traditional practices will continue to affect their health, economic, and social disparities. The results from this study may hold in other jurisdictions as these challenges are not unique to Alberta. A strength of this study is the use of program service data based on national standard screening program reporting metrics rather than self-reported or linked administrative data. In addition, the comprehensive evaluation of the full screening program pathway is another strength, as this is the first such analysis to be done in Canada. Lastly, all members of the analytic team were trained in OCAP®, ensuring that the First Nations data were treated respectfully at every step, with appreciation for First Nations ownership, control, and access to their own data.
The data collected during this study provided further evidence of the need to address barriers to screening for First Nations people in Alberta. Emerging as a required next step to develop screening programs with the capacity to impact screening rates among First Nations people, it builds upon previous collaborative partnerships including ‘Culturally Safe Cancer Care Pathways by Alberta First Nations in Rural, Remote and Isolated Communities’ and ‘Alberta First Nations Cancer Prevention and Screening Practices’.24,25 Both projects engaged multiple First Nations partners to identify the current state of cancer care within the province, to identify First Nations-specific cancer care needs, and to create a model and approach for First Nations communities to develop a cancer prevention and screening strategy. Out of this work, the groundwork would then be laid to identify First Nations priorities in cancer prevention and screening based on their own data and indicators for change. For example, interested First Nations communities could use their own data to work with Screening Programs to develop their community cancer screening dashboard that will inform local actions to improve cancer screening. New approaches still need to be co-created with First Nations communities and the ABCSP that address the identified inequities. A continuing Data Governance agreement between AFNIGC and the ABCSP is being generated to enable periodic ongoing surveillance to measure progress at the population level. Other plans include extending this type of evaluation to Métis people in Alberta, so that inequities in cancer screening may be identified and addressed for this distinct Indigenous group.
Conclusions
The main objective of this study was to carry out a comprehensive evaluation of BC screening participation and outcomes of First Nations women in Alberta using population-level data resulting from linkages between several provincial administrative and clinical databases. To date, the magnitude of inequities in BC screening among First Nations women in Alberta has not been quantified. In order to fill evidence gaps in screening uptake and outcomes, trends in screening participation, detection, and timeliness outcomes were examined for women participating in screening programs in AB with and without First Nations status. The results of this study will enable collaborative, evidence-based decisions regarding resource allocation, priority setting by First Nations health leaders, and delivery of targeted interventions in cancer screening services delivery for First Nations women through the ABCSP. Lastly, First Nations people have expressed interest in understanding trends in cancer rates, and thus the results of this study will provide First Nations people with evidence-based knowledge to propose achievable solutions in collaboration with the ABCSP. This novel screening program evaluation will support both First Nations and the ABCSP to close gaps and mitigate barriers to screening with the ultimate goal of improving BC outcomes for First Nations women in Alberta.
Supplemental Material
Supplemental Material - Assessing Breast Cancer Screening and Outcomes Among First Nations Women in Alberta
Supplemental Material for Assessing Breast Cancer Screening and Outcomes Among First Nations Women in Alberta by Angeline Letendre, Brittany Shewchuk, Bonnie A. Healy, Bonnie Chiang, Lea Bill, James Newsome, Chinmoy Roy Rahul, Huiming Yang, and Karen A. Kopciuk in Cancer Control.
Footnotes
Acknowledgements
This project’s leaders are grateful to the First Nations’ Elders, Knowledge Holders, cancer survivors, and community members who shared their knowledge, experiences, and wisdom before, during, and after the completion of this study. We are also grateful to the support from the AB First Nations Information Governance Centre team, Janetta Soup, in particular.
Author Contributions
Conceptualization: A.L., B.H, H.Y., and K.A.K.; methodology: H.Y. and K.A.K.; software: C.R.R. and KAK; formal analysis: C.R.R. and KAK.; resources: B.H., L.B., and H.Y.; data curation: C.R.R.; writing—original draft preparation: B.S. and K.A.K.; writing—review and editing: all authors; visualization: C.R.R.; supervision: H.Y. and K.A.K.; project administration: K.A.K.; funding acquisition: B.H, H.Y., and K.A.K. All authors have read and agreed to the published version of the manuscript. From AHS Screening Programs, the following individuals contributed substantially to our project: Monica Schwann (Director, Screening Programs), Linan Xu (Lead, Analysts), and Maggie Sun (statistician). Lastly, we would like to thank Dr Amy Colquhoun from Alberta Health.
Declaration of Conflicting Interests
The author(s) declared no potential conflicts of interest with respect to the research, authorship, and/or publication of this article.
Funding
The author(s) disclosed receipt of the following financial support for the research, authorship, and/or publication of this article: This research was funded by an operating grant received from the Canadian Institutes of Health Research (Primary Investigators Kopciuk, Yang and Knowledge Holder Bonnie Healy), grant number DAE-162507.
Ethical Statement
Disclaimers
Parts of this publication are based on data and information made available by the Alberta First Nations Information Centre (AFNIGC), on behalf of First Nations people in Alberta. AFNIGC is accountable to all FNs in AB through their governance structure and has communicated these research results accordingly. The analyses, conclusions, opinions, and statements expressed herein, however, do not necessarily reflect the views of the AFNIGC and are solely those of the author(s).
Data Availability Statement
Due to the nature of the research, including the adoption of OCAP® in this project, supporting data are not available.
Supplemental Material
Supplemental material for this article is available online.
Appendix
References
Supplementary Material
Please find the following supplemental material available below.
For Open Access articles published under a Creative Commons License, all supplemental material carries the same license as the article it is associated with.
For non-Open Access articles published, all supplemental material carries a non-exclusive license, and permission requests for re-use of supplemental material or any part of supplemental material shall be sent directly to the copyright owner as specified in the copyright notice associated with the article.