
Abstract
Objectives
This study aimed to investigate the differentiation state and clinical significance of colorectal cancer cells, as well as to predict the immune response and prognosis of patients based on differentiation-related genes of colorectal cancer.
Introduction
Colorectal cancer cells exhibit different differentiation states under the influence of the tumor microenvironment, which determines the cell fates.
Methods
We combined single-cell sequencing (scRNA-seq) data from The Cancer Genome Atlas source with extensive transcriptome data from the Gene Expression Omnibus database. We obtained colorectal cancer differentiation-related genes using cell trajectory analysis and developed a colorectal cancer differentiation-related gene based molecular typing and prognostic model to predict the immune response and prognosis of patients with colorectal cancer.
Results
We identified 5 distinct cell differentiation subsets and 620 colorectal cancer differentiation-related genes. Colorectal cancer differentiation-related genes were significantly associated with metabolism, angiogenesis, and immunity. We separated patients into 3 subtypes based on colorectal cancer differentiation-related gene expression in the tumor and found differences among the different subtypes in immune infiltration status, immune checkpoint gene expression, clinicopathological features, and overall survival. Immunotherapeutic interventions involving a highly expressed immune checkpoint blockade may be selectively effective in the corresponding cancer subtypes. We built a risk score prediction model (5-year AUC: .729) consisting of the 4 most important predictors of survival (TIMP1, MMP1, LGALS4, and ITLN1). Finally, we generated and validated a nomogram consisting of the risk score and clinicopathological variables.
Conclusion
This study highlights the significance of genes involved in cell differentiation for clinical prognosis and immunotherapy in patients and provides prospective therapeutic targets for colorectal cancer.
Keywords
Introduction
Colorectal cancer (CRC) has the third highest incidence and the second highest fatality rate worldwide. More than 1.9 million new instances and 935 000 deaths from CRC are expected in 2020, accounting for nearly 10% of all cancer cases and fatalities. 1 Moreover, in some underdeveloped regions, the incidence of CRC continues to rise rapidly. 2 However, over the last decade, cancer immunotherapy has emerged as a novel therapeutic option, 3 as it is an effective way to treat illnesses, but only few patients benefit from this therapy modality. Moreover, the identification of these patients remains unclear. 4 Novel molecular biomarkers with predictive and/or prognostic significance have become important for improving anticancer therapy and patient outcomes. 5 In recent years, potential biomarkers that play a predictive role in cancer immunotherapy for liver, ovarian, and pancreatic cancers have been discovered, providing new insights for the precise treatment of cancer.6-8 Nevertheless, more effective prognostic markers for CRC and predictors of immune response are still lacking.
Intratumor heterogeneity (ITH) is intimately associated with tumor occurrence, development, and recurrence.9,10 An accurate understanding of the characteristics of ITH in the tumor microenvironment can not only identify predictive biomarkers but also provide potential therapeutic targets. 11 Furthermore, differences in pathogenesis, differentiation status, and therapeutic interventions may lead to the development of new molecular phenotypes. 9 Molecular subtypes help to create homogeneous patient subgroups and reveal the biological processes associated with aggression in each subtype. 12 However, CRC cases remain incompletely categorized, resulting in subtypes with ambiguous molecular definitions, indicating that more molecular typing and investigation of the colorectal genome are required to improve our understanding of CRC biology. 13 Therefore, an in-depth investigation of the heterogeneity of CRC at the molecular level and the discovery of novel biomarkers are important for the clinical diagnosis, successful treatment, and prognosis of CRC patients.
The tumour microenvironment (TME) consists of different types of cells (endothelial cells, fibroblasts, and immune cells) and extracellular components (cytokines, growth factors, hormones, extracellular matrix, etc.).14,15 Tumors develop with changes in the surrounding stroma, which leads to the reprogramming of surrounding cells. This reprogramming is decisive for tumor survival and development, resulting in different states of cell differentiation and cell fates. 16 Recent research has shown that immunological components of the TME may affect tumor formation and act as valuable therapeutic targets. 17 Moreover, various elements of the TME have the potential to influence clinical results, 18 and different therapeutic techniques for distinct cell subsets may be developed by understanding the kinds of tumor-associated cells in the TME. 19 However, because typical molecular profiling studies depend mainly on bulk tissue analysis, the features of various cell populations remain unknown. 20
Single-cell transcriptome analysis is a powerful method for describing cell states and differentiation characteristics. 21 Moreover, single-cell RNA sequencing (scRNA-seq) may be utilized to detect ITH and predict TME interactions. 22 Furthermore, the most malignant subtypes correlated with a poor prognosis may be identified by scRNA-seq clustering combined with signaling pathway analysis, which could provide insights for targeted treatment. 23 Combining TME data with genomic and transcriptomic profiling may help identify individual treatment combinations including chemotherapy, immunotherapy, antiangiogenic therapy, and anti-stromal agents. 18 Previous studies have performed integrated analysis of glioma and gastric carcinoma24,25 by merging scRNA-seq data with The Cancer Genome Atlas (TCGA) transcriptome data. As a result, they established a prediction model based on differentiation-related genes; however, the model did not evaluate CRC.
In this study, we combined scRNA-seq and bulk transcriptomics to explore the differentiation trajectory of CRC cells, classify patients according to the differentiation characteristics of their CRC cells, predict tumor immunotherapy responses and survival, and provide new insights into the clinical diagnosis and therapeutic intervention of CRC.
Materials and Methods
Data Sources and Pre-analysis Processing
The scRNA-seq data were obtained from the Gene Expression Omnibus (GEO, https://www.ncbi.nlm.nih.gov/geo/) database. We used the scRNA-seq data of non-FAP (familial adenomatous polyps) patients from the GSE109308 dataset, 26 which included 624 CRC cells from 7 samples. The data are represented as an M × N matrix (m = 624, n = 24 873), where the columns represent each cell and the rows reflect the expression of each gene. The scRNA-seq data were then processed using R version 4.1.2 software using the ‘Seurat’ package. 27 The proportion of mitochondrial genes was determined using the ‘PercentageFeatureSet’ function. Low-quality cells were filtered out (gene number < 100, sequence number < 50, mitochondrial gene content < 5%). 25 Following data filtration, we normalized the scRNA-seq data using the logNormalize technique and then used analysis of variance to select the top 1500 genes that exhibited significant variations.
Bulk RNA-seq data of 566 CRC samples were obtained from the GEO database (GSE39582, https://www.ncbi.nlm.nih.gov/geo/). 28 These samples served as the validation set for the model developed using the training set of 43 normal and 562 CRC samples obtained from The Cancer Genome Atlas (TCGA, http://cancergenome.nih.gov/). CRC samples from patients with 30-day or less survival, equivocal survival status, or unknown clinical features were not included in the clinical variable analyses.
Dimension Reduction, Cell Clustering, and Annotation
Principal component analysis (PCA) 29 was used with a false discovery rate (FDR) of < .05 to determine which of the available dimensions were significant (P < .05). The top 18 principal components were selected for analysis and were clustered using the t-distributed stochastic neighbor embedding method. Cells were positioned and grouped using the ‘FindClusters’ function in the ‘Seurat’ package and cell criteria were modularized. 30 Marker genes for different clusters were identified using the ‘limma’ package, and the criteria for identification were log2 (fold change) > .5 and FDR < .05. 25 The ‘Singler’ software suite used marker genes as the basis for cluster annotation.
Cell Trajectory Analysis and Colorectal Cancer Differentiation-Related Genes
Cell trajectory analysis of the processed data was performed using the ‘Monocle’ software package. Monocle uses reversed graph embedding to explain multiple unsupervised destiny judgments. 31 Different branches represent different differentiation states. Differential genes exist between different branches. These branch-specific marker genes were identified as CDRGs. 24 The Kyoto Encyclopedia of Genes and Genomes (KEGG, https://www.kegg.jp/) was used to enrich each trace branch in the Gene Ontology (GO) and KEGG pathways, obtain a P-value < .05 after enrichment and explore the biological value of different genes.
CDRG-Based Classifications of Colorectal Cancer Patients From the GSE39582 Dataset
Gene expression data files of CRC patients were obtained from the GEO database (GSE39582). The data were obtained from 566 clinical samples. In this study, 620 CDRGs were identified from differentiation trajectories for CRC molecular typing. The ‘ConsensusClusterPlus’ software program for R gives quantitative and graphical proof of stability for assessing the number of unsupervised classes. 32 We used this package to classify genes with differential cell trajectories, select the best results (k = 3), and divide the 566 clinical samples into 3 clusters according to their genotype. The R software packages, ‘Survival’ and ‘SurvMiner’ were used for survival analysis of the types, and the package, ‘ggplot2’ was used to explore the clinical relevance of the types combined with clinical information and observe whether the clinical traits differed among the different types (P < .05).
Immune Infiltration and the Tumour Microenvironment
The ratio of stromal cells to immune cells in CRC, as well as the immune score, stromal score, and estimate score for each sample were calculated using the ‘Estimate’ software package. Then, combined with the results of subtyping, ‘ggpubr’ was used to analyze the differences in the TME among different clusters. Additionally, the CIBERSORT algorithm 33 was used to evaluate the relative proportion of immune cell types in CRC samples and the outcomes of immune cell infiltration. The relative percentage of each immune cell was divided into high and low score groups and the survival curve of immune cells with P < .05 was drawn using ‘SurvMiner’ and ‘Survival’. Then, ‘limma’, ‘reshape2’, ‘ggplot2’, and ‘ggpubr’ were used to assess the differences in immune checkpoint gene (ICG) expression across various clusters. The ICGs were split into high and low expression groups. Finally, the ‘SurvMiner’ and ‘Survival’ packages were used to draw the survival curves for immune checkpoints with significant differences.
Construction and Validation of Prognostic Models
In this study, the TCGA database was used as the training set, and the GSE39582 database was used as the verification set to construct and validate the prediction model. The CRC transcriptome data and clinical data files were downloaded from the TCGA database, and the clinical trait matrix was obtained using Strawberry Perl (V5.30.0) software. If the variables were regional or categorical, they were converted into the form of a 0-1 matrix (1 indicates belonging to the group or having the attribute, 0 indicates not belonging to the group or not having the attribute). CDRGs in the GSE39582 and TCGA databases were then intersected, and the transcription map was normalized and corrected. Subsequently, we performed a weighted correlation network analysis on intersecting CDRGs and identified key modules associated with survival. We then performed univariate analysis on the differentially expressed genes of the important modules, followed by multivariate Cox regression analysis of the remaining CDRGs to produce a CDRG-based prognostic risk score (RS). The RS for each patient was determined using the expression levels of the prognostic genes in the following formula

In the formula, ‘
The RS of patients in the GEO dataset was determined using risk ratings from TCGA data. The median RS value of patients in each dataset were compared, classified as high- or low-risk, and the Kaplan–Meier survival curve was drawn. The statistical significance of the difference between the 2 curves was evaluated using the bilateral log-rank test, and the receiver operating characteristic (ROC) curve and Kaplan–Meier survival curve were used to verify the prediction model. Univariate and multivariate Cox regression analyses were performed on clinicopathological factors and available gene expression matrices to assess whether risk scores were independently associated with CRC prognosis.
Establishment of Predictive Nomogram
All patients in the TCGA database with CRC had available clinicopathological information, including age and sex. Based on the RS of the training group and clinical data from TCGA, including RS, age, stage, and TNM factors, a nomogram was constructed using the ‘RMS’ package to predict survival. Finally, we drew Kaplan–Meier calibration and ROC curves to estimate the performance and accuracy of the nomogram.
Data Accessibility
The scRNA-seq data of the CRC samples were obtained from the GEO database (GSE109308, https://www.ncbi.nlm.nih.gov/geo/). Additionally, the bulk RNA-seq data of the CRC samples were obtained from TCGA (http://cancergenome.nih.gov/) and the GEO databases (GSE39582, https://www.ncbi.nlm.nih.gov/geo/).
Ethics Approval
Because the data were obtained from databases that were open to the public, ethical approval was not necessary.
Results
Data Quality Control and Cell Trajectory Analysis
The research design is illustrated in Figure 1. The GSE109308 database was used to acquire 624 cells from 7 CRC samples.
26
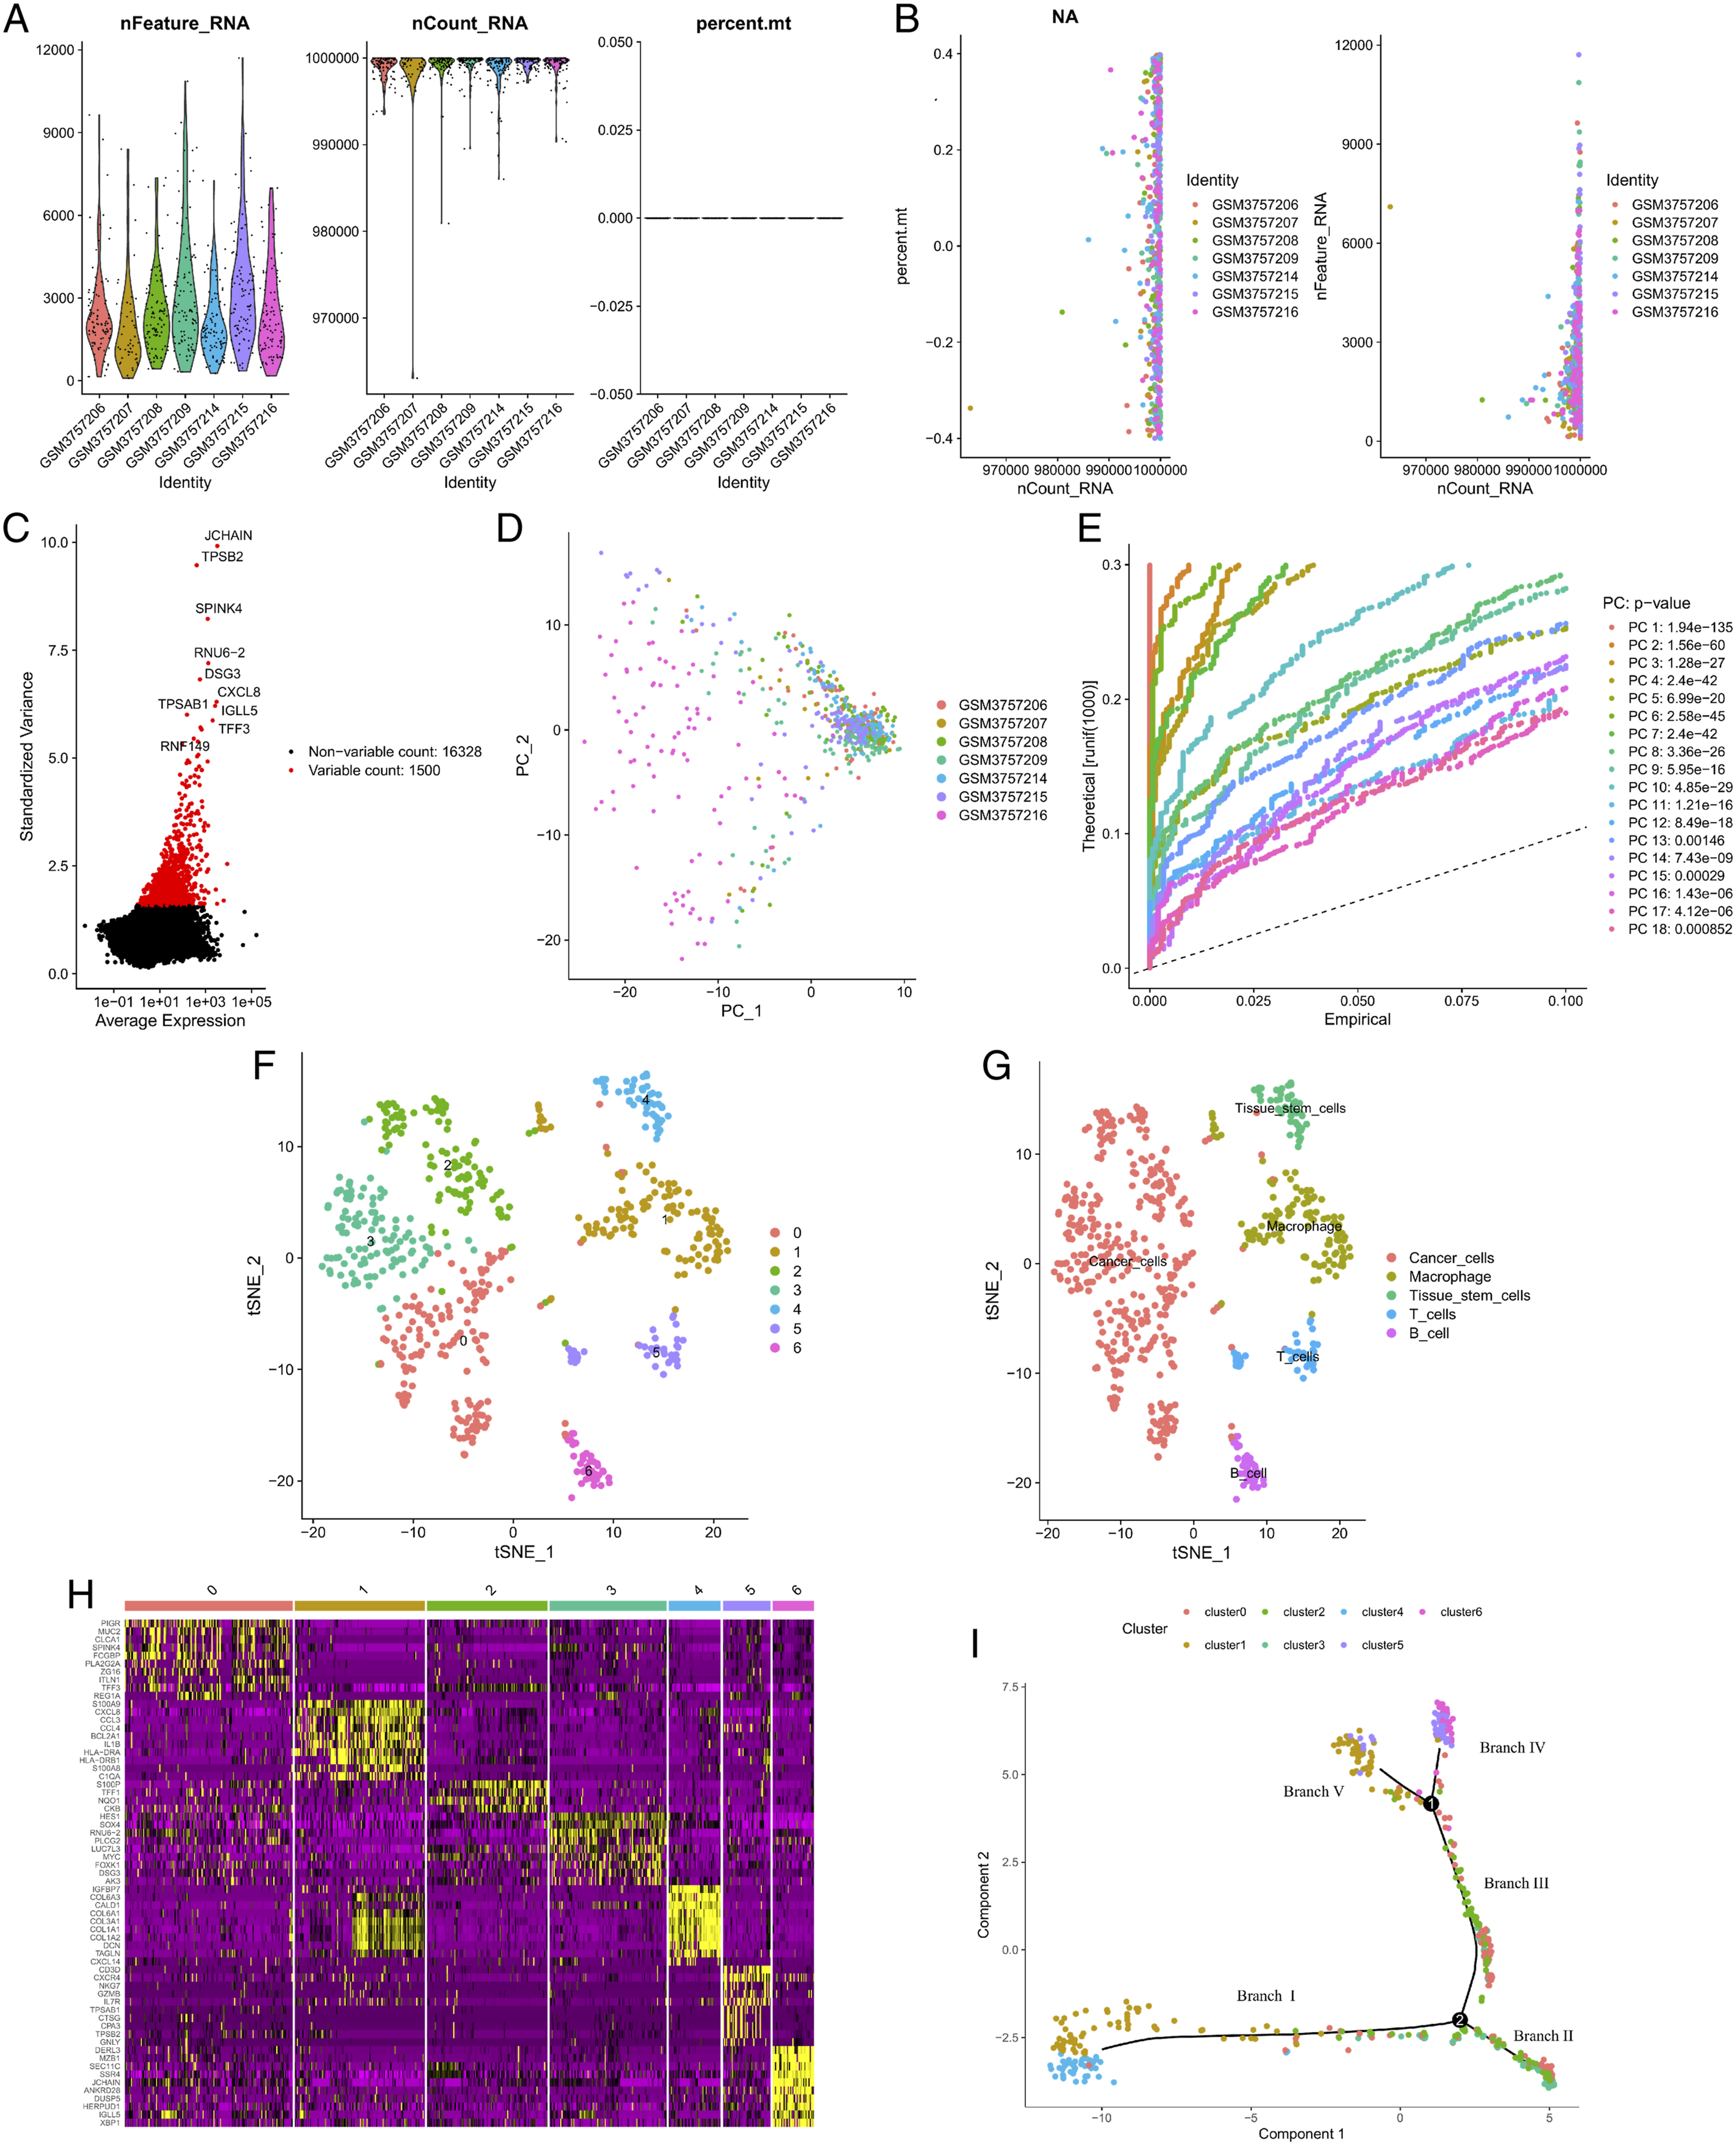
Thus, 624 cells were examined in the subsequent study. Figure 2(a) and Figure 2(b) illustrate the link between the amount of sequencing performed and the mitochondrial gene and overall intracellular sequences. After data sorting, filtering, and standardization, we obtained the 1500 genes with the most significant fluctuations (Figure 2(c)). The PCA results showed no significant differences among CRC cells (Figure 2(d)). These quality control results support the feasibility of subsequent analysis. For the next step of the analysis, the top 18 principal components with statistically significant differences were chosen (Figure 2(e)). The t-distributed stochastic neighbor embedding approach was used to produce single-cell maps of CRC (Figure 2(f)). Cells were divided into 7 clusters, and the ‘FindAllMarkers’ algorithm identified genes that differed between the clusters. Based on the marker genes, 7 clusters were annotated: clusters 0, 2, and 3 represented cancer cells; cluster 1 represented macrophages; cluster 4 represented tissue stem cells; cluster 5 represented T cells; cluster 6 represented B cells (Figure 2(g)). The ‘FindAllMarkers’ algorithm detected 1440 clustered differential genes; the heat map (Figure 2(h)) only shows the differential genes that ranked in the top 10% of the clusters. Then, we performed pseudo-time and trajectory analyses on the cells and found that clusters 1/4 were allocated to branch I, clusters 0/2/3 were in branches II and III, clusters 5/6 were allocated to branch IV, and clusters 1/5 were allocated to branched V (Figure 2(i)). The research design diagram. Data quality control and cell trajectory analysis. (A) After quality control and log-normalization of the data, 624 cells from 7 CRC samples were retained. (B) Correlation of sequencing depth, total cellular sequences, and mitochondrial gene sequences. (C) A total of 24 873 genes were included, and 1500 genes with a high degree of variation were selected for subsequent analysis. (D) PCA based on scRNA-seq data. No apparent separation was shown. (E) In principal component analysis, the first 18 principal components (P < .05) were retained. (F) The t-distributed stochastic neighbor embedding algorithm was applied to divide the cells into 7 clusters. (G) The cell types of the 9 clusters were annotated. (H) The ‘FindAllMarkers’ algorithm detected a total of 1440 clustered differential genes; the heat map only shows the differential genes that ranked in the top 10% of the clusters. Yellow indicates high expression. (I) Cluster distribution corresponding to cell differentiation trajectory.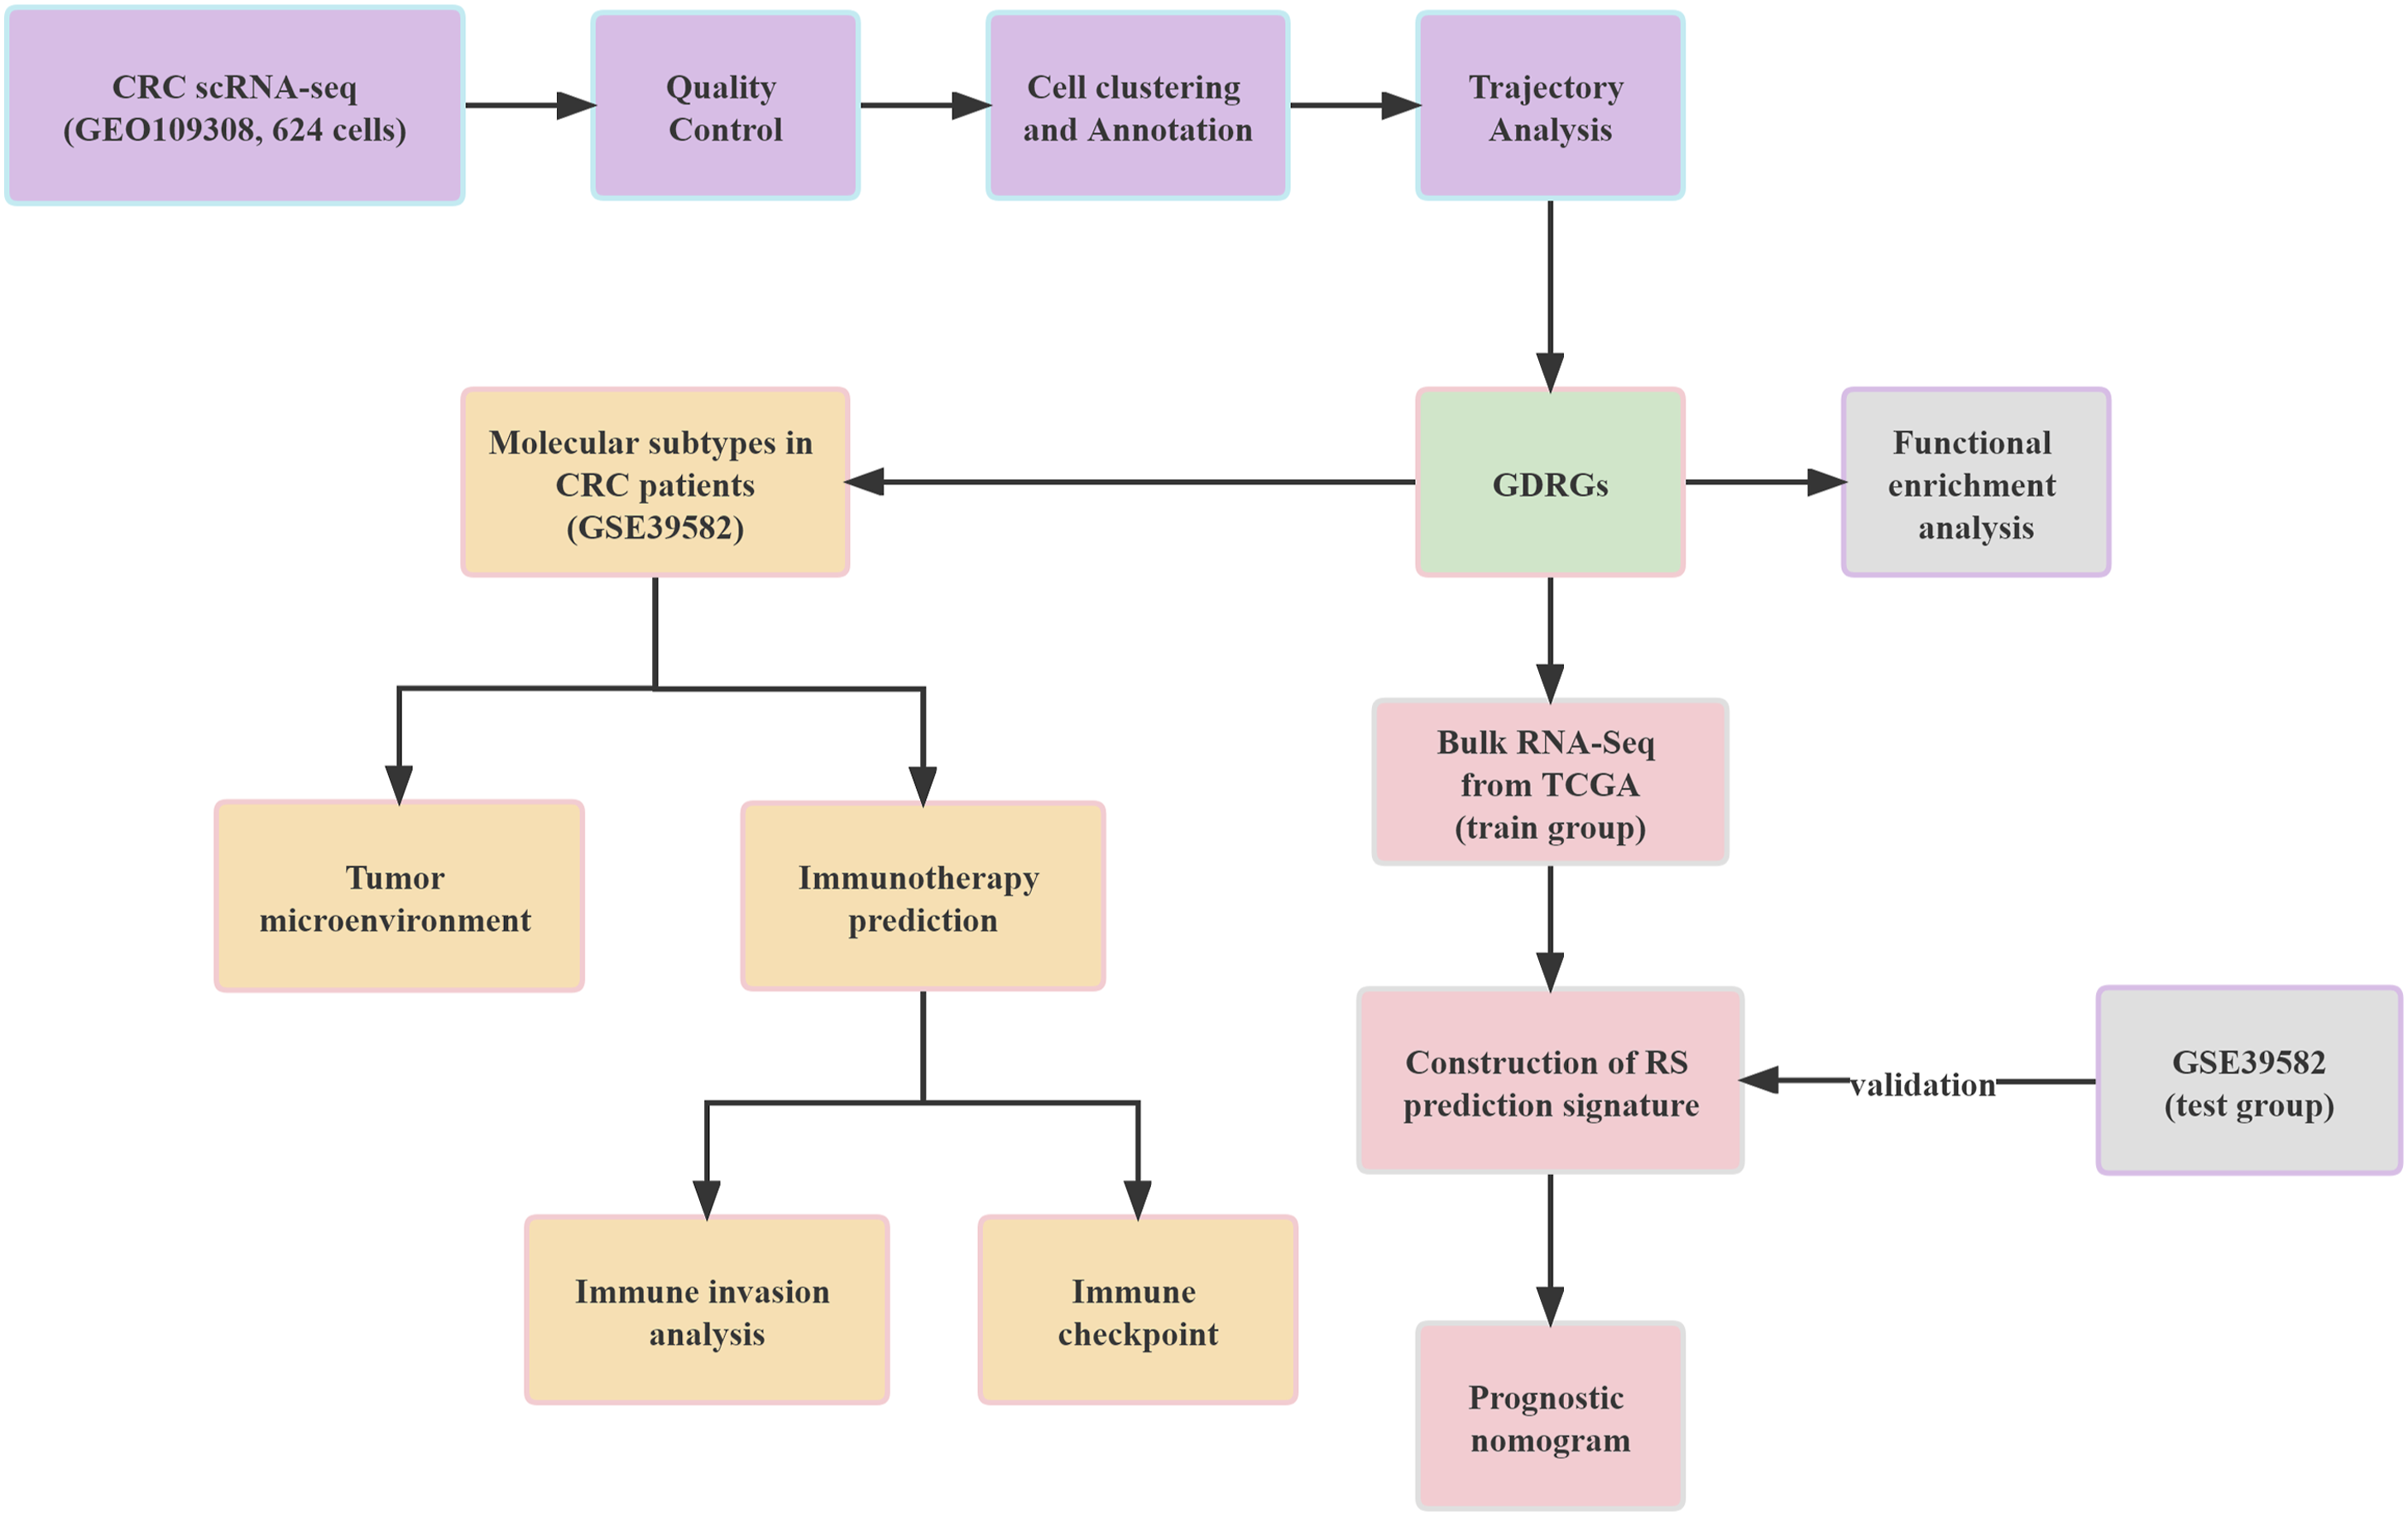
Functional Enrichment Analysis of the Five Branches
In this study, branch-dependent marker genes of the 3 subsets were identified as CDRGs. After differential analysis, 203, 242, 80, 180, and 209 marker genes were identified as branch I, II, III, IV, and V CDRGs, respectively. Based on gene enrichment analysis, we found that the CDRGs of branch I were involved in angiogenesis regulation. CDRGs of branches I/III were related to extracellular matrix formation and collagen fiber organization. The CDRGs of branches II/IV/V were closely related to the immune-inflammatory response. Finally, branches I/II/III were associated with protein metabolism pathways (Figure 3). Functional enrichment analysis of the 5 branches based on CDRGs. (A–B) Enrichment analysis for the branch I genes. (C–D) Enrichment analysis for the branch II genes. (E–F) Enrichment analysis for the branch III genes. (G–H) Enrichment analysis for the branch IV genes. (I–J) Enrichment analysis for the branch V genes. Molecular subtypes in patients with CRC based on CDRGs.
We performed consensus clustering on the GSE39582 dataset based on CDRGs, and all CRC samples (N = 566) were divided into 3 molecular subtypes (C1, C2, and C3). The cumulative distribution function (CDF) curve showed that the optimal number of clusters was 3 (k = 3), and the overall area under the CDF curve increased only slightly (Figure 4(a)–(c)). According to the results of Kaplan–Meier analyses, subtype C1 had the lowest overall survival (OS) rate, followed by subtype C2, while subtype C3 had the best OS (Figure 4(d), P = .028). The survival curves of the different subtypes were significantly different, indicating that patient categorization based on these CDRGs may be useful in predicting OS. The I/V, II/III, and IV branches followed the same trends of up- and down-regulation as subtype I (C1), II (C2), and III (C3), respectively (Figure 4(e)–(i)). These trends indicated that C1 was composed of branches I and V, C2 was composed of branches II and III, and C3 was composed of branch IV. Figure 4(j) shows the distribution of clinicopathological characteristics among the 3 different clusters (P-values for N and T stages were .017 and .012, respectively). Molecular subtypes in patients with CRC based on CDRGs. (A) CDF curves (k = 2-9). (B) Consensus clustering matrix for k = 3, which was the optimal cluster number in the GSE39582 dataset. (C) Relative change in the area under the CDF curve (k = 2-9). (D) Kaplan–Meier analysis of the 3 molecular subtypes. (E–I) The I/V branch followed the same trend of up- and down-regulation as C1. The II/III branch followed the same trend of up- and down-regulation as C2. The IV branch followed the same trend of up- and down-regulation as C3. (J) The distribution of clinicopathological features among the 3 different molecular subtypes.
Tumour Microenvironment and Immune Invasion Analysis of Molecular Subtypes
The TME score showed that the immune/stromal scores of C1, C3, and C2 decreased in turn, and the corresponding tumor purity increased in turn. (Figure 5(a)–(c), all P < .05). We determined that 22 immune cell types were present in each sample, and in the bubble chart in Figure 5(d), the various colors correspond to distinct cell types. Figure 5(e) depicts the variance in the invasion densities of these 22 immune cell types across the 3 subtypes. Among them, memory B cells, neutrophils, and CD4 memory-activated T cells were related to OS. Interestingly, these 3 cells were highly infiltrated in C3 (Figure 5(e), all P < .05). Kaplan–Meier analysis demonstrated that OS increased with the infiltration density of CD4 memory-activated T cells (Figure 5(f), P < .05). Higher neutrophil and B-cell memory infiltration densities were associated with poorer OS (Figure 5(g)–(h), P < .05). (A–C) The microenvironment of the 3 molecular subtypes of tumors. (D) Difference analysis diagram of immune cells; different immune cells are represented by different colors. (E) Differential analysis of immune cells across the 3 molecular subtypes. (F–G) Survival analysis of immune cells (P < .05).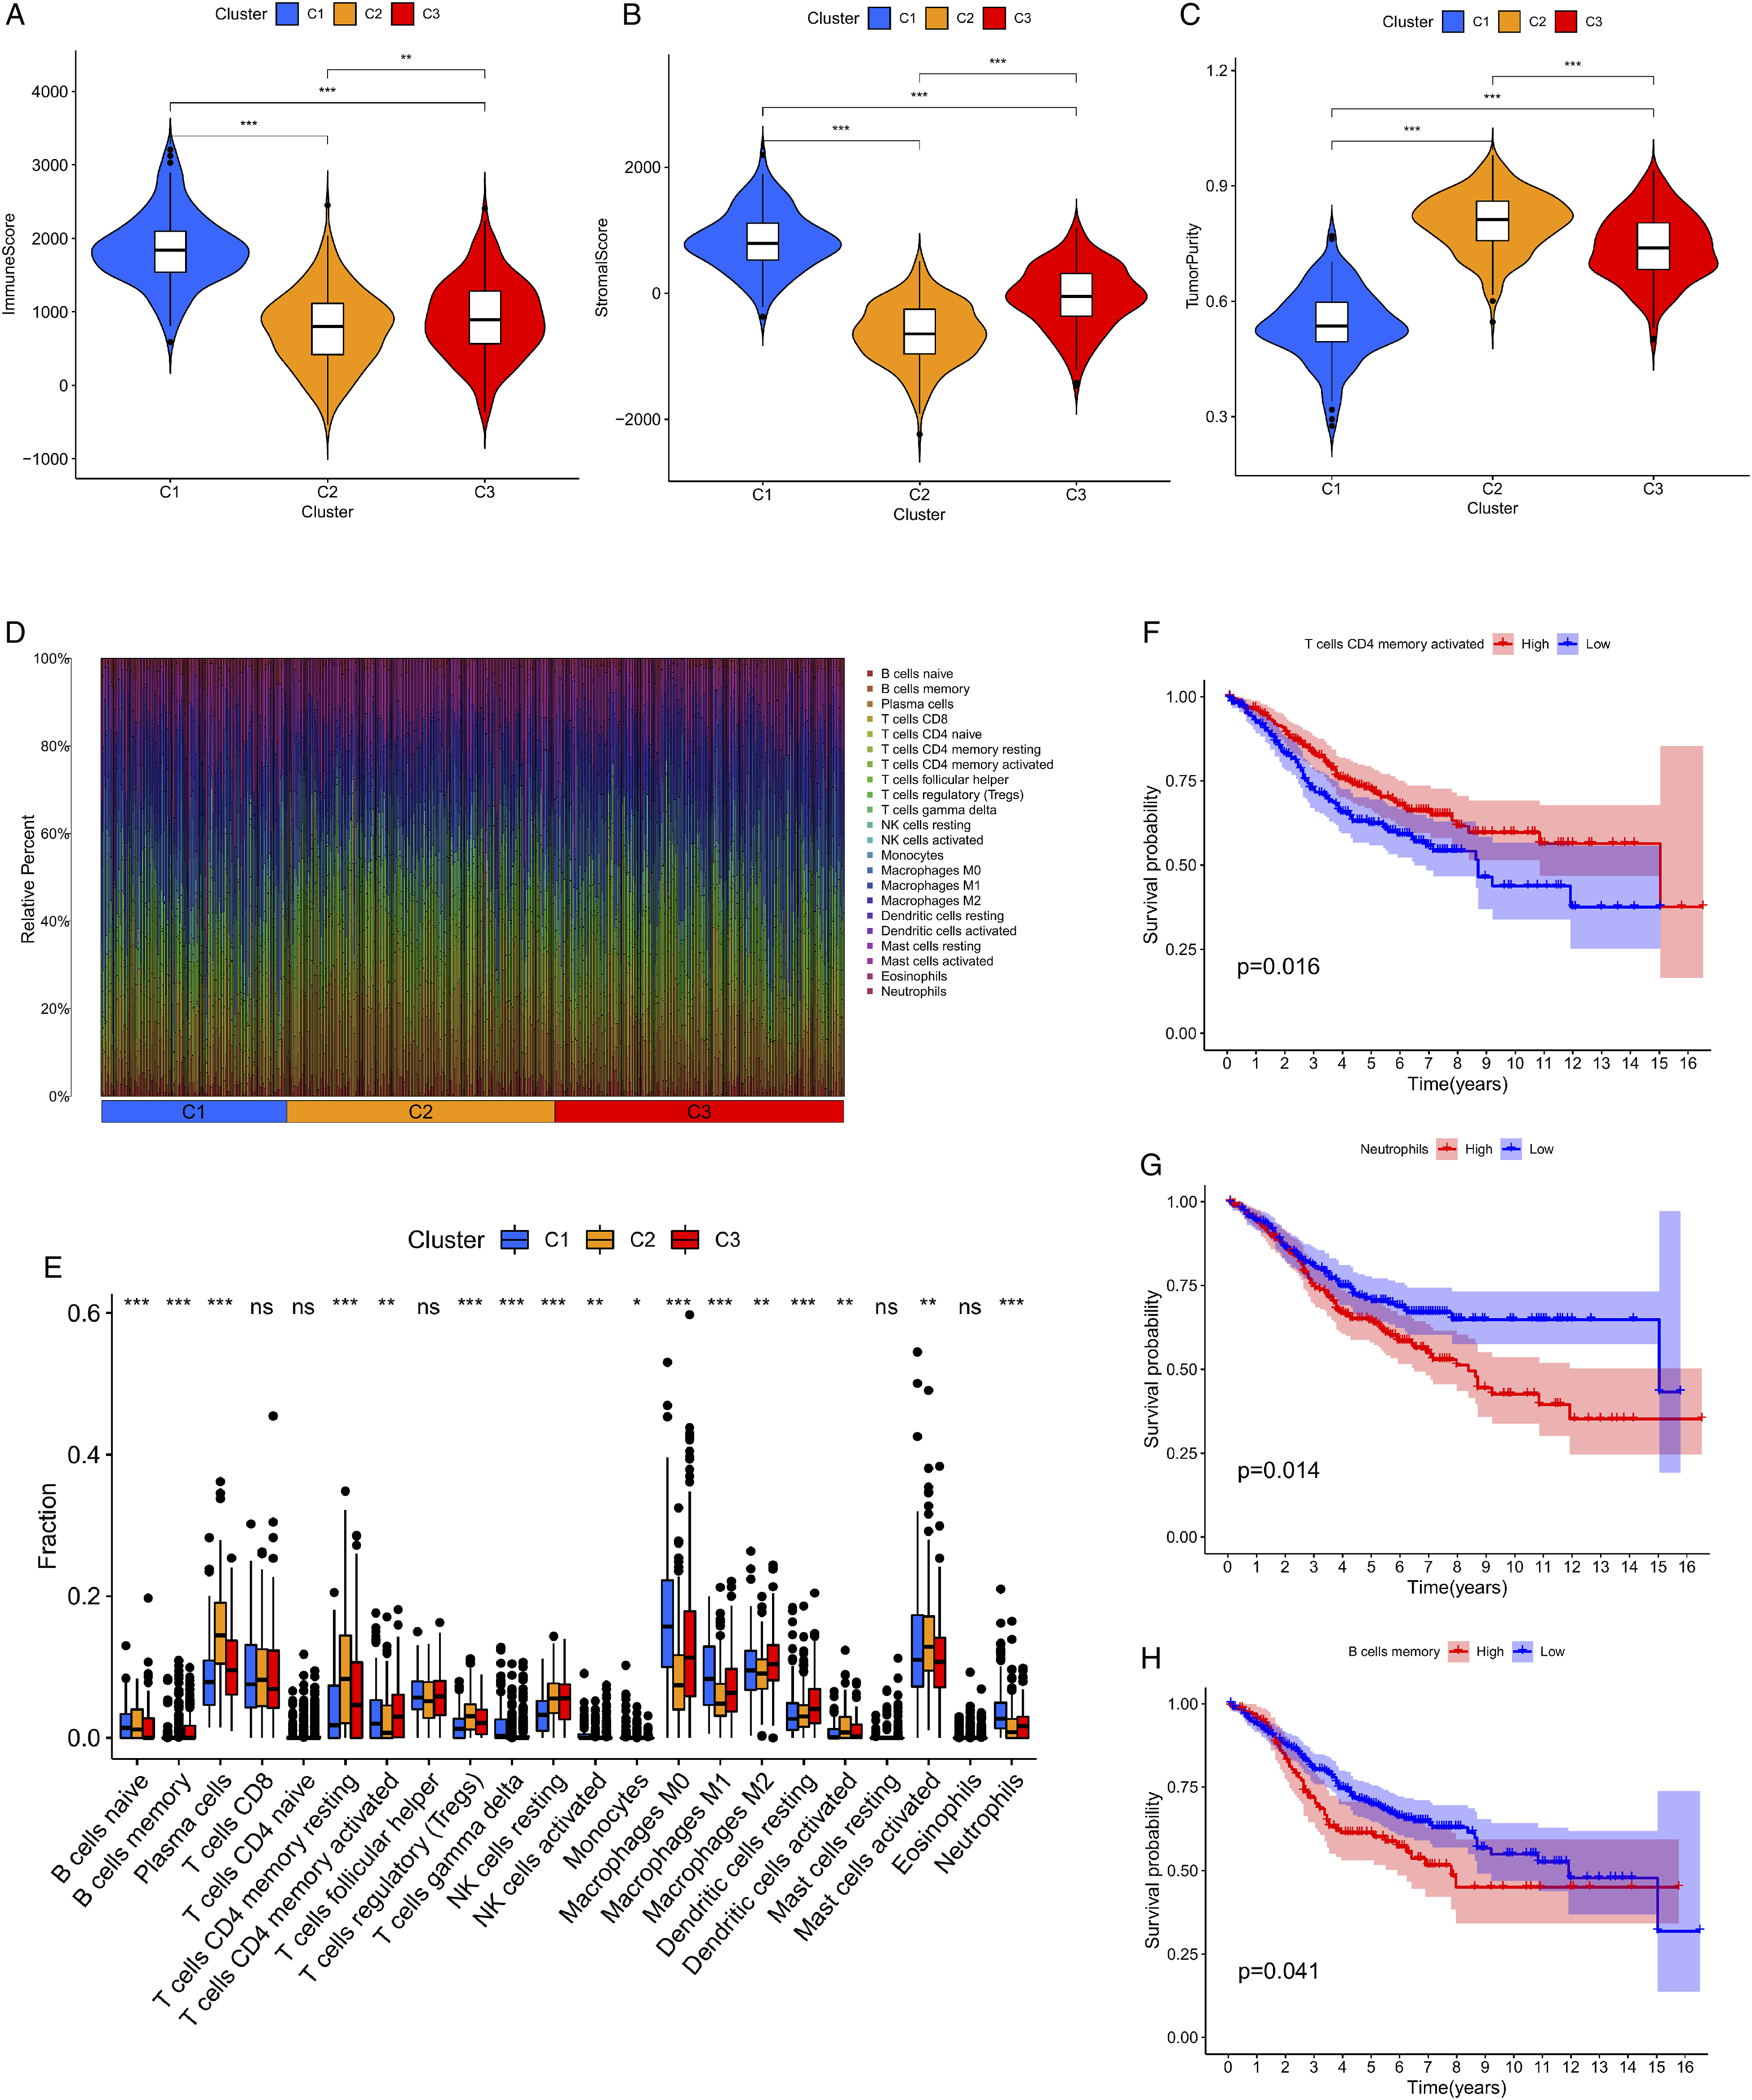
From prior research, we collected a total of 38 ICGs.
25
ICGs with significant differences among the different types are shown in Figure 6(a). We found that 8 ICGs (PVR, PD-1 (PDCD1), LGALS9, LDHC, LAMA3, ICOSLG, FGL1, and CD40LG) were significantly highly expressed in C2 (Figure 6(a), all P < .05). Two ICGs (YTHDF1 and LDHB) were significantly highly expressed in C3 cells (Figure 6(a), all P < .05). Additionally, 22 ICGs were significantly highly expressed in C1 tumors (Figure 6(a), all P < .05). Importantly, Kaplan–Meier analysis revealed that upregulated CTLA4 (P = .035), ICOS (P = .018), LGALS9 (P = .026), and IL12 A (P = .039) were correlated with better OS. In contrast, high expression of JAK1 (P = .009) and VTCN1 (P = .016) predicted worse OS (Figure 6(b)–(g)). (A) Differential analysis of immune checkpoints across the 3 molecular subtypes. (B–G) Survival analysis of immune checkpoints (P < .05) PD-1 (PDCD1), and PD-L1 (CD274).
Establishment of a Prognostic Model
To establish a prognostic model based on CDRGs, we combined a large amount of transcriptome data from TCGA to perform a clinical correlation analysis and screened prognostic genes in relevant modules. We identified the intersection of CDRGs from TCGA and the GSE39582 cohorts. All 579 CDRGs at this intersection were included in the weighted correlation network analysis. The CDRGs were divided into 3 modules with an optimum power value of 3 (Figure 7(a)). We then selected the blue modules closely related to survival time for follow-up analysis (Figure 7(b)). We identified 121 differentially expressed genes in the blue module (Figure 7(c)). Using univariate analysis, 15 prognostic CDRGs were identified and incorporated into multivariable Cox regression analysis (Figure 7(d)). A prognostic RS signature that included 4 CDRGs was established. Based on the relative coefficients of each gene and the level of gene expression, we calculated the RS using the following equation: RS = (.584211853836928 × expression of TIMP1) + (−.159781548561726 × expression of MMP1) + (−.236573249214328 × expression of LGALS4) + (−.0679959793384008 × expression of ITLN1). The RS was determined for each CRC sample in TCGA and GSE39582 cohorts. The Kaplan–Meier curves demonstrated that OS was much greater in the low-risk group than in the high-risk group (Figure 7(e), TCGA, P < .001; Figure 7(f), GSE39582, P = .013). The areas under the ROC curve for predicting OS at 1, 3, and 5 years were .671, .690, and .729, respectively, for the TCGA cohort (Figure 7(g)). Those of the GSE39582 cohort at 1, 3, and 5 years, were .551, .607, and .573, respectively (Figure 7(h)). Figure 7(i) depicts the expression levels of the 4 CDRGs in the 7 clusters. TIMP1 increased in cluster 1/4 (branch I), MMP1 increased in cluster 1 (branch I), LGALS4 increased in cluster 0/2/3 (branch II/III), and ITLN1increased in cluster 0 (branch II/III). (A) The CDRGs were divided into 3 modules with an optimum power value of 3. (B) Modular diagram for weighted correlation network analysis. (C) Differentially expressed CDRGs in 3 modules. (D) The 15 prognostic CDRGs were further identified by univariate analysis. (E) Survival analysis of the training group (P < .001). (F) Survival analysis of the test group (P = .013). (G) Receiver operating characteristic curves of the training group. (H) Receiver operating characteristic curves of the test group. (I) Distribution of model genes in the single-cell atlas.
Establishment and Evaluation of the Nomogram
Univariate analysis was performed on TCGA cohort, and the results showed that patient prognosis was simultaneously affected by age, TNM stage, and RS (Figure 8(a); all P < .05). Age, T stage, and RS were independent predictive factors of CRC, as shown by multivariate analysis (Figure 8(b); all P < .05). Three prognostic factors were included in the nomogram for predicting 3 and 5-year OS based on TCGA cohort (Figure 8(c)). The 3 and 5-year OS calibration curves were consistent with the observed values (Figure 8(d)). These findings indicate that the prognostic nomogram for predicting OS was accurate. (A) Analysis of RS and clinicopathological features using a univariate model. (B) Analysis of risk score and clinicopathological features using a multivariate model. (C) Nomogram for predicting the prognosis of CRC patients based on the TCGA training cohort. (D) Calibration curve of the nomogram for predicting 3 and 5-year OS.
Discussion
CRC varies on several levels, resulting in varying prognoses and therapeutic responses, even among tumors with the same TNM staging. 34 These distinctions highlight the necessity for effective classification tools to stratify types of CRC to determine the appropriate therapy modality and prognosis. At present, the most commonly used colon cancer classification method consists of the 4 molecular subtypes integrated by Guinney et al. 35 However, some samples with mixed features remain unclassified by this method. The rise in single-cell sequencing has facilitated the study of tumor heterogeneity, and its application has contributed to the mining of cancer molecular subtypes.23-25,36 This study revealed the differentiation trajectory of CRC, identified differentiation-related genes using single-cell sequencing data, and further explored the heterogeneity of CRC from the perspective of CRC cell differentiation trajectory. We developed a molecular phenotype based on CDRGs that can predict patients' OS and immunotherapy reactions.
Numerous studies have demonstrated that significant intratumoral heterogeneity in CRC contributes to disease progression and poses a great challenge in developing effective therapeutic strategies.11,13,37,38 Previous studies have identified angiogenesis as a dynamic and complex process that is inseparable from the progression and metastasis of CRC. 39 Metabolism and immunity influence the TME and play an important role in tumor heterogeneity.40,41 According to the findings of this study, cellular differentiation trajectories may demonstrate the heterogeneity of CRC and are associated with metabolic, angiogenic, and immunological pathways. This suggests that the differentiation of CRC cells may be related to angiogenesis, metabolism, and immunological responses inside the tumor. Drugs can be used to block angiogenesis and interfere with the main metabolites, such as bile acids. Additionally, corresponding immunotherapy drugs can be selected based on the immune responses, which will provide more effective and precise treatment for CRC patients.
Based on the CDRGs identified in this study, CRC was divided into 3 subtypes. Using TME ratings, immune infiltration status, and ICG expression, we provided a reasonable explanation for the differences in OS and clinicopathological characteristics associated with the various subtypes. Consistent with earlier research, we discovered that CRC patients with low neutrophil infiltration and high T cell CD4 memory-activated infiltration had a better prognosis.42-45 However, neutrophils have been linked to a better prognosis in other studies.46,47 Thus, more studies are necessary to provide an explanation for the biological role of these immune-infiltrating cells in CRC. Immunotherapy for cancer includes checkpoint inhibitors and adoptive cell therapy, which modify and instruct the immune system to detect and target cancer cells. 48 Cancer immunotherapy medicines, including anti-PD-1 mAbs pembrolizumab, nivolumab, and anti-CTLA-4 mAb ipilimumab, are FDA-approved cancer immunotherapy medications that have improved the lives of many patients with CRC, highlighting the great anticancer potential of immunotherapy. 49 However, different types of CRC respond differently to immunotherapy.50,51 Our data revealed that subtype I expressed higher levels of CTLA4/PDL1 than did subtype II. However, patients with subtype II had better survival rates. Therefore, immunotherapeutic interventions corresponding to highly expressed immune checkpoint blockades may be selectively effective in the corresponding cancer subtypes.
In this study, a prognostic gene signature consisting of 4 genes, TIMP1, MMP1, LGALS4, and ITLN1, was constructed with good performance in predicting the OS of CRC patients. TIMP1 belongs to the TIMP gene family and encodes proteins that are natural inhibitors of matrix metalloproteinases (MMPs), which are particularly important in the invasion, progression, and metastasis of CRC. 52 The results of a study by Huang et al 53 showed that the expression of TIMP1 was negatively correlated with the OS of CRC patients and was a high-risk factor for CRC (HR = 1.578, P = .001). Matrix metalloproteinase 1 (MMP1) is a member of the MMP family that degrades interstitial collagen types I, II, and III. 54 MMP1 is involved in the induction of CRC migration, invasion, angiogenesis, and metastasis. 55 MMP1 stimulates VEGFR2 expression and endothelial cell proliferation by stimulating PAR-1 and activating NF-κB. 56 A recent study showed that MMP1 downregulation is strongly linked to shorter disease-free periods. 57 Furthermore, LGALS4 is essential for lipid raft stability, protein apical trafficking, cell adhesion, wound healing, intestinal inflammation, and tumor development. 58 According to previous studies, LGALS4 is considerably under-expressed in cancerous tissues and is directly linked to the suppression of Epithelial-Mesenchymal Transition (EMT). 59 Through stimulation of IL-6/NF-κB/STAT3 signaling, downregulation of LGALS4 promotes tumor growth in vitro and in vivo 60 ITLN1 synergistically suppresses IL-17D- and CXCL2-mediated tumor vascularization. According to a number of studies, plasma ITLN1 is highly expressed in CRC patients and is an independent risk factor for recurrence and survival. 61 In contrast, Katsuya et al 62 found that enhanced tumor expression of ITLN1 was associated with a more favorable prognosis in CRC patients. In this study, MMP1, LGALS4, and ITLN1 were low-risk genes associated with a good prognosis. However, the relationship between these prognostic CDRGs, as well as their biological roles and mechanisms in the occurrence and development of CRC, require further study.
Using multivariable Cox regression analysis, this study provided a CDRG-based signature. We constructed a nomogram by combining the CDRG-based RS with predictive clinicopathological variables to provide a more intuitive predictive approach. Based on the patients’ clinical parameters and bioinformatics, this intuitive method enables doctors to forecast patient survival more accurately and build more complete treatment strategies.
The present research suffers from a number of shortcomings. First, while our model was verified in an independent cohort, more large-scale prospective clinical trials are necessary to determine the validity and usefulness of the model. Second, some clinicopathological characteristics linked to prognosis are not accessible from public databases and should be evaluated in the future. Finally, fundamental investigations are still required to discover the possible mechanisms of these predictive markers in cancer.
Conclusion
In this study, the differentiation trajectories of CRC cells were evaluated using scRNA-seq, and a CDRG-based molecular typing system was constructed. This method accurately predicted patient survival, expression of immunological checkpoints, and immunotherapy responsiveness to tumors. We combined the RS and clinicopathological variables of key prognostic CDRGs to generate a nomogram that can intuitively predict OS in CRC patients. This study highlights the importance of differentiation trajectories for understanding CRC heterogeneity and assessing patient prognosis.
Footnotes
Acknowledgments
The authors gratefully acknowledge each editor and reviewer for their efforts on this study.
Author contributions
Yuling Qin, Meiqin Li, Qiumei Lin and Min Fang performed the data curation and analysis. Xiaolan Pan, Yihua Liang, Zhaodong Huang and Zhimin Liu analyzed and interpreted the results. Yuling Qin, Meiqin Li, Lingsha Huang, and Min Fang drafted and reviewed the manuscript. All authors read and approved the final manuscript.
Declaration of conflicting interests
The author(s) declared no potential conflicts of interest with respect to the research, authorship, and/or publication of this article.
Funding
The author(s) disclosed receipt of the following financial support for the research, authorship, and/or publication of this article: This work was supported by grants from National Science Foundation of China(81760530), National Science Foundation of Guangxi (2022GXNSFAA035510), and Postdoctoral Science Foundation of China(2021M693803).
Ethics approval
Because the data were obtained from databases that were open to the public, ethical approval was not necessary.
Data availability
The scRNA-seq data of the CRC samples were obtained from the GEO database (GSE109308, ![]() ). Additionally, the bulk RNA-seq data of the CRC samples were obtained from TCGA (http://cancergenome.nih.gov/) and the GEO databases (GSE39582, https://www.ncbi.nlm.nih.gov/geo/).
). Additionally, the bulk RNA-seq data of the CRC samples were obtained from TCGA (http://cancergenome.nih.gov/) and the GEO databases (GSE39582, https://www.ncbi.nlm.nih.gov/geo/).