
Abstract
Introduction
Hematopoietic stem cell transplantation (HSCT) is the essential and often the only curative therapeutic option in high risk and relapsed pediatric acute lymphoblastic leukemia (ALL).
Methods
The objective of the study was to investigate whole-genome expression in children with high risk or relapsed ALL referred for HSCT. Gene expression was assessed in 18 children with ALL referred for HSCT (10 high risk, 8 relapsed; median age of 9.4 years) and in a control group of 38 obese children (median age of 14.1 years). Whole-genome expression was assessed in leukocytes using GeneChip® HumanGene 1.0 ST microarray.
Results
The analysis of genomic profiles revealed a significantly lower expression of 21 genes with a defined function, involved in immunoglobulin production, lymphocyte function, or regulation of DNA processing in ALL patients referred for HSCT compared with the control group.
Conclusion
Genome expression of patients with ALL in remission referred to HSCT revealed deep immunosuppression of both B-cell and T-cell lineages, which may increase the probability of donor cell engraftment.
Introduction
Hematopoietic stem cell transplantation (HSCT) is currently the treatment option associated with highest survival rates in high risk and relapsed pediatric patients with acute lymphoblastic leukemia (ALL).1,2 Patients are referred for transplantation after the first- or subseqent-line intensive chemotherapy, usually being in complete hematologic remission.3,4 Based on our experience with gene expression pathways 5 and study of peptides regulating hematopoiesis, 6 we designed a retrospective study of peripheral blood gene expression in children with ALL referred to HSCT. The hypothesis was that the gene expression of peripheral blood cells in patients referred to HSCT may reflect their immune status after prior intensive treatment. The aim of our study was to assess potential usefulness of genome expression studies before HSCT.
Since the late 1990s, genome expressions in various malignancies (including ALL) have been studied.7,8 Such research is particularly important in patients with poor prognosis, who are classified as high-risk group, have suffered relapse, or are classified as low or intermediate-risk groups but have unfavorable prognosis due to genetic abnormalities. 9 It may also help to identify the group of patients with resistance to specific cytotoxic agents. In future, the inhibition of specific genes may be used to reverse resistance to chemotherapy and improve the outcomes.10,11 The genomic studies may be essential for better stratification of risk groups, especially regarding the candidates for HSCT.
Some gene mutations or rearrangements are responsible for the development of aggressive and treatment-resistant types of leukemia.12-16 Patients with ALL should be screened for the following genetic aberrations: deletion of IKZF1, PAX5, CDKN2A, CDKN2B, P2RY8-CRLF2, EGR, rearrangements of ABL1, ABL2, CSF1R, PDGFRbeta, IGH, CRLF2, EPOR, NTRK3, BCR-ABL1, AFF1 (mll), AFF1-KMT2A (MLL-AF4), ETV6-RUNX1 (TEL-AML1), TCF3, mutation of JAK2, as well as hypo- or hyperdiploidy. 9 Detection of the genetic background that contributes to poor prognosis remains a challenge and may be a basis for developing new therapeutic targets. 17 On the other hand, the alterations in certain genes and their products may influence the development of complications of the treatment. The ST2 gene (Suppression of Tumorigenicity 2 gene) can serve as an example. Its increased expression can be observed in acute graft vs host disease. 18
Materials and Methods
Whole-genome expression has been assessed in the study group and in the control group.The study group consisted of 18 patients aged 2.2–19 (median 9.4) years, referred to the HSCT Center between August 27, 2009 and May 17, 2012. In 10 patients, the indication for HSCT was high-risk ALL (HR-ALL) in first complete remission, and in 8 children relapsed ALL in remission. At diagnosis, within the group of 10 HR-ALL patients, B-lineage ALL without coexpressions was found in 1 patient (10%), B-lineage ALL with coexpressions in 5 patients (50%), and T-ALL in 4 patients (40%). In the group of 8 relapsed patients, 7 (87.5%) were diagnosed with BCP-ALL (2 with coexpresions and 5 without coexpresions) and 1 with T-ALL (12.5%). First-line therapy for 17 patients was ALLIC-2002 protocol, for 1 patient with ALL/AML phenotype, it was AML-BFM-2004. All 8 patients with relapse were treated with ALL-Rez-BFM-2002 Protocol as second-line treatment. Minimal residual disease (MRD) analysis based on 6-color flow cytometry was performed in the bone marrow samples of 13 children. The results were positive (MRD ≥ .01%) in 5 patients, negative (MRD < .01%) in 4 patients, and unavailable due to poor quality of samples in 4 patients. Due to the small number of informative MRD results, we did not analyze its impact on the genome expression. The blood samples for whole-genome assessment were collected at admission to the HSCT Center, just before the introduction of the conditioning regimen, so the patients were free from infection.
The limitation of the study was that no power calculation was used for estimation of the sample size because the number of ALL patients referred to HSCT in our center is small (about 6 per year).
Characteristics of Studied Groups.

ALL = acute lymphoblastic leukemia; HSCT = Hematopoietic stem cell transplantation.
Microarray Analysis
Blood samples (1.5 mL) were collected from each patient. Subsequently, mononuclear cells were separated, total RNA extraction was performed, and microarray analysis was conducted using the GeneChip Human Gene 1.0 ST Array (Affymetrix, Santa Clara, USA) according to the manufacturer’s protocol. Microarray data were initially processed using GeneChip Operating Software. DTT data were transferred by Transfer Tool software (Affymetrix). The Chip quality was assessed according to the Affymetrix guidelines. Raw data were processed using model-based expression index implemented in dChip. After background subtraction, the data were normalized using quantile normalization. The signal was taken as the measure of mRNA abundance derived from the level of gene expression.
Statistical Analysis
The microarray data were preprocessed using the R/Bioconductor package.19-21 Robust Multiarray Average (RMA) was used for normalization. 22 Quality control was performed by investigating Principal Component Analysis, Relative Log Expression, and Normalized Unscaled Standard Error plots.
Moderated t tests 23 were used to detect the probes with different expression in various groups 24 ; the data were RMA-normalized and presented as mean values and SDs.
It was assumed that log2 transformed gene expression levels are normally distributed and the between-group variation is of comparable magnitude. Multiple testing correction (Benjamini–Hochberg procedure) was applied to control the false discovery rate. 25 Significantly different expression in the probe sets was defined as multiple comparison-corrected two-sided P-value <.05.
The GeneCards - Human Genes Database 26 was used to analyze the function of genes.The Permanent Ethical Committee for Clinical Studies of the Medical College of the Jagiellonian University approved the study protocol. All parents, adolescent patients, and adult patients signed written informed consent before enrollment in the study.
Results
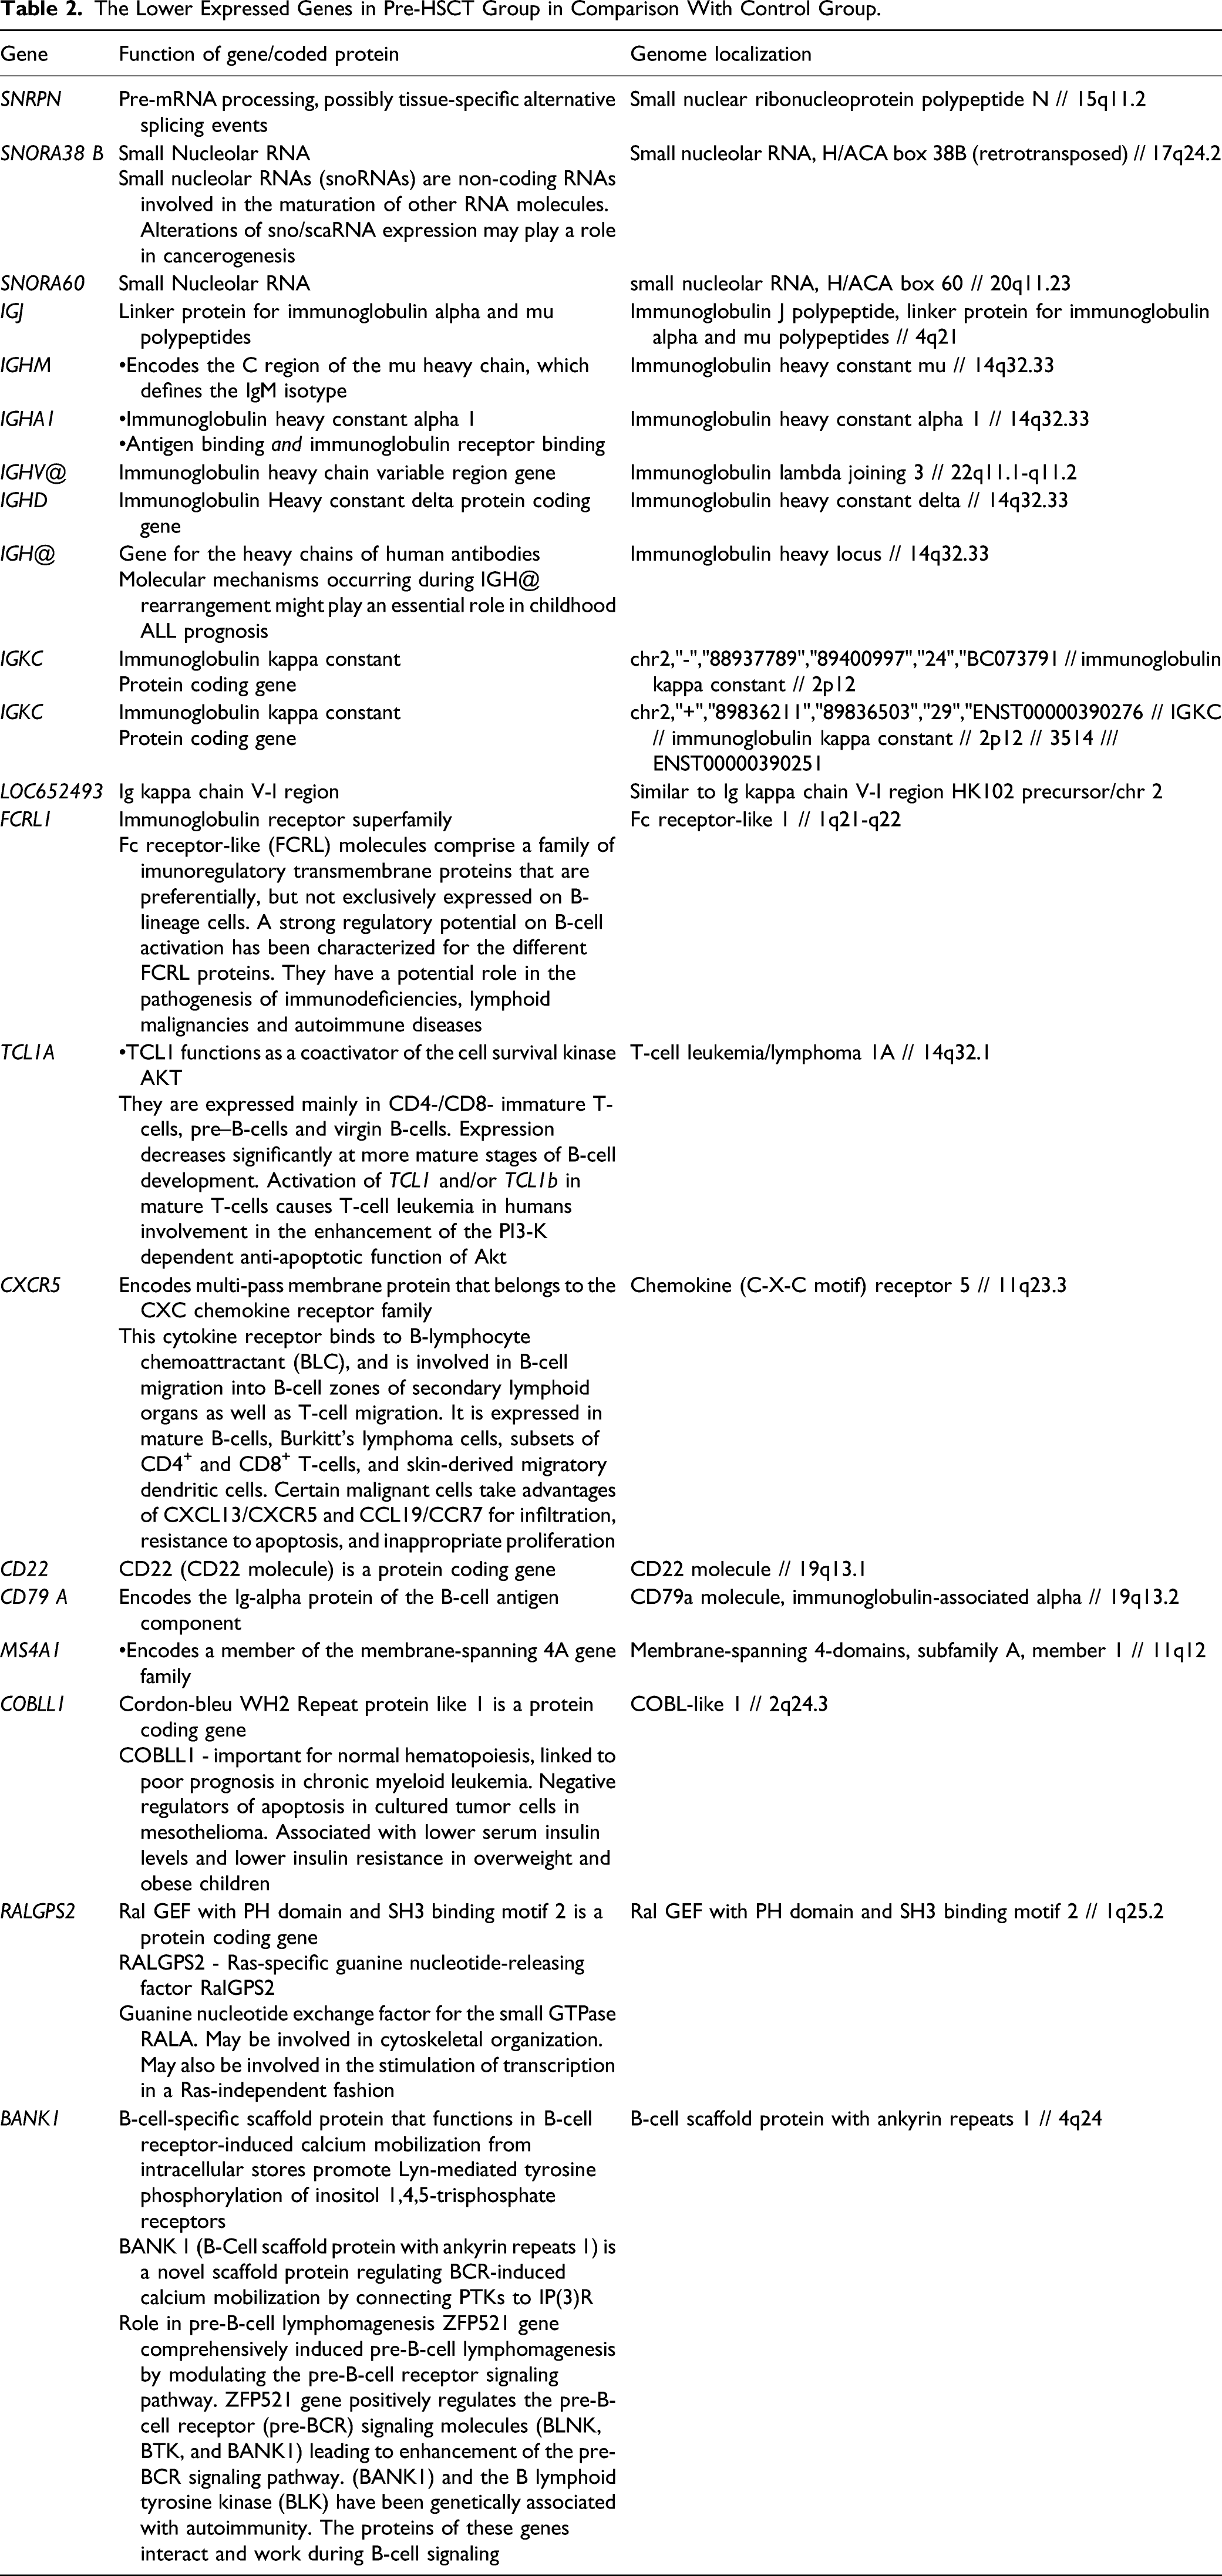
A comparison of the whole-genome expression before HSCT and the control group revealed 34 genes having the highest expression differences (P-value .00005, expected false positive results equal to 2) (Figure 1, Table 2). Based on search in the GeneCards - Human Genes Database
26
and the literature, well-defined function was found in the following 21 genes: SNRPN, SNORA38B, SNORA60, IGJ, IGHM, IGHA1, IGHV@, IGHD, IGH@, IGKC(88937789), IGKC(89836211), LOC652493, FCRL1, TCL1A, CXCR5, CD22, CD79A, MS4A1, COBLL1, RALGPS2, and BANK1. All the above showed lower expression in the HSCT group. Genes expression - comparison of pre-HSCT group and obesity group. Pre-HSCT - patients referred for hematopoietic stem cell transplantation and obesity - control group with obesity. F - female, M - male, SNRPN/SNORD 116-1 - the gene that encodes the small nuclear ribonucleoprotein polypeptide N, SNORA38B - the gene that encodes the Small Nucleolar RNA, SNORA50 - the gene that encodes the Small Nucleolar RNA, IGJ - the gene that encodes the Immunoglobulin J polypeptide, IGHM - the gene that encodes the C region of the mu heavy chain, IGHA1 - the gene that encodes the Immunoglobulin Heavy Constant Alpha 1, IGHV - the gene that encodes the Immunoglobulin heavy chain variable region, IGHD - the gene that encodes the Immunoglobulin Heavy Constant Delta Protein, IGH@ - the gene that encodes the heavy chains of human antibodies, IGKC - the gene that encodes Immunoglobulin Kappa Constant Protein, LOC652493 - the gene that encodes the Ig kappa chain V-I region, FCRL1 - the gene that encodes the Fc receptor-like 1, TCL1A - the gene that encodes the T-cell leukemia/lymphoma, 1A - a coactivator of the cell survival kinase AKT, CXCR5 - the gene that encodes the chemokine (C-X-C motif) receptor 5, CD22 - the gene that encodes the CD22 antigen, CD79 A - the gene that encodes the Ig-alpha protein of the B-cell antigen component, MS4A1 - the gene that encodes the membrane-spanning 4-domains, subfamily A, member 1, COBLL1 - the gene that encodes Cordon-Bleu WH2 Repeat Protein Like 1, RALGPS2 - the gene that encodes the Ral GEF with PH domain and SH3 binding motif 2, BANK1 - the gene that encodes the B-cell scaffold protein with ankyrin repeats 1. The Lower Expressed Genes in Pre-HSCT Group in Comparison With Control Group.
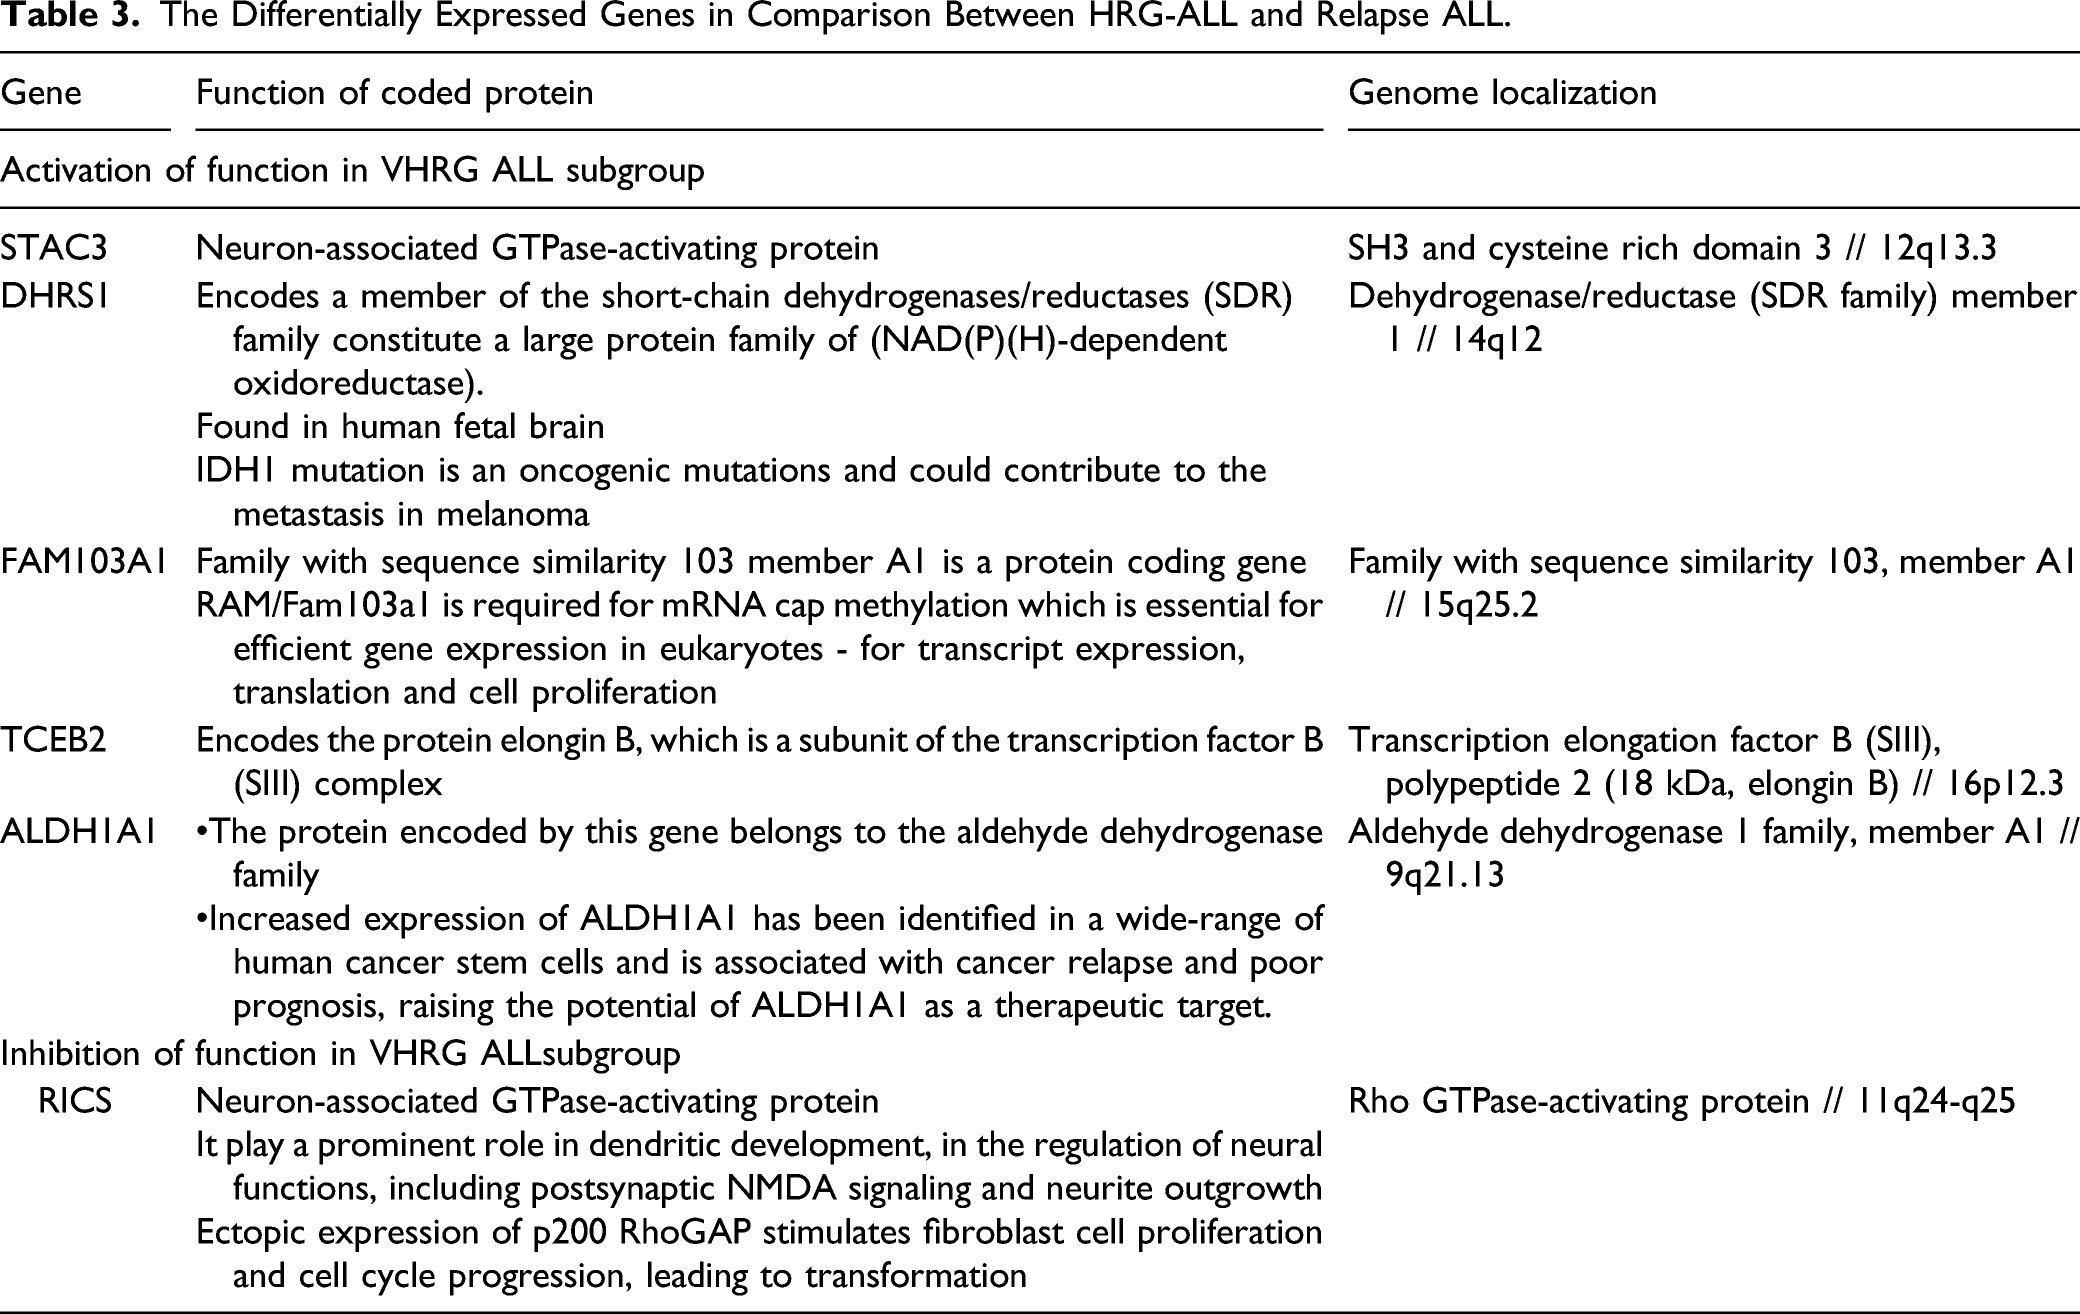
A comparison of the HR-ALL and the relapsed ALL patients (Figure 2, Table 3) revealed 6 genes having the highest expression differences (P-value <.01, expected false positive results >1.2). In the HR-ALL subgroup, gene activation was seen more frequently (5 genes) than gene inhibition (1 gene). The activated genes were STAC3, DHRS1, FAM103A1, TCEB2, and ALDH1A1, and the suppressed gene was RICS. Genes expression - comparison of high risk group (HR) and relapse group (Rel). HR - high risk group patients, Rel - patients after relapse, M - male, F - female, RIC3 - the gene that encodes the Rho GTPase-activating protein, STAC3 - the gene that encodes the Neuron-associated GTPase-activating protein, ALDH1A1 - the gene that encodes the Aldehyde dehydrogenase 1 family, member A1, TCEB2 - the gene that encodes the protein elongin B, DHRS1 - the gene that encodes the dehydrogenase/reductase (SDR family) member 1, FAM103A1 - the gene that encodes the Family With Sequence Similarity 103 Member A1. The Differentially Expressed Genes in Comparison Between HRG-ALL and Relapse ALL.
All the primary microarray data were submitted to Gene Expression Omnibus (GEO) public repository and are accessible using GEO Series accession number GSE69421. 27 In our study, a part of the submitted microarray data was used. A summary of the differentially expressed genes is presented in Tables 2 and 3.
The outcome of the patients was as follows: out of 10 HR-ALL patients, 8 live in first complete remission 8–10 years after HSCT, and 2 patients died due to relapse. In the group of 8 relapsed children, 4 live in second or third remission 10–11 years after HSCT and remaining 4 died. The comparison between B and T-ALL subsets did not reveal significant differences.
Outcome of the Patients.

Discussion
We studied genome expression in 18 children referred for HSCT in the treatment of ALL. At diagnosis, most of the relapsed patients (88%) had B-lineage ALL, while the remaining 12% had T-lineage ALL. In HR-ALL group, the most frequent phenotype was B-lineage ALL (50% with coexpressions and 10% without), and T-lineage ALL was diagnosed in remaining 40% of patients.
Therefore, B-cell ALL at diagnosis was found in 72% of patients and T-cell ALL in 28% of patients (Table 1). Most of the patients were boys (15/18; 83%), and the median age for the whole study group was 9.4 years (range 2.2–19 years). All children were heavily pretreated. A second-line chemotherapy was used in 8 patients and involved field radiotherapy in 7 patients.
At the time of HSCT, all patients were in complete remission, but positive MRD was detected in 5 children. The genome expression of the study group was compared with obese children with no comorbidity, with a median age of 14.1 years. The study revealed that 21 genes with well-defined function had lower expression in the pre-HSCT group compared with the control group. More than 50% of these genes were involved in immunoglobulin production. Three genes were related to regulation of DNA processing, and one gene was involved in T-cell regulation
Overall, our results indicate deep immunosuppression of both B-cell and T-cell lineages after prior intensive chemotherapy. As approximately 70% of patients were cured from leukemia after HSCT (conditioning: 17-TBIC-VP, 1-BuCy2-ATG), the genome expression results suggest that previous treatment was successful in reducing the leukemia burden (no expression of genes responsible for leukemia development) and making space for donor immune system (inhibition of genes responsible for immune system regulation). In our previous study, we have shown activation of genetic pathways regulating immune reactions after HSCT. 5 In the other study showing the influence of visfatin secretion on hematopoietic reconstitution, we compared CBC before and after HSCT in almost the same group of patients as in current study. The lymphocyte count was significantly lower in pre-HSCT group comparing to the post-HSCT group. 6 The expression results are in accordance with these results showing deep immunosuppression. For the reason explained before, we choose the obesity group as a control. Interestingly, children with obesity show decreased function of lymphocyte B. 28 As our study showed uniform suppression of genes regulating lymphocyte B function in children with ALL referred to HSCT compared to obese children, it proves substantial immunosuppression of B-line cells in studied group.
Some of the genes analyzed in our study may promote the development of malignancies (like lung cancer, pancreatic cancer, colorectal cancer, and leukemia),10,29-31 while some are present in aggressive, metastatic, or resistant disease. All of them may potentially be indicators of relapse or second malignancies and become targets for novel therapies.17,32 They might also be responsible for leukemogenesis and treatment resistance in patients with leukemia.33-37 Further analysis of genomic profile of patients with ALL at diagnosis, at relapse, and before HSCT are necessary to understand the role of the altered activity of the genes and the respective enzymes.
An important limitation of our study was its retrospective design. It would be useful to perform prospective observation of the changes in genome expression in pediatric ALL patients at diagnosis and at the later phases of treatment. The next issue is that the difference in gene expression between the different ALL groups before transplantation was not quantified.
Conclusion: The genome expression in pediatric patients with ALL in remission referred for HSCT revealed deep immunosuppression of both B-cell and T-cell lineages, which may increase the probability of donor cell engraftment. In the future, the assessment of gene expression profile at diagnosis and at later phases of treatment might be one of predictors of long-term outcomes.
Abbreviations
acute lymphoblastic leukemia
data transfer tool
false discovery rate
high-risk acute lymphoblastic leukemia
hematopoietic stem cell transplantation
minimal residual disease
Normalized Unscaled Standard Error
Principal Component Analysis
Relative Log Expression
Robust Multiarray Average
Footnotes
Acknowledgments
Not applicable.
Author Contributions
KK and SS designed and performed research, analyzed and interpreted data, and wrote the manuscript. MBM performed research, analyzed, and interpreted data.AG, MK, and MP performed research and collected data. WS analyzed and interpreted data and critically reviewed the manuscript. WB conducted the clinical protocols and interpreted data. All authors read and approved the final manuscript.
Declaration of Conflicting Interests
The author(s) declared no potential conflicts of interest with respect to the research, authorship, and/or publication of this article.
Funding
The author(s) received no financial support for the research, authorship, and/or publication of this article: This study was funded by the Polish National Research Centre grant number NN 407 198737.
Availability of Data and Material
The datasets used and analyzed during the current study are available from the corresponding author on a reasonable request. All the primary microarray data were submitted to GEO public repository and are accessible using GEO Series accession number GSE69421. 16 In our study a part of the submitted microarray data was used.
Trial Registration
Bioethics Committee of the Jagiellonian University approved the study protocol. Registration number: KBET/96/B/2008. The Permanent Ethical Committee for Clinical Studies of the Medical College of the Jagiellonian University approved the study protocol. Registration number: KBET/96/B/2008. Written informed consent for collecting the samples and for its genetic evaluation as well as for publishing was obtained from all parents or their guardians and from all patients ≥16 years of age. The study conforms with The Code of Ethics of the World Medical Association (Declaration of Helsinki), printed in the British Medical Journal (July 18, 1964).
Ethics Approval
The study was approved by the Ethics Committee of the Jagiellonian University (KBET/96/B/2008) and has been performed in accordance with the ethical standards as laid down in the 1964 Declaration of Helsinki and its later amendments or comparable ethical standards.
Consent for Publication
Written informed consent was obtained from all parents and from all patients ≥16 years of age. An informed consent to publish was obtained from all patients or their guardians, where applicable. All authors consented for publication.