



Abstract
The goal of this study is to provide the psychometric properties of a new measure of executive function (EF), based on the representation, planning, monitoring/execution (RPM) process framework. Two versions of the EF RPM scale are contrasted with a different rating scale of EF, and further related to relevant associated outcomes. Results show positive distributional, reliability, and validity evidence for the EF RPM scale. Confirmatory factor analysis showed that items aligned with their assigned factor, and the factors were strongly related to one another as expected with a unitary EF process. The two versions of the EF RPM scale showed good convergent validity with another EF scale and expected relations with functional outcomes and demographic characteristics. The EF RPM scale also showed stronger discriminant validity relative to a different EF scale for non-EF behavioral symptomatology. Future work needs to gather additional evidence for these scales in different contexts and settings (e.g., in specific populations, in clinics) and in relation to other outcomes (e.g., achievement, daily life outcomes, cognitive variables).
Introduction
Executive function (EF) is described, defined, and operationalized in myriad ways. Cirino (2023) reviewed several common conceptualizations of EF, concluding that “EF is a managerial process for coordinating domain general and domain specific resources during challenging goal-directed behavior” (p. 10). The specific process noted in the definition above has phases of Representation, Planning, and Monitoring during execution (RPM). Cirino (2023) noted that directly measuring this phasic process should effectively predict functional outcomes, and that it would be desirable to avoid including items that strongly overlap with diagnostic symptomatology criteria for common behavioral disorders (e.g., ADHD). Also, evaluating individual differences (vs. problems) may also result in more normal (vs. skewed) distributions of scores. There has been no prior measure that instantiates the RPM model of EF. Thus, the goal of the present study is to describe two versions of a new parent rating scale for children (EF RPM), assess its alignment with Cirino (2023), and provide an initial evaluation of its psychometric properties, including reliability, its structure, and its relation to several other relevant measures.
Existing Rating Scales of Executive Function
Beyond an extensive number of EF performance measures, a wide variety of rating scales of EF are also available. Some are focused on adults, such as the Adult Executive Functioning Inventory (ADEXI; Holst & Thorell, 2018) and the Dysexecutive Questionnaire (DEX; Burgess et al., 1996), and so are less relevant to discuss in the present context. Other scales are relatively less cited, such as the Delis Rating of Executive Functions (D-REF; Delis, 2012) and the Comprehensive Executive Function Inventory (CEFI; Goldstein & Naglieri, 2013). Several broadband rating scales offer EF-related scales, but mainly through an amalgamation of other more primary scales, such as that included in the Behavior Assessment System for Children (BASC; Reynolds & Kamphaus, 2004). However, two existing measures are of particular relevance here: the Behavior Rating Inventory of Executive Function, Second Edition (BRIEF-2; Gioia et al., 2015), and the Barkley Deficits in Executive Functioning Scale – Children and Adolescents (BDEFS-CA; Barkley, 2012a). These are reviewed below to contextualize how the EF RPM scale here is different; in all cases, we focus on parent-report versions.
The BRIEF-2 (Gioia et al., 2015) is easily the most widely used and cited rating scale of EF. Original items were based on literature review and experience rather than a particular model of EF. The normative sample included 1,400 parents well matched to U.S. population parameters of age, gender, parent education level, race/ethnicity, and geographic region (Gioia et al., 2015). There are 63 items, and parents are asked to rate the frequency of different child behavior problems in the prior 6 months on a 3-point scale (never, sometimes, and often). The measure has subscales of inhibition, self-monitoring, shifting, emotion control, initiation, working memory, planning, task monitoring, and organization; these are organized into three factors/domains: the Behavior Regulation Index (BRI), the Emotion Regulation Index (ERI), and the Cognitive Regulation Index (CRI). The BRIEF-2 parent form demonstrates excellent internal consistency (α = .90–.97 for the main indices) as well as strong test–retest reliability (r = .82–.89; Gioia et al., 2015). The three factors (the BRI, ERI, and CRI) are highly intercorrelated in the normative sample (r = .82–.92; Gioia et al., 2015). The BRIEF also correlates with other rating measures of EF (see Nilsen et al., 2017, r = −.65). In many ways, the numbers above provide a useful benchmark for any new measure, given that the BRIEF-2 is the most widely used instrument of this type. However, the BRIEF-2 is not based on a specific model of EF, reflects a componential approach to EF, and is designed to detect problems (e.g., raters are asked “how much of a problem” is any given item), rather than assess the entire range of EF.
With regard to the relations of the BRIEF-2 with non-EF measures, research indicates that BRIEF-2 indices correlate robustly with ADHD symptomatology (range r ~ .60–.90). For example, Gioia et al. (2015) reported correlations of the CRI with inattention, r = .57 to .91, depending on the measure; consistent relations of the BRI with hyperactivity/impulsivity were also reported (r = .70 and .79, respectively). Similar ranges appear in the literature (McAuley et al., 2010; Miranda et al., 2015; Shum et al., 2021; Toplak et al., 2009). For example, McAuley et al. (2010) found the BRIEF Metacognition Index to be highly related to inattention, r = .81, while the BRI was strongly related to hyperactivity and impulsivity, r = .72. For preschoolers, teacher ratings of the relation between the BRIEF Metacognitive Index and inattention were ~ r = .87, and those between the BRI and hyperactivity/impulsivity were ~ r = .73 (Miranda et al., 2015). Shum et al. (2021) reported somewhat lower correlations, at least for parent ratings (r = .58–.63), relative to teacher ratings (r = .73–.76).
The BDEFS-CA (Barkley, 2012a) was developed based on a model stemming from the author’s conceptualization of ADHD (Barkley, 1994, 1997) and EF (Barkley, 2012c). The BDEFS-CA is focused on behavioral regulation of the self, including regulation of emotion, organization/problem-solving, time management, motivation, and restraint (Barkley, 2012a). There are 70 items, and parents are asked to rate how often their child has experienced each problem during the past 6 months, on a 4-point Likert-type scale (never or rarely, sometimes, often, and very often; Barkley, 2012a). Normative data was obtained through Knowledge Networks Panel on 1,800 parents of children aged 6 to 17 years (Barkley, 2012a). Parent respondents were equally fathers and mothers, and the sample was diverse and matched to the U.S. population for geographic region, parental education, ethnicity, and socioeconomic status (SES). Seventy-seven percent of the sample had no diagnoses, with the rest having reported diagnoses of ADHD, learning disorder, language or developmental delay, autism, and/or mood disorders (Barkley, 2012a). Subscales correlate r = .63 to .84 with one another, with high internal consistency (α > .95 for all) and good test–retest reliability (r = .73–.82; Barkley, 2012a). Correlations between the BDEFS-CA and the first edition of the BRIEF (Gioia et al., 2000) are robust – the BDEFS-CA scales correlated r = .58 to .83 with BRIEF Behavioral Regulation, and r = .53 to .90 with BRIEF Metacognition; also, total scores correlated r = .92 (Barkley, 2012a). The BDEFS-CA manual provides structural information on the scale, though it relies only on principal components analyses (Barkley, 2012a).
Empirical studies of the BDEFS-CA show that it correlates highly with ADHD symptomatology (Barkley, 2012a; O’Brien et al., 2021; Peisch et al., 2024). For example, in a sample of 1,922 children, Barkley (2012a) found high correlations between the BDEFS-CA and inattentive, hyperactive, and total ADHD symptomatology (r = .70–.88). In addition, O’Brien et al. (2021) found that four of the five BDEFS-CA subscales correlated strongly with the Conners-3 P (Conners, 2008) ADHD index (r = .71–.78) – the other subscale correlated r = .61. Peisch et al. (2024) found a bit lower relations with the Child Behavior Checklist (CBCL) ADHD scale, r = −.66.
Purpose and Rationale for a New Measure
Common models of EF (e.g., Friedman & Miyake, 2017; Miyake et al., 2000) have shaped how EF is measured by consolidating its operationalization into measures of working memory (updating), inhibition, and switching/cognitive flexibility (shifting). Furthermore, this model has increased homogeneity regarding how EF is construed (Karr et al., 2018). The ubiquity of this model is a testament to its importance and utility in the field. However, this componential model is almost entirely focused on performance-based assessment of EF, even if some rating scale measures of EF include subscales with similar names (e.g., three of the nine BRIEF-2 subscales are working memory, inhibit, and shift). Furthermore, other conceptualizations of EF bear little resemblance to the tripartite model of Miyake and colleagues. For example, fields other than neuropsychology (e.g., developmental psychology, educational psychology) discuss many constructs in separate literatures with names other than EF, though they are still critical for achieving goal-directed outcomes (e.g., planning, self-regulated learning, attention control, effortful control). The EF RPM scale reflects elements from across these literatures.
The RPM model of Cirino (2023) does not view EF as a set of cognitive skills, but rather as a process, separable from other cognitive or diagnostic constructs. As a direct reflection of a process model, the phases (R, P, M) are interdependent on one another and thus would be expected to relate strongly with one another. EF is viewed as an individual difference that manifests when there is a task to be performed, a problem or issue to be resolved, or a goal to be reached; it is in the way one goes about achieving outcomes (where there is not yet a routinized or automatic procedure) that determines whether EF is “good,” “fair,” or “poor.” A key distinction is between the terms domain general and domain-specific. For purposes of the EF RPM model, domain general means some resource (usually some cognitive function) that is known/shown to plausibly relate to many challenging goal-directed outcomes, whereas domain-specific means some skill or function that has a particularly tight or “privileged” link to a given challenging goal-directed outcome (more so than to other outcomes). When viewed from a process perspective (as in the EF RPM model), rather than as a collection of cognitive skills, EF can be seen to use domain general cognitive skills (e.g., working memory, inhibition, shifting) – and domain-specific skills – in different combinations to achieve the desired outcome or goal, though success does not necessarily require any one of these skills. For example, if an individual has strong domain-specific or content knowledge related to the goal (such as understanding a passage about sports), this may compensate for a domain general weakness in, say, working memory; simultaneously, even if working memory is important for a skill (such as reading comprehension or math), it is possible for an individual with excellent working memory to do poorly on such tasks for other reasons (e.g., attention or motivation). This conceptualization of EF as a unitary process rather than a collection of abilities also avoids the problematic weak relation among performance measures of EF (r ~ .20; Cirino et al., 2018; Miyake et al., 2000).
The idea of EF as a process was not invented by Cirino (2023), as it in part resembles and was inspired by the process model of EF of Zelazo et al. (1997) and the process model of self-regulated learning of Zimmerman (1990). However, neither of those models is associated with a rating scale of those processes. In the context of rehabilitation and intervention (Levine et al., 2000; Mahone & Slomine, 2007; Ylvisaker & Feeney, 2009), a practical way that EF is often addressed clinically is by first determining a goal or set of goals and then scaffolding the individual to obtain those goals with support, followed by a fading of those supports to gain independence. These supports can be viewed as assisting a patient to implement the process of representing, planning, and executing and monitoring their progress toward a goal.
This is the first study to describe and use either version of this measure, which is the only one to directly assess the RPM model of EF. In developing the current measure, we considered several parameters that influenced how items were generated. First, each item was explicitly tied to one of the phases of the RPM process of Cirino (2023). Because the RPM model reflects a single process rather than a host of separable “EFs,” each with their own set of properties and relations to other constructs, the present instrument does not have subscales of, for example, working memory, inhibition, or shifting. Second, because EF is seen as an individual difference, it is applicable across any number of outcomes (tasks to be performed, problems or issues to be resolved, or other goal-directed behaviors). Thus, raters are asked to consider how the child acts with regard to each item across such
Fifth, most scales of child behaviors (including the BRIEF-2 and the Barkley scale) ask whether or to what extent an item is a problem (and most items are framed in a negative or non-desired manner – e.g., “annoys others”; “does not help others”). Furthermore, there is little distinction as to whether a given item (e.g., poor planning) is a problem per se, versus whether the item causes problems (e.g., fails to turn in assignments), which in turn may have causes other than poor planning (e.g., lack of motivation, poor attention). Finally, scales that ask about problems may be positively skewed, to the extent that they ask about relatively low base rate problems (the baseline is for there not to be a problem). Sixth, we evaluate the effect of item framing by contrasting two versions of this same scale – one that frames behaviors in terms of “absolute” frequency (e.g., whether/how often a given behavior occurs, similar to adaptive/daily living skills behaviors) versus a second that frames behaviors in terms of “relative” frequency (e.g., whether a given behavior is more (or less) common or performed well (or poorly) relative to age/grade peers). These latter two issues (items as problems, absolute vs. relative item framing) are tightly confounded. For example, an assumption that could be applied to problem scales is that the behavior occurs more than it “should” for a given child’s age, grade, or developmental level (implying that a relative judgment must be made), even if the response choices themselves appear to be absolute (e.g., never, sometimes, often). Thus, producing two versions allows for the ability to test whether item framing (relative vs. absolute versions) yields differences in scale properties, without the confounding introduced by asking about problems.
Because the model is relatively new, and the measure has not previously been used, establishing its empirical alignment with theory is critical as a theoretical contribution. In addition, evaluating its properties is also necessary to demonstrate how the measure relates to other measures of EF, and to functional outcomes, which in turn provides evidence of clinical and practical utility.
The Present Study and Hypothesis
The goal of the present study is to describe some key properties of two versions (absolute and relative) of a new measure that instantiates the RPM model of EF (Cirino, 2023). We hypothesize the following, which are applicable to both versions:
We expect that confirmatory factor analyses will yield a three-factor solution (with items loading on factors of representation, planning, and monitor/execute); however, factors should intercorrelate highly (e.g., r ~.80). Thus, empirically it is likely that a three-factor solution will show modestly improved fit over a unitary structure, but the latter is also expected to fit well.
We expect that across all items, the distribution of total scores (particularly on the absolute scale) will form a normal distribution (rather than a skewed one), as it is meant to represent an individual difference across the continuum. We also expect the subscales (factors) to show normal distributions. Each of these (as well as the total scores) are expected to also show high internal consistency reliability indices (e.g., α above .80).
We expect the two versions of the EF RPM scale (absolute and relative) to correlate moderately highly with one another at the overall level (e.g., r ~ .60–.80), in line with test–retest values from other EF instruments. The subscales are also likely to correlate across versions, though less well (e.g., r ~ .50–.60).
Correlations of the EF RPM scale with a different EF scale (Barkley, 2012a) will be significant though moderate (e.g., r ~ .60). However, we expect all to relate similarly to a common measure of functional outcomes, and this should extend to parent-reported achievement (grades). Because the absolute EF RPM version does not explicitly or implicitly require a peer comparison, we expect this to correlate more strongly with age than the relative version (or the Barkley EF scale).
Correlations between the two EF RPM scales and measures of other behavioral symptomatology (ADHD; Oppositional Defiant Disorder or ODD) are expected to show some discriminant validity; that is, we expected correlations to be significantly lower than the range found with other EF measures (range r ~ .60–.90), given that the present scales were specifically designed to not include direct or close reference to ADHD symptomatology.
Method
This study’s design and its analyses were not preregistered. Analyses were performed in Mplus (Muthén & Muthén, 2017) and SAS (SAS Institute Inc., 2013). We report how we determined our sample size, all data exclusions, and all manipulations, for all the measures reported in this study. Study stimulus materials are available in the Supplemental Materials. Mplus code is available upon reasonable request from the corresponding author.
Participants and Procedures
The sample was composed of 848 parents with children ages 6 to 17. Inclusion criteria were (a) respondent aged 25 or more, (b) high school degree or equivalency, (c) read/converse fluently in English, (d) provide consent, and (e) meet check criteria. Check criteria were responding to 90% of items presented, and passing 70% of attention check questions (e.g., “Please mark ‘often’ for this item”) seen. Only 15 participants were excluded, all on the basis of this final criterion. Table 1 provides descriptive data for the remaining 833 respondents. The mean respondent age was 38.3 years old (SD = 8.4), and the mean age of the child they were rating was 10.9 years old (SD = 3.5). Most households had two or more parents/guardians (85%), and most households had one or two children (83%). About 7% of children were currently prescribed a medication for a psychiatric or psychological disorder. Most children (84%) were reported to receive grades of Bs or higher. SES and income were diverse. For example, most respondents (76%) rated their households in the “middle 50%” of SES, socioeconomic status, with 15% in the lowest quartile and 8% in the highest quartile. Approximately 42% of households reported a gross income of $100,000 or more, with 26% under $60,000.
Demographic Characteristics of Sample.

Note. Total sample N = 833; percentages in the table do not always add up to 100% due to some participants who did not report for that item. In the race/ethnicity category, the “other” group represents people who are not Hispanic but are also not Black or White only. Child Diagnoses are parent-report only (check all that apply), and prior to completion of any questionnaires.
The sample was ascertained via the Cloud Research Connect platform (Litman et al., 2017), an online platform that connects researchers to prescreen participants. Prior to data collection, we reviewed multiple sources for accepted guidelines for online survey research (Conrad et al., 2017; Eysenbach, 2004; Meade & Craig, 2012; Ward & Meade, 2023) to help maintain data integrity. In the present case, these informed the “check criteria” referenced above. Attention checks were scattered across questionnaires as there is no consensus as to their placement (Mathur, 2025). To further judge careless/random responding, we recorded time for completion, and generated metrics for time per item within individual survey portions. The Connect platform connected participants to Qualtrics, a secure survey development platform (Qualtrics, 2024). Only participants whose profile matched survey characteristics were able to view the study announcement (Eysenbach, 2004), though these same eligibility questions were also asked before the survey could be opened. Once a participant completed the survey, they were unable to retake it, and this was verified through a unique participant identifier generated from Connect. No direct identifying information (e.g., names, emails) was collected.
The data reported here focuses on six scales, although the data collection procedure also collected data on two additional measures designed to measure functional outcomes (not discussed further). Participants saw 17 demographic items, and up to 265 survey items, and up to 10 attention check questions embedded through the survey. To ease response burden, the majority of participants (71%) did not receive every item across all nine scales. For the first 592 participants, group designation (which scales they received) was randomized within Qualtrics after meeting eligibility criteria and consenting to participate. A further 94 participants were ascertained, who were not randomized and received all items, to boost the ability to demonstrate cross-questionnaire correlations. It is relevant to note that all 833 participants completed key measures including (a) demographic items and check questions; (b) at least one of the two versions of the EF RPM scale; and (c) a measure of functional outcomes and a measure specific to behavioral diagnoses. A total of 543 participants received the BDEFS-CA measure of EF. The pattern and number of items, check items, and scales seen by each group are shown in Table 2 (the number of participants in each group appears in the note of this table). Participants received remuneration in proportion to the number of survey items they were given, but in all cases, remuneration was set to a benchmark rate of $15/hour. All the procedures were approved by the Institutional Review Board (IRB) of the author’s institution.
Number of Items Answered by Each Group, By Scale.
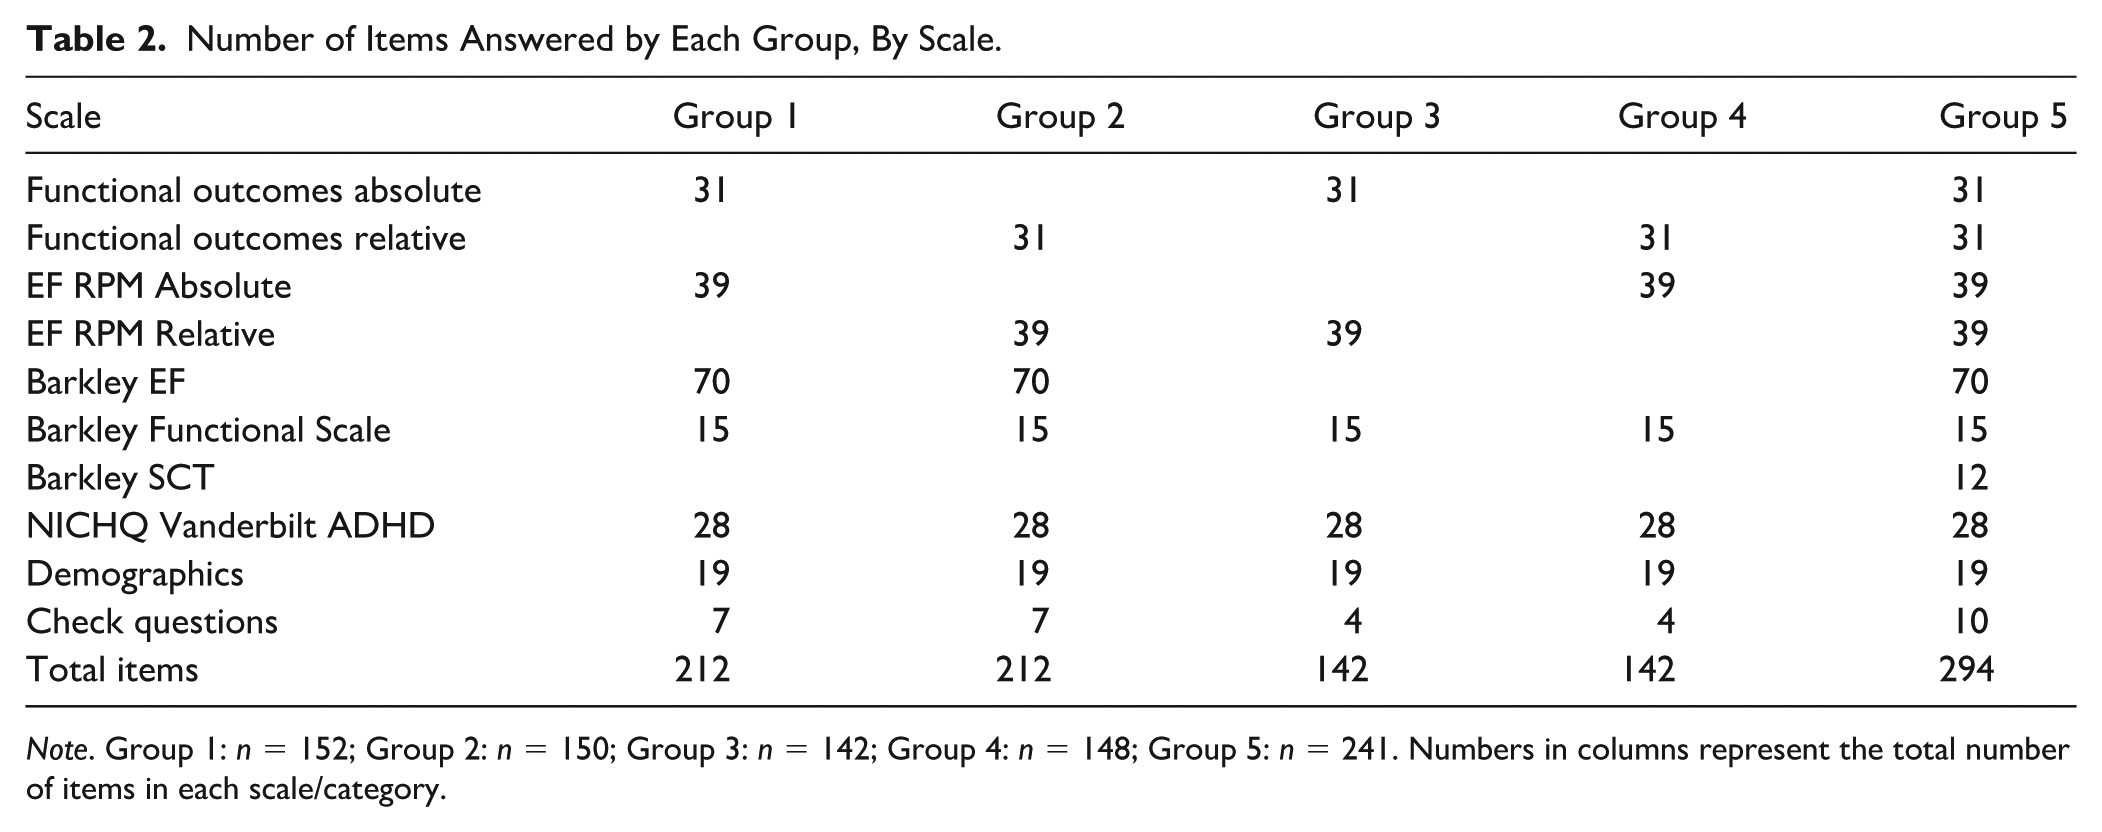
Note. Group 1: n = 152; Group 2: n = 150; Group 3: n = 142; Group 4: n = 148; Group 5: n = 241. Numbers in columns represent the total number of items in each scale/category.
Measures
Executive Function RPM
There are two versions, absolute (e.g., “During a TPIG, they check how well it is going along the way”) and relative (e.g., “Checks how a TPIG is going while it is happening”). The scales were developed together, and the item content was matched across versions. The differences between the two versions are in terms of the (a) referent used (“they” vs. no referent); (b) item phrasing (positive vs. neutrally framed; importantly though, neither item phrasing asks about “problems”); and (c) answer choices. For the absolute version, items are paired with four response choices (“Rarely, 0% to 25% of the time”; “Sometimes, 25% to 50% of the time”; “More Often Than Not, 50% to 85% of the time”; “Almost Always, 85% to 100% of the time”; raters can also select “Unknown, Unable to Rate”). For the relative version, items are paired with five response choices (“This is Very Difficult/Much Worse than age/grade peers”; “This is Weak/Worse than age/grade peers”; “This is About Average/About the Same as age/grade peers”; “This is Good/Better Than age/grade peers”; “This is Excellent/Much Better than age/grade peers”; raters can also select “Unknown, Unable to Rate”).
The purpose of having two versions of the EF RPM scale was to evaluate whether item/response framing affects relations or distributions, as well as to provide a version of alternate form reliability. For the absolute version, the focus is on the frequency that a given behavior occurs. The relative scale requires not only a judgment about the frequency of a behavior, but also a judgment as to whether that frequency is more or less than same-age/grade peers. As noted, neither ask whether a given item is a problem. We expect the absolute version to be simpler to rate, and perhaps less prone to bias, though we do not have enough information to posit differential hypotheses. Both EF RPM versions had three subscales, each of which is a stage of the EF process – Representation (13 items; e.g., “When there is a TPIG, they are aware that it exists”); Planning (11 items; e.g., “When preparing for a TPIG, they make sure that all needed materials are available before beginning”); and Monitor/Execute (15 items; e.g., “During a TPIG, they use feedback to improve their performance”). Both versions appear in the Supplemental Material; item stems appear in Table 4 (see below).
For purposes of validation, other scales were also administered as follows.
Barkley Developmental Executive Function Scale–Child and Adolescent (BDEFS-CA) Long Form Parent Rating Scale
The description and properties of this measure are described in the Introduction, and so are not repeated here. There are 70 items and four response options (Never or Rarely; Sometimes; Often; or Very Often; Barkley, 2012a).
Barkley Functional Scale–Child and Adolescent Parent Rating Scale
The Barkley Functional Scale–Child and Adolescent (BFIS-CA; Barkley, 2012b) assesses daily functioning in children in 15 domains/activities and asks parents to rate their child’s degree of difficulty/impairment for each relative to other children of the same age, over the past 6 months, on a 10-point scale that ranges from 0 (Not at All) to 9 (Severe). Thus, this measure could be classified as a “relative” scale of problem behaviors. The reliability is excellent (α ~ .97; Barkley, 2012b). The BFIS-CA subscales correlate with BDEFS-CA subscales (r = .40–.74), and with BRIEF factors (r = .60–.89; Barkley, 2012b).
Barkley Sluggish Cognitive Tempo Scale–Child and Adolescent (BSCTS-CA) Parent Rating Scale
This scale assesses behaviors related to sluggish cognitive tempo across two domains: daydreaming and slowness. There are 12 items, each rated on a 4-point scale (1, Never or Rarely, to 2, Very Often). Parents are asked to rate the extent to which their children have problems over the past 6 months. Reliability is good (α = .93; Barkley, 2018). The measure has strong correlations with BDEFS-CA subscales (range r = .74–.88; Barkley, 2018).
National Institute for Children’s Health Quality (NICHQ) Vanderbilt Assessment Scales Parent Informant
This scale assesses behaviors related to the diagnosis of ADHD, using the 18 items of the Diagnostic and Statistical Manual of Mental Disorders (4th ed.; DSM-IV; American Psychiatric Association, 1994; National Initiative for Children’s Health care Quality, 2002); the set of symptoms are very highly similar to that of the Diagnostic and Statistical Manual of Mental Disorders (5th ed.; DSM-V; American Psychiatric Association, 2014). The rating scale ranges from 0 (Never) to 3 (Very Often). Parents are asked to rate their child relative to what is appropriate for their age. Thus, this could be described as a “relative” scale of problem behaviors. There are a total of 47 items, including the 18 ADHD primary criteria items, eight items covering the primary criteria of ODD, 14 items for the primary criteria for Conduct Disorder, and seven items related to mood/affect. There is also a secondary scale with eight items associated with daily functioning, on a scale of 1 (Excellent) to 5 (Problematic). For purposes of this study, only the 18 ADHD, eight ODD, and two additional items (one for anxiety and one for depression) were administered. The reliability is good (α = .94; Wolraich et al., 2003), and the measure has been found to be related to other measures of ADHD and EF such as the Diagnostic Interview Scale for Children (DISE) ADHD module (r = .73–.77; Zhang & Li, 2022), and the NIH Toolbox Cognitive Battery EF Score (r = −.20 to −.25; Zhang & Li, 2022). The measure also has good convergent validity within clinician diagnoses and other parent-report behavior checklists (Bard et al., 2013; Wolraich et al., 2003).
Analysis
Preliminary analyses included eligibility, range, and completion checks, verification of independent responses, algorithmic computation of ancillary data (e.g., time per response, sum, and average scores for each scale and subscale), and examination of missing data, for the 833 who passed initial eligibility and attentional checks. As noted, most analyses did not include all 833 participants, given planned missingness (see Table 2), although all sample sizes were more than sufficient for the analyses performed (e.g., reliability, correlations, basic regression; factor analyses of 39 items with Ns of 475 and 455). To account for missing data at the item level, mean scores (rather than sum scores/totals) were computed for each subscale and the entire scale; the response “unable to rate” was treated as missing. The missing data proportion was negligible for any given item. Finally, we also examined instances of potentially questionable data based on either (a) timing criteria or (b) lack of variability.
For timing, we identified individuals whose response speed may have been “too fast.” Although there are no standardized metrics for this, we examined three in total – two based on the literature (Andreadis, 2021; Conrad et al., 2017), and a third relative to the current data. For Andreadis (2021), we took their stated speed for a fast reader (375 words-per-minute) and converted this to a words-per-second metric (6.25 words-per-second). Then, we computed the number of words in each scale, computed a value to read one item averaged over all items, and added an additional second to decide on an answer (Andreadis, 2021). For the absolute version of the EF RPM scale, this works out to 3.45 seconds per item (spi), and for the relative version, it was 2.98 spi. Per Conrad et al. (2017), we took their value for a minimum time to read a single word (215 ms) and multiplied this by the average number of words for each item and converted this to the same metric as above (seconds per item). For the absolute version of the EF RPM scale, it was 3.29 spi, and for the relative version, it was 2.66 spi. All who failed the Conrad et al. metric necessarily also failed the Andreadis et al. metric; we therefore used only the latter to be more conservative. For the third timing metric, we recorded the time for each scale and, using this distribution, identified responses that were below (faster than) the 10th percentile for response time. For the absolute version of the EF RPM scale, this was 1.22 spi and for the relative version, it was 1.05 spi. These criteria were all substantially lower than the metrics found in the literature, which also meant that anyone failing these criteria also failed the literature criteria. If an individual protocol failed both timing metrics (unusually fast relative to criteria in the research literature, and unusually fast relative to other respondents in this sample), then responding was considered questionable – this was 54 individuals (10.0%) for the absolute version of the EF RPM scale, and 53 (9.9%) for the relative version. We computed similar metrics for all of the key scales (see third column of Table 3). The percent of protocols meeting this criteria were similar for the Barkley EF and Functional Outcome scale, and lower (~5%) for other scales.
Number of Participants Completing Versus Analyzed, By Scale, Considering Validity Checks.

Note. EF RMP Absolute = Executive Function Absolute Scale; EF RPM Relative = Executive Function Relative Scale. Overall Item Checks were also included: Participants must have answered 90% of the total items and answered 70% of the check questions correctly to be included in the sample. 15 participants were excluded from the sample based on this 90% total item/70% check questions criteria. Failed timing includes research-based criteria (Andreadis, 2021; Conrad et al., 2017) and participants whose responses were faster than the 90th percentile for response time. No Variability = identical responses across all items. The N Analyzed = N Completed − N Excluded. However, Failed Timing + No Variability does not equal N Excluded, as some individuals met both criteria.
Regarding lack of variability, we identified cases where every item of a scale (across subscales) was answered identically. For absolute EF, this was 15 protocols (2.8%), and for relative EF, this was 31 protocols (5.8%). Again these were computed for all scales (see Column 4 of Table 3), and ranged from 2.2% to 20.1% of protocols. Scales with the fewest items (sluggish cognitive tempo and oppositional defiance) had the highest percentages excluded, which is to be expected (longer questionnaires have more opportunity for variability).
If an individual met either timing, or lack of variability criteria, their protocol was considered questionable; only a handful of cases met both criteria. Questionable protocols were not analyzed; the number and percent, by scale, also appear in Table 3 (Columns 5 and 6).
Analyses that evaluated hypotheses consisted of reliability, correlations, and regression/prediction. We evaluated common assumptions for regression-based analyses (independence, normality, linearity, homoscedasticity, collinearity); after accounting for questionable protocols (see above), no further adjustments were necessary. There were only a few outliers for any individual scale, with no impact on substantive results, and so these were not winsorized or eliminated. Assumptions for confirmatory factor analyses with maximum likelihood estimation are similar; these are standard procedures, and we followed guidelines for proper instantiation (Kline, 2015; Tabachnick & Fidell, 2013), including the use of common measures of fit (e.g., χ2, Comparative Fit Index [CFI], Tucker–Lewis Index [TLI], Root Mean Square Error of Approximation [RMSEA], Squared Root Mean Residual [SRMR]).
Results
Preliminary Results
A total of 541 and 533 parents rated their children on the absolute and relative EF RPM scales, respectively. We first considered the effect of questionable responses (see Table 3), in terms of the EF measures related to other scales. There were some differences among those with versus without questionable responses; such differences were generally small, but we opted for a conservative approach given the large sample size, and so only analyzed cases where participants passed all criteria. As shown in Table 3, there were 475 participants analyzed for the absolute EF RPM scale, and 455 for the relative version.
Confirmatory Factor Analysis: EF RPM (Absolute)
Confirmatory Factor Analysis (CFA) loadings appear in Table 4 (along with item stems). The first model tested was a unitary one, which had poor fit, χ2(702) = 2,493, p < .001, RMSEA = .073 (confidence interval [CI] = [.070, .076]), CFI = .83, TLI = .820, SRMR = .053, although only one item had a factor loading of less than .40. Item fit suggested correlated errors for two item pairs. One pair from the Representation subscale asked how often the individual thought about the time and/or effort involved in a TPIG (#10) versus thinking about the number and/or sequence of events in a TPIG (#11). The other pair, from the Monitor/Execute subscale, asked whether the child listens to feedback (#32) versus using feedback (#33). Including these correlated errors did improve fit, though not to acceptable levels, χ2(700) = 2,206, p < .001, RMSEA = .067 (.064–.070), CFI = .86, TLI = .85, SRMR = .051. This model was compared to one that fit three factors (and their prespecified items) to the data; model fit that included the same correlated errors as above improved fit improved significantly, χ2(697) = 1,757, p < .001, RMSEA = .057 (.053–.060), CFI = .90, TLI = .89, SRMR = .045. Loadings for this model ranged from .51 to .71 for the Representation subscale, .48 to .76 for the Planning subscale, and .42 to .78 for the Monitor/Execute subscale (see also Table 4). As expected, the three subscales/factors correlated strongly with one another (r = .83–.92) at the latent level. A number of additional models were considered (e.g., including adding cross-loadings, eliminating items, increasing the number of item pairs with correlated residuals) for sensitivity purposes; however, none of these resulted in clearly superior model fits, and so are not discussed.
Confirmatory Factor Analysis Factor Loadings, By Scale.

Note. EF RPM Absolute = Executive Function Absolute Scale. EF RPM Relative = Executive Function Relative Scale. See Supplemental Material for exact wordings.
CFA: EF RPM (Relative)
As was the case with the absolute version, the unitary model for the relative version did not show adequate fit, χ2(702) = 2376, p < .001, RMSEA = .072 (CI = [.069, .076]), CFI = .88, TLI = .87, SRMR = .039; all item loadings were 0.51 or higher. When the same two error covariances above were included, fit improved, though not quite to acceptable levels, χ2(700) = 2220, p < .001, RMSEA = .069 (.066–.072), CFI = .89, TLI = .88, SRMR = .038. This model was compared to one in which three factors were prespecified, and model fit (including the same correlated errors as above) again was significantly improved, χ2(697) = 1926, p < .001, RMSEA = .062 (.059–.060), CFI = .91, TLI = .91, SRMR = .036. Loadings for this model ranged from .56 to .85 for the Representation subscale, .73 to .90 for the Planning subscale, and .59 to .91 for the Monitor/Execute subscale (Table 4). As expected, all three subscales/factors correlated strongly with one another (r = .93–.94) at the latent level. As with the absolute version, additional modeling iterations did not result in clearly superior model fits and so are not discussed.
The results of these models were output for use in additional analyses. The output factors correlated very strongly with subscales scores generated directly from the raw data, for both the absolute (r = .92–.97) and relative (r = .96–.98) versions of EF RPM. This is expected given the high factor loadings of the items. All subscales also correlated similarly highly with a total score. Therefore, and for simplicity, subsequent analyses were performed on the raw data rather than the (latent) factor scores; doing so also provided the opportunity to compare results and the subscale versus total scale levels directly.
Distributions and Reliability
Visual/graphical inspection of distributions, along with distributional statistics (see Table 5), revealed the following. The absolute version of the EF RPM scale displayed minor negative skew, primarily for the Representation subscale. The relative version showed a normal distribution, even for subscales. Among other scales (where parents were asked to identify problems), all showed some positive skew (indicating that problems were more rare than not). Coefficient alpha reliability values also appear in Table 5. All scales (and subscales) showed excellent reliability – all values were α = .89 or higher.
Distributional Statistics and Reliabilities, By Scale.

Note. EF = Executive Function; EF RPM Absolute = Executive Function Absolute Scale; EF RPM Relative = Executive Function Relative Scale; SCT = Sluggish Cognitive Tempo. Range descriptions: EF RPM Absolute (1 = Rarely, 2 = Sometimes, 3 = More Often Than Not, 4 = Almost Always). EF RPM Relative (1 = This Is Very Difficult, 2 = This Is Weak, 3 = This Is About Average, 4 = This Is Good, 5 = This Is Excellent). Barkley EF (1–4 scale ranging from 1 (Never or Rarely) to 4 (Very Often)). Barkley Functional Outcome (0–9 scale ranging from 0 (Not at All) to 9 (Severe)). Barkley SCT (1–4 scale ranging from 1 (Never or Rarely) to 4 (Very Often)). NICHQ Vanderbilt – all subscales (0–3 scale ranging from 0 (Never) to 3 (Very Often)). N refers to N analyzed (see Table 2).
Relations Between EF RPM Versions and Subscales
Correlations appear in Table 6. For correlations with Barkley SCT, N = 197; for the correlation of the two versions of the EF RPM scale with one another, N = 294. All other N for correlations range from 454 to 760. The two versions of EF RPM (absolute and relative) correlated with one another r = .72 at the total scale level. Respective correlations for subscales of Representation, Planning, and Monitor/Execute (within and across absolute and relative versions) also appear in Table 6.
Correlations Within and Among EF RPM Versions.

Note. All p < .001. EF RPM Absolute = Executive Function Absolute Scale, EF RPM Relative = Executive Function Relative Scale, subscales of each EF RPM scale are indented.
Relations With External Variables
These correlations are shown in Table 7. As shown, both absolute and relative EF measures relate substantially with the BDEFS-CA, and to a similar degree with the NICHQ Vanderbilt ADHD Inattention subscale (range r = −.54 to −.64); correlations with other variables (BSCTS-CA, NICHQ Vanderbilt ADHD Hyperactive/Impulsive subscale, NICHQ Vanderbilt ODD subscale) were all modest (range r = −.22 to −.37). Finally, absolute and relative versions of the EF RPM scale correlated modestly with the Barkley functional outcomes scale (BFIS-CA, r = −.33 and −.20, respectively). All these correlations being negative is due to the fact that the EF scales are framed so that higher scores reflect better functioning, whereas the other scales are all problem scales, and higher scores reflect worse functioning. The BDEFS-CA showed substantial correlations with sluggish cognitive tempo (BSCTS-CA, r = .59) and even stronger correlations with all NICHQ subscales (range r = .75–.87). The BDEFS-CA correlated r = .53 with the BFIS-CA.
Correlations of EF RPM Versions With External Variables.

Note. All p < .001 except where otherwise noted (*p < .05). EF RPM Absolute = Executive Function Absolute Scale; EF RPM Relative = Executive Function Relative Scale; SCT = Sluggish Cognitive Tempo. For correlations with Barkley SCT, N = 197. All other N range 454 to 760.
Other external variables (not shown in Table 6) considered included age, grade, and rated achievement. The relative version of the EF RPM scale, and BDEFS-CA, showed negligible and nonsignificant relations with age and grade. In contrast, the absolute version of EF RPM showed a significant, positive, albeit weak, relation with both age (r = .10, p < .026) and grade (r = .12, p < .011). Both versions of the EF RPM scale, and the BDEFS-CA EF scale, had significant relations with parent-reported grades of their children, range r = |.32 to .34|.
Finally, although we did not have a priori hypotheses about demographic descriptors, we did evaluate the EF measures against these, including SES, school type, race/ethnicity, and parent-reported diagnosis (treated with caution given that these were not verifiable). For EF RPM (absolute), these variables were predictive, F(11,454) = 5.95, p < .001, R2 = .13; the only unique predictor was parent-reported diagnosis (p < .001). For EF RPM (relative), the pattern was similar, F(11,429) = 7.82, p < .001, R2 = .13, diagnosis p < .001. The same pattern was evident for the BDEFS-CA, though, here, demographic factors accounted for a substantially larger proportion of variance, F(11,456) = 14.44, p < .001, R2 = .26, diagnosis p < .001. For both EF RPM versions and the BDEFS-CA, better EF was associated with either no diagnosis or an affective disorder (these did not differ from one another), relative to a diagnosis of ADHD or a comorbid disorder (these did not differ from one another).
Discussion
The goal of this study was to introduce two versions of a parent rating measure of executive functioning (EF) that reflect the process model (RPM) of Cirino (2023), and report on the properties of the EF RPM scale. The primary difference between the versions is whether ratings were made on an absolute (i.e., raw frequency) versus relative scale (i.e., more/less than peers). Results largely supported hypotheses, with some variability.
We expected CFA results to yield a three-factor solution, but for a unitary model to show adequate fit, given that the model views EF as a singular process. For the EF RPM absolute version, the three-factor solution was indeed the best fit, but a unitary model did not show adequate fit, despite the latent factors showing very high intercorrelations as expected. For the relative version of the EF RPM scale, there were smaller differences between the unitary and three-factor model, with even higher latent inter-factor correlations. It is relevant to note that despite its componential approach, latent factors of the BRIEF-2 correlate to a similar degree as do the EF RPM scales, though more so in the standardization sample versus in clinical samples (Gioia et al., 2015). The reason for the relative version having slightly better fit characteristics is not immediately obvious, although this version did include a response option of “average/about the same” as peers, which may have served to anchor other responses, enhancing consistency across items. We expected a normal distribution for scales and subscales, and this was the case, though it was more strongly evident for the relative versus absolute version. Finally, we expected high internal consistency metrics, and α values were above .90 for all scales and subscales.
We expected strong relations between the versions of the EF RPM scale (see Table 6), and this was the case at the overall (r = .72) and subscale (r = .63–.71) levels; even cross-correlations (e.g., Representation subscale of one version with the Planning scale of the other) were robust (r = .53–.71). These data suggest consistency and similarity among versions and are consistent with a unitary EF process model. These correlations can be seen as an example of alternate form reliability, and these values are comparable to test–retest reliability values of the BRIEF-2 (Gioia et al., 2015) and the BDEFS-CA (Barkley, 2012a).
Regarding the relation of the two versions of the EF RPM scale to external correlates (see Table 7), we expected moderate relations with the EF scale of Barkley (2012a). The observed relation was in line with expectations (r = −.56 and −.64). These values are similar in range to the relation of the BDEFS-CA with other EF scales (Barkley, 2012a; Nilsen et al., 2017), and significantly lower than the relation of the two new scales with one another (r = .72), both p < .007 (Hoerger, 2013; Onwuegbuzie & Daniel, 1999; Steiger, 1980).
As expected, the absolute version of the EF RPM scale correlated positively and significantly with age and grade, while the relative version, and Barkley EF scale, did not. This makes sense given that the latter two already account for age by comparing probands to age peers, whereas the absolute version of EF RPM assesses behavioral frequency directly. It should be noted that the effect size (i.e., the correlation) of this relation was small.
We also expected the new EF RPM measure to correlate significantly with functional outcomes. Each of the absolute and relative versions correlated only modestly (r = −.33 and −.20, respectively) with the BFIS-CA (Barkley, 2012b). The two Barkley scales related more strongly with one another (r = .53), although method variance may have increased this relation. For example, both Barkley scales ask about problem behaviors (and the EF RPM does not), and so are bounded in that it is not possible to be rated as doing “very well” or “much better than peers.” Future studies should discern whether other functional outcome scales with different rating options yield similar versus different results. Achievement in school is a related functional outcome, and we expected that all EF measures would relate to parent-reported achievement (i.e., grades); this was the case, and to a similar degree (r ~ .33 for all); of note, unlike for the broader functional outcome scale, the method overlap was reduced for correlations with grades.
All EF scales were related to non-EF indices, specifically to behavioral symptomatology (e.g., ADHD, ODD, and sluggish cognitive tempo). The pattern of correlations was consistent, along three main lines. First, all EF scales correlated significantly with all symptom indices. Second, both the absolute and relative versions of the EF RPM scale showed the same pattern and magnitude of relations; the strongest of these was for inattention (r = −.54/−.59), and the weakest was for sluggish cognitive tempo (r = −.26/−.22). Third, the Barkley EF scale correlated much more strongly with each of these same symptoms (all p < .001). In corollary, for inattention, overactivity, and oppositionality, each were near to a non-discriminant level (all were r = .75–.87). Such values are similar or higher in value compared to both (a) test–retest values of EF measures (and to the alternate form relation of the EF RPM scale in this study), and to (b) correlations of two ADHD-specific scales (r = .80–.85 for like-to-like scales and total scores; DuPaul et al., 2016 – see also Alhajji et al., 2025); they are also (c) consistent with the upper end of prior results comparing EF rating scales with symptoms of ADHD (Barkley, 2012a; McAuley et al., 2010; Miranda et al., 2015; O’Brien et al., 2021; Toplak et al., 2009). Overall, the pattern indicated that the new EF RPM scales show better discriminant validity with non-EF measures than does the BDEFS-CA. This was as expected, given that care was taken to not ask about problems, and to make sure that no items that closely resemble specific diagnoses were included. The results reflect that EF (as measured by the present EF RPM scale) is related to ADHD and similar conditions (e.g., Willcutt et al., 2005), but clearly separable from these, just as it is meant to be theoretically from related domain general cognitive functions (e.g., working memory, inhibition, shifting).
Implications/Utility
A key rationale for developing the EF RPM scale was to have a tool that evaluates EF as a unique individual difference relevant for important goal-directed outcomes, separate from other relevant constructs. It is well-known that correlations among performance measures of EF are poor (Cirino et al., 2018; Miyake et al., 2000; Toplak et al., 2013); these low relations occur for multiple reasons, including weak psychometric properties, differences in difficulty level, and other method characteristics. Rating scale measures of EF do not experience the same issue, as shown in this study (see also Nilsen et al., 2017). Furthermore, the relation between performance measures and rating scales is also known to be low, for EF as well as other cognitive domains (e.g., Conklin et al., 2000; Nordvall et al., 2017; Soto et al., 2020; Toplak et al., 2013; Vriezen & Pigott, 2002). Despite this, performance measures of EF do predict functional outcomes, both alone (Hallowell & Van Patten, 2022; Raimo et al., 2024), and in complementary fashion with rating scales (Gerst et al., 2017). Finally, existing rating scale measures of EF relate strongly (sometimes perhaps too strongly) with rating scales of diagnostic symptomatology (McAuley et al., 2010; Miranda et al., 2015; Toplak et al., 2009). The present data cannot discern practical issues such as the extent to which these new measures relate to performance EF (or to naturalistic assessments), or theoretical issues such as whether rating scales versus performance measures assess what is the “real” EF. It is also beyond the scope here to make conclusions about how EF is instantiated in the brain; at present, the focus is on EF from a psychological rather than biological perspective. Of course, each of the above questions is vital to consider in extension to the focus of the present study.
Nonetheless, the results do provide an empirical demonstration that the EF RPM measure described here includes advantages of being (a) informed as a direct instantiation of a model of EF, with (b) supporting factorial structure, (c) strong psychometric properties (e.g., reliability), (d) supportive convergent validity relations with other measures of EF, and (e) solid discriminant validity from diagnostic rating scales. Given these results, it is possible that the EF RPM scale may yield more demonstrable incremental variance over other rating scales of EF, performance measures of EF, or other diagnostic symptom indexes. This would be a fruitful avenue of exploration in future studies.
It may be useful to consider possible practical examples. Any particular goal (e.g., getting a good grade in math) is dependent on a number of skills (math skill, prior experience, working memory, math anxiety, motivation, and others). Another goal (e.g., medical adherence in diabetes) is also dependent on numerous skills (health literacy, mood, education, working memory, and others). These and other goals, tasks, or problems may vary in the number, kind, and extent to which various component skills are needed, and the extent to which these overlap. Regardless of the domain general (or domain-specific) component skills, we suggest that EF as conceptualized here would still manifest itself in terms of the follow-through from identification and representation of that goal over an extended time span, to planning how to succeed, to monitoring and executing that plan. In other words, even for very different goals (so long as they are challenging and not automatized), and even if they require different component cognitive skills, and whether those skills are domain general or domain-specific, the same EF RPM process is likely relevant. Efficiently navigating this process can also help explain cases where two individuals are either “low” or “high” in terms of a given domain general and/or domain-specific constituent skill needed to complete a goal, but nonetheless have very different outcomes. The EF RPM process is construed as a proximal cause as to whether tasks are completed (or not) or mis-implemented. Assessing this process efficiently could improve prediction and intervention, though further work is needed for such a demonstration.
In regard to the two versions of the EF RPM scale, both avoid requiring raters to judge how problematic a particular behavior is, which can introduce a positive skew into distributions. However, the absolute version additionally avoids requiring raters to make an implicit comparison of whether it is more or less than it “should” be relative to peers – and instead simply asks about frequency of occurrence. This is important, particularly as raters’ experience with their child’s same-age peers, knowledge of typical development, and expectations of behavior is likely to vary widely. Thus, our preference is for the absolute version, but future work is clearly needed to establish which or whether one version is more useful across situations. We also acknowledge that it would take deliberate norming studies to determine what level of representation, planning, and monitor/execute is typical for a given age. Also, a broader frequency scale (e.g., five or six levels vs. four) might improve discriminability without requiring raters to make impracticable ratings.
Limitations
Readers should be aware of four main limitations of the present study. First, data collection was via an online survey rather than a census-based normative sample. Participants were also predominantly white and more educated compared to census proportions. However, we followed proper guidelines and took caution to ensure data verifiability, and participants did vary widely in geographical location, socioeconomic status, and child ages. With this caution, the current findings require replication in a more diverse population to ensure generalizability.
Second, we used an unselected sample. While examining EF properties in either specific or general clinical populations is an important future direction, EF, as an individual difference unitary process, should show variability in any population. If this were not so, and EF was only weak following a neurological injury or lesion, then its distribution would be highly skewed regardless of the scale and/or response options. This is similar to how adaptive functioning measures are construed in the general population, where most individuals are expected to master certain skills (e.g., answer the telephone, dress themselves) by a certain age, and thus variability is primarily evident in cases such as intellectual disability. This was a key reason to explicitly develop a version of the current scale that does not ask whether a given behavior “is a problem.” This does not rule out that, for example, factor analytic results may vary from those presented here, in a (mixed or specific) clinical sample; this would be another productive future avenue.
Third, no doubt a number of other assessments could be related to the present scales, to provide further evidence for or against either convergent or discriminant validity. These include other EF scales (e.g., BRIEF-2) or cognitive or achievement or motivational measures, or even adaptive measures as above where behaviors are not framed as problems. Evaluating relations of the EF RPM scale to such measures in subsequent studies would certainly be beneficial.
Fourth, the present study was restricted to parent ratings. Thus, it is possible that different patterns of relations may be evidenced by other informants (e.g., self or teachers). Nonetheless, the present study is a starting point with solid initial evidence for the psychometric properties of these measures of EF RPM, in line with the model of Cirino (2023).
Conclusion
Overall, the present work shows initial evidence of reliability and validity for two versions of a scale developed to assess the theoretical process model (RPM) of EF from Cirino (2023). The generated items aligned with their assigned factor, and the factors were strongly related to one another as expected, given the expectation of EF as a unitary process. The EF RPM scale showed good convergent validity with another EF scale and showed expected relations with functional outcomes and demographic characteristics. With regard to behavioral symptom indices, the two versions of the EF RPM scale demonstrated better discriminant validity, relative to a different EF scale. As one study, it was not possible to cover every aspect of modern validity, though the present provides a promising start. Future work needs to gather additional evidence for these scales in different contexts and settings (e.g., in specific populations, in clinics) and in relation to other outcomes (e.g., achievement, daily life outcomes, cognitive variables).
Supplemental Material
sj-docx-1-asm-10.1177_10731911261442022 – Supplemental material for The Executive Function RPM Parent Rating Scale for Children: Purpose and Properties
Supplemental material, sj-docx-1-asm-10.1177_10731911261442022 for The Executive Function RPM Parent Rating Scale for Children: Purpose and Properties by Paul T. Cirino, Cristina E. Boada and Cassidy M. Salentine in Assessment
Footnotes

Funding
The authors disclosed receipt of the following financial support for the research, authorship, and/or publication of this article: This research was supported in part by Award Number P50 HD052117, Texas Center for Learning Disabilities, from the Eunice Kennedy Shriver National Institute of Child Health & Human Development. The content is the sole responsibility of the author and does not necessarily represent the official views of the Eunice Kennedy Shriver National Institute of Child Health & Human Development or the National Institutes of Health.
Declaration of Conflicting Interests
The authors declared no potential conflicts of interest with respect to the research, authorship, and/or publication of this article.
Supplemental Material
Supplemental material for this article is available online.
References
Supplementary Material
Please find the following supplemental material available below.
For Open Access articles published under a Creative Commons License, all supplemental material carries the same license as the article it is associated with.
For non-Open Access articles published, all supplemental material carries a non-exclusive license, and permission requests for re-use of supplemental material or any part of supplemental material shall be sent directly to the copyright owner as specified in the copyright notice associated with the article.
