
Abstract
We developed the Multidimensional Adolescence Anhedonia Scale (MAAS), a novel measure designed to assess not only consummatory and anticipatory, but also recall anhedonia in adolescents. In Study 1 (n = 623; Mage = 19 years), an initial item pool was tested across two subsamples of older adolescents. After exploring a 24-item version in Subsample A (n = 311), we confirmed its structure and developed a brief version in Subsample B (n = 312). This structure was further confirmed and validated in a younger adolescent sample (Study 2; n = 375; Mage = 16 years) who completed items at baseline and 6 months later. Across samples and versions of the measure, a three-factor solution with subscales reflecting consummatory, anticipatory, and recall anhedonia best fit the data. Our measure demonstrated internal consistency and test–retest reliability, concurrence with depression/reward processing scales, and convergence with other anhedonia measures. The MAAS may be used by researchers and clinicians to better understand the multidimensionality of adolescent anhedonia.
Anhedonia, traditionally defined as the loss of interest or pleasure in activities typically enjoyed, is a feature of numerous mental health conditions, ranging from post-traumatic stress disorder to schizophrenia (American Psychiatric Association [APA], 2022). It is also a cardinal symptom of depression, one of the most common mental health conditions in adolescence. In fact, anhedonia has been shown to predict the severity and persistence of adolescent depression, treatment response, and risk for suicidality (Gabbay et al., 2015). Despite this, there remains a paucity of comprehensive measures of anhedonia developed for use in adolescents. Given that adolescence is a unique developmental period with a distinct reward system functioning (Ely et al., 2021), and that experiences of pleasure and motivation differ from those in adults (Hewitt et al., 2023; Watson et al., 2021), there is a need for scales developed with and for this age group. With this aim in mind, we report on the development and validation of a novel, multidimensional measure of anhedonia for use in adolescent populations.
Past work has often framed anhedonia as unitary, emphasizing “loss of pleasure” as central to this experience (Ho & Sommers, 2013). This emphasis on decreased hedonic capacity is reflected in some of the most often used measures of anhedonia, such as the Snaith-Hamilton Pleasure Scale (SHAPS; Snaith et al., 1995). First developed for adult populations, most were designed to measure reduced enjoyment of current rewarding activities or consummatory anhedonia. While important, this definition neglects a growing body of evidence suggesting that anhedonia is a more global and multidimensional construct. For example, the DSM-5 definition of anhedonia in depression mentions interest alongside pleasure (APA, 2022). In keeping with this heterogeneous conceptualization, additional work has aimed to measure anhedonia across multiple dimensions.
Multidimensional measures of anhedonia are differentiated in several ways. One of the most common distinctions is temporally based, distinguishing consummatory or present-oriented anhedonia from anticipatory or future-oriented anhedonia (Klein, 1987). Whereas consummatory anhedonia is associated with satiation and momentary pleasure (i.e., liking), anticipatory anhedonia is more closely tied to deficient reward motivation and goal-directed activity (i.e., wanting; Ely et al., 2021; Ho & Sommers, 2013). Supporting this distinction, neurobiological and neuroimaging studies implicate discrete neural circuits and neurotransmitters in the experience of wanting/anticipating versus liking a reward (Ely et al., 2021; Sherdell et al., 2012). Furthermore, consummatory and anticipatory anhedonia are linked to disparate clinical outcomes. For example, anticipatory anhedonia has been more strongly linked to depressive symptoms (Sherdell et al., 2012), whereas consummatory anhedonia is more closely related to impaired psychosocial functioning (Vinckier et al., 2017).
The disparate outcomes and pathophysiology underlying these differing manifestations of anhedonia underline the importance of measures (e.g., the Anticipatory and Consummatory Interpersonal Pleasure Scale [ACIPS; Gooding et al., 2016]) that distinguish between its temporal phases. Yet, there is also evidence of an additional temporal category of anhedonia related to past experiences of pleasure (i.e., recall anhedonia; Hewitt et al., 2023; Ho & Sommers, 2013), which has so far been left out of existing scales of depression-related anhedonia in both adults and adolescents. Recall anhedonia may be apparent in mental health conditions such as depression, where impaired recall of positive memories has been well-documented. For example, those with depression recall less vivid positive memories (Werner-Seidler & Moulds, 2011), have diminished and slower access to positively valenced autobiographical past events (Gupta & Kar, 2012), and experience little improvement in mood when asked to recall a positive autobiographical memory (Joormann et al., 2007).
Recent work further highlights deficient positive memory recall as both a symptom and a risk factor for adolescent depression. For instance, depressed, at-risk, and healthy adolescents show a gradient of positive memory deficits (Begovic et al., 2017). Such deficits have also been shown to predict adolescent depressive symptoms at 1-month follow-up (Askelund et al., 2019). Screening for those having difficulty retrieving positive memories and experiencing associated pleasure (i.e., recall anhedonia) may help to identify individuals vulnerable to the persistent course of early-onset depression. Yet, to date, no scales have included recall among temporal facets of anhedonia. Rather, the processes underlying impaired recall of positive experiences are typically measured using time-intensive experimental paradigms or tasks that are ill-suited for screening. This underlines the need for measures of recall anhedonia, which might inform both screening efforts and more nuanced understandings of anhedonia in adolescent populations.
To address these gaps, we developed and tested the Multidimensional Adolescent Anhedonia Scale (MAAS) across two separate studies. Given extant correlations among facets of anhedonia, we aimed to develop a scale that could be used both as a composite measure (i.e., with a total score reflecting a general anhedonia construct) and as a multidimensional measure of specific facets of anhedonia. Based on extant literature (e.g., Ho & Sommers, 2013), we defined these facets of adolescent anhedonia as deficient anticipation of future rewards (i.e., anticipatory anhedonia), decreased enjoyment/interest in present activities (i.e., consummatory anhedonia), and difficulty retrieving positive memories and experiencing associated pleasure (i.e., recall anhedonia). Drawing from this definition, we first developed a large pool of items and evaluated their psychometric properties in a split sample of older adolescents in Study 1. After exploring the dimensionality of these items, we confirmed both long and brief versions of the MAAS structure, which were further tested and validated in a younger adolescent sample in Study 2.
Across both studies, we hypothesized that the MAAS would demonstrate good convergent validity, as evidenced by at least moderate correlations with other anhedonia measures. We also predicted that the MAAS would show good concurrent and discriminant validity, as shown by stronger correlations with measures of psychopathology for which anhedonia is a core symptom (i.e., depression; APA, 2022) compared with disorders for which it is not (i.e., anxiety, disordered eating). Furthermore, we anticipated stronger correlations of the MAAS with constructs closely linked to reward processing (i.e., positive affect, reward responsiveness), compared with those less closely related (i.e., negative affect, behavioral inhibition, impulsive approach; Carver & White, 1994; Watson et al., 1988). Finally, we expected that the MAAS would demonstrate incremental validity by more strongly predicting depressive status (high vs. low depressive symptoms) than other measures of anhedonia (Study 1), and predictive validity by predicting depressive status at 6-month follow-up (Study 2).
Study 1 Methods
Item Development
The initial items for the MAAS were created using the sequential system of test construction (Jackson, 1970). We first developed an operational definition of anhedonia based on a comprehensive literature search on the presentation and experience of anhedonia in adolescents. This operational definition was informed by Ho and Sommers’s (2013) proposed chronological framework of anhedonia and consultations with clinicians specializing in adolescent psychopathology. We then trained a group of experienced research assistants and graduate students in item-writing. They were subsequently provided with the operational definition of anhedonia in adolescence and wrote an approximately equal number of items for each of the anhedonia dimensions: recall, consummatory, and anticipatory. Within each subconstruct of anhedonia, an approximately equal number of items were also written to capture both total loss of pleasure (e.g., “I don’t feel excited about anything anymore”), dampened experience of pleasure (e.g., “I don’t feel as excited about things as before”), and lessened duration of pleasure (e.g., “I get bored faster than I used to”). This was done to more comprehensively capture differing experiences of anhedonia, which may range in degree and severity. Moreover, item writers included items describing pleasure in specific domains (i.e., relationships, school/employment, hobbies/activities, food/drinks) as well as pleasure experienced more broadly.
Importantly, items were also written to be relevant to adolescent interests, activities, and experiences. For example, domain-specific items focused primarily on school, friends, and family, as opposed to work, romantic relationships, or experiences traditionally pleasurable to adults (e.g., the sound of crackling wood in the fireplace) that have been used in previous measures (e.g., the SHAPS; Snaith et al., 1995; the Temporal Experience of Pleasure Scale [TEPS]; Gard et al., 2006). Adolescent-specific experiences of anhedonia were also captured by items describing feelings such as boredom, a common manifestation of decreased pleasure during this time (Spaeth et al., 2015). Additional items reflected salient developmental themes related to adolescence, such as “growing up” or planning for the future. Efforts were also made to limit the reading level of items to ensure they could be easily understood by younger and older adolescents. We further aimed to limit the content to anhedonia rather than other related but less central constructs (e.g., effort, connection), or constructs related to depression (e.g., low mood, self-esteem). This resulted in a total of 575 items developed by the item-writers, of which 122 were selected by study authors after duplicates, double-barreled items, and items that did not reflect the intended construct were removed, in consultation with clinicians specializing in adolescent psychopathology. At this stage, a decision was also made to focus on items describing anhedonia experienced more broadly, rather than within specific domains (e.g., relationships), to facilitate use of the measure with both younger and older adolescents. Below, we report how we determined our sample size, all data exclusions, all manipulations, and all measures in the study.
Participants
In total, 701 older adolescents residing in Canada were recruited from university classrooms and participated in this study in 2020. Participants were excluded if they withdrew consent to participate (n = 15) or terminated the survey before starting the MAAS items (n = 37). Consistent with prior work by our group, we also excluded those who responded incorrectly to 50% or more of the attention check questions (n = 25), and one participant who did not complete any validity measures. The remaining 623 participants were between 16 and 20 years old (M = 19.09, SD = 0.82). Of these participants, 80% identified as girls/women, 19% as boys/men, and approximately 1% as nonbinary or queer, with the majority (37%) self-identifying as Chinese or Chinese/white (see Table 1; Supplemental Table 1). Participants were compensated with course credit. The dataset was further randomly divided into two subsamples using R 4.3.0 (R Core Team, 2023), with the first (Subsample A; n = 311) and second (Subsample B; n = 312) used to explore and confirm the scale structure. 1 The two samples did not differ on mean age, t(621) = 0.45, p = .158, or gender, χ2(1)= 1.06, p = .303.
Sample Characteristics.
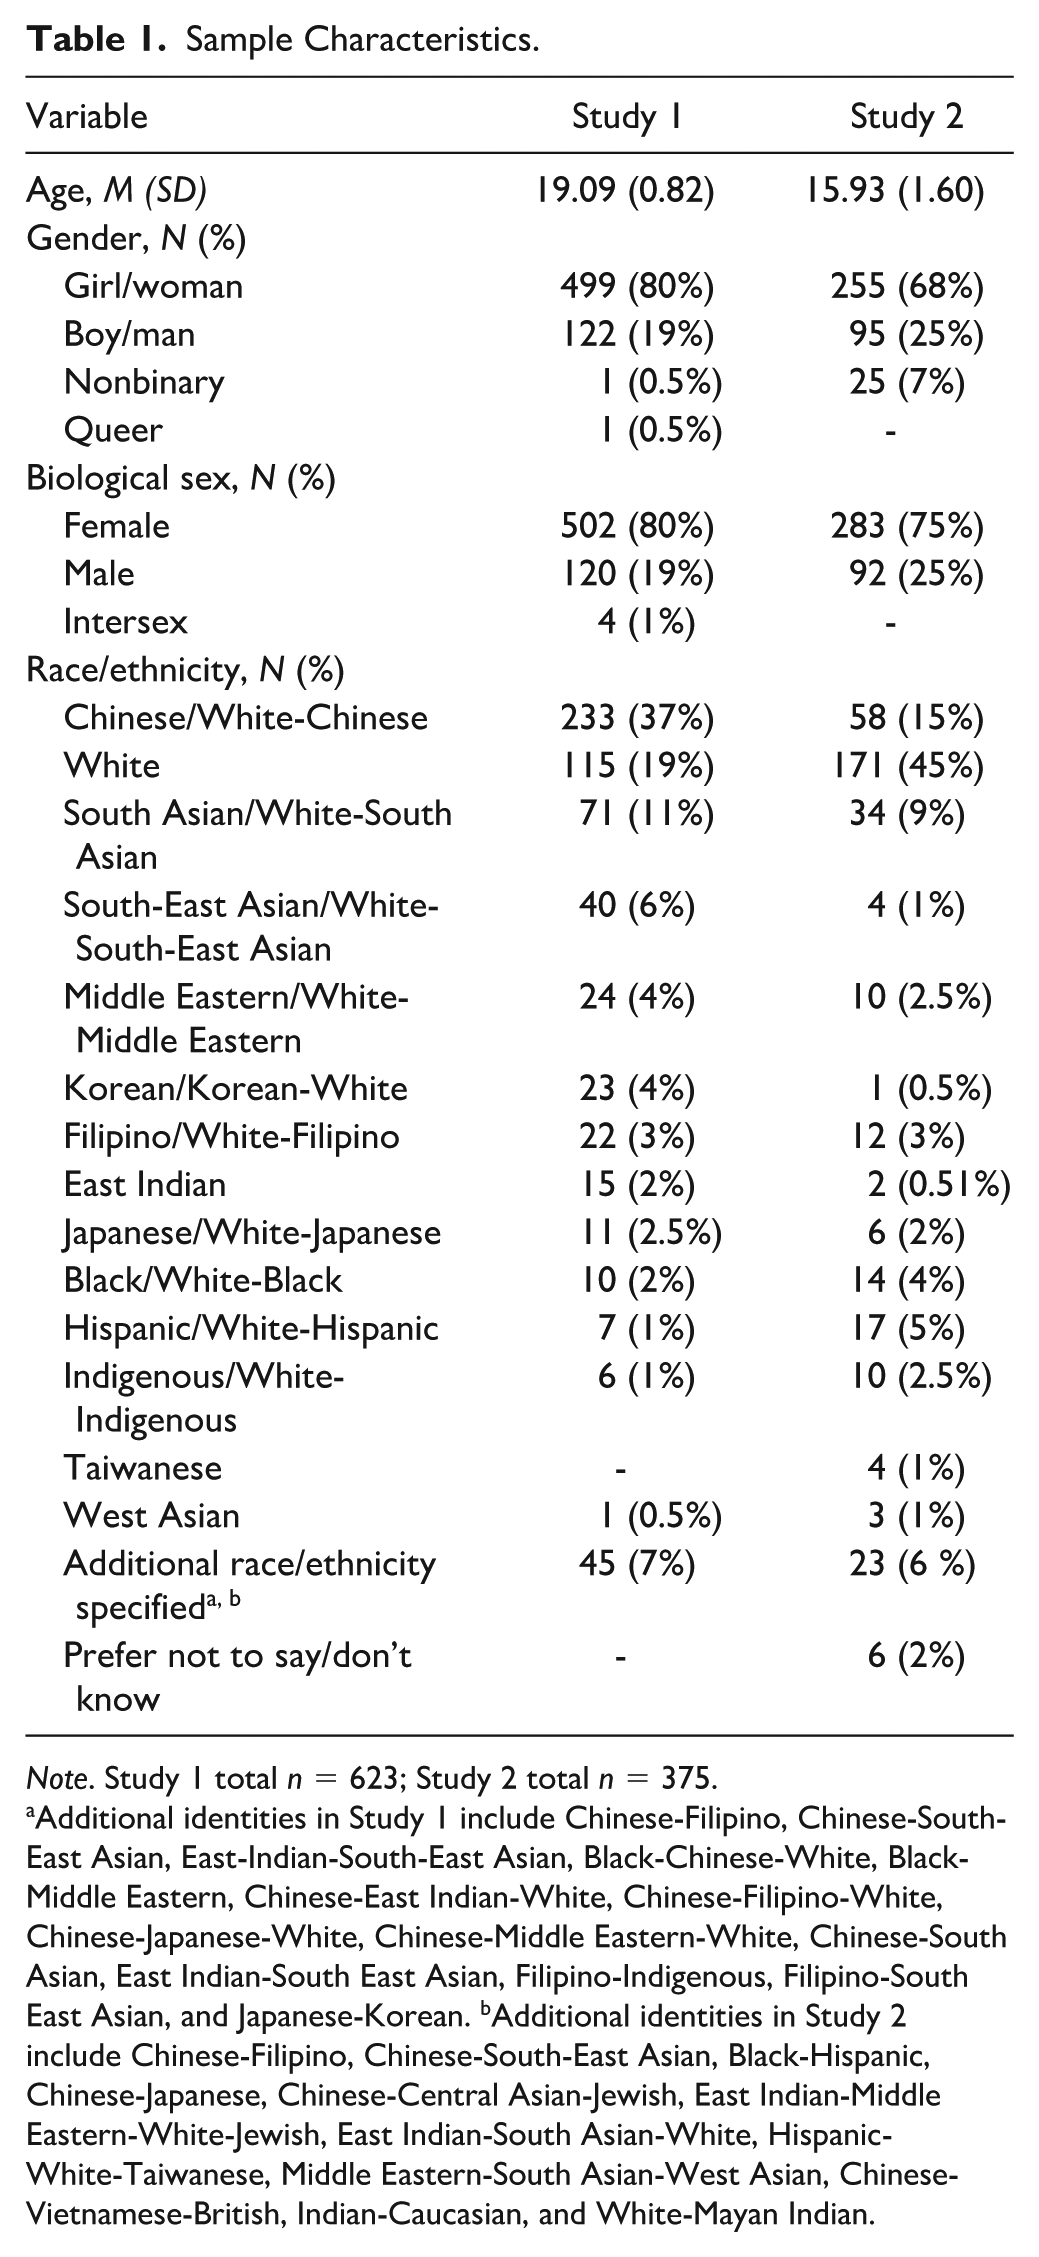
Note. Study 1 total n = 623; Study 2 total n = 375.
Additional identities in Study 1 include Chinese-Filipino, Chinese-South-East Asian, East-Indian-South-East Asian, Black-Chinese-White, Black-Middle Eastern, Chinese-East Indian-White, Chinese-Filipino-White, Chinese-Japanese-White, Chinese-Middle Eastern-White, Chinese-South Asian, East Indian-South East Asian, Filipino-Indigenous, Filipino-South East Asian, and Japanese-Korean. bAdditional identities in Study 2 include Chinese-Filipino, Chinese-South-East Asian, Black-Hispanic, Chinese-Japanese, Chinese-Central Asian-Jewish, East Indian-Middle Eastern-White-Jewish, East Indian-South Asian-White, Hispanic-White-Taiwanese, Middle Eastern-South Asian-West Asian, Chinese-Vietnamese-British, Indian-Caucasian, and White-Mayan Indian.
Procedures
Approval from the Institutional Research Ethics Board was obtained before recruitment. Participants provided consent, after which they completed a 1-hour online survey that included a demographic questionnaire, 122 anhedonia items developed by the research team, and several questionnaires assessing convergent, discriminant, and concurrent validity of these items.
Measures
MAAS Item Pool
The 122 self-report items developed and selected by the research team were presented individually to participants. Participants rated the past 2-week frequency of each item on a 5-point Likert-type scale (from 1 = not at all to 5 = nearly every day).
Convergent Validity
Convergent validity of the MAAS was assessed via associations with additional measures of anhedonia. The SHAPS (Snaith et al., 1995) is a 14-item self-report measure assessing pleasurable experiences in the past few days. Items capture pleasurable experiences relating to interests and pastimes, social activities, sensory experiences, and food and drink. Higher scores reflect higher levels of anhedonia. Good to acceptable internal consistency was demonstrated across Subsamples A and B, α = .78–.86.
The Dimensional Anhedonia Rating Scale (DARS; Rizvi et al., 2015) is a 17-item self-report measure that assesses anhedonia in four domains (social activities, pastimes/hobbies, sensory experiences, and food/drinks). Participants gave examples of enjoyed activities in each category and then rated desire, motivation, effort, and consummatory pleasure for the examples provided, with higher scores indicating less anhedonia (Rizvi et al., 2015). Excellent to acceptable internal consistency for the DARS total score and subscales was demonstrated across Subsamples A and B (DARS Total: α = .93–.93, DARS Social: α = .86–.86, DARS Hobbies: α = .90–.93, DARS Sensory: α = .93–.93, DARS Food/Drinks: α = .74–.79).
The Anticipatory and Consummatory Interpersonal Pleasure Scale-Adolescent (ACIPS-A; Gooding et al., 2016) is a 17-item self-report measure that assesses consummatory and anticipatory anhedonia in the social domain (Gooding et al., 2016), with higher scores indicating lower social anhedonia (Gooding et al., 2016). The ACIPS-A and its subscales demonstrated good to acceptable internal consistency in Subsamples A and B (ACIPS-A Total: α = .88–.89; ACIPS-A Consummatory: α = .81–.84; ACIPS-A Anticipatory: α = .74–.74).
Concurrent and Discriminant Validity
Concurrent and discriminant validity of the MAAS was assessed by examining associations with measures assessing related constructs (i.e., depression, positive affect, reward responsiveness) relative to less-related constructs (i.e., anxiety, negative affect, behavioral inhibition, and impulsivity-related behavioral approach). The Center for Epidemiological Studies Depression Scale for Children (CES-DC; Faulstich et al., 1986) is a 20-item self-report measure of depressive symptom frequency for children and adolescents. Higher scores indicate greater depressive symptom severity. The CES-DC demonstrated excellent internal consistency (α = .91) across both subsamples.
The Generalized Anxiety Disorder-7 (GAD-7; Spitzer et al., 2006) is a 7-item self-report measure of generalized anxiety disorder symptoms, where higher scores indicate greater symptom severity (Faulstich et al., 1986). The GAD-7 demonstrated excellent internal consistency across both subsamples, α = .90–.91.
The Positive and Negative Affect Scale (PANAS; Watson et al., 1988) is a 20-item self-report measure that assesses past-week positive and negative affect, each captured by 10 items. The PANAS Positive affect subscale, α = .88–.89, and the PANAS Negative affect subscale, α = .87–.89, both demonstrated good internal consistency across both subsamples.
The Behavioral Inhibition and Activation System scale (BIS-BAS; Carver & White, 1994) is a 24-item self-report questionnaire designed to measure two motivational systems: behavioral approach (BAS) and behavioral inhibition (BIS). The BAS comprises three subscales assessing motivation to follow one’s goals (BAS-Drive), impulsivity-related behavioral approach toward novel environmental rewards (BAS-Fun Seeking), and sensitivity to pleasant reinforcers in the environment (BAS-Reward Responsiveness). Higher scores indicate greater behavioral activation. The BAS demonstrated good to acceptable internal consistency across all subsamples (BAS-Drive: α = .77–.81; BAS-Fun: α = .73; BAS-Reward: α = .75–.76), although estimates for the BAS-Fun subscale fell slightly below a cut-off of .70 in Subsample A (α = .66). The Behavioral Inhibition Scale (BIS; Carver & White, 1994) assesses motivation to avoid aversive outcomes, with higher scores indicating greater behavioral inhibition. The BIS demonstrated good to acceptable internal consistency across both subsamples, α = .74–.82.
Data Analytics Plan
Exploring the Factor Structure
Subsample A (n = 311) was used for exploratory factor analysis (EFA) using R 4.3.0 (R Core Team, 2023). We first examined inter-item correlation matrices to identify items with consistently high (>.80) or low (<.30) correlations across the item pool. After removing these items, we conducted parallel analysis and examined the scree plot of actual and simulated Eigenvalues to determine the number of factors to retain for the initial EFA. Next, EFA with principal axis factoring (PAF) (due to multivariate non-normality) and Promax rotation was conducted using the fa function in the psych package in R (Revelle, 2024). We first ran an initial PAF to facilitate the elimination of items based on low communalities, lower factor loadings, or higher cross-loadings while still retaining items within each subcategory of the original hypothesized dimensions of anhedonia (i.e., consummatory, anticipatory, and recalled). Factor loadings of .30 were considered acceptable, with a preference for loadings >.40 and cross-loadings < .32 (Tabachnick & Fidell, 2014). Subsequently, a second PAF was run with 24 items. All plausible factor solutions were explored using the following model fit indices: Tucker–Lewis incremental fit index (TLI; Tucker & Lewis, 1973; > .90 = acceptable, > .95 = good fit, > .97 = very good fit) and the root mean square error of approximation (RMSEA; < .08 = acceptable fit, < .06 = good fit; Browne & Cudeck, 1992; Hu & Bentler, 1999; Steiger & Lind, 1980), and the percentage of variance explained (>50% acceptable).
Confirming the Factor Structure
Subsample B (n = 312) was next used for CFA using maximum likelihood estimation with Satorra-Bentler scaled chi-square test statistic and robust standard errors to test the factor structure. CFA models were specified using the Lavaan package in R (Rosseel, 2012). Each item was specified to load on only one factor. Robust maximum likelihood estimation was used over its standard variant, given its appropriateness for ordinal Likert-type-scale questionnaire data (Li, 2016). In addition to the relevant criteria mentioned above, model fit was evaluated based on robust Comparative Fit Index (CFI) values approaching 1 (> .9 acceptable fit; > .95 good fit, > .97 very good fit), and standardized root mean square residual (SRMR) values approaching 0 (< .08 acceptable fit, < .06 good fit). We also examined and reported the largest standardized model residuals. Given our stated aims of developing the MAAS as a measure of one underlying construct (i.e., anhedonia) as well as a multidimensional measure of its temporal sub-facets, we also evaluated the fit of a second-order CFA where items were indicators of anhedonia subscales, and these subscales were indicators of an overall factor.
Although longer versions of a scale may be useful by allowing for more diverse content coverage across the full breadth of a construct while maximizing reliability, we also aimed to develop a brief version to increase MAAS accessibility in contexts with time constraints (e.g., clinical settings; Groth-Marnat, 2009). Thus, separate CFA analyses were undertaken using Subsample B to (a) confirm the structure of the 24-item version from subsample A, and (b) further eliminate items using psychometric information (e.g., factor loadings, impact on reliability coefficients and factor analysis fit indices) as well as conceptual criteria (i.e., removing similar or redundant items while still capturing content breadth), resulting in a brief version of the scale. In doing so, we adhered to current recommendations for short-form measure development where appropriate (e.g., Smith et al., 2000).
Internal Consistency, Reliability, and Validity
To assess internal consistency, we calculated Cronbach’s alpha (α) and McDonald’s omega (ω) using the psych (Revelle, 2024) and MBESS (Hayes & Coutts, 2020; Kelley, 2007) packages in R. Due to the non-normal distribution of MAAS items, convergent, discriminant, and concurrent validity were estimated using Spearman correlations calculated using the stats package (R Core Team, 2023). rs values less than .30 were considered small, with medium rs values ranging from .30 to .50, and large rs values greater than or equal to .50 (Cohen, 1988). We also compared the statistical difference in the strength of correlations between the MAAS and concurrent and discriminant measures using an online calculator developed by Lenhard and Lenhard (2014). To test for incremental validity, we conducted hierarchical linear regressions to determine whether MAAS responses predicted depressive symptoms (i.e., CES-DC scores; Faulstich et al., 1986) above and beyond other measures of anhedonia (i.e., SHAPS; Snaith et al., 1995; ACIPS-A; Gooding et al., 2016; DARS; Rizvi et al., 2015). We also ran linear regression models regressing depressive symptoms on all three MAAS subscales to determine which contributes the greatest predictive power. All analyses were re-run with the brief version of the MAAS to separately establish reliability and validity.
Study 1 Results
EFA in Subsample A
The factor structure of the draft 122-item questionnaire was first explored in Subsample A. After first examining inter-item correlation matrices, we removed 3 items with consistently very high (more than 10 rs > .80) and 1 item with very low (more than 10 rs < .30) correlations across the item pool. These changes resulted in 118 items, after which the Kaiser–Meyer–Olkin (KMO) measure (.98) and significant Bartlett’s test of sphericity (p < .001) verified the sampling adequacy for this analysis.
Preliminary Exploration of the Factor Structure and Item Reduction
A parallel analysis (Horn, 1965) was first conducted, suggesting four factors be retained. This output was compared with the scree plot of actual and simulated eigenvalues, which displayed one large factor and a break after four factors for the actual data, with four factors clearly visible above the line for simulated data (see Supplemental Figure 1). Thus, a PAF with an Oblique Promax Rotation (due to correlations between factors; de Winter & Dodou, 2011) was run with the four-factor solution explored. The solution produced was theoretically salient, with factors representing consummatory anhedonia (e.g., “I don’t enjoy things as much as I used to”) and anticipatory anhedonia (e.g., “I no longer look forward to the future). Two additional factors comprise items which captured absent recall of pleasurable experiences and lack of pleasure experienced with recall. Although diverging somewhat from the hypothesized dimensionality of the scale, these subscales were strongly correlated and were thought to reflect the large number of items included in this initial PAF. Thus, this four-factor solution was used to facilitate item removal within dimensional categories. Items were removed based on low communalities and factor loadings, with 14 items eliminated due to loading less than .40 across all factors and 3 items removed due to having communalities <.50. We next eliminated many items deemed to be more poorly worded (e.g., “I lose interest faster in things I used to like”), less applicable to the experience of adolescents in content (e.g., “I am less excited about playing compared to before”), or redundant with other items due to similar wording.
Importantly, items were also removed with content validity in mind to ensure items representing key aspects of conceptual content were retained (Flora & Flake, 2017). For example, items in the recall anhedonia subscale retained content that captured both a lack of pleasure upon recall and deficient recall of positive emotions or experiences using multiple positive emotion descriptors (e.g., enjoyment, excitement). Items in the anticipatory anhedonia subscale likewise included content referring to both a total loss and a decrease in the duration or intensity of positive emotions (e.g., excitement, enjoyment), as well as increased boredom when anticipating future events. The consummatory anhedonia subscale further included items capturing loss or change in the duration or intensity of interest, excitement, and enjoyment, as well as boredom. This resulted in a total of 24 items being included for further exploration, reflecting consummatory (8 items), anticipatory (8 items), and recalled (8 items) dimensions of anhedonia (see Table 2; see Supplemental Table 2).
Factor Loadings for the 24-item MAAS Three-Factor Solution.
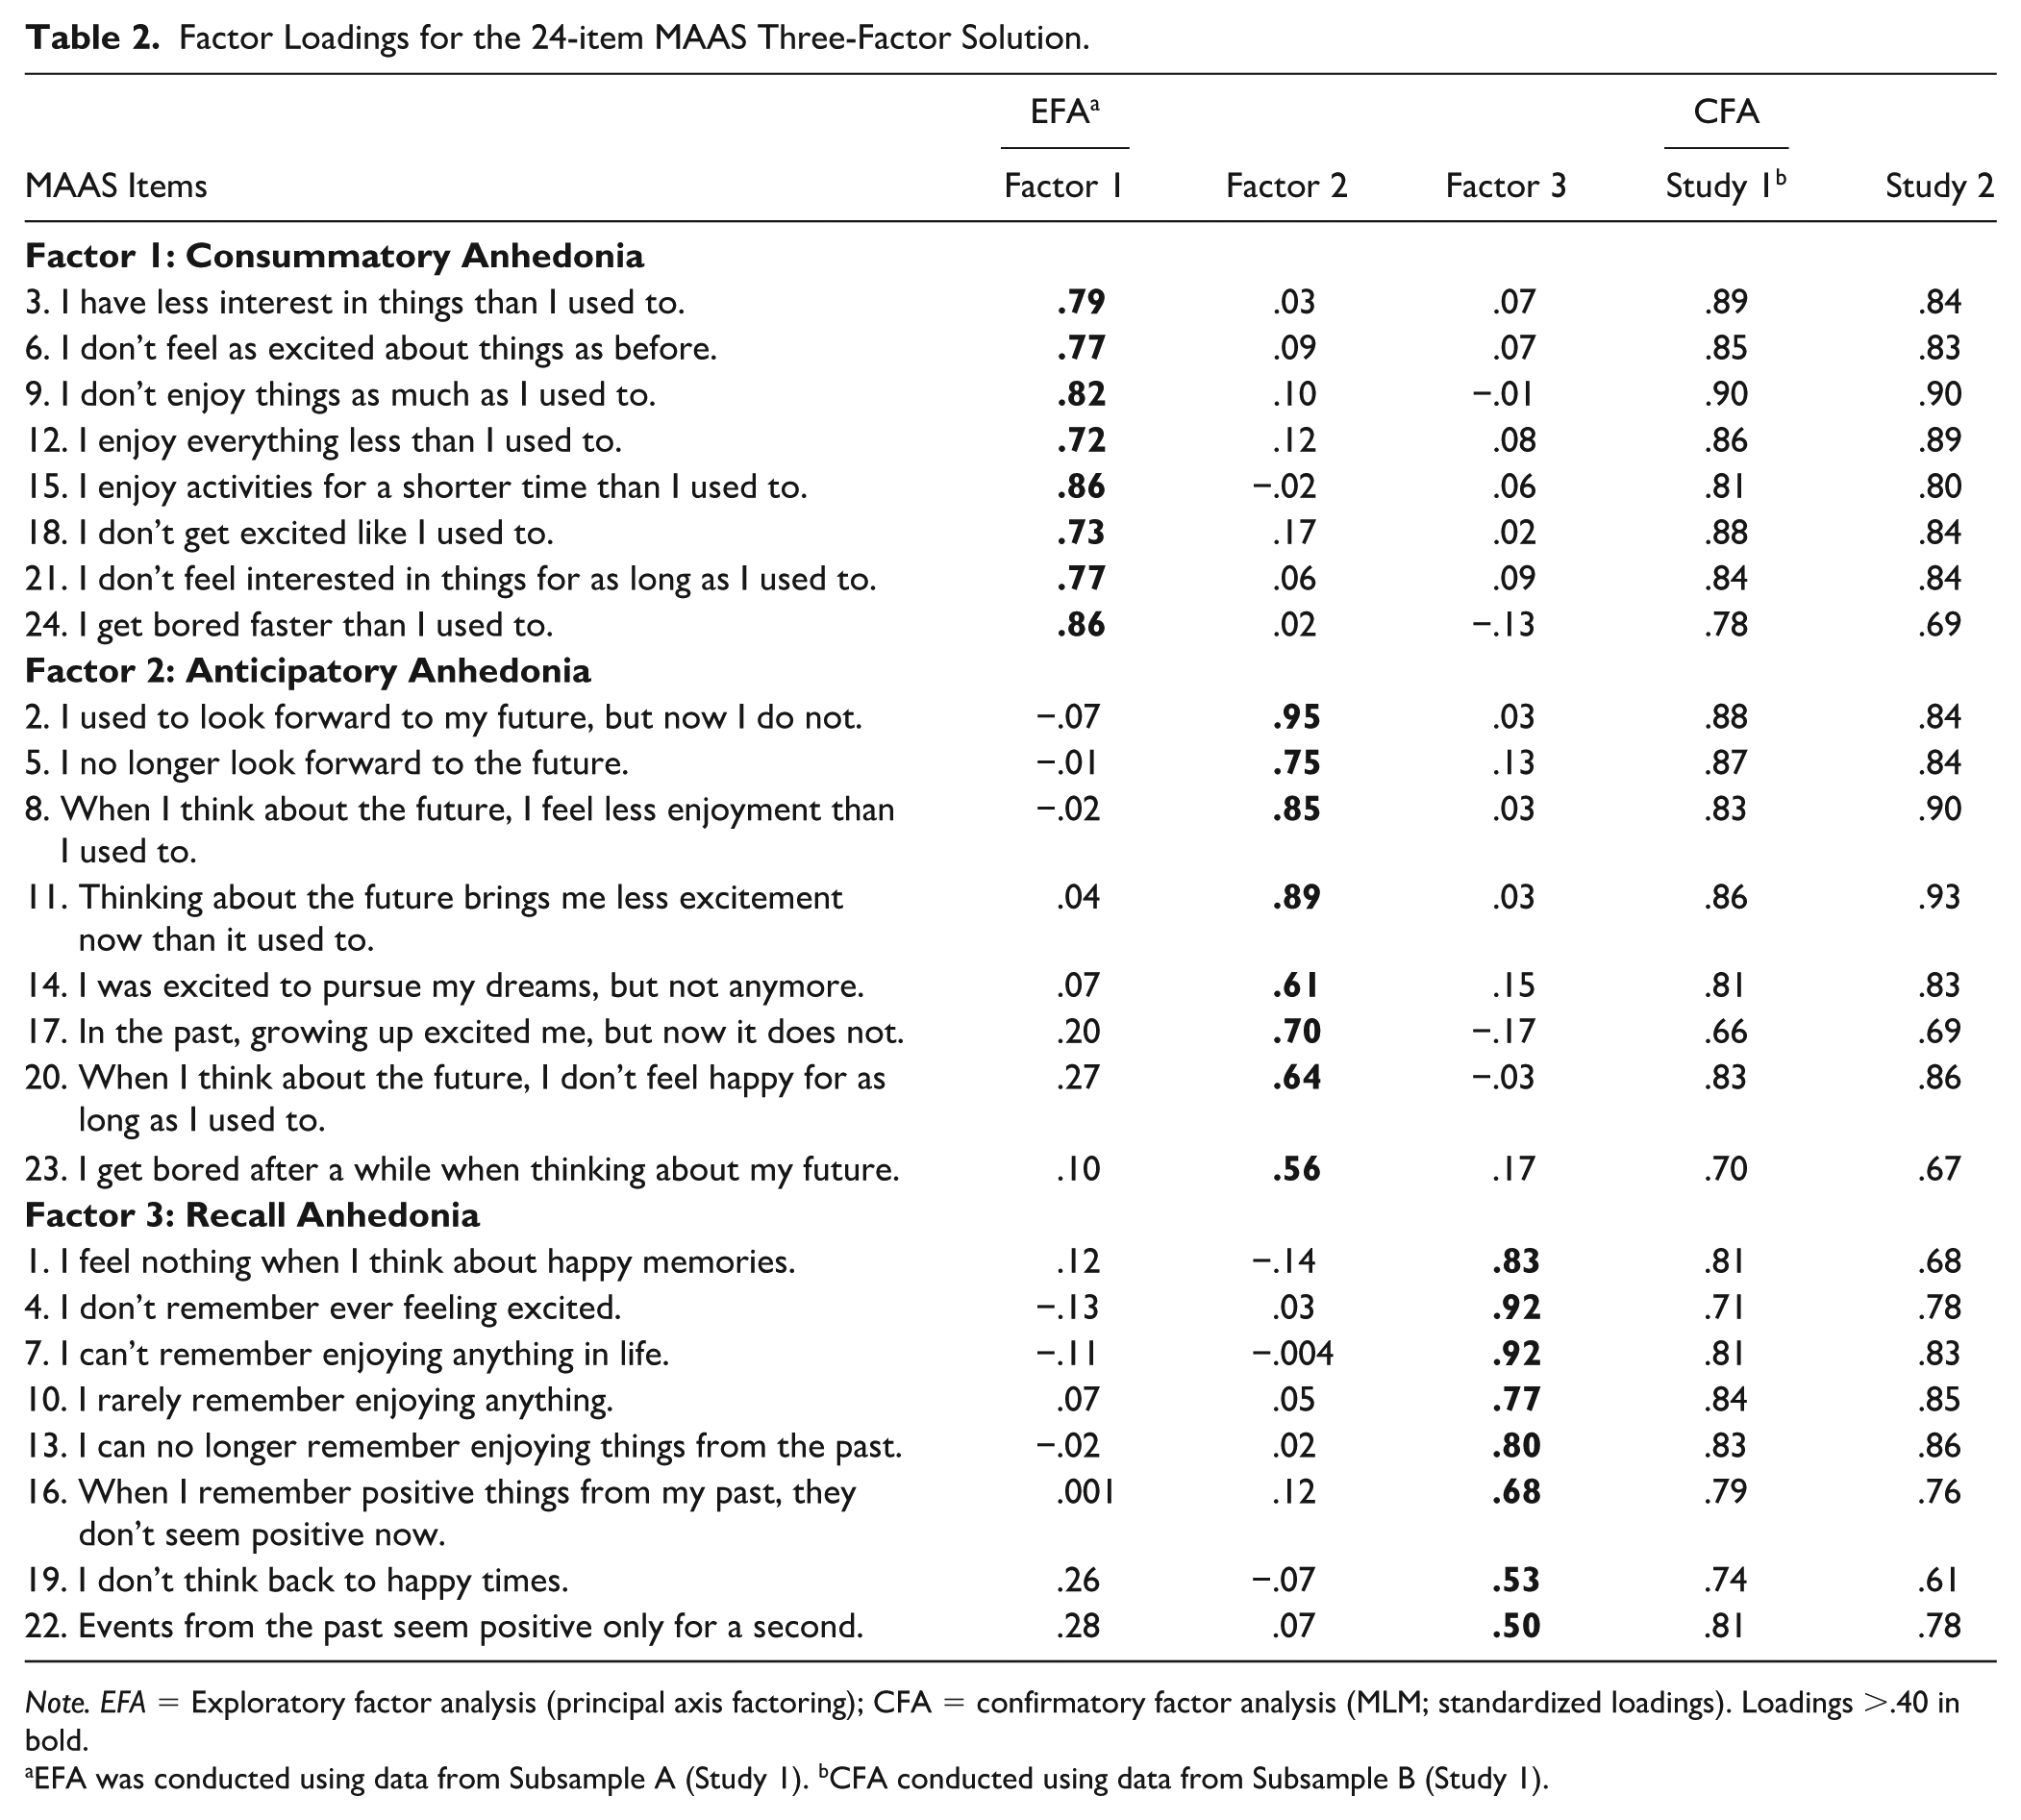
Note. EFA = Exploratory factor analysis (principal axis factoring); CFA = confirmatory factor analysis (MLM; standardized loadings). Loadings >.40 in bold.
EFA was conducted using data from Subsample A (Study 1). bCFA conducted using data from Subsample B (Study 1).
Further Evaluation of the Factor Structure
Parallel analysis and the scree plot of actual and simulated eigenvalues were re-run with the remaining 24 items (see Supplemental Figure 2). All methods identified a three-factor solution, which was re-examined using PAF with Promax rotation. The three-factor solution resulted in a theoretically meaningful distinction between the anticipatory, consummatory, and recalled dimensions of anhedonia. All items loaded > .40 onto a principal factor and cross-loaded < .30 on other factors (see Table 2). Fit indices were good, TLI = .96, RMSEA = .06, with 70% of the variance explained. Factor correlations were r = .67 between recall and anticipatory anhedonia, r = .71 between recall and consummatory anhedonia, and r = .78 between consummatory and anticipatory anhedonia. For comparison purposes, a four-factor solution was also tested. Although this solution led to marginal improvements in fit (TLI = .97, RMSEA = .05), the fourth factor explained minimal additional variance and contained only two items (“I don’t think back to happy times,” “events from the past seem positive for only a second”), the content of which was not readily distinguished from the other dimensions. Moreover, a minimum of three items is required to derive a reliable latent factor (Brown, 2015). This solution also resulted in several cross-loadings between other factors and was abandoned in favor of the three-factor solution.
Confirming the Factor Structure in Subsample B
The factor structure identified in Subsample A was confirmed in participants randomly selected for Subsample B (n = 312) using CFA with maximum likelihood estimation and robust model fit indices reported. 2 The sample was appropriate for factor analysis based on the KMO (.97) and Bartlett’s test of sphericity (p < .001); thus, we proceeded with model specification.
24-Item MAAS
Given the strong correlation between factors in the previous analysis (r = .67–.78), we compared the three-factor solution identified in the previous EFA with a one-factor solution to evaluate whether a more parsimonious solution would produce an equal or favorable fit to the data in this sample. The three-factor model produced an excellent fit to the data (robust TLI = .97, robust CFI = .98, robust RMSEA = .05, 90% CI = [.03, .06], SRMR = .04; see Table 2). Factor correlations were r = .68 for recall and anticipatory anhedonia, r = .74 for recall and consummatory anhedonia, and r = .78 for consummatory and anticipatory anhedonia. Standardized factor loadings for the three-factor model were also excellent (range: .66–.90). The largest standardized residual was .12, reflecting the covariance between Item 8 and Item 118. However, this covariance parameter was omitted from the model as it had little impact on fit. On the other hand, fit indices for the one-factor model were largely unsatisfactory (robust TLI = .85, robust CFI = .86, robust RMSEA = .11, 90% CI = [.10, .12], SRMR = .07). This suggested a more parsimonious solution was not an equal or superior fit to the data; thus, the three-factor solution was retained. We also tested a second-order CFA on this three-factor solution, in which items were indicators of anhedonia subfactors, and subfactors were indicators of an overall anhedonia factor (see Supplemental Figure 3). This model also demonstrated excellent fit to the data (robust TLI = .97, robust CFI = .98, robust RMSEA = .05, 90% CI = [.03, .06], SRMR = .04; see Table 2), supporting the use of the MAAS as a measure of one underlying construct, as well as a multidimensional measure.
12-Item MAAS
After confirming the factor structure of the 24 items selected in analyses for Subsample A (see Supplemental Table 2), we aimed to establish a brief 12-item version of the measure by testing additional CFA models. As mentioned above, we considered both psychometric performance (i.e., factor loadings, impact on fit index values within factor analyses, impact on reliability coefficients) and the extent to which items captured content breadth mentioned above while limiting redundancy. Items with more similar wording or content within the same subscale were first identified and then removed iteratively to examine which had the greatest benefit for psychometric performance. For example, items 7, 10, and 13 each referenced difficulty recalling past enjoyment, and so the latter item was retained because it yielded the best fit indices and reliability metrics. Items with relatively larger correlated residuals, within- and across-scales, were also considered for removal. 3 For example, items 7 and 23 had a residual correlation of .12 and their inclusion had less impact on psychometric performance, and were similar to other items; thus, these items were removed. This process continued until an initial 12-item set was selected via consultation between the first, second, third, and last authors and then proposed and agreed to by the remaining authors.
The 12 items chosen maximized selection criteria and were used to confirm the three-factor structure previously demonstrated by the 24-item version of the measure. Factor loadings for these items are presented in Supplemental Table 3. The three-factor CFA conducted using the 12 items selected for further analysis demonstrated excellent fit to the data (robust TLI and CFI = .98, robust RMSEA = .06, 90% CI [.03, .08], SRMR = .03). Factor correlations were r = .65 for recall and anticipatory anhedonia, r = .69 for recall and consummatory anhedonia, and r = .75 for consummatory and anticipatory anhedonia. The largest standardized residual was .13, reflecting covariance between Item 4 and Item 5, and factor loadings ranged from .68 to .88. Moreover, fit indices for the unidimensional one-factor model based on these items ranged from unsatisfactory to acceptable (robust TLI = .87, robust CFI = .89, robust RMSEA = .13, 90% CI = [.11, .15], SRMR = .06) and were inferior to the three-factor model. Thus, the three-factor model was confirmed in both 24- and 12-item versions of the MAAS.
Internal Consistency
Both the 24- and 12-item versions of the MAAS demonstrated strong internal consistency across Subsamples A and B: MAAS-24 Total α = .97–.97, ω = .97–.97; MAAS-12 Total α = .94–.94, ω = .94–.95 (see Supplemental Table 4). The same was true of recall, anticipatory, and consummatory subscales across subsamples and scale versions (MAAS-24: α = .93–.96; ω = .93–.96, MAAS-12: α = .86–.91; ω = .88–.91). Item correlation matrices are presented in Supplemental Table 5.
Convergent Validity
As expected, the MAAS-24 total score was significantly and moderately correlated with all other measures of anhedonia, with minimal differences in the strength of correlations demonstrated across Subsamples A and B (see Table 3). The MAAS-24 Anticipatory subscale was slightly more strongly correlated with the ACIPS-A Anticipatory relative to the Consummatory subscale. However, the MAAS-24 Consummatory subscale was not more strongly correlated with the ACIPS-A Consummatory relative to the Anticipatory subscale. For brevity, convergent validity correlations for the MAAS-12 are reported in detail in Supplemental Table 6. However, the same pattern of results was demonstrated, with the difference in strength of correlations between the MAAS-24 and MAAS-12 ranging from −.04 to +.06 across all samples and subscales. Correlations among convergent, concurrent, and discriminant measures are presented in Supplemental Table 7.
Bivariate Spearman’s Correlations of the MAAS-24 with Convergent Validity Measures Across Studies 1 (Subsamples A and B) and 2.
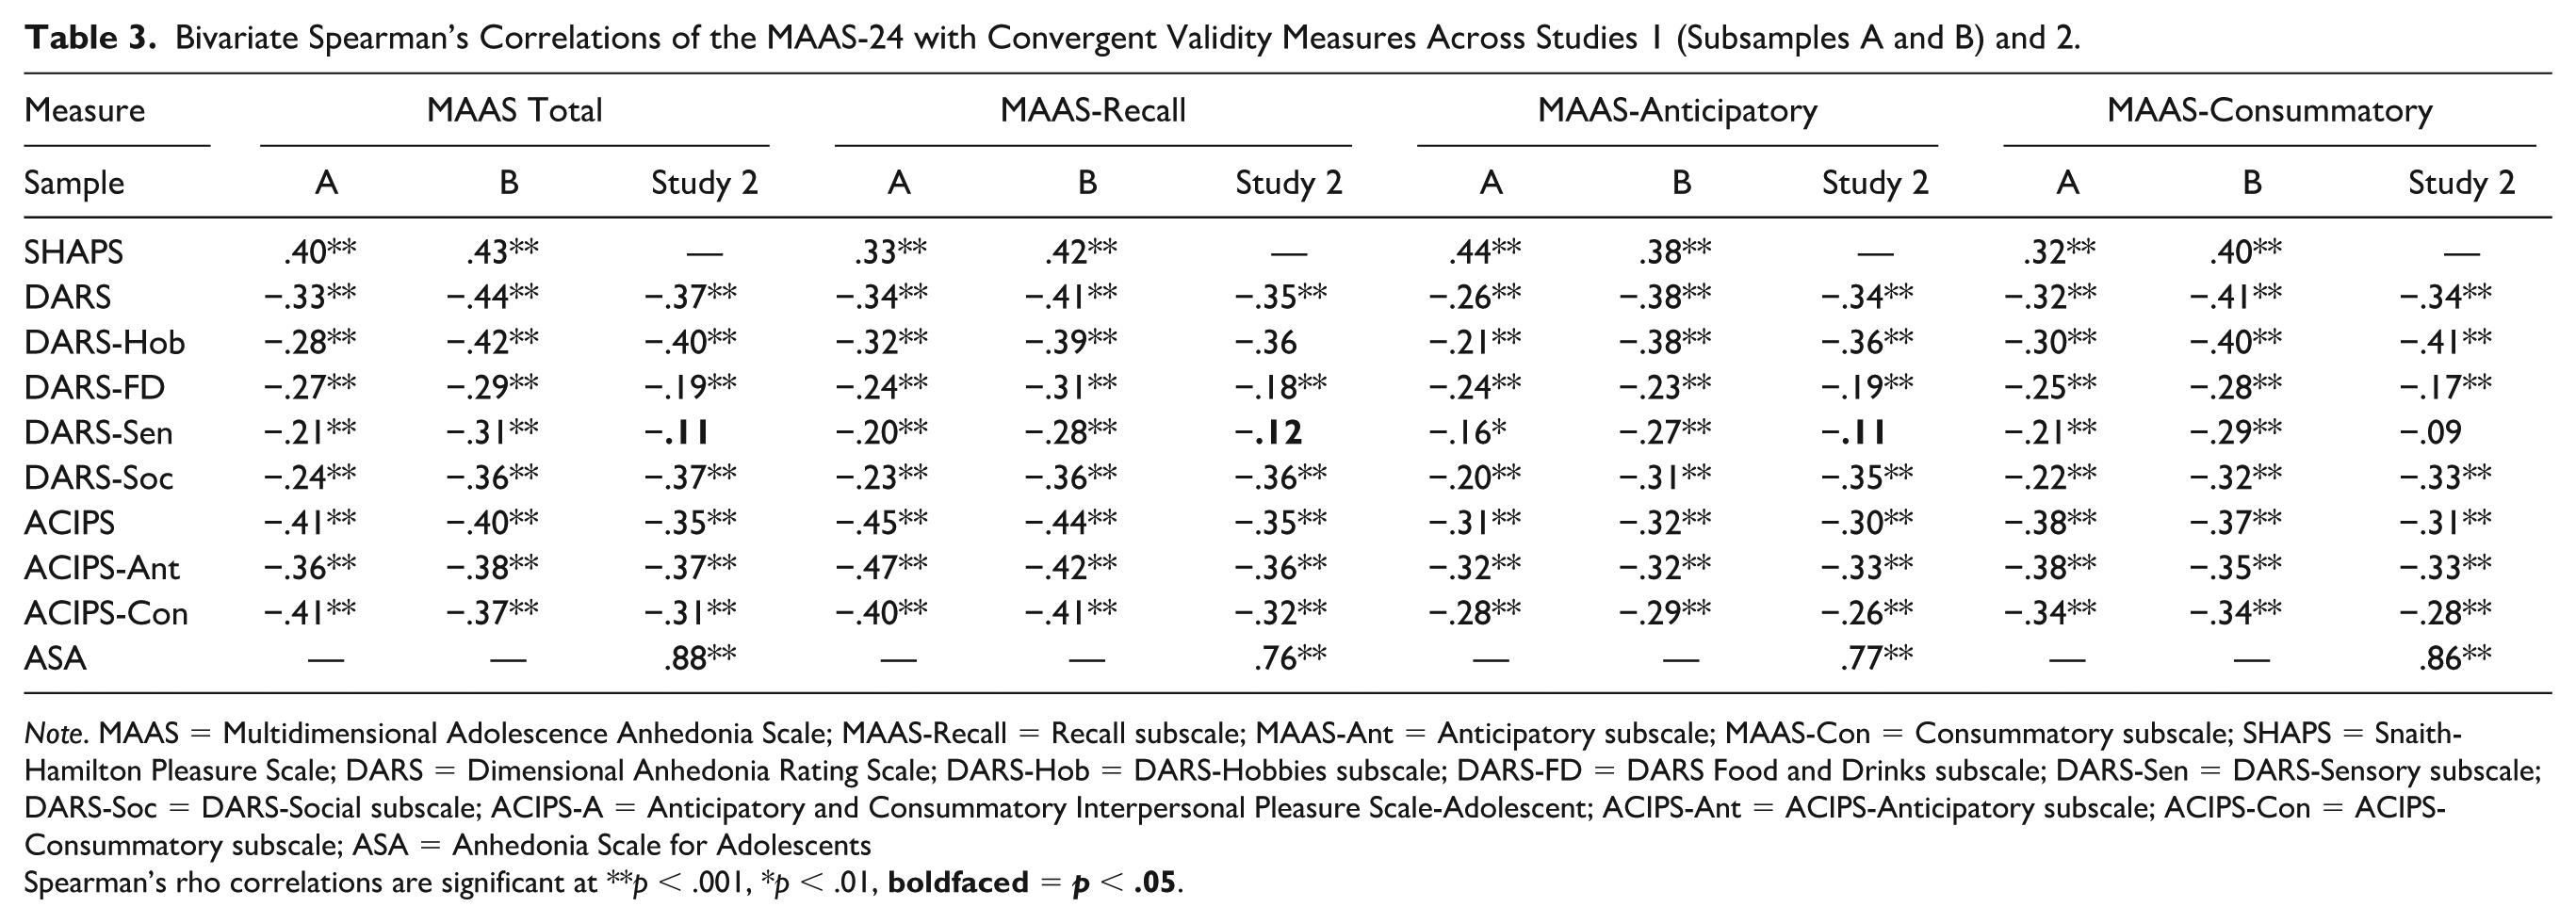
Note. MAAS = Multidimensional Adolescence Anhedonia Scale; MAAS-Recall = Recall subscale; MAAS-Ant = Anticipatory subscale; MAAS-Con = Consummatory subscale; SHAPS = Snaith-Hamilton Pleasure Scale; DARS = Dimensional Anhedonia Rating Scale; DARS-Hob = DARS-Hobbies subscale; DARS-FD = DARS Food and Drinks subscale; DARS-Sen = DARS-Sensory subscale; DARS-Soc = DARS-Social subscale; ACIPS-A = Anticipatory and Consummatory Interpersonal Pleasure Scale-Adolescent; ACIPS-Ant = ACIPS-Anticipatory subscale; ACIPS-Con = ACIPS-Consummatory subscale; ASA = Anhedonia Scale for Adolescents
Spearman’s rho correlations are significant at **p < .001, *p < .01,
Concurrent and Discriminant Validity
The MAAS-24 total score correlated strongly with depression (i.e., CES-DC) and moderately with anxiety (i.e., GAD-7) across Subsamples A and B (see Table 4). Consistent with hypotheses, there was also a significant difference in the strength of these associations, z = 5.14–5.25, ps < .001, in Subsamples A and B. Associations with depression were greatest for consummatory anhedonia, followed by anticipatory and then recall anhedonia (see Table 4). The MAAS-24 total score also moderately correlated with positive (i.e., PANAS-Positive) and negative affect (PANAS-Negative), with no significant difference in the strength of associations across both subsamples, z = 1.17–1.27, p = .103–.122. The same pattern of results was demonstrated for the MAAS-12 across samples and subscales, with the difference in correlation strength from the MAAS-24 to MAAS-12 ranging from −.06 to +.02 across all samples and subscales (see Supplemental Table 8).
Bivariate Spearman’s Correlations of the MAAS-24 with Concurrent and Discriminant Measures Across Studies 1 (Subsamples A and B) and 2.
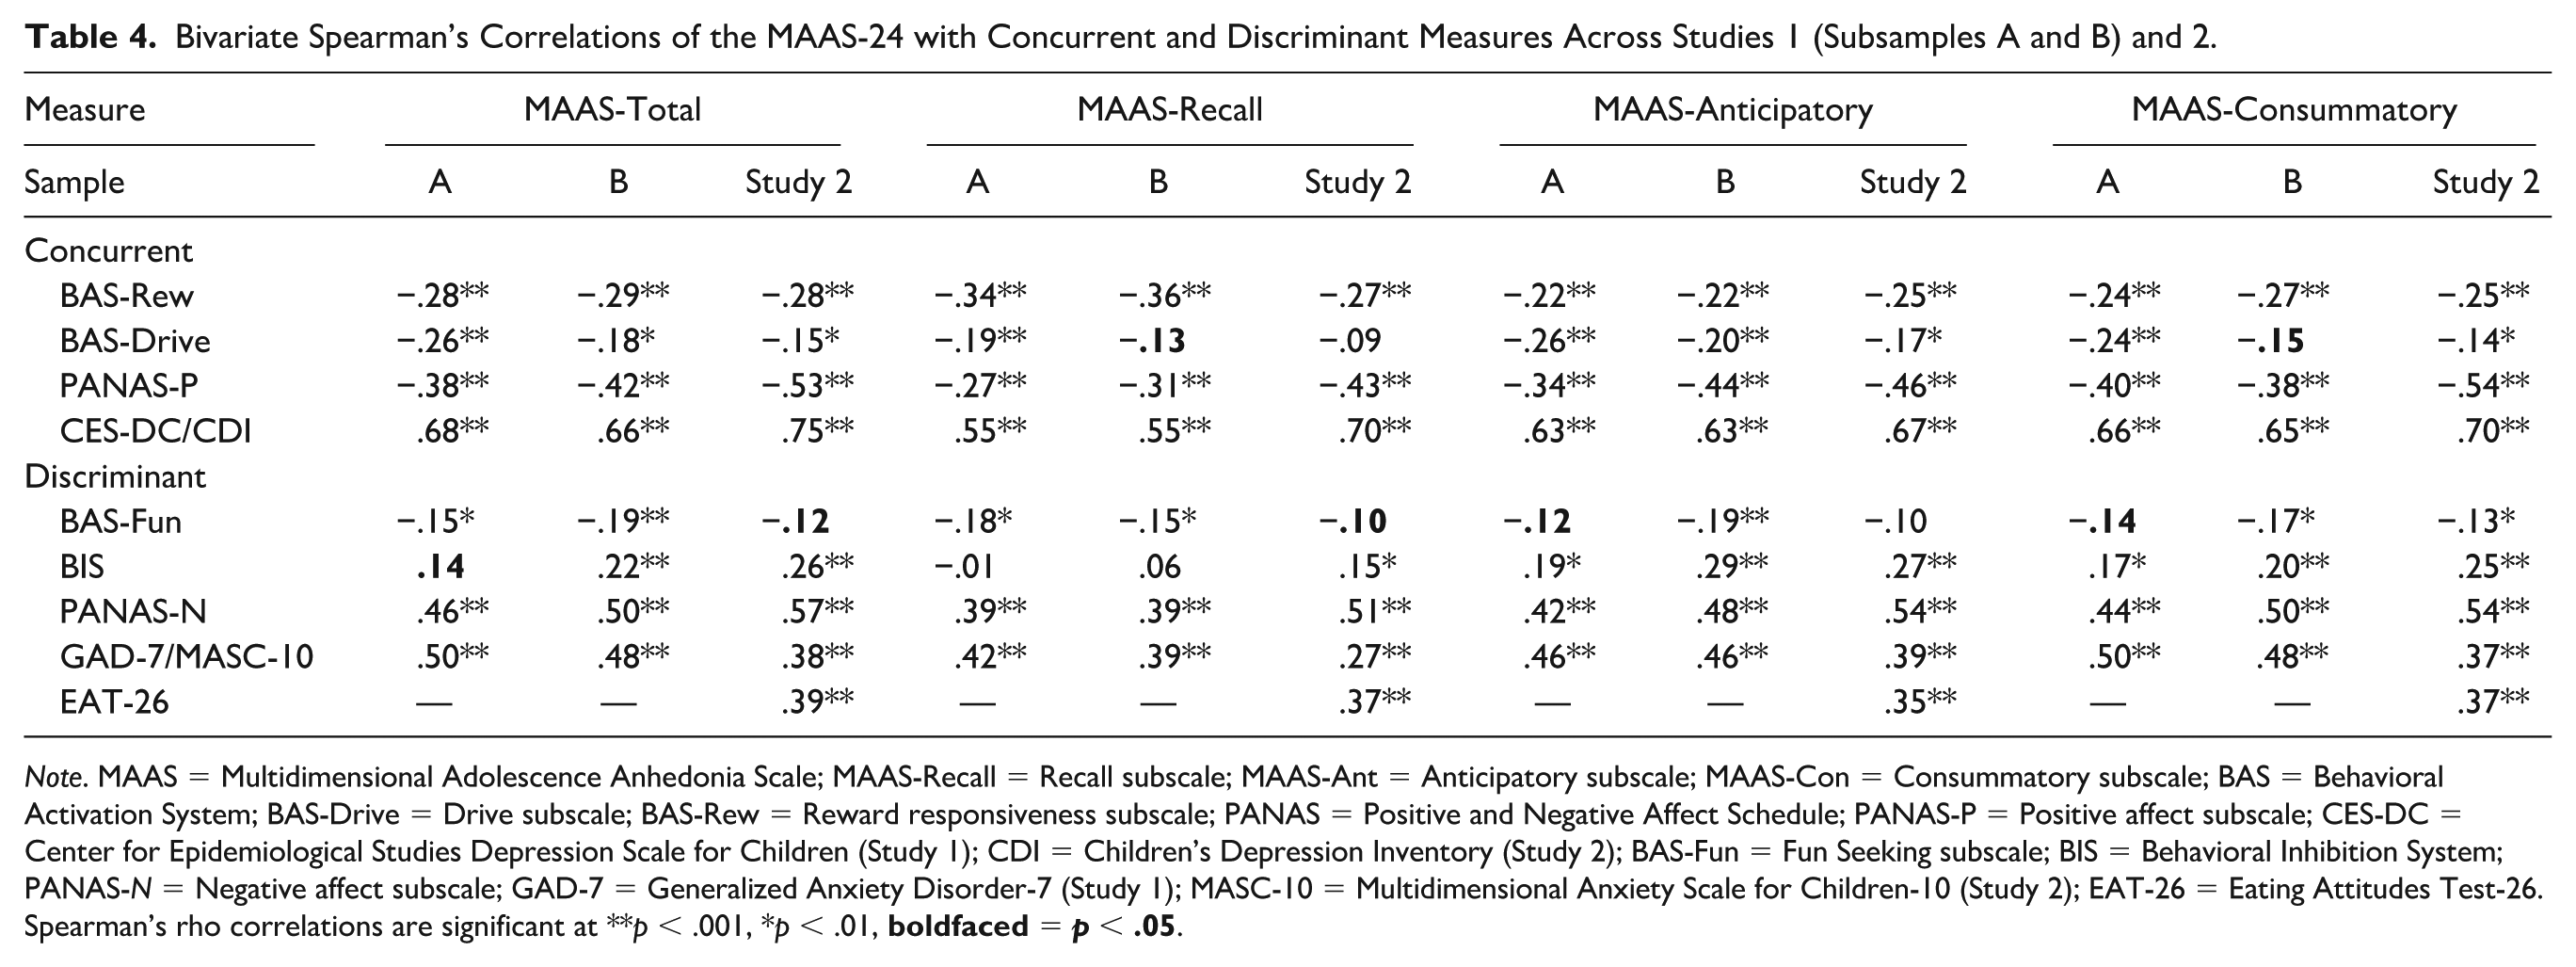
Note. MAAS = Multidimensional Adolescence Anhedonia Scale; MAAS-Recall = Recall subscale; MAAS-Ant = Anticipatory subscale; MAAS-Con = Consummatory subscale; BAS = Behavioral Activation System; BAS-Drive = Drive subscale; BAS-Rew = Reward responsiveness subscale; PANAS = Positive and Negative Affect Schedule; PANAS-P = Positive affect subscale; CES-DC = Center for Epidemiological Studies Depression Scale for Children (Study 1); CDI = Children’s Depression Inventory (Study 2); BAS-Fun = Fun Seeking subscale; BIS = Behavioral Inhibition System; PANAS-N = Negative affect subscale; GAD-7 = Generalized Anxiety Disorder-7 (Study 1); MASC-10 = Multidimensional Anxiety Scale for Children-10 (Study 2); EAT-26 = Eating Attitudes Test-26.
Spearman’s rho correlations are significant at **p < .001, *p < .01,
Next, small correlations were demonstrated between the MAAS-24 total, anticipatory, and consummatory scores and personality traits of reward responsiveness (i.e., BAS-Reward), with moderate correlations found for the MAAS-24 Recall subscale (see Table 4). There were also small correlations between the MAAS-24 and other traits relating to behavioral approach (i.e., BAS-Drive, BAS-Fun) and inhibition (i.e., BIS). Importantly, associations across subsamples were significantly (or marginally) stronger for reward responsiveness relative to impulsive approach, z = 1.55–2.25, p = .012–.061. The MAAS-24 total score was also more strongly correlated with reward responsiveness relative to punishment sensitivity in Subsample A, z = 2.14, p = .016, although not in Subsample B, z = 0.87, p = 0.191. Interestingly, correlations of punishment sensitivity with the MAAS-24 Recall subscale were nonsignificant (all ps > .05), despite small correlations with anticipatory and consummatory subscales. These results were also demonstrated for the MAAS-12, with the difference in correlation strength ranging from −.05 to +.03 (see Supplemental Table 8).
Incremental Validity
A series of hierarchical linear regressions tested whether the MAAS-24 (and MAAS-12) better predicted depressive symptoms (i.e., CES-DC scores) relative to other measures of anhedonia (i.e., the ACIPS-A, SHAPS, and DARS total scores) across Subsample B. 4 Across all models, entering the MAAS-24 or MAAS-12 total scores as a predictor in Step 2 significantly improved model fit and prediction of depressive symptoms (all ps < .001; see Table 5 and Supplemental Table 9). Additional linear regressions tested which MAAS subscales most strongly predicted depression in Subsample B. The full model with all three MAAS-24 subscales significantly explained variance in depressive symptoms, F(3, 305) = 98.10, p < .001, R2adj = .49. The MAAS-24 Consummatory subscale was most strongly and significantly associated with depressive symptoms, β = .36, t(305) = 4.31, p < .001, followed by the MAAS-24 Anticipatory subscale, β = .33, t(305) = 4.54, p < .001, whereas the MAAS-24 Recall subscale was no longer significant, β = .05, t(305) = 0.68, p = .496. The same pattern of results was demonstrated for the MAAS-12, F(3, 305) = 93.67, p < .001, R2adj = .47, except that all three subscales predicted unique variance in depression: consummatory, β = .34, t(305) = 4.43, p < .001, anticipatory, β = .29, t(305) = 4.05, p < .001, and recall anhedonia, β = .12, t(305) = 2.04, p = .042.
Study 1 Hierarchical Linear Regressions Predicting Depressive Symptoms from MAAS-24 and Convergent Measures of Anhedonia (Subsample B).
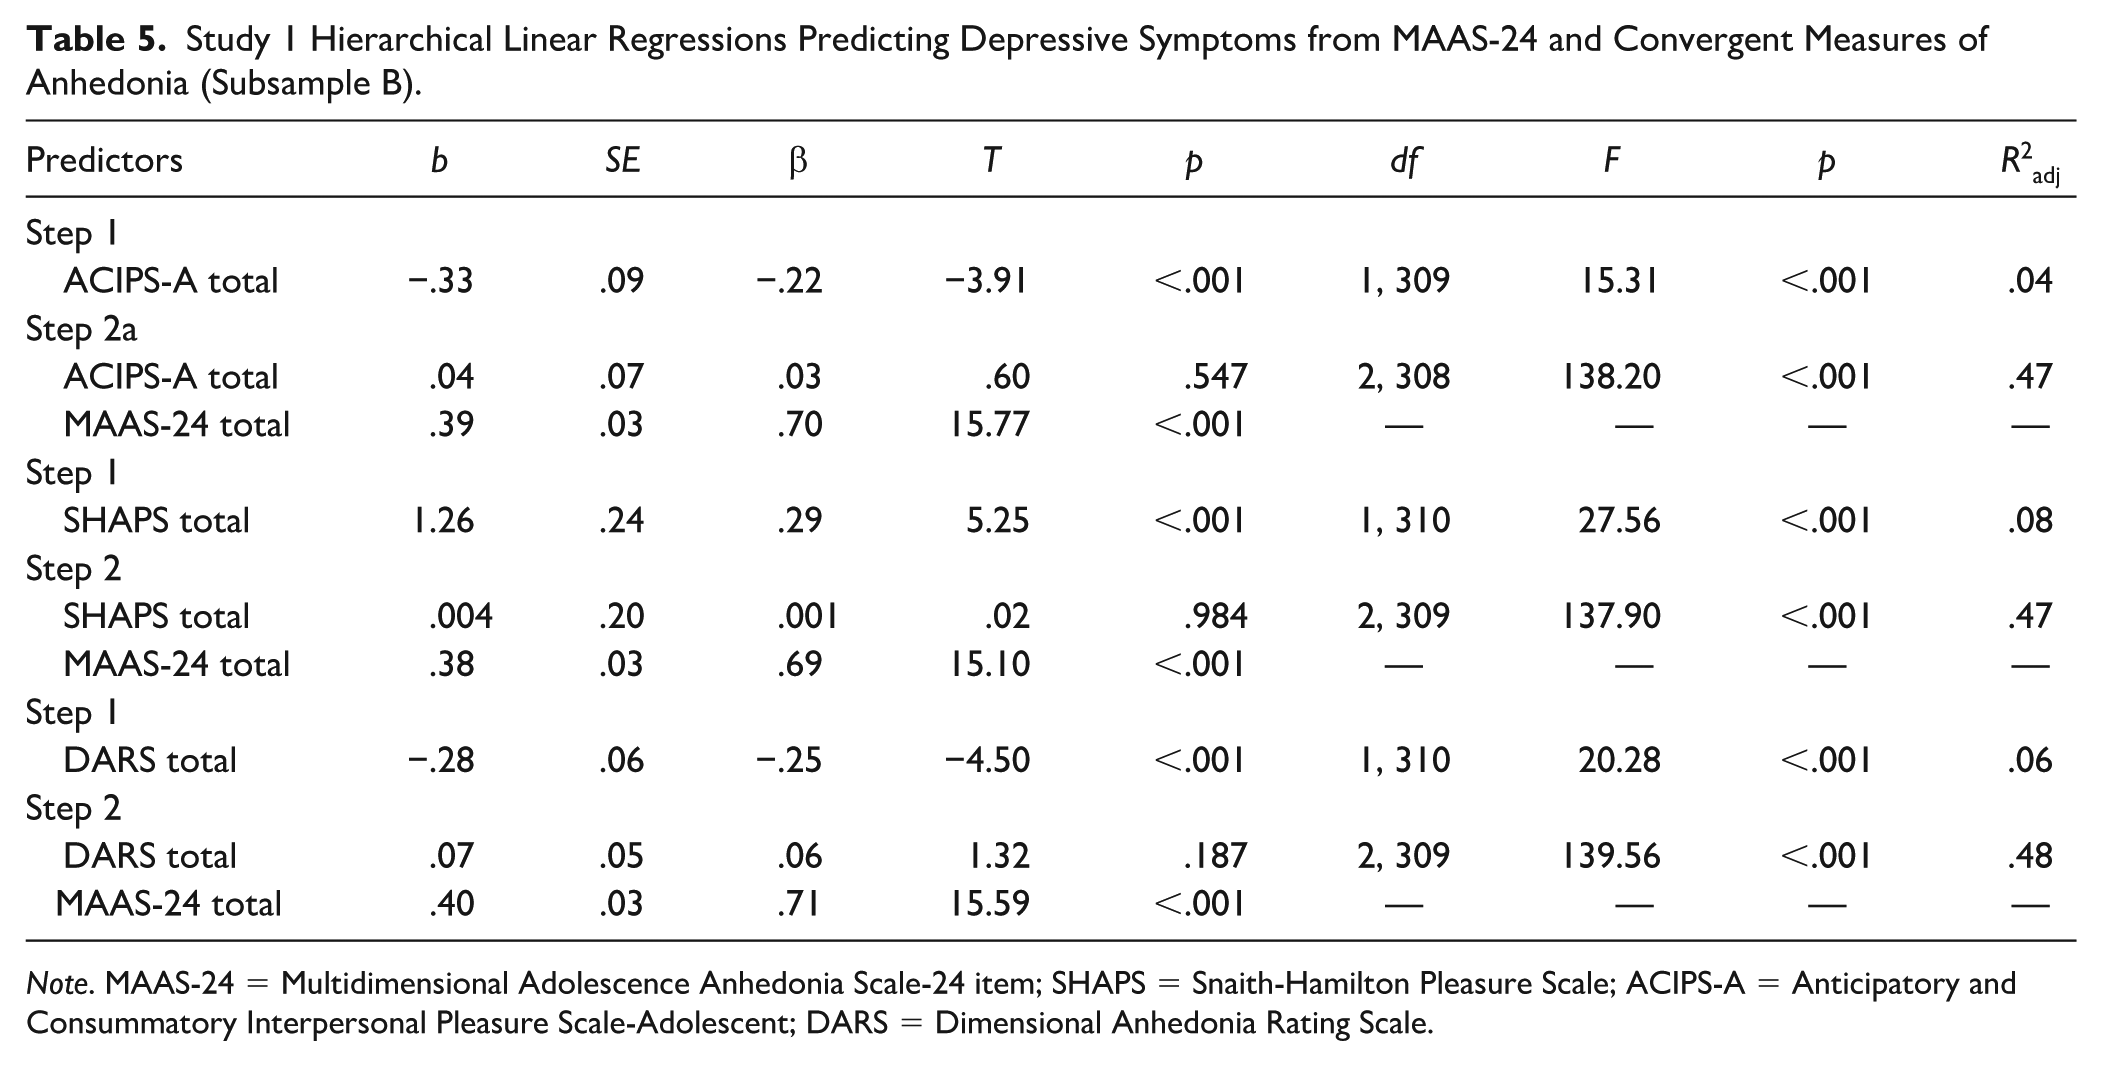
Note. MAAS-24 = Multidimensional Adolescence Anhedonia Scale-24 item; SHAPS = Snaith-Hamilton Pleasure Scale; ACIPS-A = Anticipatory and Consummatory Interpersonal Pleasure Scale-Adolescent; DARS = Dimensional Anhedonia Rating Scale.
Study 2
To further assess the structure, validity, and reliability of the MAAS-24 and MAAS-12 in a sample of a greater range in age, we recruited a broader online sample of adolescents from across North America. We also aimed to establish test–retest reliability, rank order stability, and predictive validity by administering a 6-month follow-up survey.
Study 2 Method
Participants
Participants between 12 and 19 years old were recruited from Canada and the United States through social media advertisements in 2021. Although 493 participants completed the study, we excluded those younger than 12 or older than 19 years at the time of completing the first survey (or who did not report a valid birthdate; n = 11). Participants were also excluded if they terminated the survey before completing any MAAS items (n = 86) or correctly answered less than 50% of attention checks (n = 21). Our final sample consisted of 375 adolescents (M = 15.93, SD = 1.60), in line with the abovementioned minimum sample size recommended for use with three-factor CFA (see Study 1 method). Across participants, 68% identified as girls/women, 25% as boys/men, and 7% as nonbinary, with a majority 45% identifying as white/Caucasian. For additional demographics and descriptive information, see Table 1 and Supplemental Table 1.
Procedures
Approval from the Institutional Research Ethics Board was obtained before recruitment. Participants younger than 16 years old provided assent (after parental consent was obtained), and participants older than 16 provided consent before participation. Adolescents then completed an online survey consisting of a demographic questionnaire, the MAAS items, and measures of convergent, discriminant, and concurrent validity. Participants were also invited to complete the same survey 6 months later in return for a $10 gift card.
Measures
Multidimensional Adolescence Anhedonia Scale
The MAAS-24 and MAAS-12 self-report measures of anhedonia assessed three separate dimensions of anhedonia: anticipatory, consummatory, and recall (see Supplemental Table 2). Participants rated how often they experienced each item in the past 2 weeks on a 5-point Likert-type scale ranging from not at all = 1 to nearly every day = 5. The MAAS was scored by summing within and across all subscales, where higher scores indicate higher levels of anhedonia.
Convergent Validity
We assessed convergent validity using alternative measures of anhedonia, including the DARS (Rizvi et al., 2015) and ACIPS-A (Gooding et al., 2016), with good to acceptable internal consistency observed in this sample: DARS total score, α = .88; DARS individual subscales, α = .76–.89; ACIPS-A, α = .87; ACIPS-A individual subscales, α = .70–.80. We also administered the Anhedonia Scale for Adolescents (ASA; Watson et al., 2021), which was published after Study 1 was completed. The ASA is a 14-item multifaceted measure of past 2-week anhedonia with three subscales capturing various associated experiences, such as flattening of emotion and loss of pleasure and joy, lack of motivation or effort, and loss of connection, purpose, and belonging. Higher scores indicate greater anhedonia. Excellent to good internal consistency was observed: ASA total score, α = .93; ASA subscales, α = .71–.89.
Concurrent and Discriminant Validity
As in Study 1, concurrent and discriminant validity were assessed by examining associations with measures assessing related constructs (i.e., positive affect; PANAS-Positive [Watson et al., 1988], pleasure; BAS-Reward Responsiveness [Carver & White, 1994], motivation; BAS-Drive) relative to unrelated or less-related constructs (i.e., negative affect; PANAS-Negative [Watson et al., 1988], impulsive approach; BAS-Fun Seeking [Carver & White, 1994], and behavioral inhibition; BIS). All showed excellent to acceptable internal consistency: PANAS-Positive, α = .87; PANAS-Negative, α = .87; BAS-Drive, α = .75; BIS, α = .80, apart from the BAS-Fun (α = .63) and BAS-Reward (α = .68) subscales, which fell below an established cutoff of .70.
We also assessed concurrent validity with an alternative measure of depression, the Children’s Depression Inventory-Short (CDI; Kovacs, 1978), given its prevalence in the literature. The CDI is a 10-item self-report measure of children and adolescents’ experience of depression in the past 2 weeks, where higher scores indicate greater depressive symptoms (Kovacs, 1978). The CDI demonstrated good internal consistency (α = .87) in this sample.
Moreover, discriminant validity was further assessed with age-appropriate measures of anxiety (i.e., Multidimensional Anxiety Scale for Children [MASC-10; March et al., 1997]) and disordered eating (i.e., Eating Attitudes Test [EAT-26; Garner et al., 1982]). The MASC-10 is a 10-item self-report measure of anxiety for children and adolescents, with higher scores indicating more frequent anxiety symptoms (March et al., 1997). The MASC-10 demonstrated acceptable internal consistency in this sample, α = .74. The EAT-26 is a 26-item self-report measure that assesses disordered eating behaviors and cognitions. Higher scores indicate higher frequency of eating disorder symptoms (Garner et al., 1982). The EAT-26 demonstrated excellent internal consistency in this study, α = .91.
Data Analytics Plan
Analyses were conducted using R 4.3.0 (R Core Team, 2023). We specified CFA models with maximum likelihood estimation, and Satorra-Bentler scaled chi-square test statistic and robust standard errors to test the factor structure using the Lavaan package (Rosseel, 2012). Model fit was assessed based on the same non-incremental fit index criteria as the previous study. We also examined and reported the largest standardized model residuals.
Internal Consistency, Reliability, and Validity
Cronbach’s α and McDonald’s ω were calculated using the psych (Revelle, 2024) and MBESS (Kelley, 2007) packages in R to evaluate internal consistency reliability. Test–retest reliability was evaluated by examining absolute agreement between MAAS scores at baseline and 6-month follow-up using intra-class correlations (ICCs) based on two-way mixed effects models (Koo & Li, 2016). Relative (i.e., rank-order) as opposed to absolute stability was also examined by testing whether each MAAS subscale at baseline was correlated more strongly with the same subscale score at follow-up, compared with other follow-up subscale scores. Convergent, discriminant, and concurrent validity were estimated based on Spearman correlations calculated using the stats package in R (R Core Team, 2023). We also compared the strength of correlations between the MAAS and concurrent and discriminant measures using an online calculator (Lenhard & Lenhard, 2014). To test for predictive validity, a linear regression was used to establish whether MAAS scores at Time 1 were a significant predictor of depressive symptoms (i.e., CDI scores; Kovacs, 1978) at Time 2. We also examined which MAAS subscales were most strongly associated with depressive symptoms at Time 2. All analyses run for both the MAAS-24 and MAAS-12 to separately establish reliability and validity in the brief measure.
Study 2 Results
Preliminary Analyses
Participants’ characteristics are summarized in Table 1 (and Supplemental Table 1). The MAAS-24 and MAAS-12 were significantly associated with age, such that higher scores were associated with being older, MAAS-24: rs = .20, p < .001, MAAS-12: rs = .21, p < .001. Significant sex differences also emerged, with those assigned female at birth reporting significantly higher scores on the MAAS-24, t(373) = −2.49, p = .013, and MAAS-12, t(149) = −2.55, p = .012, relative to those assigned male at birth. There were also significant gender differences in scores on the MAAS-24, F(2,373) = 5.95, p = .003, and MAAS-12, F(2,373) = 5.98, p = .003, with follow-up analyses indicating higher MAAS scores among those self-specifying their gender identity relative to boys.
Confirmatory Factor Analysis
MAAS-24
We next confirmed the factor structure identified in Study 1, again using CFA with maximum likelihood estimation and robust model fit indices. As before, the KMO (.97) and Bartlett’s test of sphericity (p < .001) confirmed that the sample was appropriate for factor analysis. As in Study 1, we first tested a more parsimonious one-factor CFA model which demonstrated mediocre fit across multiple indices: robust CFI = .79, TLI = .77, robust RMSEA = .13, 90% CI = [.13, .14], and SRMR = .07. However, fit was improved by fitting the three-factor CFA model, robust CFI = .93, TLI = .93, robust RMSEA = .08, 90% CI = [.07, .08], and SRMR = .05. Standardized factor loadings for this model ranged from very good to excellent (.61–.93), with the largest standardized residual being no greater than .14 for the covariance between Item 22 and Item 23 (see Table 2). However, this covariance parameter had little effect on model fit indices and so was omitted. Factor correlations were r = .69 for recall and anticipatory anhedonia, r = .74 for recall and consummatory anhedonia, and r = .77 for consummatory and anticipatory anhedonia.
MAAS-12
The unidimensional CFA model based on ratings for the 12-item measure demonstrated mediocre fit across multiple indices, robust CFI = .84, robust TLI = .81, robust RMSEA = .16, 90% CI = [.15, .18], SRMR = .07. However, fit was again improved by fitting the three-factor CFA model, robust CFI = .98, robust TLI = .97, robust RMSEA = .06, 90% CI = [.05, .08], and SRMR = .03. Here, the largest standardized residual was no greater than 0.10 for the covariance between Item 1 and Item 5 (see Supplemental Table 3). Moreover, standardized factor loadings ranged from .67 to .94. Factor correlations were r = .70 for recall and anticipatory anhedonia, r = .75 for recall and consummatory anhedonia, and r = .74 for consummatory and anticipatory anhedonia.
Reliability
Internal Consistency Reliability
The MAAS-24 and MAAS-12 scores had strong internal consistency at baseline and 6-month follow-up (α = .97–.97, ω = .97–.97; MAAS-12 Total α = .93–.94, ω = .93–.94 [see Supplemental Table 4]). The same was true of recall, anticipatory, and consummatory subscales (MAAS-24: α = .92–.95, ω = .92–.95; MAAS-12: α = .83–.93, ω = .83–.93). Item correlation matrices are presented in Supplemental Table 10.
Test–Retest Reliability
All participants were invited to complete the MAAS again approximately 6 months after the initial survey. Of these, a subset (n = 157) provided follow-up data. There were no significant differences between those who did and did not complete the follow-up on age, t(325) = −1.07, p = .286, or total MAAS scores, t(341) = 0.92, p = .361, but significant gender differences emerged, χ2(2) = 16.46, p <.001, with a greater proportion of girls completing the follow-up (48%) relative to boys (24%) or those identifying as nonbinary (44%). The MAAS total and subscale scores demonstrated good to moderate test–retest reliability, MAAS-24: ICC total = .80 (MAAS-12: ICC total = .79), MAAS-24: ICC recall = .78 (MAAS-12: ICC recall = .77), MAAS-24: ICC anticipatory = .80 (MAAS-12: ICC anticipatory = .75), MAAS-24: ICC consummatory = .71 (MAAS-12: ICC consummatory = .67).
Rank-Order Stability
To supplement our analyses examining absolute stability of MAAS scores from baseline to 6-month follow-up, we additionally examined relative or rank order stability among the MAAS subscales. As expected, we found that baseline MAAS Recall scores were more strongly correlated with Recall at follow-up, MAAS-24: rs = .67, MAAS-12: rs = .64, than with either MAAS Consummatory, MAAS-24: rs = .47, MAAS-12: rs = .43, or Anticipatory, MAAS-24: rs = .50, MAAS-12: rs = .47, follow-up scores. Similarly, MAAS Anticipatory scores at baseline were more strongly correlated with Anticipatory scores at follow-up, MAAS-24: rs = .66, MAAS-12: rs = .58, relative to MAAS Recall, MAAS-24: rs = .58, MAAS-12: rs = .55, or Consummatory scores, MAAS-24: rs = .53, MAAS-12: rs = .49. On the other hand, the strength of correlations of the baseline MAAS Consummatory subscale with scores at follow-up were more similar across subscales (MAAS-24 Consummatory: rs = .55; MAAS-12: rs = .50, MAAS-24 Recall: rs = .54; MAAS-12: rs = .48, MAAS-24 Anticipatory: rs = .57; MAAS-12: rs = .51).
Convergent Validity
As in Study 1, the MAAS-24 total was significantly and moderately correlated with the DARS and ACIPS-A (see Table 3). The MAAS-24 Anticipatory subscale was also more strongly correlated with the ACIPS-A Anticipatory, relative to the ACIPS-A Consummatory subscale, although the reverse pattern did not emerge for the MAAS-24 Consummatory subscale. For the ASA, on the other hand, strong correlations were observed with the MAAS-24 total score. Validity correlations for the MAAS-12 are reported in detail in Supplemental Table 6. However, the same pattern of results was demonstrated, with the difference in strength of correlations between the MAAS-24 and MAAS-12 ranging from 0 to +.03 across subscales. Correlations among convergent, concurrent, and discriminant measures are presented in Supplemental Table 11.
Concurrent and Discriminant Validity
The MAAS-24 total score correlated strongly with depression (i.e., CDI), and moderately with anxiety (i.e., MASC-10) and disordered eating (i.e., EAT-26; see Table 4). As hypothesized, it was also more strongly correlated with depression (i.e., CDI) relative to anxiety (i.e., MASC-10), z = 9.70, p <.001, and relative to disordered eating, z = 9.32, p <.001. Anxiety was moderately correlated with anticipatory and consummatory anhedonia but weakly correlated with the recall subscale. In addition, the MAAS-24 total score was strongly correlated with positive affect (i.e., PANAS-Positive) and negative affect (i.e., PANAS-Negative; see Table 4), with no significant difference in the strength of correlations, z = −.80, p = .211. Consummatory anhedonia was most strongly correlated with positive affect, followed by anticipatory and then recall anhedonia (see Table 4). The same pattern of results was demonstrated for the MAAS-12, with the difference in correlation strength from the MAAS-24 to MAAS-12 ranging from −.03 to +.01 across subscales (see Supplemental Table 8).
Next, as in Study 1, small correlations were demonstrated between the MAAS-24 total score and measures of reward responsiveness (i.e., BAS-Reward) and other personality traits of behavioral approach and inhibition (i.e., BAS-Drive, BAS-Fun, BIS). The MAAS-24 total score remained more strongly correlated with reward responsiveness (i.e., BAS-Reward) compared to impulsive approach (i.e., BAS-Fun), z = 2.83, p = .002. However, there was no significant difference in the strength of associations between the MAAS-24 and reward responsiveness relative to punishment sensitivity, z = .32, p = .375. Associations with the MAAS-24 Recall subscale were slightly stronger for BAS-Reward, but nonsignificant or weaker for respective BAS-Drive and BIS subscales (see Table 4). This parallels the pattern of results found for the MAAS-12, with differences in the correlation strength from the MAAS-24 to the MAAS-12 ranging from −.03 to +.02 (see Supplemental Table 8).
Predictive Validity
To assess the predictive validity of the MAAS in those who completed the follow-up surveys (n = 157), we conducted separate linear regressions with MAAS-24 and MAAS-12 total scores at Time 1 as a predictor and depressive symptoms (i.e., CDI scores) at Time 2 as the dependent variable. The MAAS-24 total score significantly predicted Time 2 depressive symptoms, F(1,151) = 73.39, p < .001, R2adj = .32, β = .57. Additional linear regressions tested which MAAS subscales most strongly predicted depressive symptoms at follow-up. The full model with all three MAAS-24 subscales significantly explained variance in depressive symptoms, F(3,149) = 25.84, p < .001, R2adj = .33. However, only the MAAS-24 Recall subscale remained significantly associated with greater depressive symptoms at Time 2, β = .38, p < .001 (all other ps > .05). No differences were observed in linear regression results for the MAAS-12, which are reported in the supplement (see Supplemental Table 12).
Discussion
This study aimed to develop and validate a multidimensional measure of anhedonia that assesses not only consummatory and anticipatory but also recall anhedonia in adolescence. In Study 1, an initial pool of items was tested across two subsamples of older adolescents. After exploring a 24-item version in Subsample A, we confirmed its structure in Subsample B and further refined the number of items to create a brief 12-item scale. The structure of both was further validated in a younger adolescent sample (Study 2) who completed the measures at baseline and 6 months later to establish test–retest reliability and rank-order stability. Across samples, a three-factor solution reflecting the hypothesized temporal subscales yielded the best fit. Moreover, excellent internal consistency and moderate test–retest reliability were demonstrated. Support for convergence with other anhedonia measures was also found, as well as stronger concurrence with measures of depression and reward processing, relative to other clinical or personality constructs (e.g., anxiety, impulsivity). The MAAS also showed incremental validity over other measures of anhedonia (i.e., the SHAPS, DARS, and ACIPS-A) and predictive validity in relation to adolescent depression, highlighting its clinical potential. Importantly, reliability and validity findings for the brief version paralleled the full version of the measure, such that the MAAS may also be used in measurement contexts with time or resource constraints (e.g., epidemiological studies). Specific findings for individual MAAS subscales are discussed in greater detail below.
MAAS items loaded onto separate factors capturing loss of interest/enjoyment and boredom (i.e., consummatory anhedonia), decreased future-oriented anticipation (i.e., anticipatory anhedonia), and difficulty remembering positive experiences or experiencing associated positive emotions (i.e., recall anhedonia). Perhaps due to the domain-general phrasing of items, it was significantly but moderately correlated with other measures such as the DARS, which focuses on mostly consummatory pleasure across specific domains (e.g., food/drinks; Rizvi et al., 2015). The MAAS total score was also moderately correlated with the ACIPS-A, with the strongest support for convergence between the MAAS and ACIPS-A anticipatory subscales. Although results yielded less consistent support for the convergence of the MAAS consummatory subscale, it should be noted that factor analyses of the ACIPS-A items have not consistently distinguished temporal dimensions of interpersonal pleasure (Gooding & Pflum, 2014; Gooding et al., 2016). Our findings should be interpreted with this drawback in mind and might be further explored in work that adopts disparate (e.g., task-based) measures of anticipatory and consummatory anhedonia. On the other hand, the MAAS total score showed the strongest convergence with the ASA (Watson et al., 2021), of which there was some overlap with its indicators. For example, the ASA also included items measuring loss of overall enjoyment (e.g., “I should have been enjoying things, but I couldn’t”) and anticipation (e.g., “I did not look forward to anything”). However, the MAAS is differentiated in important ways, particularly by its novel subscale (i.e., recall anhedonia). Thus, the MAAS represents a new tool that could inform a more nuanced understanding of adolescent anhedonia across its temporal phases.
Although not otherwise captured by existing scales, impaired recall of positive experiences has been well-documented in both depression and other forms of psychopathology characterized by anhedonia (APA, 2022; Werner-Seidler & Moulds, 2011). Both concurrent and prospective associations found here are also consistent with previous findings that positive memory deficits reflected in recall anhedonia are both symptomatic and predictive of adolescent depression (Askelund et al., 2019; Begovic et al., 2017). In fact, recall anhedonia explained unique prospective variance in depression (i.e., when controlling for anticipatory and consummatory anhedonia), emphasizing its importance as an early warning sign in this regard. Whereas positive memories and their associated emotions may confer resilience (e.g., by facilitating emotional recovery from stress; Tugade & Fredrickson, 2004), difficulties with recall may strengthen the depressogenic effects of stressors common in adolescence. Recall difficulties are also linked to various other risk factors for adolescent depression (e.g., negative self-cognitions; Askelund et al., 2019) and may give rise to other temporal facets of anhedonia. For example, anticipating future experiences of pleasure is likely to rely on recalling past experiences. Correspondingly, our subscales were distinguishable (e.g., in factor analyses) yet strongly correlated. This supports positive memory recall as a focus of prior interventions targeting anticipatory anhedonia (and depression) in adults (Hallford et al., 2024). The MAAS may be used to identify adolescents who may benefit most from such interventions.
Additional evidence for concurrent and discriminant validity of the recall and other subscales supports the utility of the MAAS for this purpose. For example, scores on the recall and anticipatory subscales at Time 1 were most strongly correlated with respective scores at follow-up in Study 2, relative to other subscales. Although this was less apparent for consummatory anhedonia, all subscales explained unique variance in concurrent depression in Study 1. This suggests differential associations with aspects of depression (or other aspects of psychopathology characterized by anhedonia), which might be explored using the MAAS in future research. Moreover, while the MAAS total score was more strongly correlated with depression than other measures of psychopathology, these differences were especially apparent for the recall anhedonia subscale. This may have been due to its comparatively weaker association with anxiety. One possible explanation is that mental representations of past positive experiences are less accessible to the kind of future-oriented worry that often characterizes anxiety. The MAAS recall subscale can be used to test this prospect in future work.
Relatedly, there were small and often nonsignificant correlations of the MAAS recall with the BIS, a measure of behavioral inhibition which has well-established links with anxiety (e.g., Fox et al., 2021). In contrast, the MAAS recall was moderately correlated with reduced responses to reward, even more so than anticipatory and consummatory subscales. Perhaps for this reason, expected differences in associations of the MAAS and reduced responses to reward (i.e., BAS-Reward; Carver & White, 1994) versus BIS were especially apparent for this subscale. Conversely, anticipatory and consummatory subscales showed more consistent albeit small correlations with the BIS, as described in other measures (e.g., the ASA; Watson et al., 2021). This may have contributed to some instances where this difference was nonsignificant for the MAAS total score. While more consistent when comparing associations of the MAAS with the BAS-Reward versus impulsive-related approach (i.e., BAS-Fun), experimental work testing how different facets of anhedonia are impacted by such constructs might help to elucidate processes both shared and unique across its dimensions.
Interestingly, the MAAS total score was not more strongly correlated with positive relative to negative affect (similar to the ASA; Watson et al., 2021), a pattern also reflected across its subscales. This contrasts with studies that validated adult measures of anhedonia in adolescent samples (e.g., the DARS; Hewitt et al., 2023). One possibility is that correlations with measures of anhedonia developed specifically with and for use in adolescents may better reflect age-based nuances in its underlying processes. For example, adolescents’ reward processing could be more strongly influenced by their negative mood (elsewhere shown to decrease reward sensitivity and alter positive memory recall; Hervas & Vasquez, 2013; Werner-Seidler & Moulds, 2011). To the extent that adolescent-specific measures can facilitate research on differences in the presentation of anhedonia and its associated mechanisms across development, the MAAS may help to further clarify the questions presented here. Given that many older adolescents’ experiences referenced in our measure may overlap with emerging adulthood (e.g., salience of growing up, pursuit of dreams), future work might also test whether our measure could be validly used among those in their 20s to further inform this developmental approach.
While important, this work was limited in a number of ways. Subsequent research might build on our use of self-report measures by using other methods (e.g., cognitive tasks) to further elucidate neurocognitive mechanisms underlying the facets of anhedonia measured by the MAAS. Additional limitations pertain to sample characteristics (e.g., non-clinical), which might pose constraints on the generalizability of our findings. Future studies should assess whether the MAAS can discriminate between adolescents with and without a depression diagnosis, or other diagnoses associated with anhedonia (e.g., psychosis). Second, although we administered the MAAS to a younger adolescent sample between the ages of 12 and 19 years old in Study 2, the mean age was approximately 16 years old. As such, it may be important to replicate our findings in a sample with a broader age range. Moreover, the structure was derived in older adolescents and then validated in a younger adolescent sample. Although we confirmed the structure independently in both samples, it remains possible that the initial structure of the measure is most applicable for older adolescents. Of note, this sample was also recruited within the first year of the COVID-19 pandemic, a stressor that may have exacerbated levels of anhedonia in Study 2. While the high school years are also particularly characterized by high levels of boredom and apathy (Spaeth et al., 2015), with some work showing that negative biases in recall of emotional experiences begin to emerge around this time (Zurbriggen et al., 2021), further study is needed to disentangle the influence of the pandemic on age-related differences in scores.
Conclusion
The MAAS is among the first measures of anhedonia designed for use in adolescence and the only one thus far to discriminate between anticipatory, consummatory, and recalled anhedonia. This scale has strong psychometric properties and may inform research on the multidimensionality of anhedonia and its heterogeneous presentation across forms of psychopathology and development. Such research may further yield a better understanding of the mechanisms underlying these differing manifestations, which could help to identify specific targets for intervention. This aim may be especially important in adolescence, where deficient reward processing is often among the first warning signs of a lifelong battle with mental health, suggesting that tailored interventions are urgently needed. As such, the MAAS may be of use for both researchers and clinicians seeking to better understand the multidimensionality of anhedonia in adolescence and fills an important gap in the psychometric literature.
Supplemental Material
sj-docx-1-asm-10.1177_10731911261423154 – Supplemental material for Development and Validation of the Multidimensional Adolescent Anhedonia Scale
Supplemental material, sj-docx-1-asm-10.1177_10731911261423154 for Development and Validation of the Multidimensional Adolescent Anhedonia Scale by Bronwen Grocott, Bita Zareian, Jackson Hewitt, Sabrina Ge, Paul Hewitt, Seonwoo Hong, Martin M. Smith, Xinli Chi and Joelle LeMoult in Assessment
Footnotes
Data Availability
Research data are available upon request.
Declaration of Conflicting Interests
The authors declared no potential conflicts of interest with respect to the research, authorship, and/or publication of this article.
Funding
The authors disclosed receipt of the following financial support for the research, authorship, and/or publication of this article: This research was supported by a Canada Graduate Scholarship—Doctoral (BG), Joseph-Armand Bombardier Canada Graduate Scholarship—Master’s and Doctoral (BZ), and a Psi Chi Undergraduate Research Grant (SG).
Ethical Considerations
This research was approved by the University of British Columbia Behavioral Research Ethics Board on February 3, 2020 (H20-00119). Respondents gave written informed consent and assent before participation.
Supplemental Material
Supplemental material for this article is available online.