
Abstract
The Social Emotional Distress Survey-Secondary Brief (SEDS-Brief) is a five-item self-report scale widely used in school-based mental health screening to assess adolescents’ internalizing distress. Little empirical evidence exists regarding its application among sexually and gender diverse (SGD) students. Using a sample of 460,542 U.S. adolescents (3.6% Native American, 21.2% Asian, 7.9% Black, 38.4% Hispanic, 2.7% Pacific Islander, 7.8% Others, 18.4% White, 47.2% Female, 52.3% Male), this study evaluated the psychometric properties of the SEDS-Brief across 17 SGD groups with intersecting sexual and gender identities. Results supported a unidimensional factor structure, strong internal consistency, and high validity across all groups. Measurement invariance testing indicated support for configural, partial metric, and partial scalar invariance. Item response theory analyses revealed that some items exhibited distinctive item difficulty and discrimination patterns across groups. Findings provide comprehensive psychometric evidence supporting the use of the SEDS-Brief among SGD adolescents and highlight directions to enhance its ability to capturing emotional distress.
Keywords
Within the multitiered system of supports (MTSS), which structures services into three tiers of progressively intensive resources, school-based mental health screening is an essential first step to identify students who may be at risk for social and emotional distress (Vetter et al., 2024). Screening and subsequent follow-up via additional assessment and intervention are important strategies for addressing long-standing mental health disparities among marginalized populations in the U.S. (Centers for Disease Control and Prevention, 2023). Screening is also recognized as a preventive measure to reduce the rising prevalence of mental health issues among youth (Dowdy et al., 2015). As the student population becomes increasingly diverse in terms of race, ethnicity, gender, and sexual orientation (National Center for Education Statistics, 2024), a significant challenge for school-based mental health screening is to ensure that assessments are equitable and fair. This process involves developing screening tools that accurately identify students in need while avoiding systematic over- or under-identification based on their backgrounds (American Educational Research Association [AERA] et al., 2014; Kiperman et al., 2024).
Sexually and gender diverse (SGD) students, who make up more than 10% of the U.S. youth population, are at higher risk for mental health concerns (Batchelder et al., 2021; Cochran & Mays, 2009; Watson et al., 2023). A recent national survey of more than 18,000 SGD individuals ages 13 to 24 found that 39% had seriously considered attempting suicide in the past year, and half of those who wanted mental health care were unable to access it (The Trevor Project, 2024). These findings suggest a critical gap in available mental health services and underscore the urgent need to identify SGD youth in distress. School-based screening represents a unique opportunity for early identification and intervention to address the alarming mental health needs of SGD adolescents. However, research on the validity and effectiveness of mental health screeners for this population remains limited, especially when considering their intersecting sexual and gender identities. The lack of empirical evidence regarding how screeners function among SGD youth presents a significant barrier to interpreting scores accurately and using them to inform equitable, responsive support.
The Social Emotional Distress Survey-Secondary Brief (SEDS-Brief) is a school-based mental health screening tool that assesses adolescents’ internalizing distress symptoms (Dowdy et al., 2018, 2023). This open-access scale comprising only five items has demonstrated strong validity and reliability evidence in large-scale U.S. middle and high school samples (Dowdy et al., 2018, 2023). Its brevity and accessibility make it highly practical for its implementation in public schools, particularly those with limited resources. However, the psychometric properties of the SEDS-Brief have not been explicitly evaluated for SGD students, raising questions regarding its suitability for use with SGD adolescents and the accuracy of score interpretation for this population. Leveraging the largest statewide dataset in the U.S., this study aims to yield evidence for the score interpretations of the SEDS-Brief among SGD students using item response theory (IRT) analyses and structural equation modeling. The findings will guide score interpretation, provide recommendations for refining the SEDS-Brief, and inform future research on school-based screening practices for SGD adolescents, advancing equitable mental health screening in educational settings.
Psychometric Evidence and Application of the Social Emotional Distress Survey–Secondary Brief
The self-rating SEDS-Brief is derived from the original 10-item Social Emotional Distress Scale-Secondary (SEDS-S) to provide a more efficient and openly accessible school-based mental health screener (Dowdy et al., 2023). The SEDS-Brief is designed to support universal school mental health screening practices, explicitly assessing youth’s emotional distress (Dowdy et al., 2018, 2023). The SEDS-Brief has been implemented in schools to monitor the mental health of students in public schools (California Department of Education, 2024). Previous research indicates that the SEDS-Brief’s psychometric evidence supports a unidimensional factor structure with strong factor loadings and moderate temporal stability across large student samples (Dowdy et al., 2023). In addition, evidence supports its validity, demonstrating strong to moderate associations with chronic sadness, suicidal ideation, life satisfaction, well-being, and social-emotional strengths (Dowdy et al., 2023). Measurement invariance analyses further suggest that the SEDS-Brief exhibits full or partial scalar invariance across gender (male, female), grade levels (7th–12th grade), and ethnic groups (Latinx, non-Latinx), supporting its applicability across demographic subgroups (Dowdy et al., 2023; Furlong et al., 2024). Given its rigorous and ongoing validation process, the SEDS-Brief is among the most empirically supported open-access school-based distress screeners for adolescents available. Its open-access format and ease of administration further support its potential for scalable implementation in preventive mental health services in schools, aligning with calls from researchers and practitioners to expand the role of schools in mental health services (Centers for Disease Control and Prevention, 2023; National Center for School Mental Health (NCSMH), 2023).
Although considerable validation efforts have been made, a significant gap persists in assessing its effectiveness for students with diverse and intersecting sexual orientation and gender identities. This highlights an important need for targeted evaluation of the SEDS-Brief to ensure all students who are screened using this tool receive the support they need. This gap is particularly concerning given the crucial role of culturally responsive mental health screening tools in providing equitable and inclusive mental health services to all students (Kiperman et al., 2024). Ensuring that screening tools function equivalently across diverse populations is essential to mitigating biases in early mental health identification (Kiperman et al., 2024). Considering that SGD adolescents are consistently identified as being at a higher risk for adverse psychological and educational outcomes (Guz et al., 2020; The Trevor Project, 2024; Walsemann et al., 2014), the accurate interpretation of SEDS-Brief scores for these adolescents becomes increasingly important. Hence, further research is warranted to examine the SEDS-Brief’s psychometric properties within SGD student populations.
Psychometric Considerations Among Adolescents with Intersecting Gender and Sexual Identities
According to multiple theoretical frameworks, adolescents with diverse sexual and gender identities may interpret and respond to items in mental health screeners differently due to their lived experiences. The minority stress theory suggests that SGD adolescents encounter unique stressors, such as discrimination and microaggressions, that contribute to heightened psychological distress (Ching et al., 2024). Owing to their chronic experience of minority stress in daily living, they may also develop greater awareness of their emotional distress, resulting in higher baseline distress levels compared to their Cisgender, Straight peers (Borgogna et al., 2019, 2021). Their reports of more intense distress may not necessarily indicate more significant psychological dysfunction but rather reflect increased emotional awareness and distinct cognitive appraisals of distress (Borgogna et al., 2021). Adolescence is also a critical period of identity development (Glover et al., 2009), during which the influence of societal norms and expectations around gender roles can be particularly salient, affecting how students respond to items asking about their levels of distress (Eagly & Wood, 2012). Research suggests that such societal expectations of gender roles may shape distress endorsement patterns and interpretation of distress items (Borgogna et al., 2021), potentially causing measurement bias.
Furthermore, higher distress reports among SGD adolescents may not inherently indicate maladjustment. Instead, from the perspective of resilience theory, some researchers argue that SGD individuals develop adaptive coping strategies in response to minority stress, allowing them to navigate adversity effectively (Meyer, 2015); this suggests the possibility of the SEDS-Brief scores having differential validity across students with different SGD identities. Given these unique lived experiences and the influence of gender role norms, it is likely that the measurement properties of the SEDS-Brief function differently across SGD adolescents (Gomez & McLaren, 2017). Without understanding these psychometric nuances, SEDS-Brief scores may be misinterpreted for research or practical applications involving SGD youth.
Despite clear theoretical reasons and practical needs for examining the psychometric properties of mental health instruments among SGD adolescents, there are several notable gaps in the literature examining culturally responsible assessment practices for this population. First, many psychometric methods require large sample sizes, precluding conducting rigorous analyses for SGD groups. Thus, few instruments for distress symptoms have been evaluated for their applicability to this population (Borgogna et al., 2021; Gomez & McLaren, 2017). Second, likely due to the sample size requirements for conducting rigorous analyses, some prior studies have opted to aggregate various SGD identities, overlooking the significant diversity in their lived experiences (Gomez & McLaren, 2017; Jeon et al., 2025). Third, prior research has focused mainly on evaluating scale-level psychometric properties (Borgogna et al., 2021; Gomez & McLaren, 2017). Few studies have examined item functioning, which can offer a more in-depth understanding of measurement invariance and potential areas for scale refinement (Widaman & Grimm, 2014). Fourth, previous research on scale validation among SGD adolescents has rarely explored differential validity, investigating whether a distress measure is associated with outcomes equally well across different SGD groups. Furthermore, when examining measurement invariance across SGD groups in existing literature, many studies did not consider the imbalanced sample sizes of sexual and gender minority groups with Cisgender Straight groups; this can be problematic because invariance testing results would be primarily driven by the groups with larger sample sizes (Yoon & Lai, 2018), potentially masking the actual invariance between Cisgender Straight groups and other SGD groups. This study addressed existing gaps by employing various analytical methods to evaluate the SEDS-Brief instrument at both scale and item levels. It provided a thorough assessment of the measurement properties of the SEDS-Brief across 17 intersecting SGD groups, taking into account the diversity within these intersecting identities.
Current Study
Given that SGD students make up a significant portion of the student population and are particularly vulnerable to mental health issues (Batchelder et al., 2021; Cochran & Mays, 2009; Watson et al., 2023), it is crucial to evaluate the measurement properties of the SEDS-Brief to support accurate score interpretation. Such validation will facilitate the early identification of the diverse needs among students with varying sexual orientations and gender identities and foster a more inclusive approach to mental health screening and support in educational environments.
This study has five research objectives. The first two objectives examined whether the distress construct is similarly structured across groups by assessing the factor structure and internal consistency reliability of the SEDS-Brief across SGD groups. Building on the theoretical framework and prior psychometric evidence from the SEDS-S (Dowdy et al., 2018, 2023), we evaluated whether a unidimensional factor structure (see Figure 1) adequately represents the SEDS-Brief and its internal consistency reliability within SGD groups. The third objective focused on the functioning of the SEDS-Brief items and their ability to differentiate between students with varying levels of the SEDS latent trait within each SGD group. The fourth objective assessed whether the SEDS-Brief maintained consistent measurement properties across SGD groups. Finally, the fifth objective explored the divergent validity of the SEDS-Brief by examining its relations with selected psychological functioning across SGD groups.
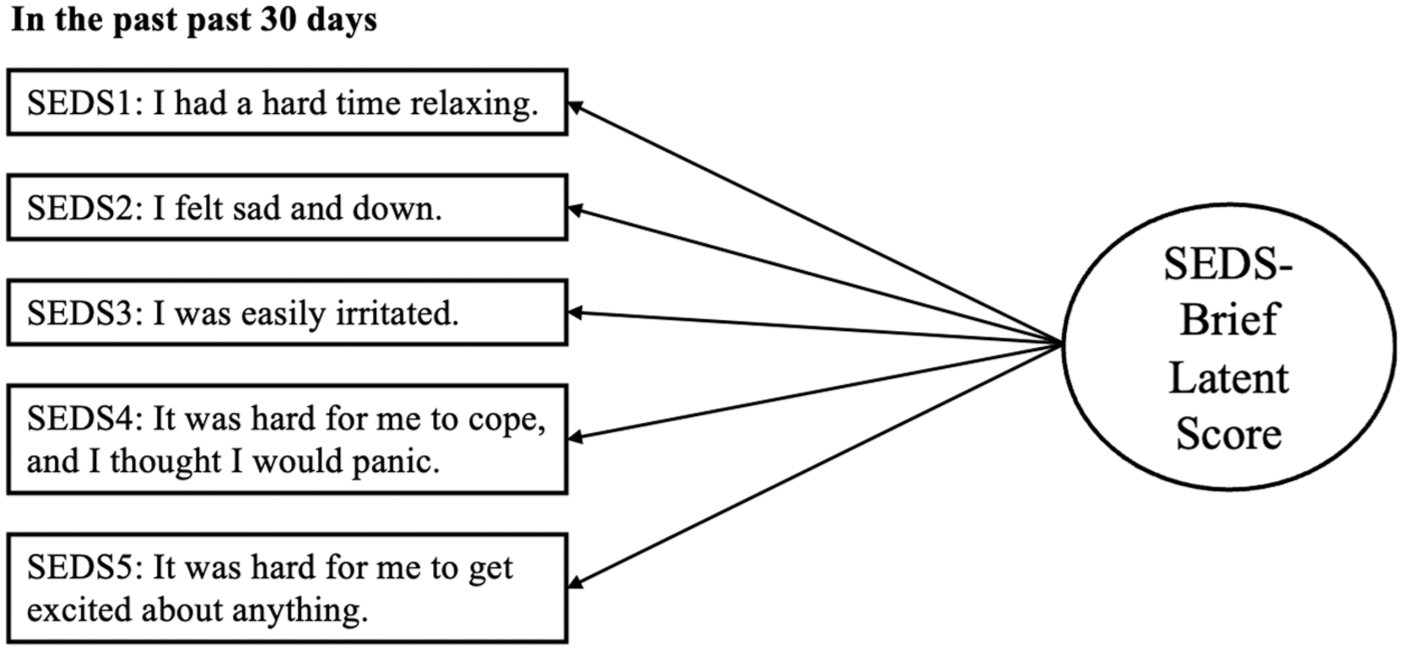
One-Factor Model of the SEDS-Brief.
Method
We reported how we determined our sample size, all data exclusions, all manipulations, and all measures we used in the study.
Participants and Procedure
We first screened the dataset by including students who received in-person instruction and passed the quality checks based on their responses to substance use and dishonesty items established by the California Healthy Kids Survey (CHKS). Because our research focuses on the application of the scale among SGD adolescents, we excluded responses from participants who selected “something else” (3.4%), “decline to respond” (6.8%), or “not sure” (5.1%) regarding their sexual orientation or gender identity. This exclusion aimed to prevent mischaracterizing participants’ lived experiences, as the option “something else” may encompass a diverse range of identities (Julian et al., 2024; Suen et al., 2020). These response options did not provide specific information about participants’ gender orientation and sexual identities. As a result, 13.8% of the participants were excluded from the final analysis. Furthermore, we chose not to analyze the Transgender Nonbinary Straight group due to its small sample size, consisting of only 57 respondents. The final sample included 460,542 adolescents across 17 groups. Table 1 presents the demographic characteristics of the SGD groups.
Demographic Characteristics by Sexually and Gender Diverse (SGD) Groups.
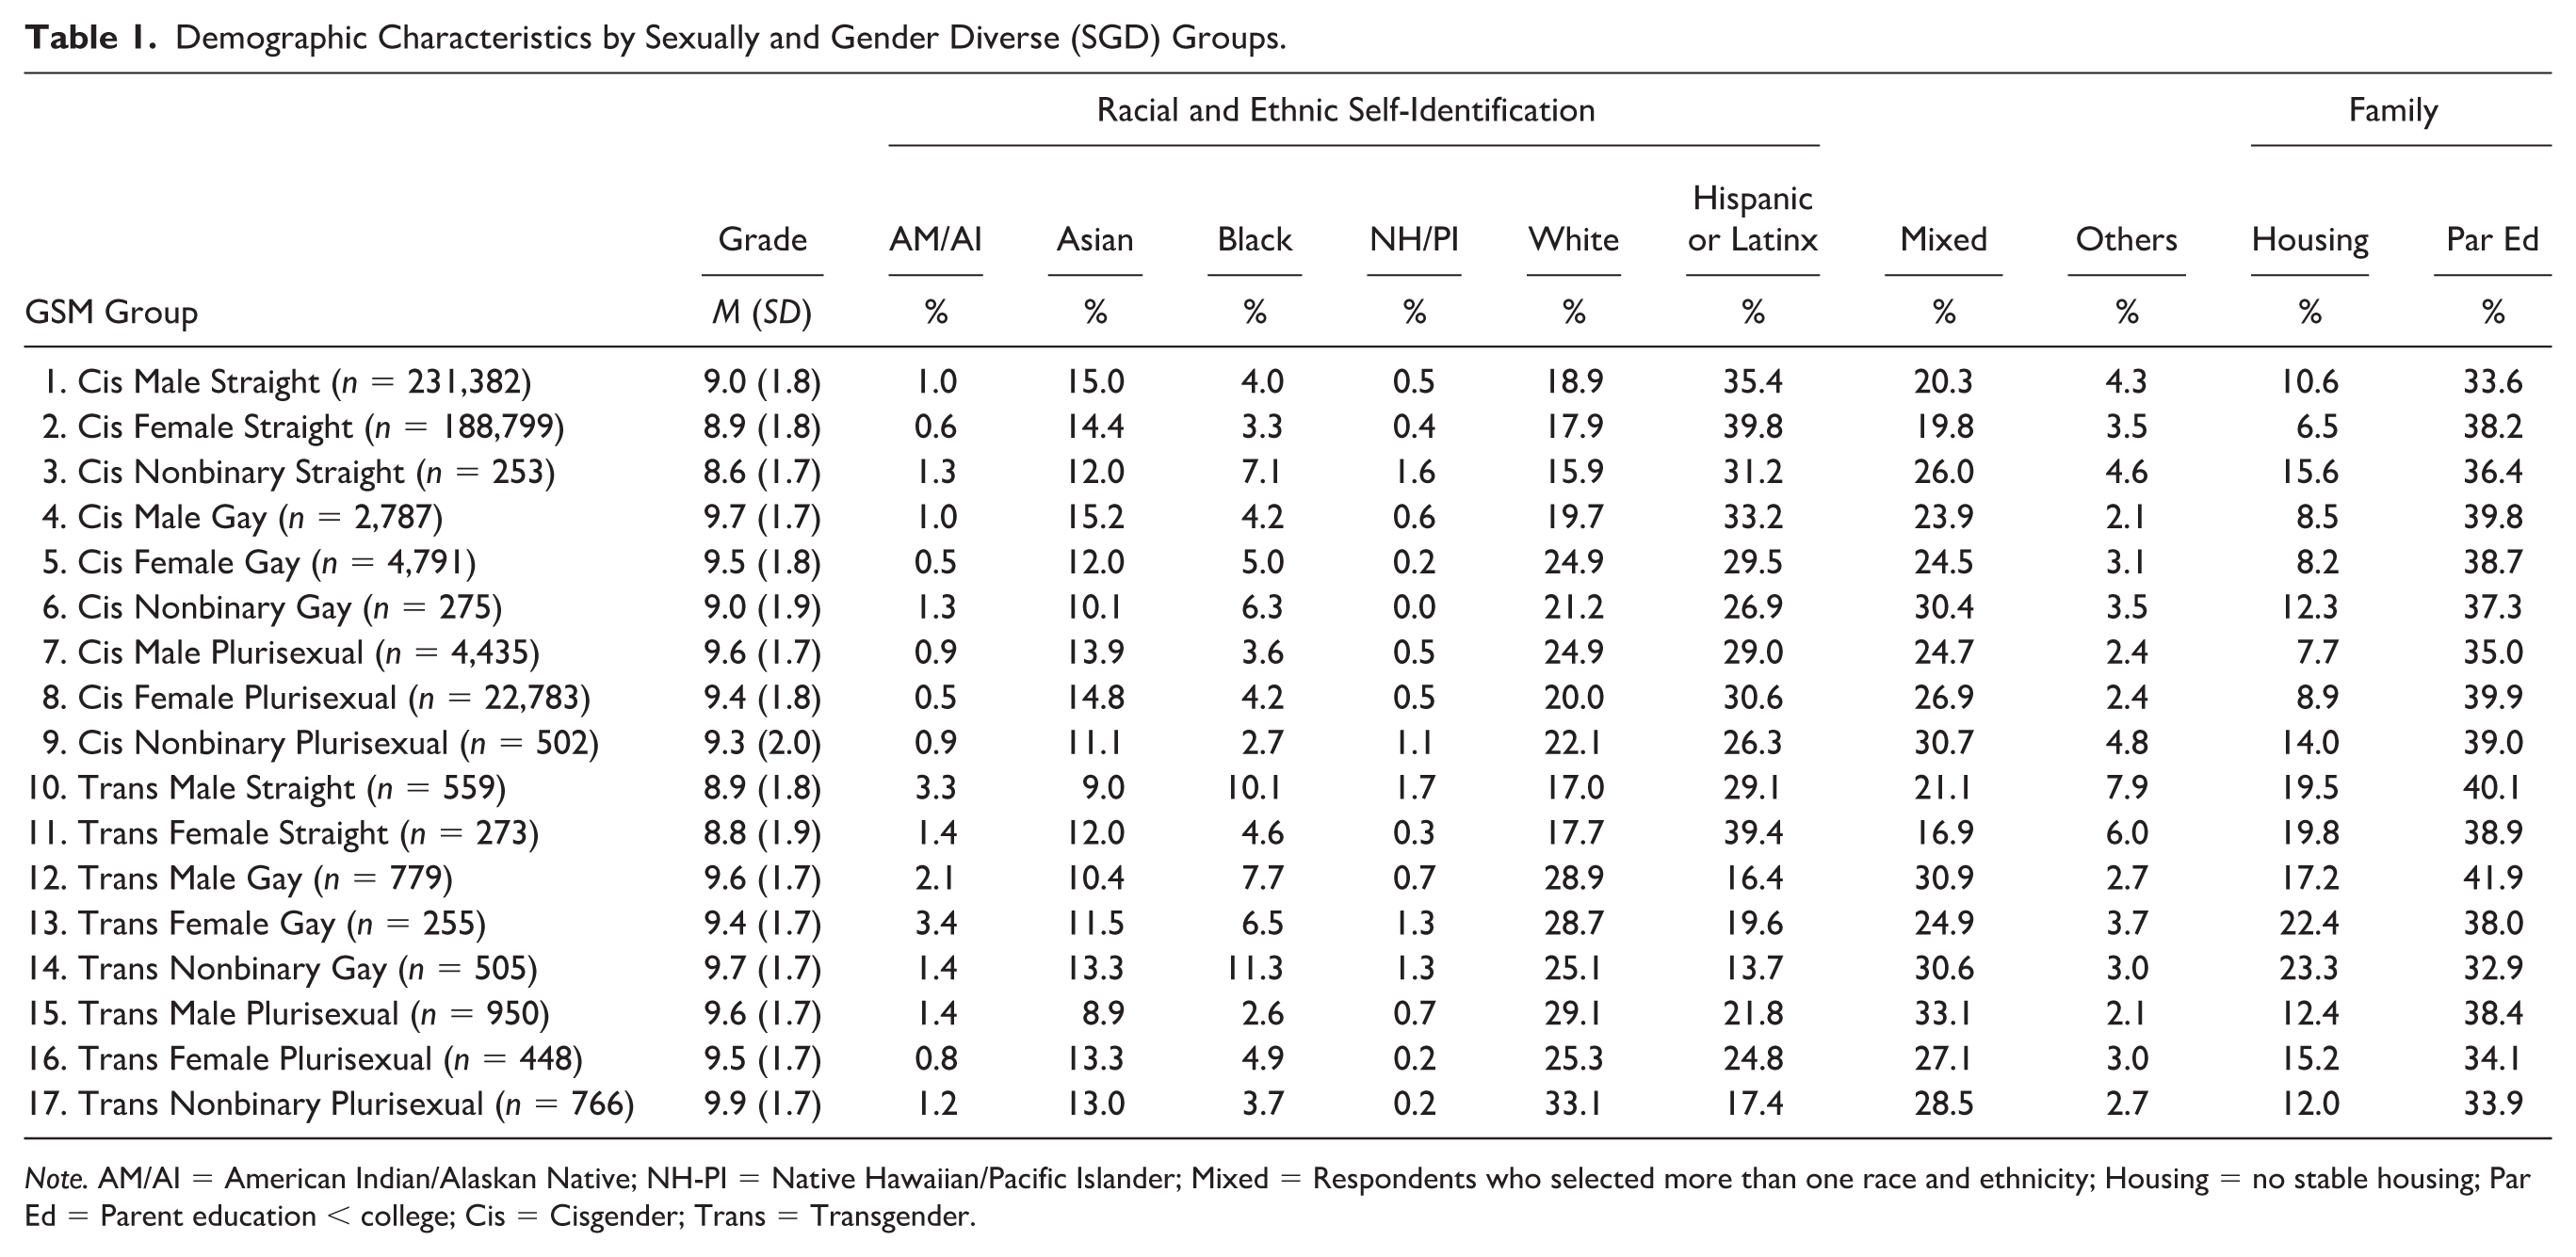
Note. AM/AI = American Indian/Alaskan Native; NH-PI = Native Hawaiian/Pacific Islander; Mixed = Respondents who selected more than one race and ethnicity; Housing = no stable housing; Par Ed = Parent education < college; Cis = Cisgender; Trans = Transgender.
The CHKS is a statewide survey designed to anonymously assess student risk behaviors and protective factors. For this study, data were collected during the 2023–2024 academic year. Surveys were administered in a standardized manner by trained school staff, who read from a script to emphasize that participation was voluntary, and responses were anonymous. Students provided assent and completed the survey during school hours, but parental passive consent was obtained following standard protocols (see http://chks.wested.org/administer/instructions). The Human Subjects Committee at the authors’ institution determined that formal ethical approval was not required for this study.
Measures
Sexual Orientation and Gender Identities
Three questions were used to assess students’ gender identity and sexual orientation. For the gender identity question, participants could choose from the following options: “male,” “female,” “non-binary,” or “something else.” For the question about transgender identity, participants could select from “no, I am not transgender,” “yes, I am transgender,” “I am not sure if I am transgender,” or “decline to respond.” Regarding sexual orientation, participants answered the question, “Which of the following best describes you?” by choosing from “straight,” “lesbian or gay,” “bisexual,” “something else,” “not sure,” or “decline to respond.” Based on responses to these three questions about gender and sexual orientation, we categorized participants into 18 groups that were either Cisgender or Transgender, Male, Female, or Non-binary, and Straight, Gay, or Plurisexual. However, only 17 SGD groups were analyzed because Transgender Nonbinary Straight group was not included due to its small size.
SEDS-Brief
The 5-item SEDS-Brief is an abbreviated version of the original 10-item Social Emotional Distress Survey-Secondary (SEDS-S; Dowdy et al., 2023). Students responded to a 4-point scale (1 = not at all true, 2 = a little true, 3 = pretty much true, and 4 = very much true), indicating how much they had experienced distress symptoms in the past month. The items from the SEDS-Brief are displayed in Figure 1.
Brief Multidimensional Student Life Satisfaction Scale
To assess the divergent validity of the SEDS-Brief, we utilized the well-established Brief Multidimensional Student Life Satisfaction Scale (BMSLSS) scale, which consists of five items that evaluate youth satisfaction in the areas of family life, friendships, self-perception, school, and living environment (Athay et al., 2012; Furlong et al., 2024). The BMSLSS is an abbreviated version of the 40-item Multidimensional Students’ Life Satisfaction Scale (Lani, 2010). Students rated their satisfaction on a six-point scale: 1 = very dissatisfied, 2 = dissatisfied, 3 = a little dissatisfied, 4 = a little satisfied, 5 = satisfied, and 6 = very satisfied. The omega coefficients ranged from .85 to .91 across groups, indicating adequate internal reliability.
School Connectedness
To evaluate the concurrent validity of the SEDS-Brief, students completed a five-item scale (Furlong et al., 2011) assessing students’ perceived connectedness to their schools (Too et al., 2022). This scale utilized a five-point response format: 1 = strongly disagree, 2 = disagree, 3 = neither agree nor disagree, 4 = agree, and 5 = strongly agree. For example, one question on the scale is, “I feel close to people at this school.” The scale demonstrated adequate internal reliability across various SGD groups, with omega coefficients ranging from .78 to .86.
Demographic Characteristics
To assess divergent and concurrent validity, we controlled for students’ race/ethnicity, grade levels, living conditions, and parents’ education, recognizing the documented influences of these social factors on students’ school connectedness (Chan et al., 2023), psychological health (Chan et al., 2022; Furlong et al., 2024), and psychological strengths (Chan et al., 2021; Haider & von Stumm, 2022). For race/ethnicity, students self-identified with one of eight racial/ethnic groups: American Indian/Alaskan Native, Asian or Asian American, Black or African American, Native Hawaiian or Pacific Islander, Hispanic or Latinx, White, or Other, with White as the act group. Data on grade levels were collected from school records, with respondents in grades ranging from 6th to 12th. When reporting their living conditions, students’ responses were categorized as stable housing (a home with one or more parents or guardians) or unstable housing (e.g., living with a relative or friend), with stable housing as the reference group. Parents’ education levels were self-reported and classified into two categories: college or above and below college, with college or above serving as the reference group.
Data Analysis
This study’s design and its analysis were not preregistered. All the code can be accessed at https://osf.io/zpjtb on Open Science Framework. The data and study materials are publicly available and can be requested through WestEd. Data were analyzed using the Lavaan (Rosseel, 2012) and mirt (Chalmers et al., 2016) in the R software program as well as Mplus 8.11 (Muthén & Muthén, 2017). The percentages of missing data for the study variables were less than 5%, which is considered acceptable (Dong & Peng, 2013). The full-information maximum likelihood (FIML) estimator was utilized under the assumption that the missing data were missing at random (MAR).
Research Objectives 1 and 2: Factor Structure and Reliability
We evaluated the internal structure of the SEDS-Brief by estimating model fit statistics for a one-factor model using confirmatory factor analysis through the lavaan package (Rosseel, 2012) for each group. Since the response scale was ordinal, we employed the Weighted Least Squares Mean and Variance adjusted (WLSMV) estimator. Model fit was assessed using the Comparative Fit Index (CFI), Root Mean Square Error of Approximation (RMSEA), and Standardized Root Mean Square Residual (SRMR). Acceptable model fit statistics were defined as CFI > .90, RMSEA < .08, and SRMR < .08 (Hu & Bentler, 1999). In addition, we calculated omega (ω) coefficients and Cronbach’s alpha (α) for the SEDS-Brief scale for each SGD group. While there are no absolute guidelines for interpreting internal consistency reliability (AERA et al., 2024), most established youth mental health screeners for depressive and anxiety symptoms have reported internal consistency reliability ranging from .80 to .89 (Becker-Haimes et al., 2020).
Research Objective 3: Item Functioning
We utilized the mirt package (Chalmers et al., 2016) to assess item functions for the SEDS-Brief. This measure is based on a unidimensional model utilizing a polytomous response scale (Dowdy et al., 2018, 2023). We evaluated three different model structures: the graded response model (GRM), the partial credit model (PCM), and the generalized partial credit model (GPCM). Each model is suitable for analyzing ordinal response data, but they differ regarding parameter constraints and assumptions regarding ordinal responses, leading to varying complexities (Muraki & Carlson, 1995). We compared the different IRT models using fit statistics to determine the best-fitting model. Once we selected the appropriate model, we estimated several key parameters: discrimination parameters (a), threshold parameters (B), item-standardized pattern coefficients, and commonalities.
The discrimination parameters indicate how effectively an item differentiates between participants with varying latent traits. Estimates of the discrimination parameter (a) around 1.0 or higher suggest that the item has adequately steep slopes, indicating high differentiation (Embretson & Reise, 2000). The threshold (B) parameters assess item difficulty, reflecting the probability that an individual with certain latent traits will choose one response category over another. Standardized pattern coefficients reveal the strength of each item’s relation to the latent factor, with coefficients above 0.30 indicating that the item effectively measures the intended construct (Hair et al., 2019). Item commonalities represent the proportion of the item’s variance explained by the latent factor, with higher communalities suggesting that a more significant portion of the item’s variance can be attributed to the latent construct (Tabachnick & Fidell, 2013).
Research Objective 4: Measurement Invariance
To assess whether the SEDS-Brief scale functions equivalently across groups, we utilized multiple-group confirmatory factor analysis (CFA) to evaluate invariance at the levels of factorial structure, factor loading, and intercept for the entire scale across 17 groups. We employed the subsampling method, considering the potential bias due to unbalanced group sample sizes (Yoon & Lai, 2018). We referred to two sets of criteria for model comparisons to determine if a significant change in model fit existed. The first set, from Chen (2007), suggests cutoff values of ΔCFI < .010 and ΔRMSEA < .015 or ΔSRMR < .030. In addition, we referenced more liberal criteria proposed by Rutkowski and Svetina (2014), which include ΔRMSEA < .030 and ΔCFI < .02 because their simulation study indicated that the ΔRMSEA and ΔCFI associated with metric invariance tend to increase as the number of groups increases.
In our analysis, CFA and IRT each provide complementary information about the measurement quality of the SEDS-Brief (Widaman & Grimm, 2014), while they are mathematically related (Kamata & Bauer, 2008). Even though the CFA allowed us to test the overall fit of the factor structure and assess measurement invariance, IRT allowed us to examine this item-level functionality descriptively. CFA provides a formal test of model fit of the model structure and invariance at the construct level, and the IRT analyses provide fine-grained diagnostic information about individual items, together offering a comprehensive examination of the SEDS-Brief’s psychometric functioning.
Research Objective 5: Validity
We estimated a structural equation model in a multigroup framework to illustrate the selected measurement model of the SEDS-Brief and the structural relations between the latent SEDS-Brief factor and the observed scores of life satisfaction and school connectedness within each subgroup. The standardized regression coefficients indicate the strength and direction of the relations between the latent SEDS-Brief factor and students’ psychological functioning, allowing us to evaluate the divergent validity of the SEDS-Brief scores. To account for the influence of students’ demographic backgrounds on the outcomes, we regressed grand-mean centered variables such as grade level, race/ethnicity, parents’ education, and living environments on the outcome variables. We then compared an unconstrained model, in which the predictive paths were freely estimated across groups, to a constrained model, in which all predictive paths were set to be equal across groups, allowing us to assess if the relations were the same across the groups. Model comparisons were conducted using the cutoff scores similar to invariance testing.
Results
Table 2 shows the descriptive statistics of the SEDS-Brief items and the outcome variables in the structural equation model using the overall sample.
Descriptive Statistics of the Focal Study Variables.
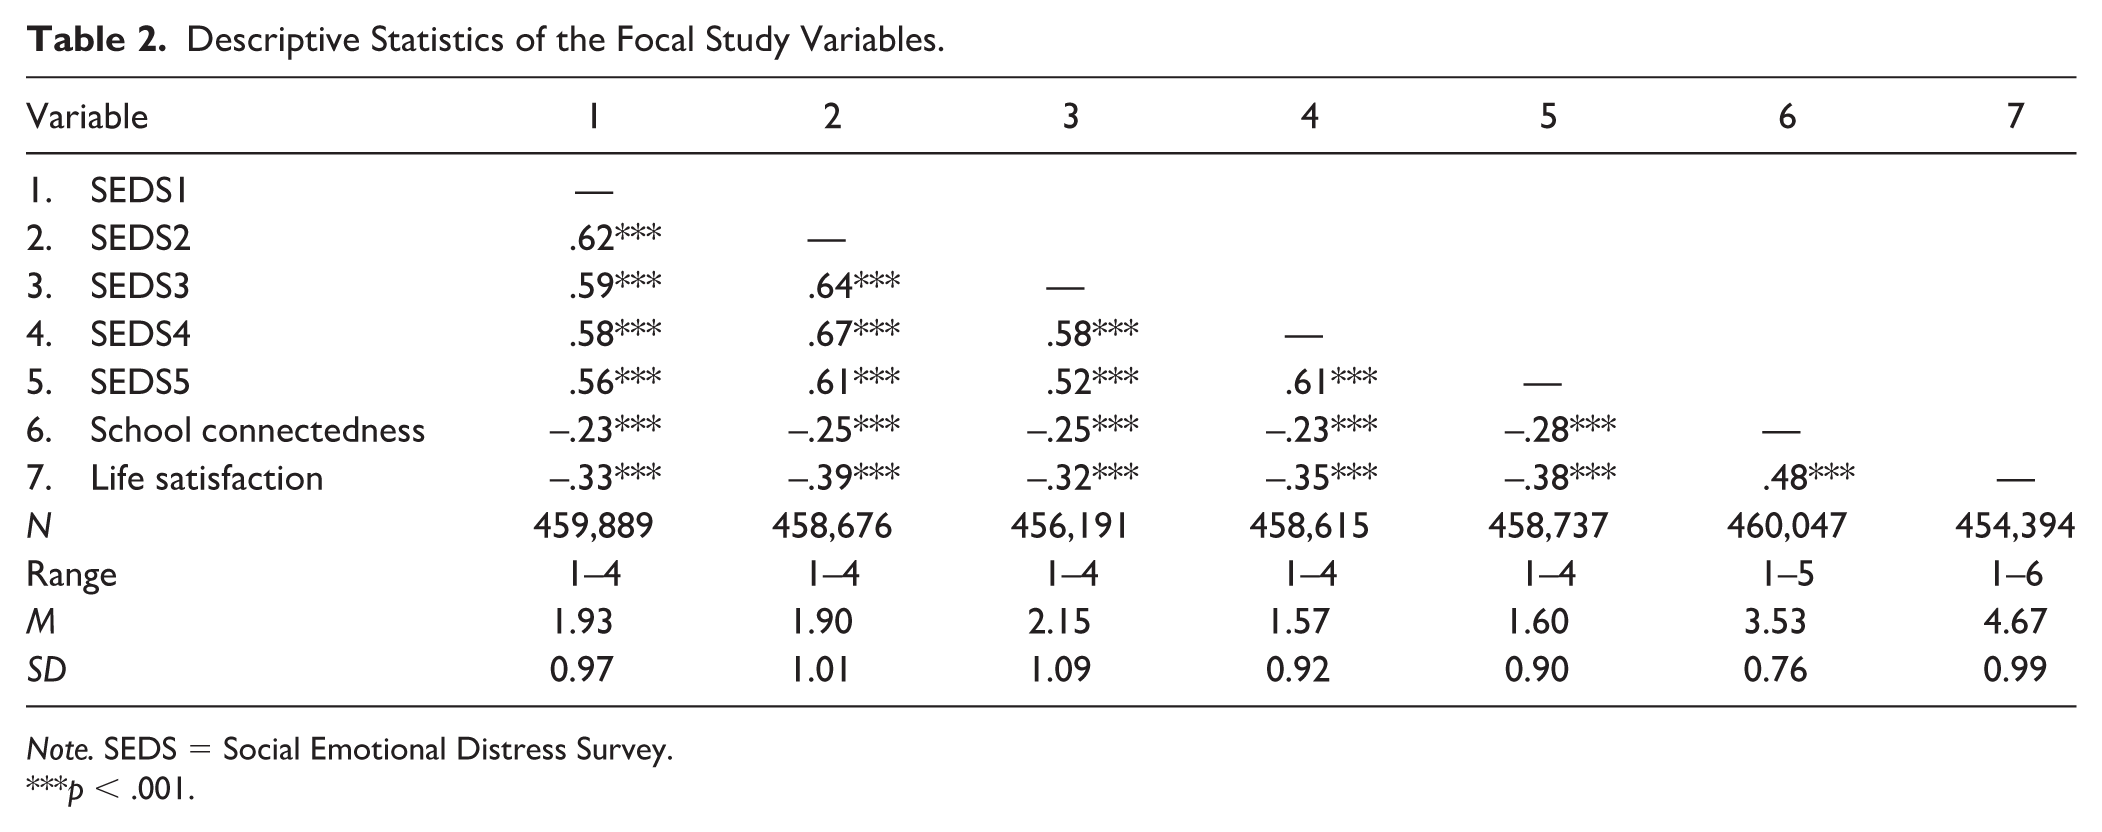
Note. SEDS = Social Emotional Distress Survey.
p < .001.
Factor Structure and Reliability of SEDS-Brief
Table 3 presents the fit statistics for the one-factor model based on the CFA results for each subgroup. The unidimensional model demonstrated an adequate fit, as indicated by the following criteria: CFI > .90, RMSEA < .08, and SRMR < .08 (Hu & Bentler, 1999), across all subgroups. The omega coefficients for the unidimensional model revealed that the SEDS-Brief ω values ranged from .85 to .93, indicating good internal consistency reliability of the SEDS-Brief factor within each group.
One-Factor Model Fit Statistics of the SEDS-Brief by Sexually and Gender Diverse (SGD) Groups.
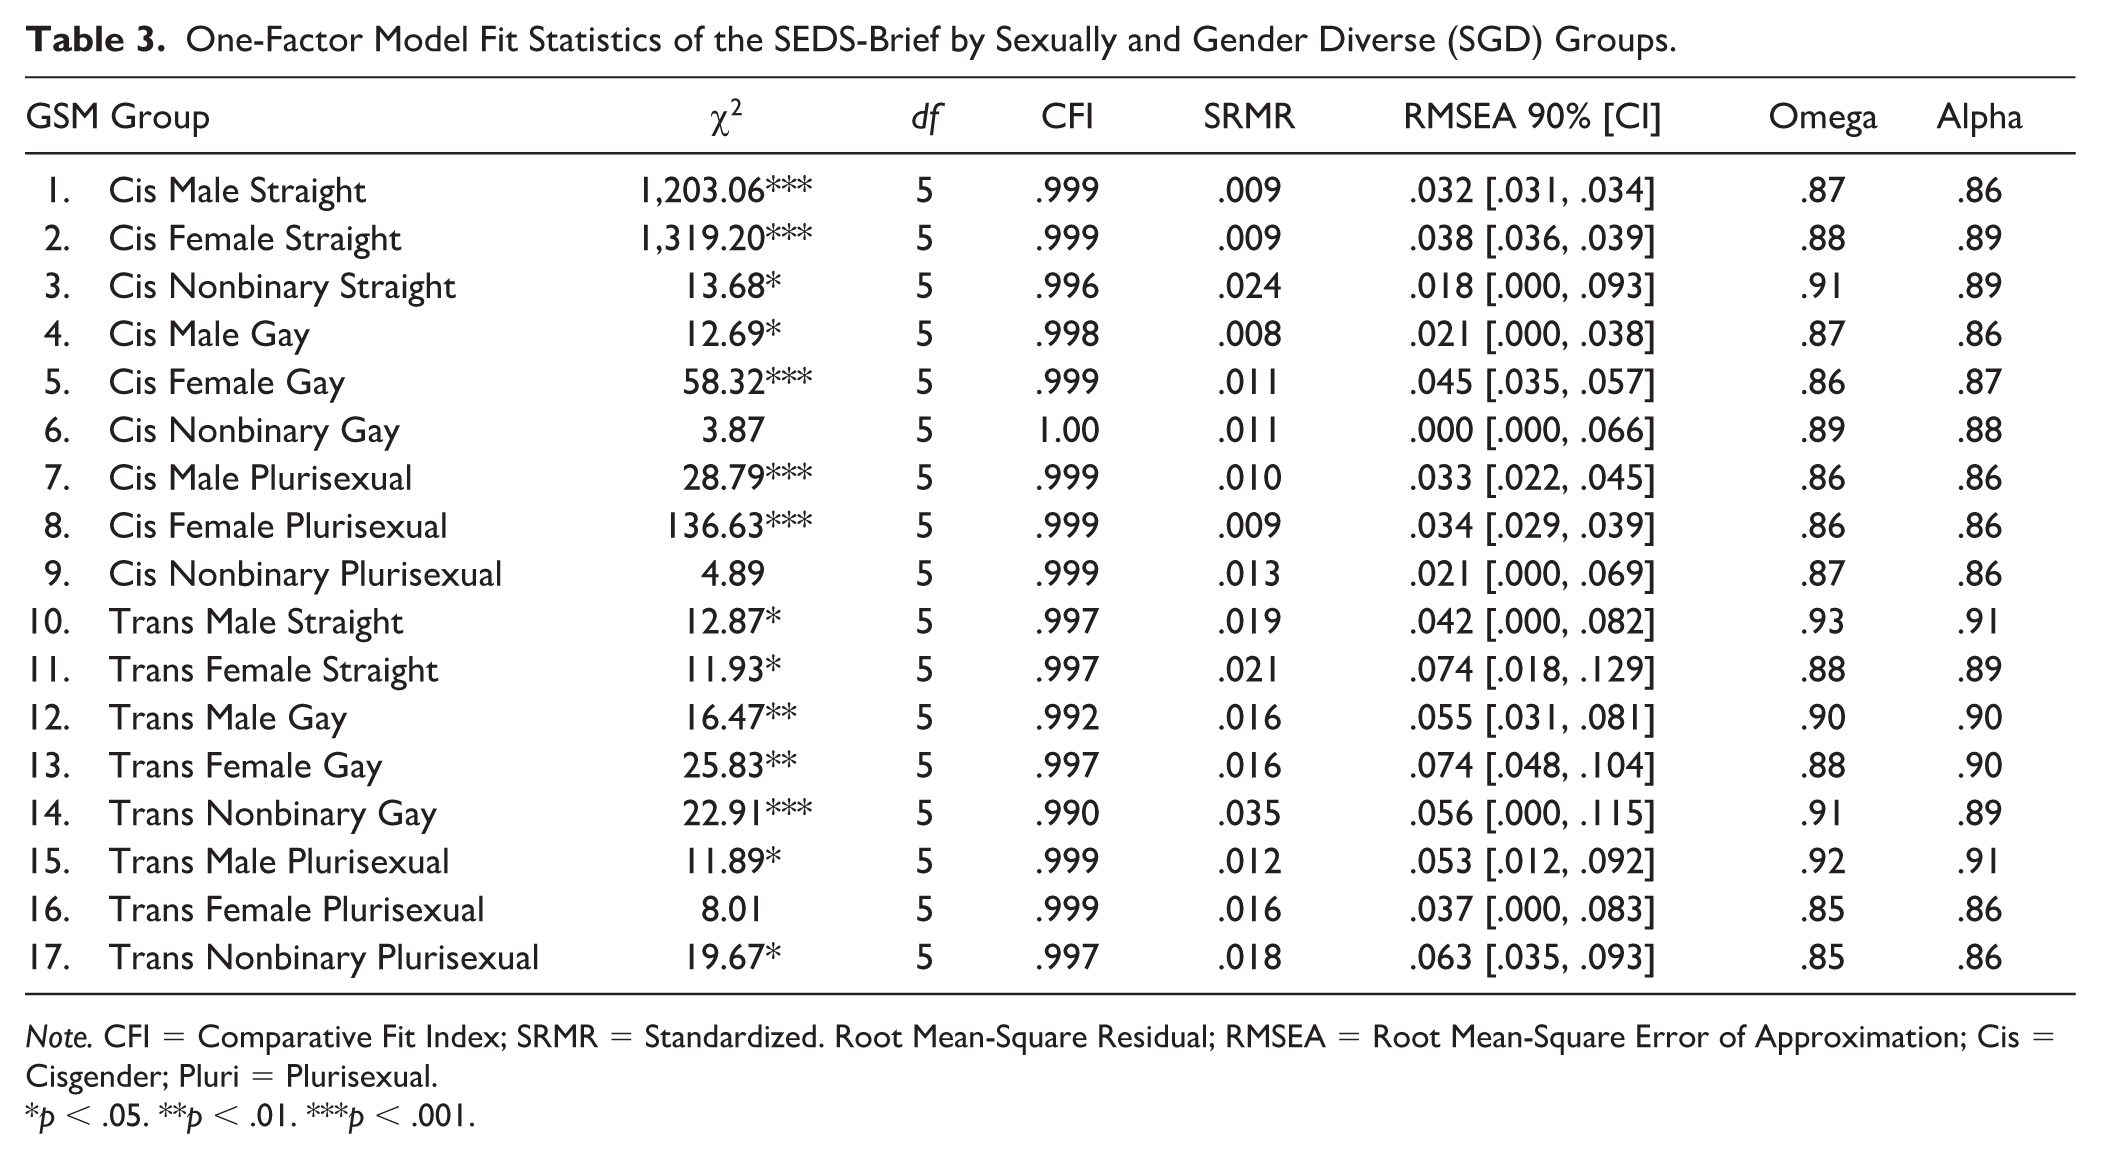
Note. CFI = Comparative Fit Index; SRMR = Standardized. Root Mean-Square Residual; RMSEA = Root Mean-Square Error of Approximation; Cis = Cisgender; Pluri = Plurisexual.
p < .05. **p < .01. ***p < .001.
Item Functioning
When comparing the three IRT model structures (i.e., GRM, PCM, and GPCM) across the overall sample, the fit statistics indicate that the GRM structure provides a better fit than the other two models. The fit statistics are as follows: GRM: AIC = 89,881.54, SABIC = 89,958.62, BIC = 90,022.18; PCM: AIC = 92,686.88, SABIC = 92,756.25, BIC = 92,813.45; GPCM: AIC = 90,697.48, SABIC = 90,774.56, BIC = 90,838.12. Therefore, the IRT analyses for the SEDS-Brief were conducted using the GRM structure.
Table 4 presents the pattern coefficients, item communalities, discrimination, and difficulty parameters. All groups demonstrated pattern coefficients above 0.70, indicating that each item made a meaningful contribution to measuring the SEDS-Brief factor. The item communalities suggested that the latent trait measured by the SEDS-Brief accounted for a significant portion of the variance in the item responses, indicating the items were strongly aligned with the underlying construct being measured. However, in some groups, SEDS1 (SEDS-Brief Item 1; I had a hard time relaxing), SEDS3 (I was easily irritated), and SEDS5 (It was hard for me to get excited about anything) exhibited lower communalities, ranging from 0.57 to 0.68, but they were still above acceptable values, meaning they contributed meaningfully to the latent factor.
The SEDS-Brief Unidimensional Item Response Theory Discrimination and Threshold Parameters by Sexually and Gender Diverse (SGD) Groups.
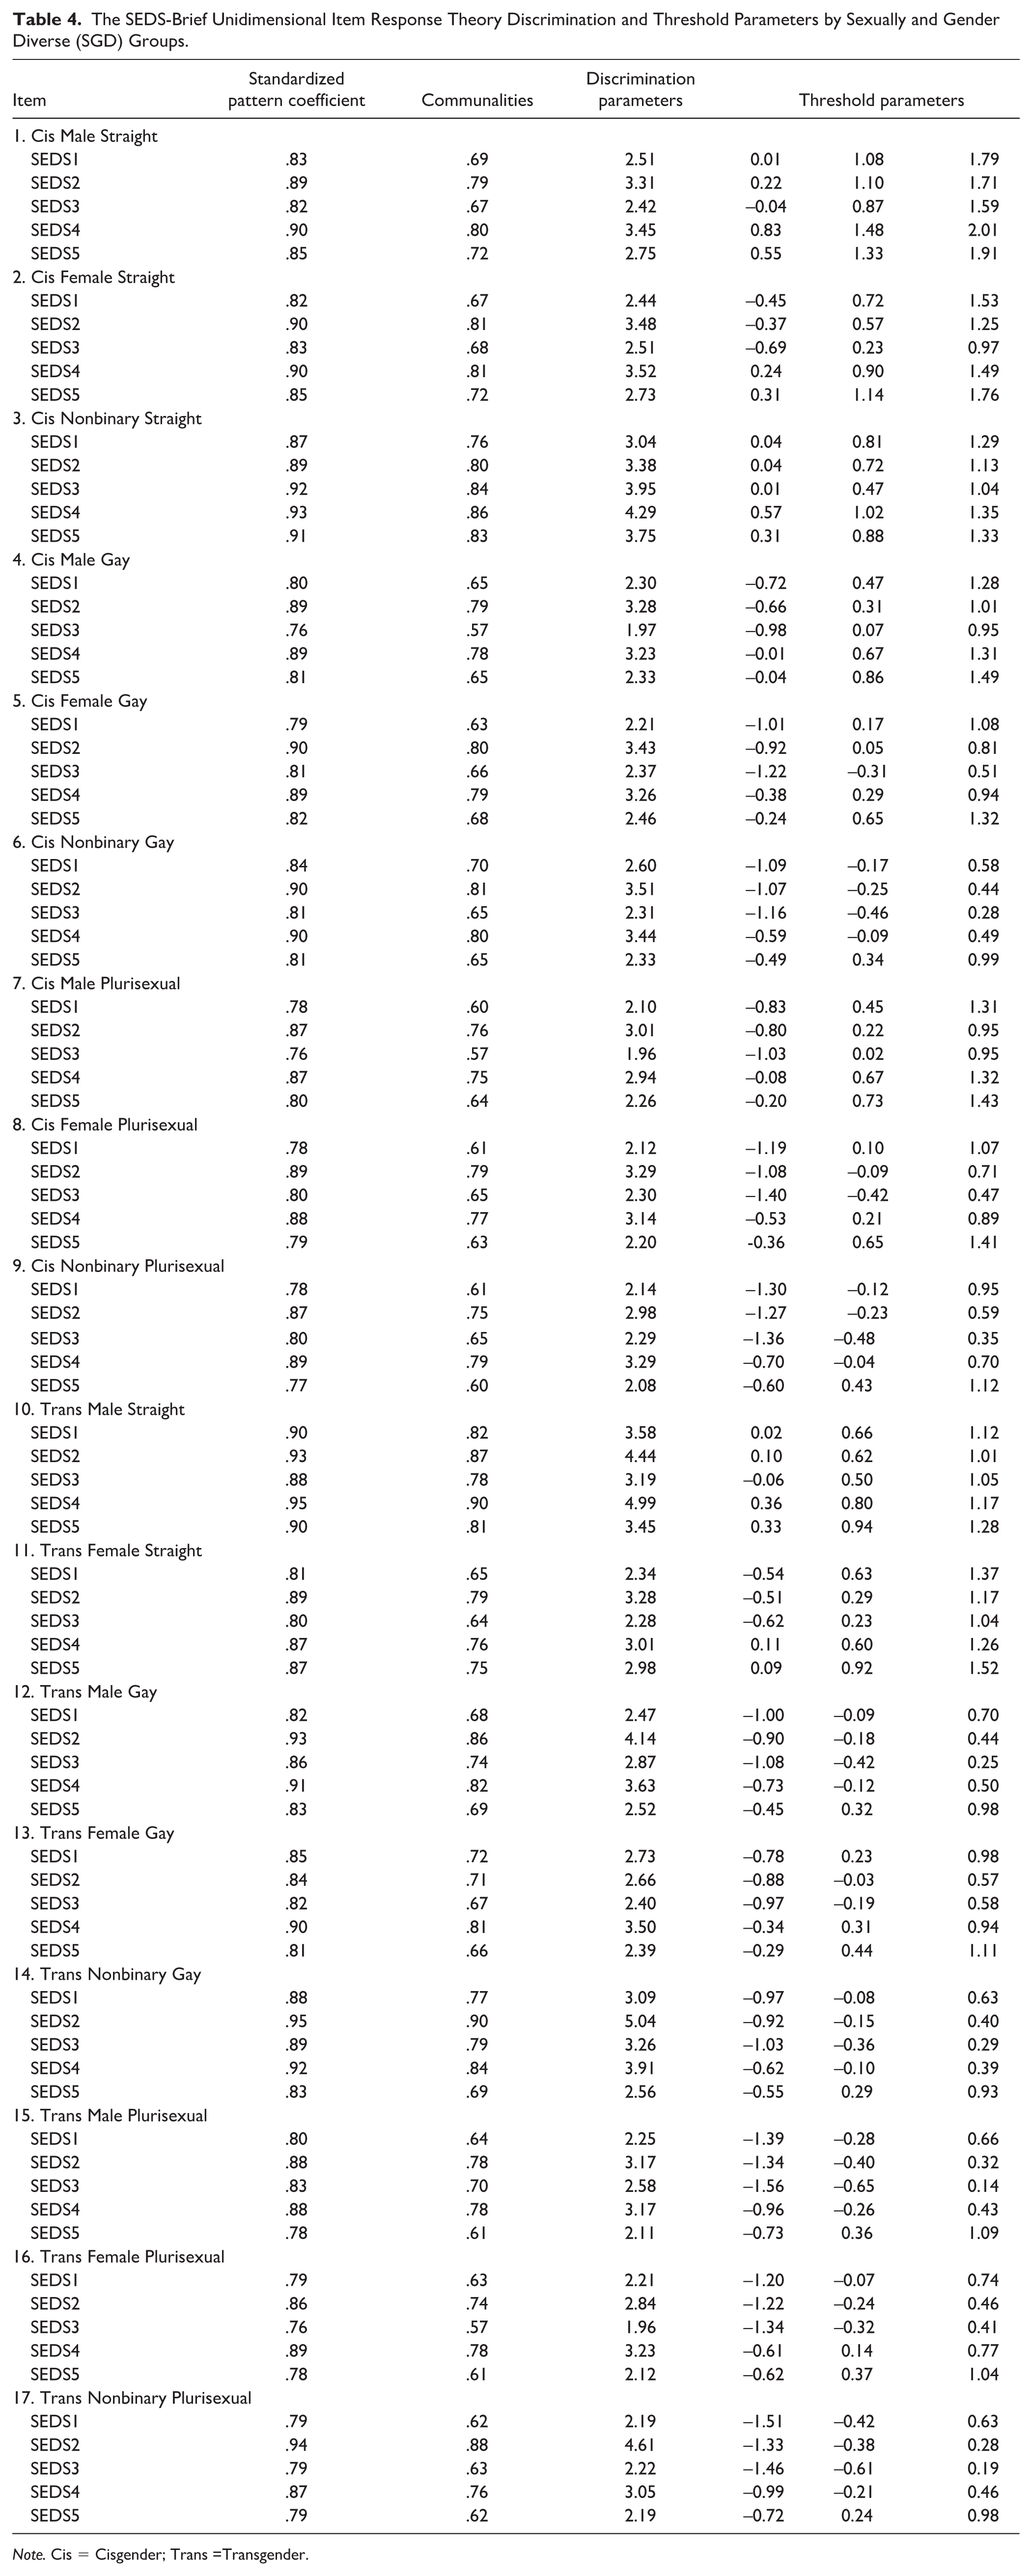
Note. Cis = Cisgender; Trans =Transgender.
All items in the SEDS-Brief demonstrated high discrimination ability, although the discrimination parameters varied significantly across groups, with values ranging from 1.97 to 5.04. Notably, SEDS2 (I felt sad and down) and SEDS4 (It was hard for me to cope, and I thought I would panic) had steeper slopes than the other items across all groups. Overall, all items effectively differentiated between individuals at varying levels of the latent trait measured by the SEDS-Brief.
Regarding difficulty parameters, there were three threshold points for the 4-point response scale. Threshold B1 indicates the point at which a student is more likely to select response option 2 (a little true) over response option 1 (not at all true). Threshold B2 marks the point at which a student is more inclined to choose response option 3 (pretty much true) over response option 2 (a little true). At the same time, Threshold B3 signifies the point at which a student is more likely to select response option 4 (very much true) than response option 3 (pretty much true). The items distinguished students within the latent trait’s low to moderately high range. However, the items also showed distinct response patterns across different groups. For the Gay and Plurisexual groups, the items were more likely to cover students with lower levels of the latent trait. For instance, students in the Cisgender Nonbinary Gay group needed to score only 0.28 standard deviations above the average on the SEDS3 item (I was easily irritated) to be more likely to choose the highest response category. This threshold was lower than those observed for Cisgender Straight groups. Similarly, for Transgender Gay and Plurisexual groups, all items tended to reflect lower thresholds, indicating that adolescents in these groups required less of the latent trait to endorse higher response options compared to their Cisgender and Transgender Straight peers. This finding suggests that the items were “easier” for these groups and may reflect differences in how the latent trait manifests across various SGD groups.
Measurement Invariance
Table 5 displays the results of invariance testing for the SEDS-Brief across 17 groups. For the subsampling method, at the configural level, the scale showed an acceptable model fit, with a CFI of .994, an RMSEA of .043, and an SRMR of .019, indicating that the factorial structure of the scale was comparable across groups. However, at the metric level, the model fit statistics did not meet the recommended criteria, as the SRMR exceeded .08, and the changes in fit statistics surpassed the thresholds outlined by Chen (2007). We allowed the factor loading of items to vary across groups one by one to improve the model fit to an acceptable level. The SEDS4 and SEDS5 factor loadings were unconstrained to achieve partial metric invariance (Model 2c). At the scalar level, we assessed scalar invariance, building upon Model 2c. However, the SRMR was .089. We then allowed items’ intercepts to vary across groups and eventually achieved partial scalar invariance with the intercepts of SEDS3 and SEDS5 unconstrained (Model 3c).
Invariance Testing of the SEDS-Brief Across Sexually and Gender Diverse (SGD) Groups.
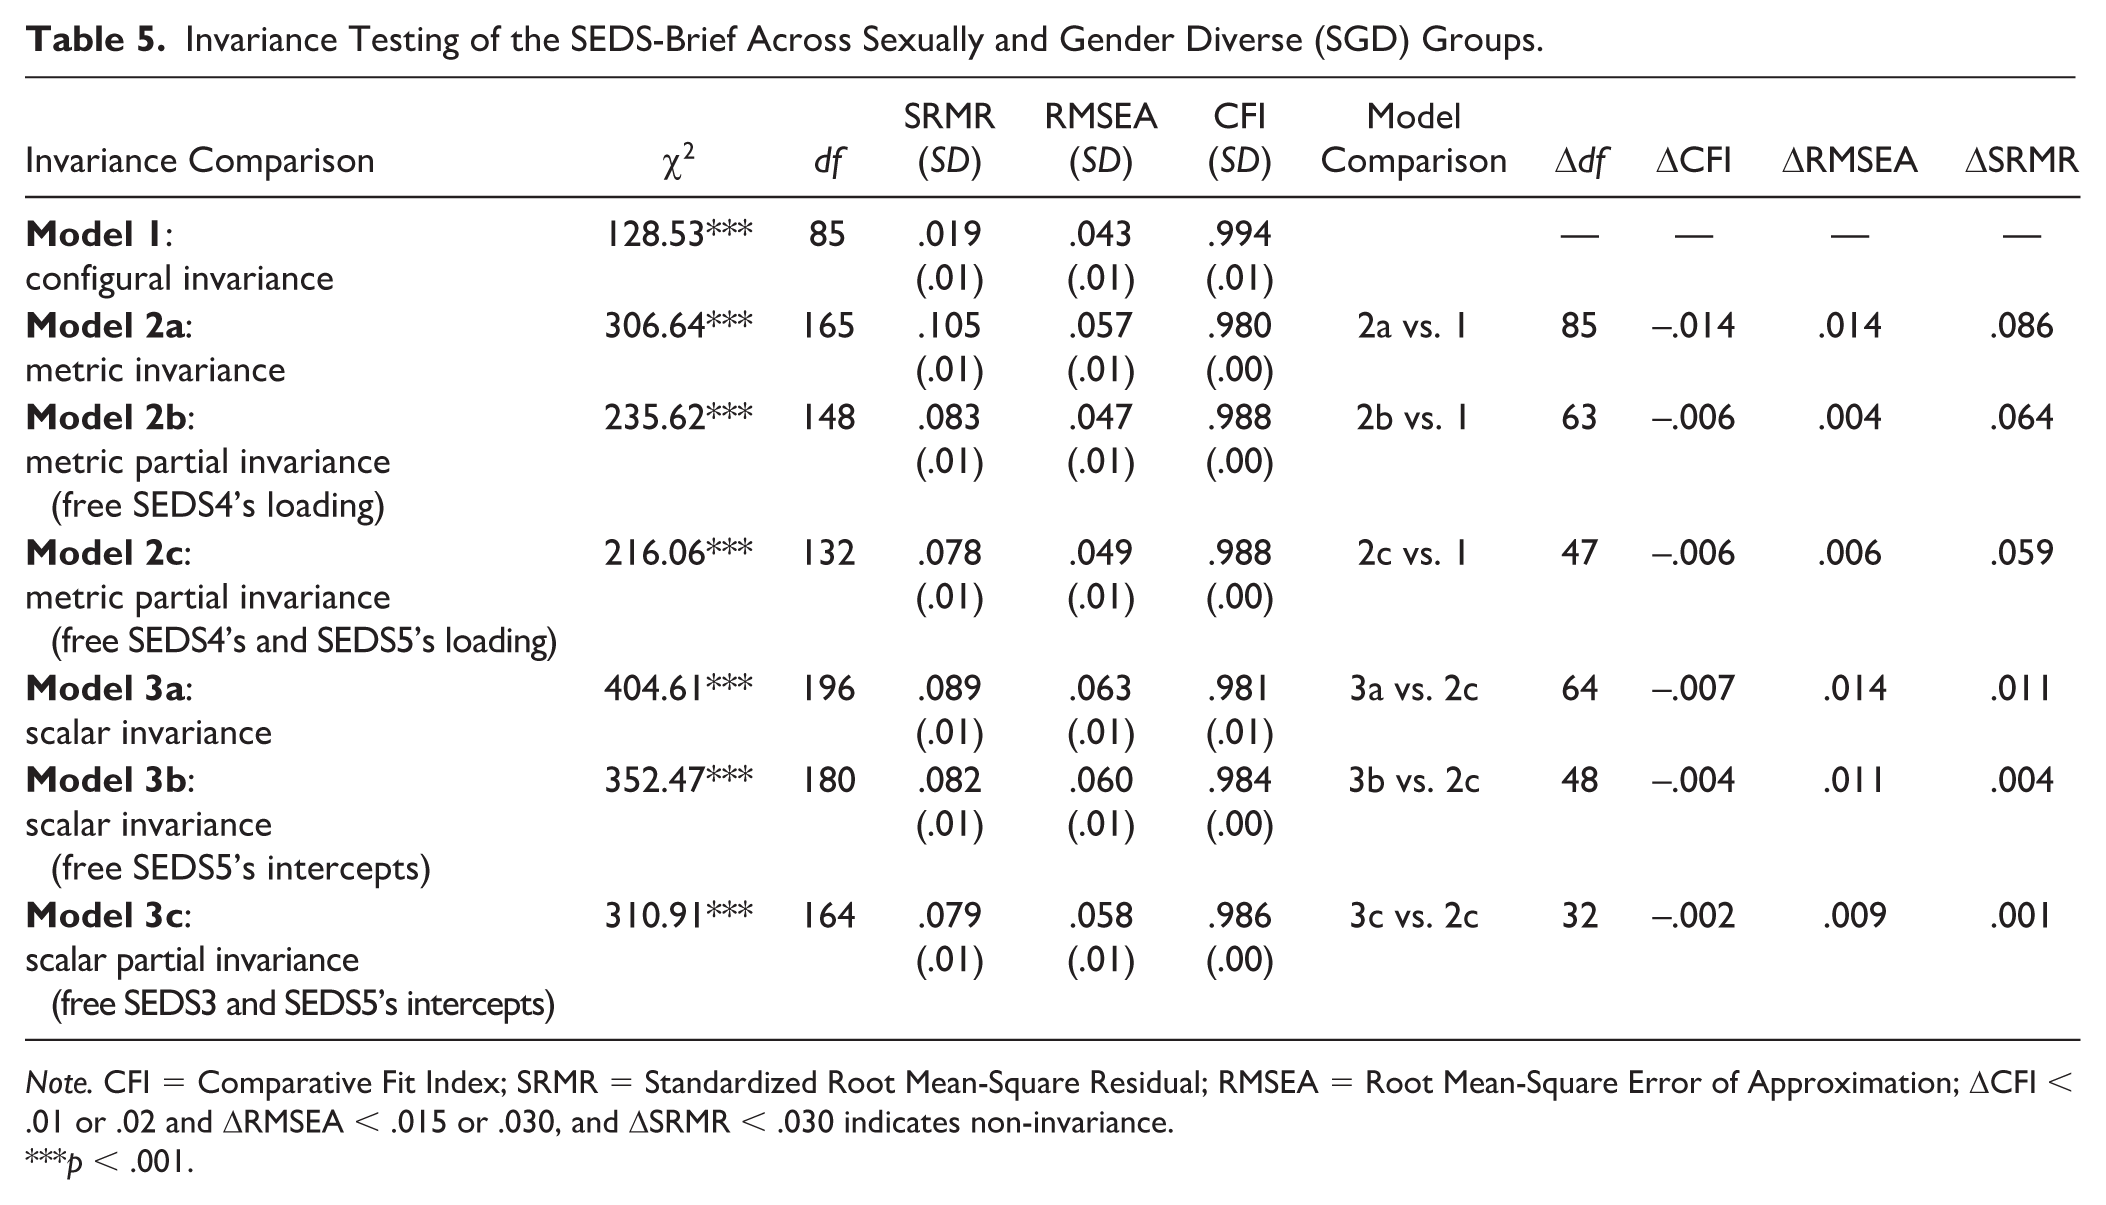
Note. CFI = Comparative Fit Index; SRMR = Standardized Root Mean-Square Residual; RMSEA = Root Mean-Square Error of Approximation; ΔCFI < .01 or .02 and ΔRMSEA < .015 or .030, and ΔSRMR < .030 indicates non-invariance.
p < .001.
SEDS-Brief Validity
Table 6 presents the standardized regression coefficients of the SEDS-Brief latent scores concerning outcomes across each SGD group. The multigroup model exhibited a good fit, with CFI = 0.982, RMSEA = .029 [.028, .029], and SRMR = .016. The SEDS-Brief latent scores showed a negative association with school connectedness (b = -.20, -.37) and life satisfaction b = -.25, -.55) in all groups, which supports the validity of the scale within each SGD group. The model comparison result indicated no differential validity. The model fit of the unconstrained model is CFI of .983, an RMSEA of .029, and an SRMR of .018 and the model fit of the constrained model is CFI of .985, an RMSEA of .036, and an SRMR of .020.
The SEDS-Brief Latent Scores’ Predicting School Connectedness and Life Satisfaction Among Sexually and Gender Diverse (SGD) Groups.
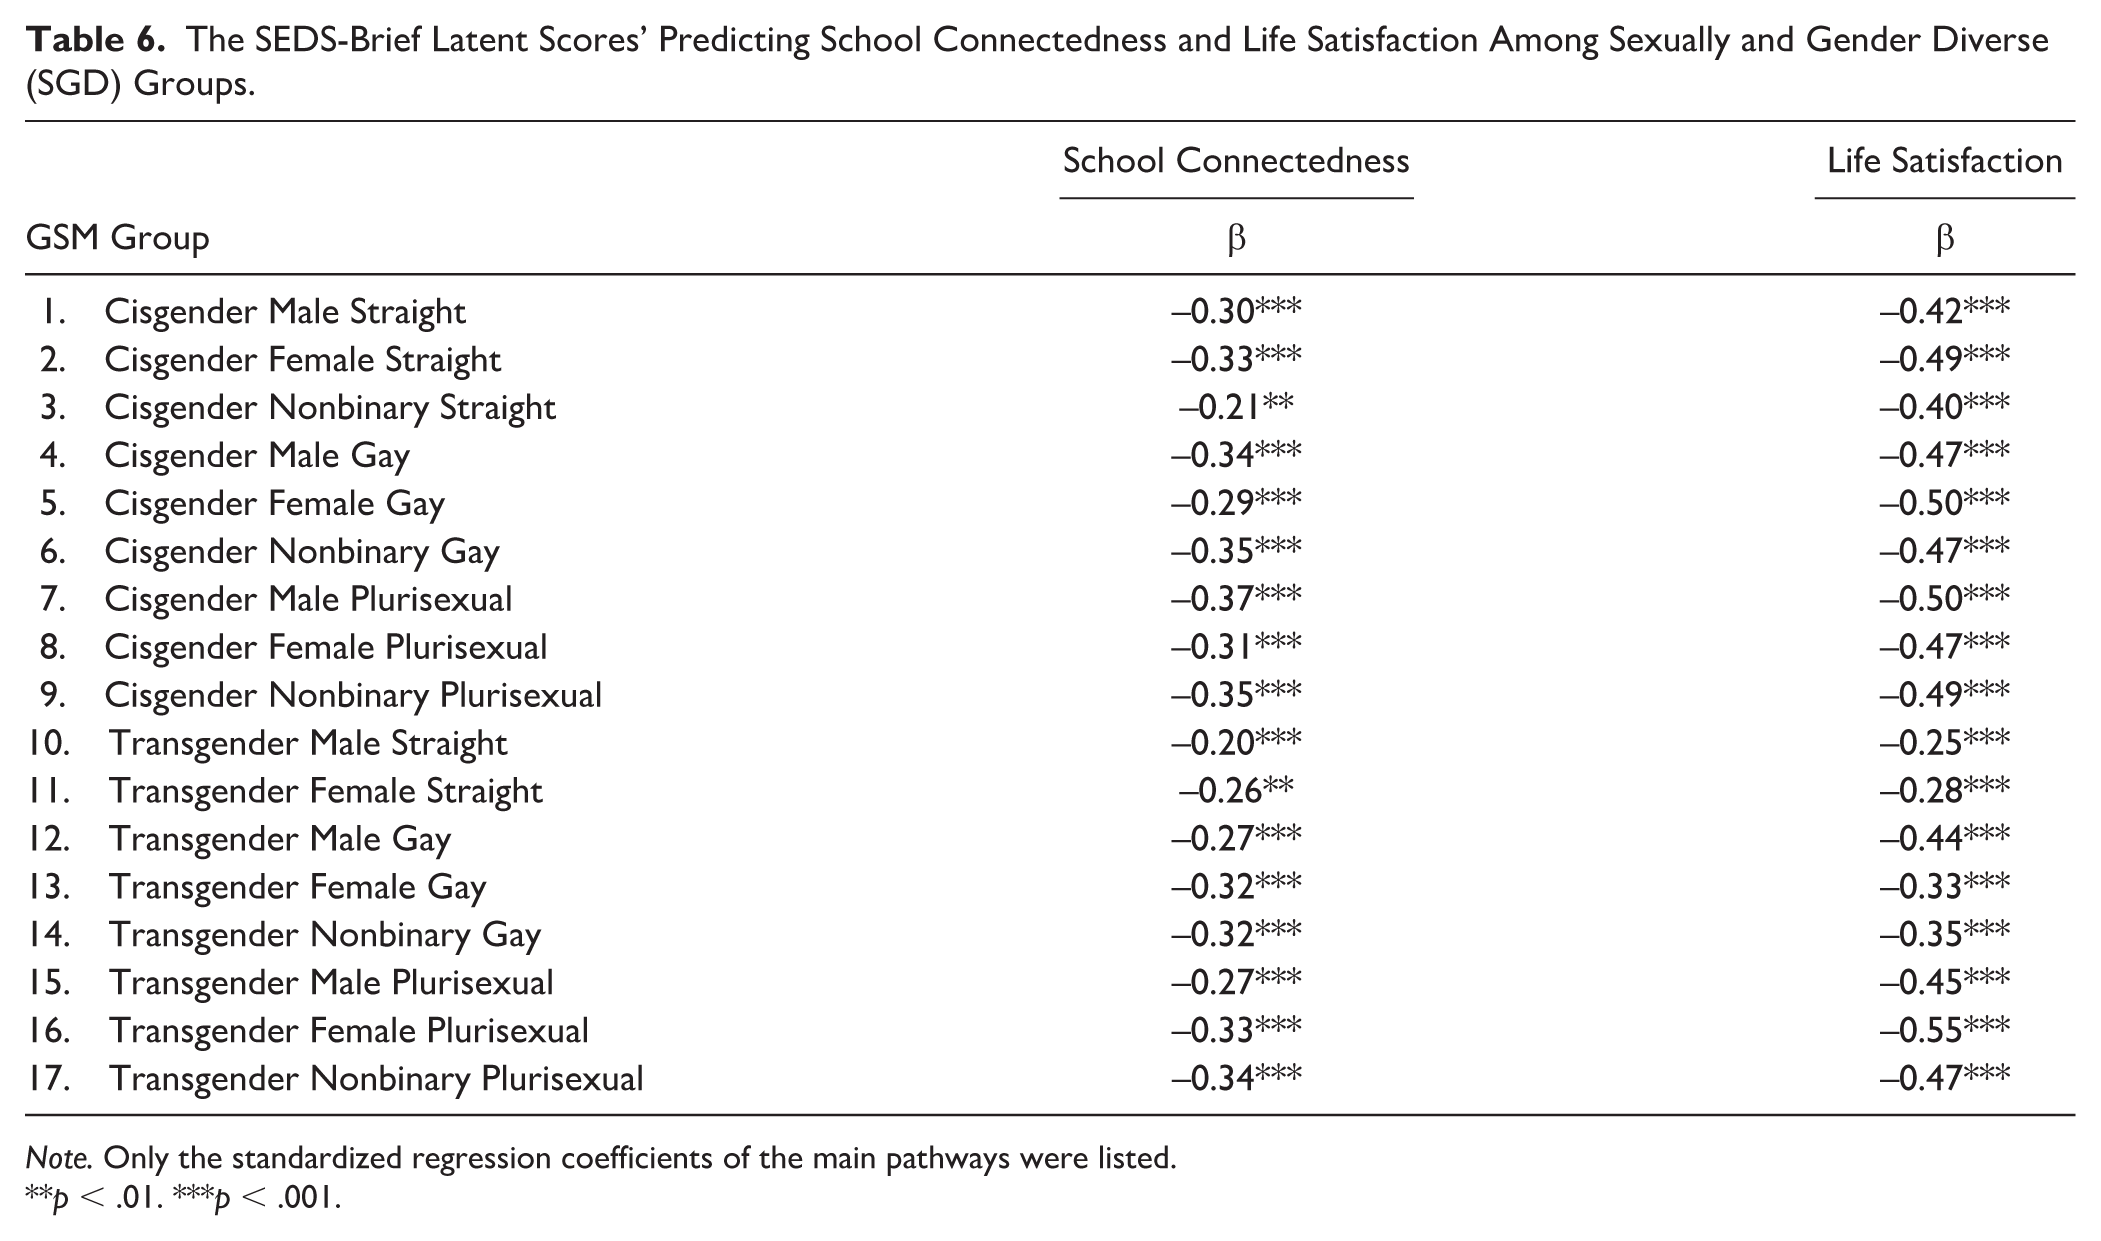
Note. Only the standardized regression coefficients of the main pathways were listed.
p < .01. ***p < .001.
Discussion
With a large statewide dataset comprising adolescents representing various races, ethnicities, socioeconomic backgrounds, and grade levels, different analytical methods were employed to evaluate the evidence for interpreting the SEDS-Brief scores across different SGD groups. The results showed that the SEDS-Brief effectively functioned as a unidimensional model and exhibited strong internal reliability within each SGD group, with each item meaningfully contributing to the overall latent factor. Although some items’ factor loadings and intercepts varied across groups, partial scalar invariance was achieved. In addition, the SEDS-Brief was significantly associated with life satisfaction and school connectedness, providing evidence of validity within each SGD group. Our findings offer the SEDS-Brief with strong psychometric evidence as a screening tool for assessing distress symptoms across different SGD groups and provide valuable guidance for score interpretations and scale refinement. The SEDS-Brief is among the few screening tools designed to assess adolescent distress, with robust and comprehensive psychometric evidence supporting its score interpretations among SGD adolescents.
Factor Structure and Reliability
The confirmatory factor analyses indicated that the SEDS-Brief was well-represented by a unidimensional factor structure across all SGD groups, showing strong to acceptable model fits. Although some groups demonstrated significant chi-square tests, chi-square tests are sensitive to sample sizes, and other fit statistics were satisfactory. Omega and alpha coefficients were higher than .85 in all groups, indicating high internal consistency. The findings align with previous psychometric studies on the 10-item and 5-item versions of the SEDS-S (Dowdy et al., 2018, 2023). The consistency of the factor structure supports the interpretation of the SEDS-Brief scores following a one-factor model across SGD groups.
Item Functioning
The IRT results indicated that all items in the SEDS-Brief effectively differentiated between adolescents experiencing varying levels of distress, with SEDS4 (It was hard for me to cope, and I thought I would panic) and SEDS2 (I felt sad and down.) emerging as the most informative indicators across SGD groups. Both items consistently had discrimination parameters above three across all groups, suggesting high sensitivity in distinguishing adolescents with different levels of distress. Meanwhile, SEDS3 (I was easily irritated) exhibited considerable variability in discrimination (1.96–3.95) across groups, suggesting potential differences in how SGD students interpreted or responded to this item. Threshold parameters further revealed distinctive response patterns across SGD groups, suggesting differences in how distress manifested and was endorsed. While all items covered a wide range of distress, some SGD groups required higher distress levels to endorse these items than others. Specifically, Cisgender Male Straight, Cisgender Nonbinary Straight, and Transgender Male Straight groups had generally positive threshold values, meaning that these groups were less likely to endorse distress until reaching higher severity levels. In contrast, Transgender Gay and Plurisexual groups reported more intense distress at lower latent distress levels. Among all items, SEDS3 consistently had lower threshold values across all groups, indicating it was endorsed at lower levels of distress than other items. These results suggest potential differential item functioning across groups, indicating that certain items may not measure distress equivalently across identities.
Measurement Invariance
Complementing the IRT analyses, measurement invariance testing further confirmed that certain items functioned differently across SGD groups. Although SEDS4 and SEDS5 demonstrated strong discrimination parameters, the results of relaxing these two items’ factor loadings to achieve partial metric invariance implied that these items were interpreted differently across SGD subgroups. Individuals from different SGD identities may have varied in their conceptualizations of distress, which could affect how they interpreted and responded to these items. Furthermore, threshold parameter variations across groups in the IRT analysis echoed findings from partial scalar invariance. SEDS3 and SEDS5 were unconstrained to achieve scalar invariance, which indicated systematic differences in baseline distress reporting for SEDS3 and SEDS5. These results suggest that some SGD groups endorsed these two items (I was easily irritated; It was hard for me to get excited about anything) at lower or higher levels than others, even when experiencing similar underlying distress levels. That said, despite these item-level biases, the results of invariance testing indicated that latent means derived from the SEDS-Brief were generally comparable across SGD groups, supporting the overall validity of the measure for use in students with different SGD identities. However, SEDS3, SEDS4, and SEDS5 items can be refined in further scale development to reduce item biases across SGD groups.
These findings are consistent with theoretical expectations based on the resilience framework and minority stress theory (Ching et al., 2024; Meyer et al., 2015). The minority stress theory suggests that SGD individuals experience unique stressors, which may shape how they perceive and report distress. Meanwhile, the resilience framework posits that SGD individuals develop adaptive coping strategies, which may alter how distress is cognitively appraised and expressed. The results underscored the importance of validating school-based mental health measures among SGD adolescents. They indicated that the current form of the SEDS-Brief is a psychometrically sound instrument to measure distress across SGD student populations.
Validity
Beyond the empirical support for measurement and item characteristics among SGD students, the scores derived from the SEDS-Brief also presented satisfactory validity evidence in support of score inferences, as shown by their robust association with life satisfaction and school connectedness within each group. The strength of the associations between the latent factor and life satisfaction and school connectedness was similar across groups based on the model comparison results.
Research and Practical Implications
The current study supports the use of the SEDS-Brief for school-based mental health screening among students with SGD identities. Evidence of partial scalar invariance indicates that scores on the SEDS-Brief can be interpreted meaningfully across different SGD groups, allowing for the early identification of students at risk for emotional distress. Although some variations in item functioning were noted, the overall scale does not demonstrate systematic biases against any particular SGD group. However, given the differences in how distress is expressed across SGD identities, school mental health professionals should be trained in interpreting scores within the context of SGD students’ lived experiences. In addition, mental health assessments should be selected based on their empirical evidence of effectiveness among SGD populations, and should be used in conjunction with other sources of data to inform additional assessment and intervention needs. For research usage, the SEDS-Brief enables researchers to compare distress levels and their relations with other variables across SGD identities. This study highlights important directions for further research focused on the psychometric evaluation of the SEDS-Brief. SGD adolescents seem to endorse distress at different thresholds, likely influenced by unique minority stressors, adaptive coping mechanisms, and resilience factors (Meyer, 2015). This observation suggests that current screening distress measures may not fully capture the complexities of mental health experiences in SGD youth, which is consistent with the overall goals of screening as opposed to more diagnostic assessment. Qualitative findings from cognitive interviews could complement the quantitative results by exploring how respondents with varying SGD identities interpret and respond to the items, revealing potential sources of item bias and conceptual differences in the experience and expression of distress. Refining these items to account for differences in response processes across SGD groups can enhance the fairness and cultural responsiveness of the SEDS-Brief in assessing distress among SGD adolescents.
Study Strengths and Limitations
Research suggests that interpretations of mental health screeners may differ among adolescents with various SGD identities (Bryant et al., 2024; Burton et al., 2014; Sheare et al., 2016). However, limited research exists on the effectiveness of existing school-based mental health screeners for SGD adolescents. As a result, little is known about the psychometric properties of instruments among this population and the interpretation of screening results. Our findings support the appropriateness of using the SEDS-Brief to identify emotional distress in adolescents with intersecting SGD identities for screening purposes with comprehensive psychometric evidence at the scale and item level. The results also have significant implications for refining the SEDS-Brief, with particular efforts focused on items SEDS3, SEDS4, and SEDS5.
Despite its strengths, several limitations of the study warrant attention. First, we did not examine all potential SGD groups. For example, due to insufficient sample sizes, the Transgender Nonbinary Gay group was excluded from the analyses. The approach we used to inquire about adolescents’ sexual and gender identities may not fully capture the complexity and fluidity of their experience. Second, the unbalanced sample sizes across groups may have contributed to the differences observed in our results. Although we employed various strategies to address this concern, as recommended in contemporary statistical practices (e.g., Yoon & Lai, 2018), some SGD groups had relatively smaller sample sizes, making it challenging to conduct additional analyses, such as differential item functioning using IRT approaches. Third, existing research has utilized various methods to categorize SGD groups (Bryant et al., 2024; McDanal et al., 2023). We considered intersecting gender and sexual orientation identities, allowing for more nuanced groupings than most previous studies (Bryant et al., 2024; McDanal et al., 2023). However, it is essential to recognize that different grouping approaches may affect study findings. Finally, we used various analytical methods and synthesized their results to enhance our understanding of applying and interpreting the scale from different but complementary perspectives. We acknowledge that different analytical approaches rest on distinct assumptions and serve various purposes. Thus, we explicitly detailed how these varied analyses contributed complementary information for scale validation.
Conclusion
Despite the growing recognition of SGD adolescents’ mental health needs, few mental health screeners have undergone rigorous, large-scale validation for this population. Using a large and diverse statewide dataset, the present study yielded evidence for score interpretations of the SEDS-Brief, an open-access instrument designed to assess emotional distress among adolescents. Results supported a unidimensional structure, strong internal consistency, and solid concurrent and divergent validity. The SEDS-Brief exhibited partial scalar invariance, allowing for meaningful score interpretation across SGD groups. However, certain items (SEDS3, SEDS4, and SEDS5) functioned differently across SGD identities, highlighting the need for further refinements in scale development to enhance measurement fairness. These results emphasize the importance of employing mental health assessments that are psychometrically validated among SGD adolescents and interpreting distress scores considering their lived experiences. This study provides a comprehensive validation of the SEDS-Brief, reinforcing its utility as a mental health screening tool for use in school settings for SGD adolescents. The findings contribute to ongoing efforts to develop equitable and effective mental health assessments in school settings.
Footnotes
Author Contribution
Declaration of Conflicting Interests
The authors declared no potential conflicts of interest with respect to the research, authorship, and/or publication of this article.
Funding
The authors received no financial support for the research, authorship, and/or publication of this article.
Ethics Approval
This study used publicly available data. The Human Subjects Committee at the authors’ university has confirmed that no ethical approval is required.
Consent to Participate
Passive consent was obtained from legal guardians of the participants. Student assent was requested and obtained prior to survey administration.
Consent for Publication
Not applicable.
Data Availability Statement
The dataset is publicly available upon request through WestEd.