
Abstract
The purpose of this research was to examine the psychometric properties of the Safety Behavior Assessment Form to create a short form (SBAF-SF) that is easier to use in both research and clinical settings. Three studies were conducted with three independent samples—two Turkish samples and an English-speaking sample. Confirmatory factor analysis (CFA) was used to determine the construct validity of the adapted SBAF-SF scale. In addition, direct and indirect relationships between anxiety sensitivity and safety-seeking behaviors were evaluated by network analysis. The results confirmed the construct validity of SBAF-SF in both cultures, and the scale was found to be a valid and reliable measurement tool for the assessment of safety-seeking behaviors in general samples. In addition, direct and indirect relationships between anxiety sensitivity and safety-seeking behaviors were examined by network analysis, which showed significant cultural differences between the USA and Turkey. The SBAF-SF is a valid and reliable assessment tool for evaluating safety-seeking behaviors and can be used cross-culturally.
Safety-seeking behaviors are defined as covert and overt actions that individuals use to prevent or minimize feared outcomes (Salkovskis et al., 1996). Essentially, they are behaviors that aim to reduce unpleasant or negative consequences (Salkovskis, 1991). Clark and Wells (1995) reported that safety-seeking behaviors consist of impression management and avoidance behaviors. Impression management is the effort to leave a good impression by monitoring and controlling one’s behaviors in front of others. Avoidance behaviors are defined as low level of self-disclosure and hiding oneself in social situations (Plasencia et al., 2011). For example, a person with social anxiety avoiding eye contact, hiding to prevent others from seeing him or her shaking, rehearsing in his or her mind before having a conversation with someone are safety-seeking behaviors (Oren-Yagoda et al., 2024). Overall, although they may be expressed in different ways in each individual, the common goal of all these behaviors is to reduce negative emotions or consequences (Piccirillo et al., 2016).
While safety-seeking behaviors exhibited by individuals when faced with a high threat situation are generally considered adaptive for survival, safety-seeking behaviors in clinical anxiety are not always adaptive, especially if they maintain maladaptive and unrealistic threat beliefs (Craske et al., 2008). Although the use of safety-seeking behaviors provides short-term relief to an anxious individual, theoretical models report that their long-term use is problematic (Rauch & Foa, 2006). Conceptually, a distinction has been made in the literature between preventive safety-seeking behaviors and restorative safety-seeking behaviors. Preventive safety-seeking behaviors try to prevent the occurrence of or exposure to a fearful situation whereas restorative safety-seeking behaviors try to restore perceived safety or comfort after exposure to a fearful situation. This means that in the case of preventive safety-seeking behaviors, they do not allow full contact with the threatening situation (creating avoidance and worse anxiety in the future), and the situation is the opposite in restorative safety-seeking behaviors (Helbig-Lang & Petermann, 2010; Telch & Zaizar, 2020).
Safety-seeking behaviors are considered one of the primary mechanisms of maintaining anxiety disorders (Tao et al., 2022; Telch & Zaizar, 2020). Consequently, treatments for anxiety disorders have started focusing on reducing safety-seeking behaviors, and studies have shown that reducing safety-seeking behaviors positively affects treatment outcomes across anxiety disorders (Cougle et al., 2020; Farrell et al., 2019; Goodson et al., 2018; Goodson & Haeffel, 2022; Gorman et al., 2023; Korte & Schmidt, 2020). As a result, it is crucial to identify and assess safety-seeking behaviors to understand and treat anxiety disorders (Sharpe et al., 2022). For clinicians, the assessment of safety-seeking behaviors facilitates case formulation and treatment planning, and for anxiety researchers, it serves as a tool to measure important clinical outcomes, regulators or mediators of treatment response (Foulser et al., 2024). However, this work is not possible without reliable and valid assessments that can be used in the evaluation of safety-seeking behaviors (Chapman & Rapee, 2020).
There are several measures that have been developed to measure safety behaviors The Subtle Avoidance Frequency Examination (SAFE) (Cuming et al., 2009), Social Phobia Safety Behavior Scale (SPSBS) (Burato et al., 2009), Texas Safety Maneuver Scale (TSMS) (Kamphuis & Telch, 1998), Storm Related Safety Behavior Scale (SRSBS) (Krause et al., 2018), Posttraumatic Safety-seeking behaviors Inventory (Foulser et al., 2024), Posttraumatic Safety Behavior Questionnaire (PSBQ) (Blakey et al., 2020), Worry Behavior Inventory for generalized anxiety (Mahoney et al., 2016), and Safety-seeking behaviors Scale for eating disorders (Waller & Kyriacou Marcoulide, 2013). In this study, we focused on the Safety Behaviour Assessment Form (SBAF) developed by Goodson et al. (2016). We chose this scale because it is one of the only measures of safety behavior that assesses a wide range of behaviors associated with a wide range of anxiety-related disorders including PTSD (previous scales focused on social anxiety and/or a limited number of safety behaviors). Furthermore, the SBAF scale is the only scale to differentiate preventive and restorative safety-seeking behaviors, and it has been validated in both clinical and non-clinical populations (Goodson et al., 2016).
The SBAF is 41 items and covers a range of safety-seeking behaviors including vigilance, generalized anxiety, social anxiety, panic, and health anxiety. The published version of the 41-item scale, developed largely through research with military samples, includes three dimensions: vigilance behaviors, health-related behaviors and escape and avoidance in social situations. In addition, there is an unpublished form for clinical use with the abovementioned five sub-dimensions in which the same 41 items are listed according to each dimension (i.e., the first scale consists of vigilance items, the second scale consists of generalized anxiety disorder items, the third scale consists of social anxiety items, etc.). Although the scale is reported to be suitable for a transdiagnostic sample, its use in both research and clinical settings is limited due to its length (Foulser et al., 2024). To address this issue, it was aimed to evaluate the psychometric properties of the SBAF to create full measure 1 in a Turkish sample and to its short form and subsequently examine its intercultural validity and reliability. A short form of the SBAF is needed for several reasons—(a) it is needed to decrease administration time to make research studies more feasible and cost-effective; (b) it may eliminate redundancy in measurement items; and (c) it provides a tool that can be clincial useful (e.g., weekly treatment monitoring).
Method
SBAF Turkish Translation
The translation process of the scale was carried out in accordance with the back-and-forth translation procedure. First, the scale was forward translated into Turkish independently by two field experts who have a good command of both Turkish and English. The two translated forms were compared, and the Turkish form of the questionnaire was finalized by considering the issue of reaching a consensus. The Turkish form was translated back into English by another expert who had never seen the original version of the scale and had a good command of both Turkish and English. The translated scale form and the original scale form were compared and the similarities and differences of the two forms were evaluated. In the evaluation, it was seen that the translated scale form and the original scale expressions were parallel (Hall et al., 2003).
Procedure
Three studies were conducted to create and validate a short form of the SBAF. The first evaluated the psychometric properties of the full scale SBAF and to create the short form of the scale. For this purpose, the first study was conducted in Turkey with a Turkish-speaking sample. After the creation of the short form, the validity and reliability of the form were evaluated and validated in two additional samples (a second Turkish sample and an English-speaking sample). Thus, the psychometric properties of the SBAF-SF were evaluated and validated in two different cultures. The flowchart of the study is shown in Figure 1.
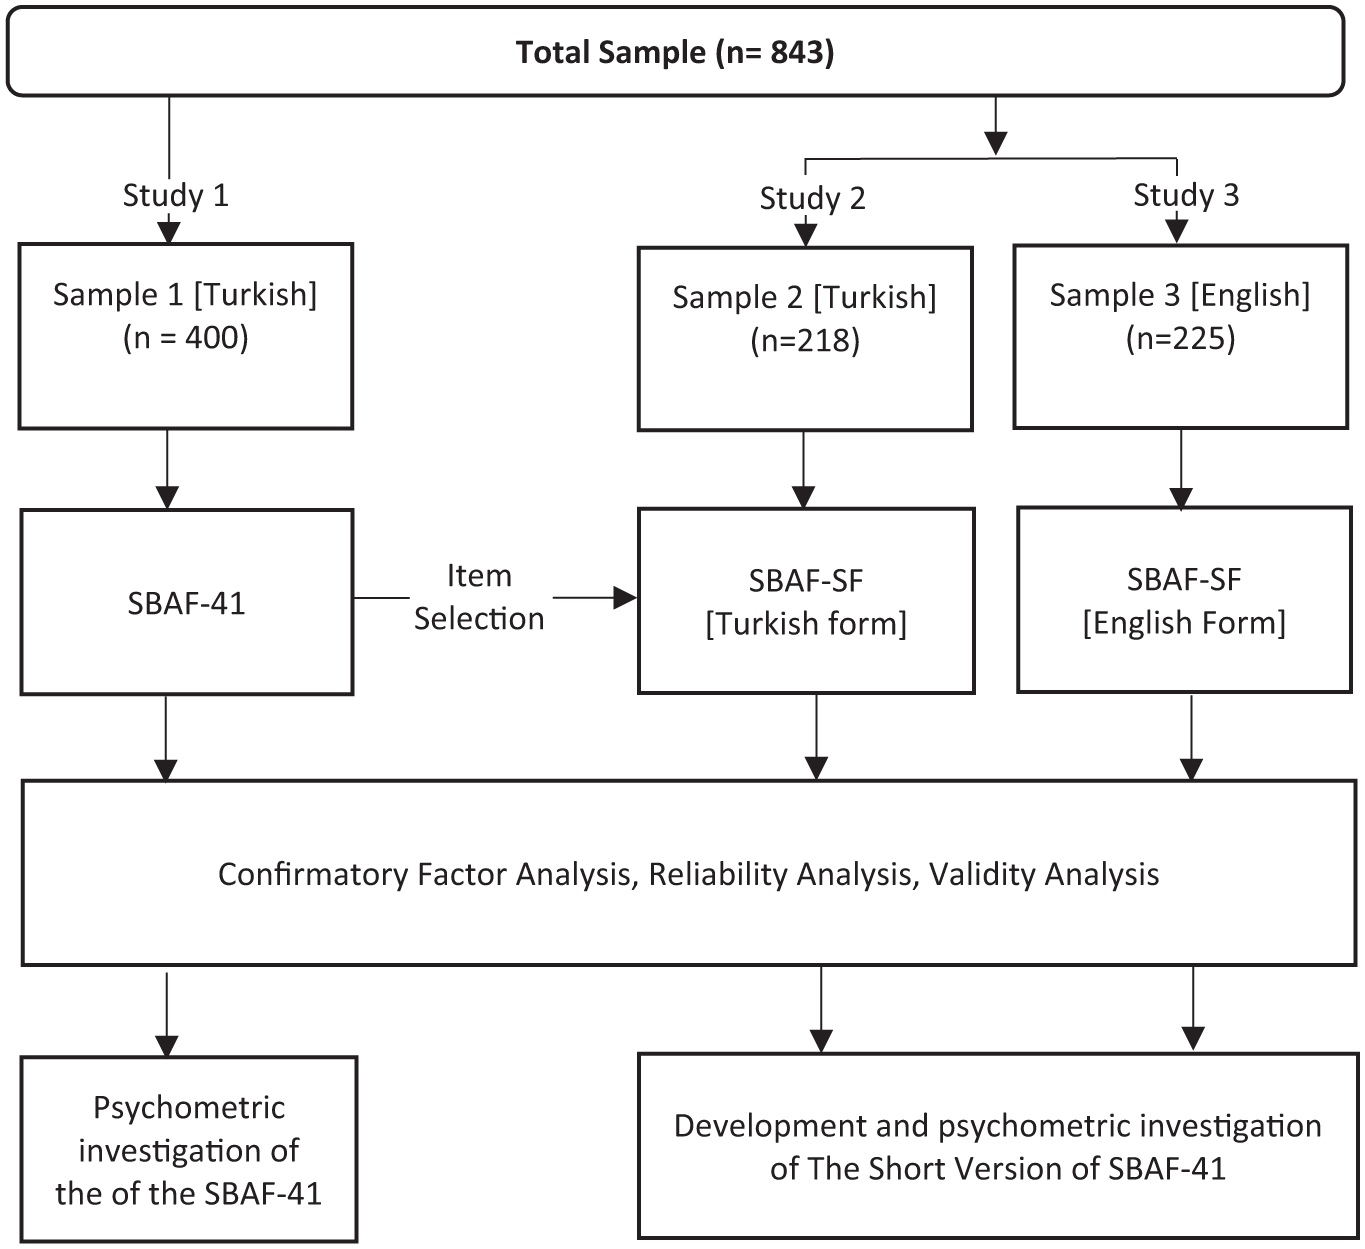
Flow Chart of the Study.
The measurement tools determined for data collection in Study 1 and Study 2 were transferred to the online environment via Google forms and data were collected online using snowball sampling method. Participation in the study was voluntary and participants were informed that they could leave the study at any time. In Study 3, participants were recruited via an online participant platform (Prolific; Palan & Schitter, 2018); the research procedures were fully consistent with APA ethical guidelines, and the study was approved by the Atatürk University’s Human Subjects Committee. Participants were paid an average of $13.00 per hour to complete the 5-minute questionnaire. In Turkey, no payment was made to participants in Study 1 and Study 2; all participants took part in the research voluntarily without any financial compensation.
In selecting the items to be included in the short form, both statistical analyses and expert evaluations were considered. The authors and the original scale developer reviewed the items to ensure theoretical and clinical relevance (Putnam & Rothbart, 2006). Exploratory Factor Analysis (EFA) was conducted using maximum likelihood (ML) estimation and Promax rotation. Items with item loadings ≥0.30 were accepted as components of a sub-dimension and at least three items had to load on a sub-dimension to be considered as a valid factor. Factor loadings, cross-loadings, item-total correlations, and contribution to internal consistency (Cronbach’s alpha and McDonald’s omega) were all considered in item selection. In this context, the items to be included in the scale were determined according to the following criteria (DeVellis, 2016; Kline, 2016):
With high mean values,
It has the highest item factor loading,
It has the lowest cross-loading,
The one that contributes the most to the internal consistency of the scale scores,
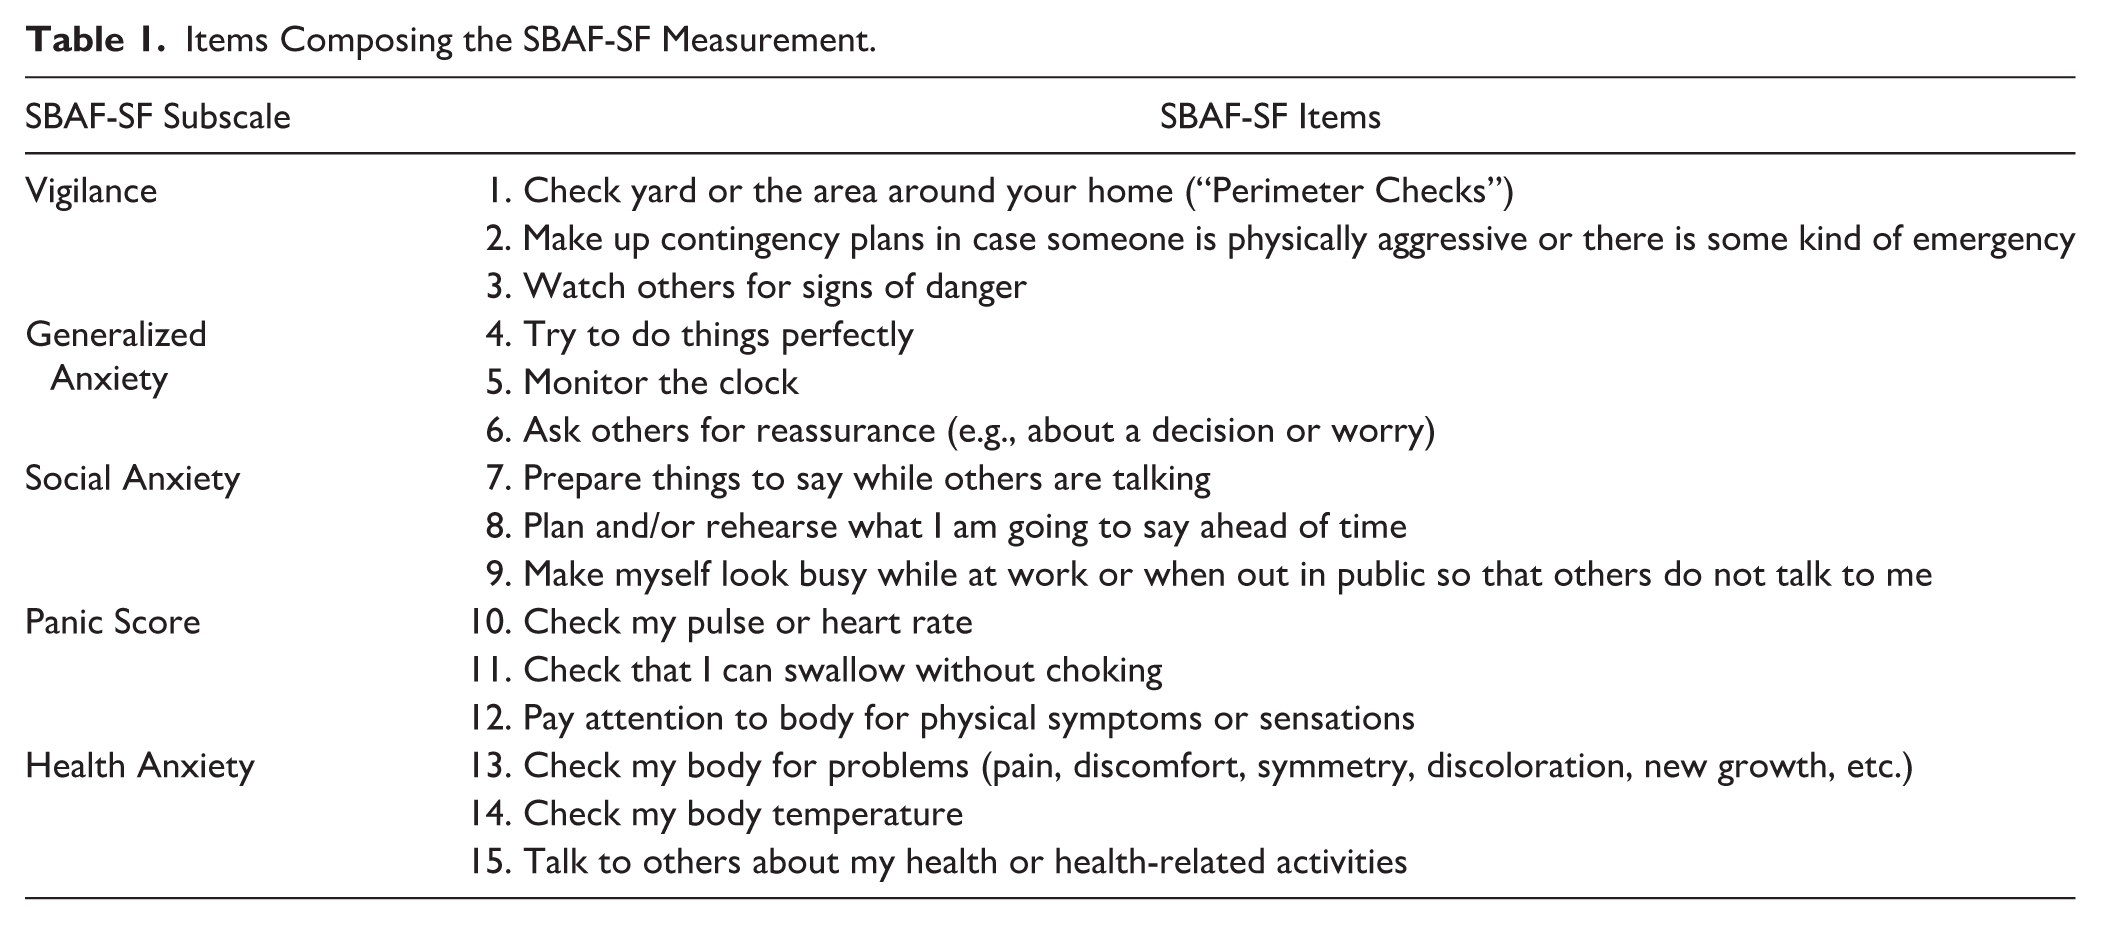
The items were retained in the scale. In addition to statistical analyses, the authors of the article and the scale developer also made evaluations and expressed their opinions in determining the items to be included in the short form. In obtaining the final scale form, the factor structure of the original SBAF scale was preserved, and it was ensured that at least three items were included in each factor. In line with the data obtained, the short form of the SBAF scale was created (Table 1).
Items Composing the SBAF-SF Measurement.
Study 1. Developing the SBAF Short Form
In Study 1, the aim was to evaluate the psychometric properties of the original Safety Behaviours Assessment Form (SBAF) and to validate a shorter version, the SBAF Short Form (SBAF-SF). The SBAF-SF was created by analyzing the items from the full version developed by Goodson et al. (2016) and selecting the most reliable and representative items to ensure adequate coverage of the construct while improving usability.
Participants
For Study 1, data were collected from a total of 400 people, 322 women (80.5%) and 78 men (19.5%) between the ages of 18–65 (Mage = 23.82, SD = 6.65).
Data Collection Tools
Statistical Analysis
In Study 1, EFA was first conducted to determine the items to be included in the short form. EFA was conducted using maximum likelihood (ML) estimation method and Promax rotation. Promax rotation begins with a Varimax (orthogonal) rotation and then uses a kappa parameter to increase the strength of factor loadings. It reduces small loadings to clarify the factor structure and is generally faster than Varimax. Items with item loadings ≥0.30 were accepted as components of a sub-dimension, and at least three items had to load on a sub-dimension to be considered as a valid factor (DeVellis, 2016; Kline, 2016).
As a result of EFA, CFA was conducted to determine the construct validity for the candidate items that make up the SBAF-SF measurement tool. In CFA, goodness of fit was evaluated using chi-square (χ2) value, standardized root mean square residual (SRMR), comparative index fit (CFI), Tucker–Lewis index (TLI), and root mean square error approximation (RMSEA). Accordingly, an SRMR close to or below 0.08, an RMSEA close to or below 0.08, and a CFI and TLI close to or above 0.95 indicate acceptable fit (Hu & Bentler, 1999; Kline, 2016). Cronbach’s alpha (α) and McDonald’s omega (ω) values were examined for internal consistency, and values above .60 indicate high reliability (ω and α ≥ .60).
Results
Descriptive Statistics and Exploratory Factor Analysis for Study 1
EFA was conducted to determine the candidate items to be included in the scale. The results obtained are shown in Table 2.
Descriptive Statistics.
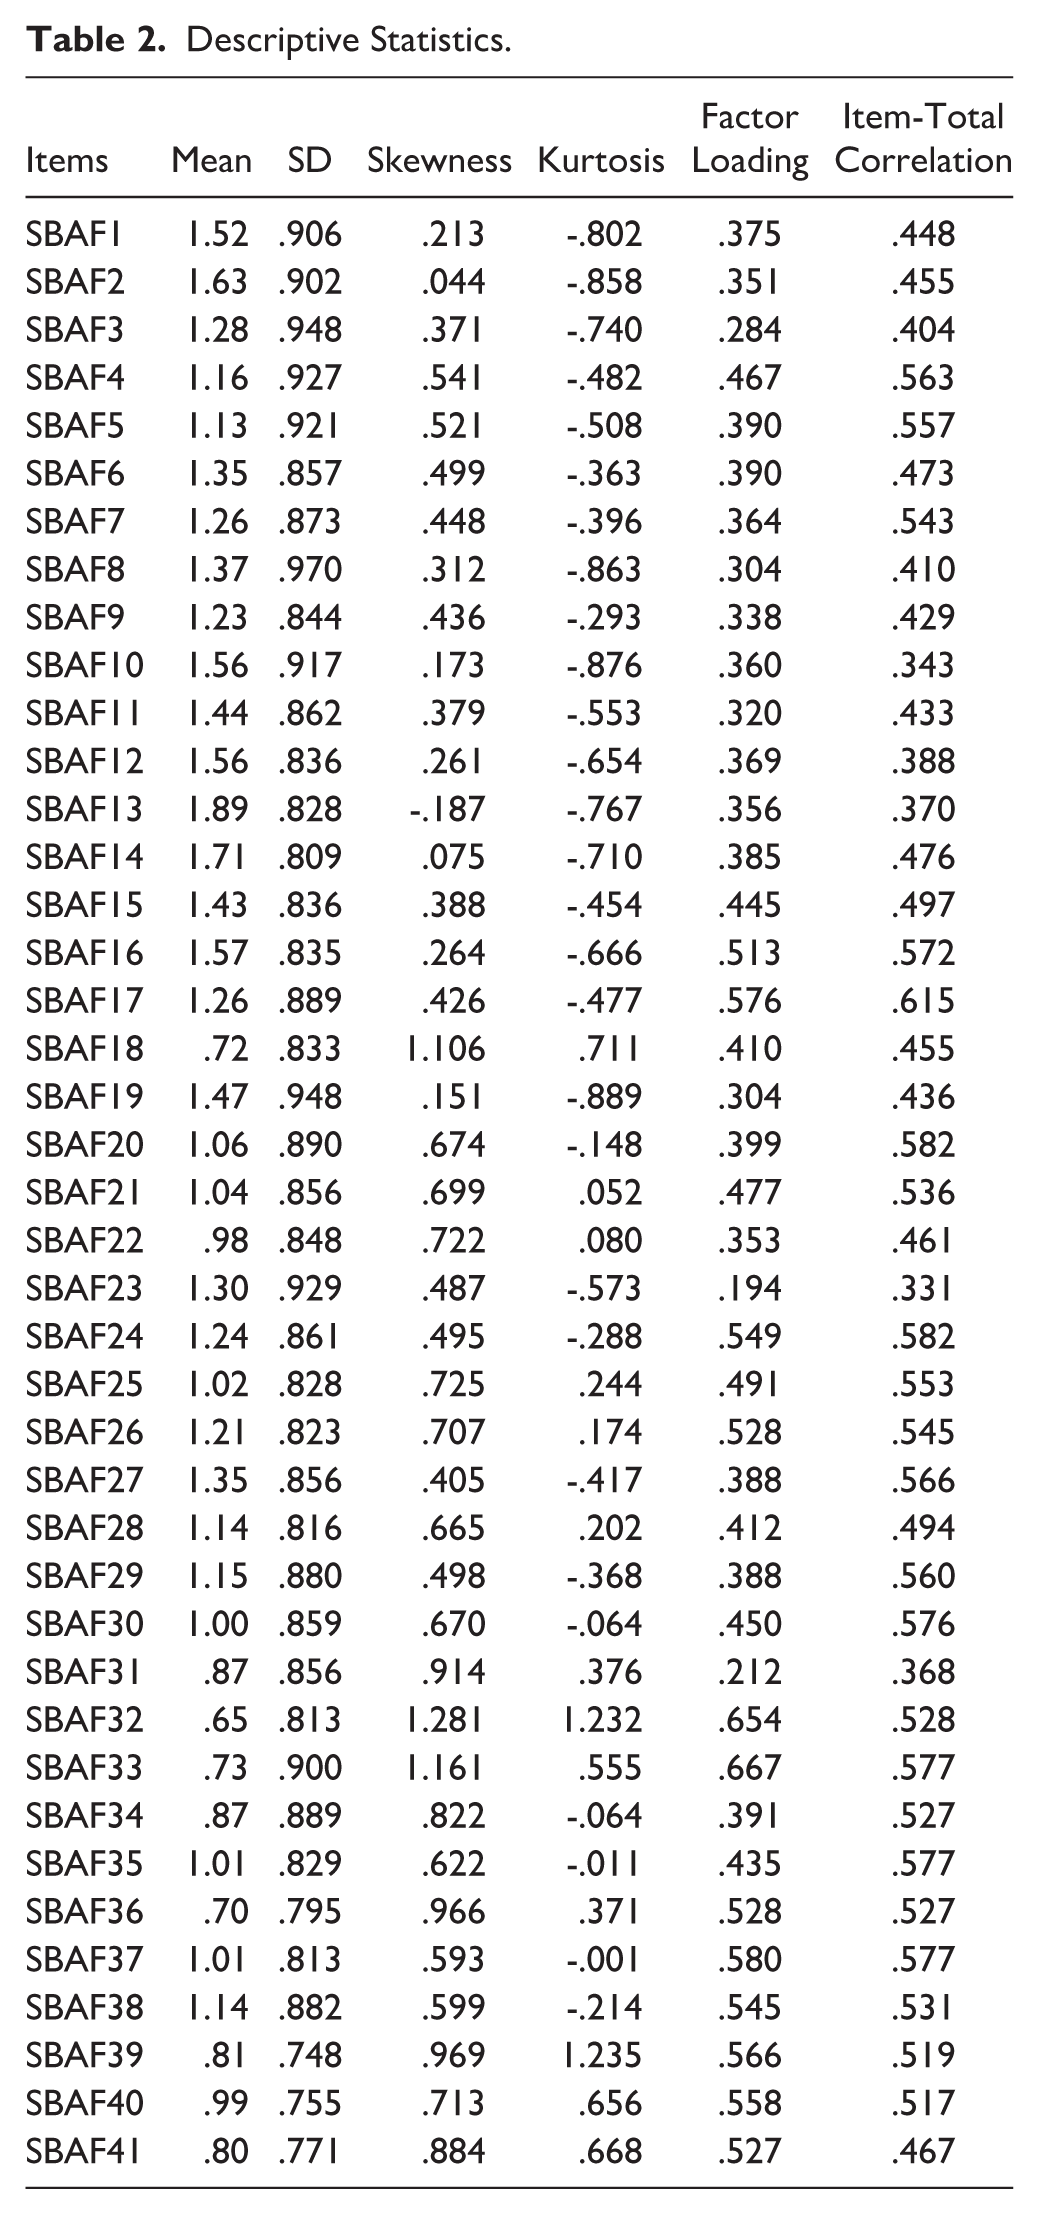
In the EFA process, Item 3, Item 23, and Item 31 were identified as having an item eigenvalue below .30. The analyses were repeated for each item extraction and the values were checked. However, in item extraction, it was considered that there should be at least three items in each sub-dimension. After the items with low factor loadings were removed from the scale form, the items with the highest item loadings among the remaining items in each sub-dimension were identified and cross-loading and item-total correlation values were analyzed. A short form was created with the items determined to be included in the form, and CFA analyses were conducted to determine the construct validity.
Confirmatory Factor Analysis
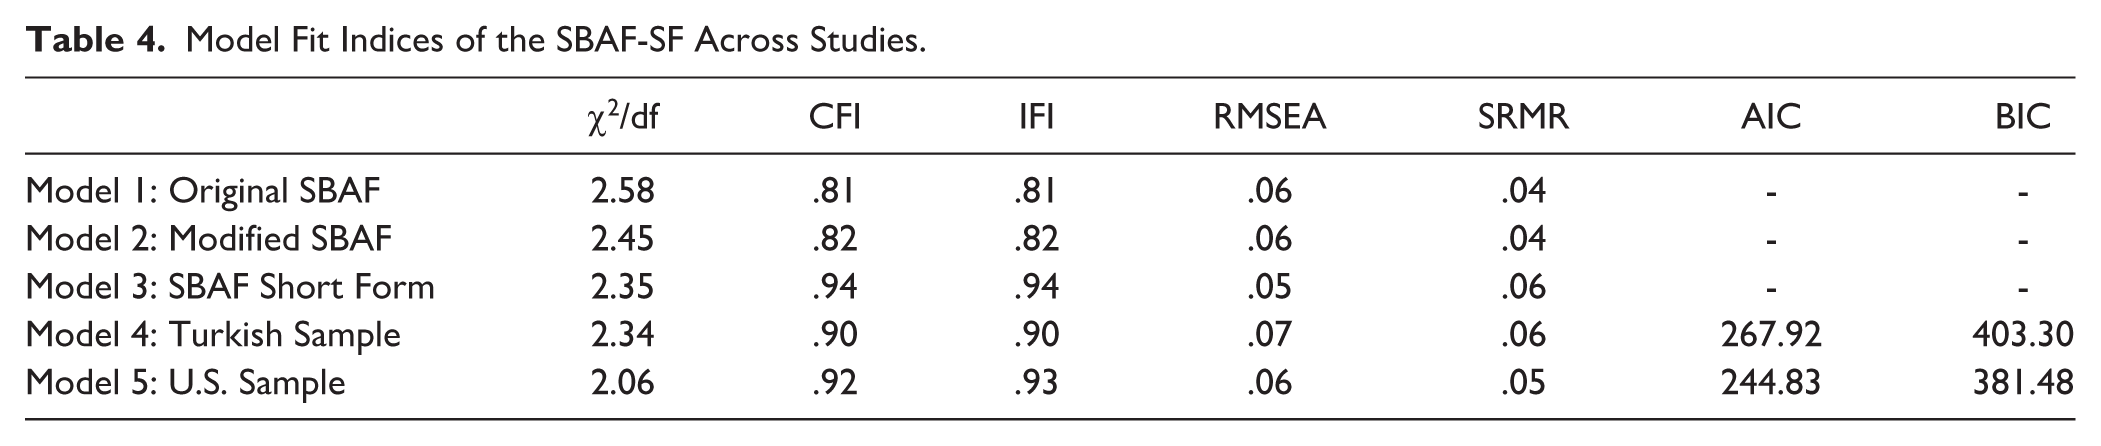
A CFA was conducted to determine the construct validity of the original SBAF scale consisting of 41 items (Model 1: Original SBAF). Results showed the scale did not have an acceptable fit (Table 4). In this direction, modification suggestions were examined to improve the model fit of the scale and appropriate modifications were applied in the model. After three modifications (correlated error terms between Item 16 and Item 17, Item 17 and Item 24, and Item 33 and Item 32) were applied to the model, the fit index values were re-examined (Model 2: Modified SBAF), and it was seen that the model did not have an acceptable fit (Table 4). The obtained result showed that the model structure of the safety-seeking behaviors measurement consisting of 41 items could not be validated in a Turkish sample.
To provide a valid and reliable scale for both clinical and research-based use, a short form of the scale was created to be used more easily with the verification of the psychometric structure of the scale. When the construct validity of the short form, which was created with the items selected in accordance with the criteria specified for the development of the short form in the long form (Model 3: SBAF Short Form; Figure 2), it was seen that the item loadings of the scale were high and sufficient, and the scale had an acceptable fit (Table 4).
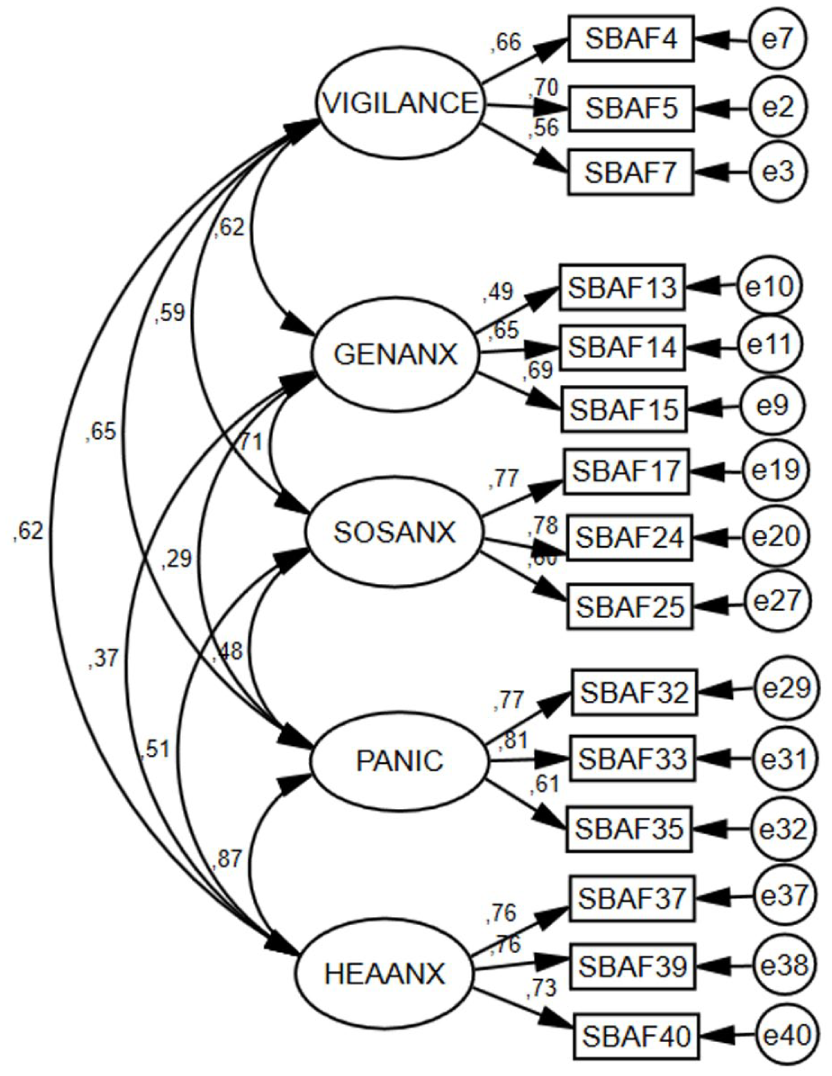
Structural Model for the SBAF Short Form.
Assessment of Reliability
Cronbach alpha internal consistency coefficient was analyzed to determine the reliability of the SBAF-SF scale. In this direction, when the Cronbach alpha internal consistency coefficients of the scale were examined, it was seen that the sub-dimensions of vigilance .68, Generalized Anxiety .64, Social Anxiety .76, panic .79, Health Anxiety .79 and the overall value of the scale was .88. When the reliability values of the scale were analyzed, it was seen that the scale had sufficient reliability values (α ≥ .60).
Study 2 & Study 3. Validation of the SBAF-SF
The purpose of Studies 2 and 3 were to evaluate the validity and reliability of the short form SBAF-SF measurement tool in two additional samples. For this purpose, in Study 2, data were collected from a Turkish-speaking sample in Turkey, and in Study 3, data were collected from an English-speaking sample from the USA.
Participants
For Study 2, data were collected from a total of 218 people, 156 women (71.6%) and 62 men (28.4%) aged between 18 and 65 [Mage = 22.81, SD = 7.20]. In Study 3, data were collected from a total of 225 people, 104 men (46.2%), 116 women (51.6%), 4 transgender men (1.8%), 1 gender variant (0.4%) aged between 18 and 79 [Mage = 38.36, SD = 12.96].
Data Collection Tools
The same measurement tools were used in Study 2 and Study 3.
Statistical Analysis
First, the psychometric structure of the SBAF-SF was examined using CFA. The level of invariance of the SBAF-SF across gender and country was assessed through measurement invariance analysis. Measurement invariance refers to the evaluation of the psychometric equivalence of a construct across groups or over time (Akbari et al., 2023). Network analysis was conducted to provide a more comprehensive understanding of the interconnections between safety-seeking behaviors and anxiety sensitivity dimensions beyond traditional correlation analyses. This approach allows for the identification of the most central and influential symptoms within each culture, helping to highlight potential intervention targets and cultural differences in the structure of these relationships. All statistical analyses were conducted using R version 4.4.2. The R code used in the analyses can be accessed at https://osf.io/kbemj/overview?view_only=8e41e6ba5dd844d0bdac4c993a27cba9
Construct Validity and Measurement Invariance
CFA was performed to determine the construct validity of the scale. Model fit was evaluated with chi-square (χ2) value, CFI, IFI, RMSEA, and SRMR values. In examining the model fit, 0.08 ≤ RMSEA, SRMR, and .90 ≤ CFI, IFI criteria were taken as reference. In addition, measurement invariance of the five-factor model of the SBAF-SF across participants’ countries and sexes was examined following the guidelines proposed by Jöreskog (2005). Measurement invariance was evaluated through a series of multi-group confirmatory factor analyses (MG-CFA), in which each model represented a five-factor CFA. To this end, additional CFAs were conducted to evaluate four increasingly restrictive models: configural invariance (assessing whether item factor loadings and the number of factors are consistent across groups), metric invariance (evaluating the invariance of factor loadings), scalar invariance (determining whether item intercepts are invariant), and strict invariance (analyzing the invariance of item error variances). Each successive model is more restrictive because it imposes stricter equality constraints to test deeper levels of equivalence. Configural invariance assesses whether the basic structure is maintained across different groups, thereby supporting fundamental group comparisons. Metric invariance ensures that items relate similarly to the structure, allowing correlations to be compared across instruments. Scalar invariance enables the comparison of latent mean scores across groups, while strict invariance guarantees that observed scores can be compared directly without differences in measurement error. To compare these models, CFI and RMSEA indices were evaluated across nested models. The most restrictive model was selected based on the criteria established by Chen (2007): the difference in RMSEA (ΔRMSEA) was less than .01, and the differences in CFI (ΔCFI) were greater than .01. The “lavaan” package in R was used for statistical analyses.
Assessment of Reliability and Divergent Validity
Cronbach’s alpha (α) reliability indices were used to evaluate the reliability of the scale. To test whether the five sub-dimensions of the SBAF-SF scale are independent from each other, the relationships between the sub-dimensions were determined by Pearson correlation. In addition, to determine the convergent validity of the scale, the correlation values between the scale and the ASI-3 were analyzed.
Network Analysis
Network analysis was used to further evaluate the direct and indirect relationships between anxiety sensitivity and safety-seeking behaviors. Network analysis was estimated using a mixed graphical model (MGM) and the network was adjusted using the EBIC adjustment parameter to simplify interpretation by preventing spurious correlations from being included in the network. In the network, each node represented a symptom, and red nodes represented the three highest node strengths. The edges represent the correlations of the symptoms; green indicates a positive correlation and red indicates a negative correlation. The thicker the edge of the network, the stronger the connection between two nodes (Zhu et al., 2022).
Centrality indices were calculated to determine the most central nodes in the network. Although there are many centrality indices including expected influence, proximity and degree centrality, the expected influence centrality index was used in this study since it is reported to give more appropriate results compared to other indices. Expected influence represents the sum of all positive and negative edge weights connected to a particular node in the network. In this sense, an increase in the expected influence value of a node indicates that the node has a more central and effective position in the network. The correlation stability coefficient (CS-coefficient) was calculated using the case drop bootstrapping procedure (Epskamp et al., 2018). For adequate stability, a CS-C value greater than 0.25 and preferably above 0.5 is recommended (Epskamp et al., 2018). The accuracy of the network was assessed using a nonparametric bootstrapping method in which the data were resampled 1,000 times to calculate 95% confidence intervals (CI) and estimate the distribution of edge weights. If the 1000 bootstrapped 95% nonparametric CIs did not contain “0,” the difference between the two EI indices was considered significant. Bootstrapped difference tests were used to assess differences in edge weights and node strength within the network. The bootnet package in R (Version 1.6) was used to assess the robustness of the network structure.
The network comparison test (NCT) was used to examine whether the separate networks created for the two samples of Turkey and the USA differed. NCT is a two-permutation test for independent samples used to compare the power (S test) and network structure (M test) of two networks. A p value less than .05 indicates a significant difference (van Borkulo et al., 2022; Wen et al., 2022).
Results
Descriptive Statistics for Study 2 & Study 3
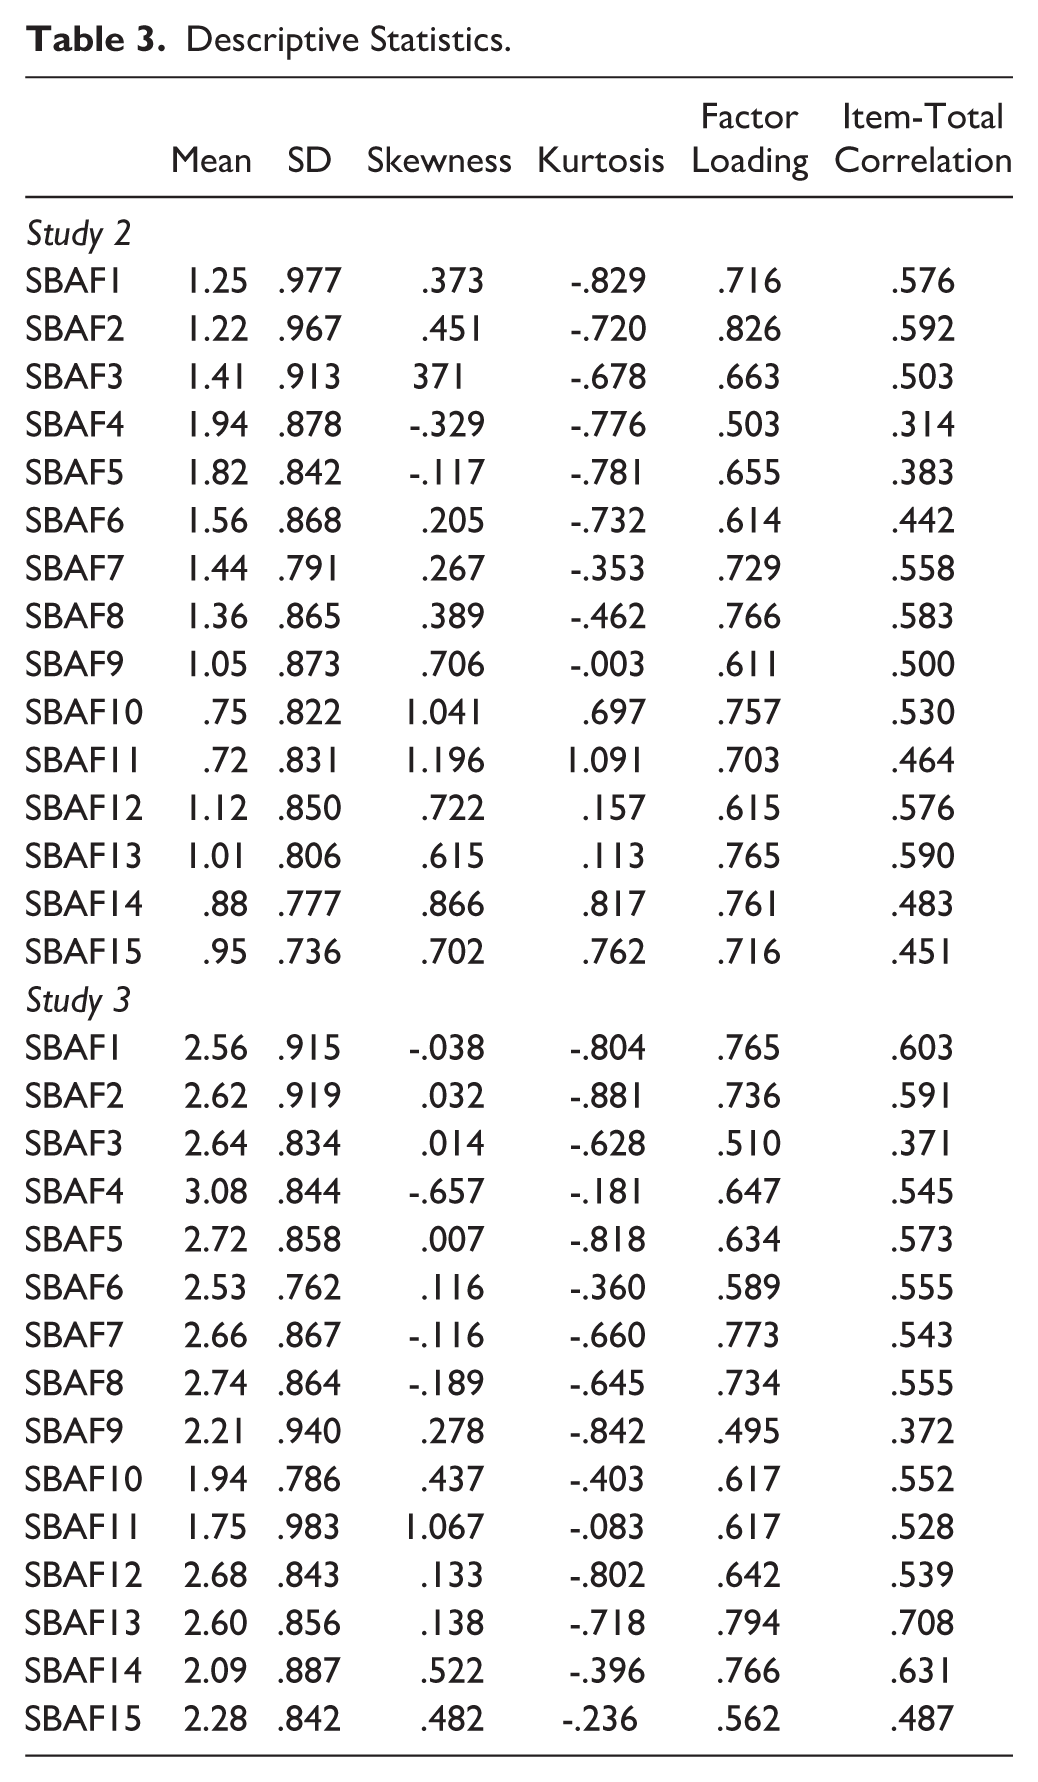
The descriptive statistics of the items that make up the SBAF-SF are given in Table 3.
Descriptive Statistics.
Confirmatory Factor Analysis
The model obtained as a result of CFA analysis is shown in Figure 3.
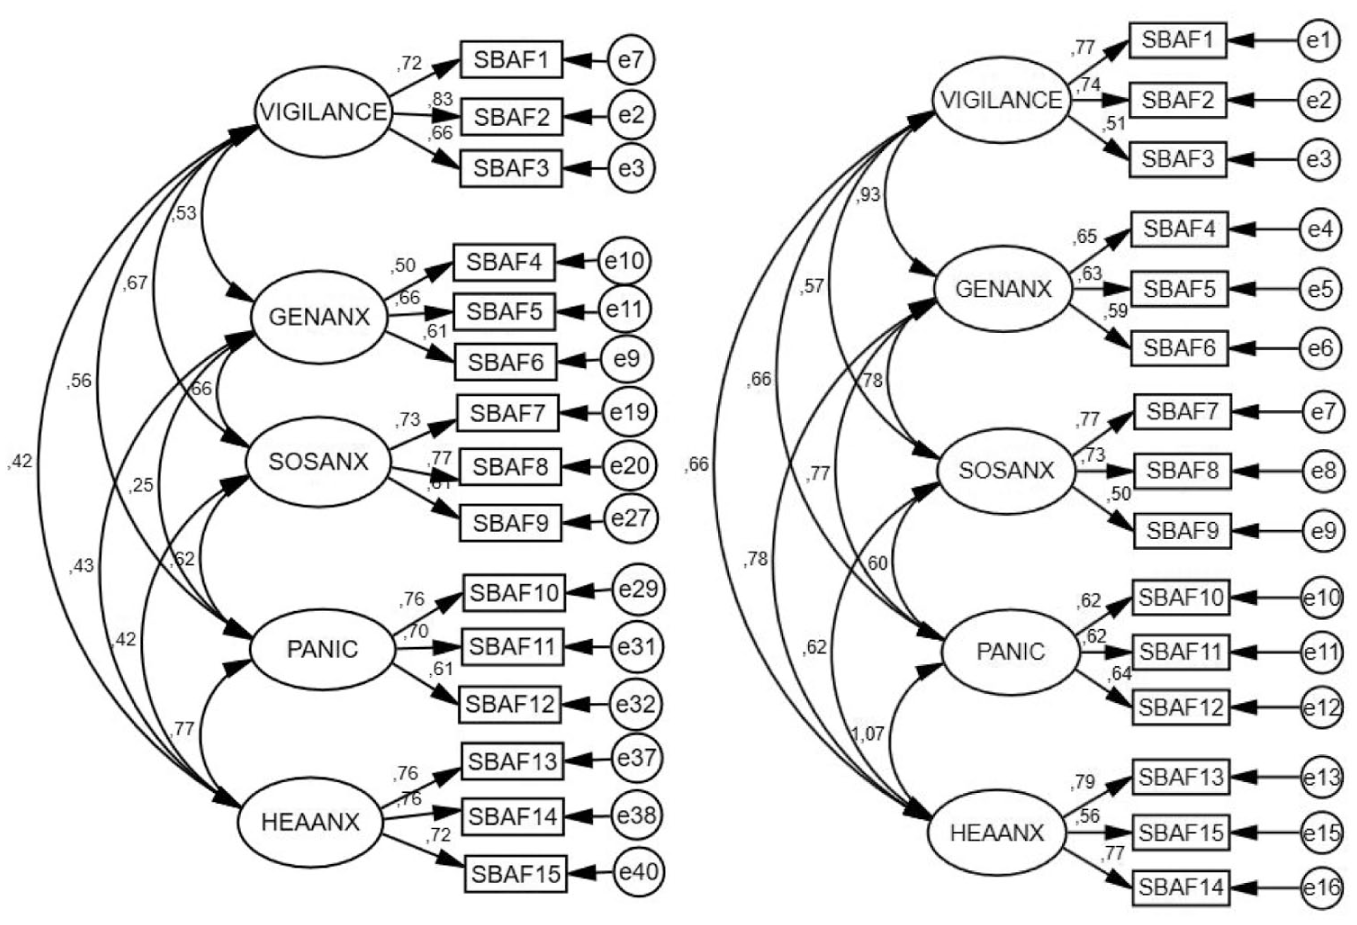
Structural Models Obtained in English-Speaking (Right) and Turkish-Speaking (Left) Samples.
When the factor loadings of the SBAF-SF measurement tool applied in both Study 2 (Model 4: Turkish Sample) and Study 3 (Model 5: U.S. Sample) were examined, it was seen that all factor loadings were .30 and above (DeVellis, 2016; Kline, 2016). It should be noted that these factors refer to the sub-dimensions obtained from the CFA of the SBAF-SF scale, whereas nodes in the subsequent network analysis represent individual symptoms or behaviors within the network structure. In addition, when the model fit index values of the scales were examined, it was found that all factor loadings were .30 and above in both Study 2 (Table 4) and in Study 3 (Table 4), the scales applied were found to have acceptable fit. Therefore, it was revealed that the structure of the SBAF-SF measurement tool was validated in both cultures.
Model Fit Indices of the SBAF-SF Across Studies.
Measurement Invariance
The results of measurement invariance across countries and gender are presented in Table 5.
Measurement Invariance.
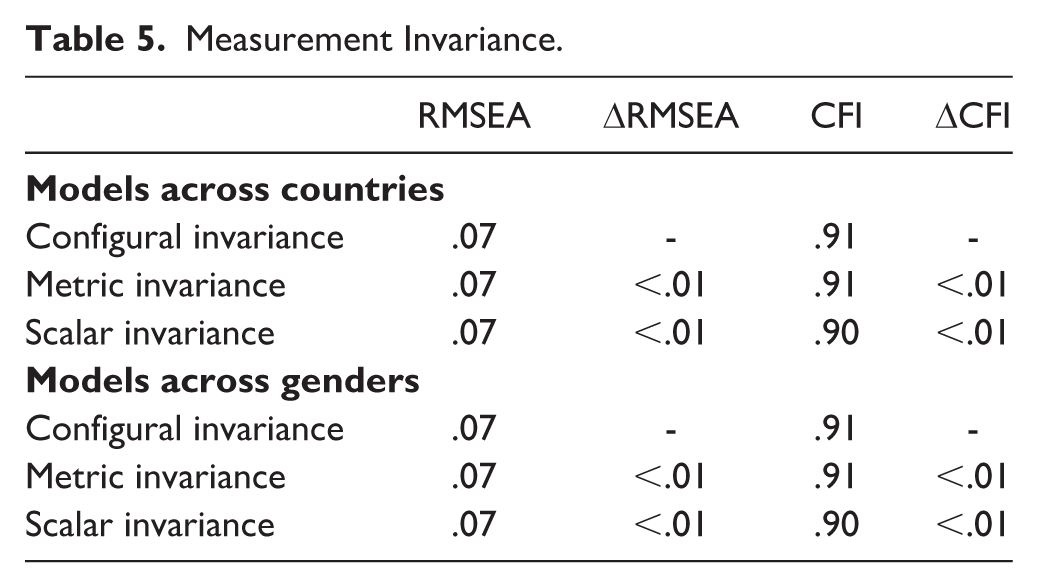
The data obtained by country indicated that the changes in fit indices were within acceptable thresholds (ΔCFI < .01, ΔRMSEA < 0.01; Rodríguez-Menchón et al., 2022), supporting configural, metric, and scalar invariance. Similarly, when measurement invariance was evaluated based on gender, the results also showed that the changes in fit indices were within acceptable thresholds (ΔCFI < .01, ΔRMSEA < .01; Rodríguez-Menchón et al., 2022), indicating that configural, metric, and scalar invariance were supported.
Assessment of Reliability
Cronbach alpha internal consistency coefficient values were analyzed to determine the reliability of the SBAF-SF scale. The results obtained from the SBAF-SF scale applied in Study 2 and Study 3 are given in Table 6.
Values Related to the Reliability of the SBAF-SF Measurement Tool.
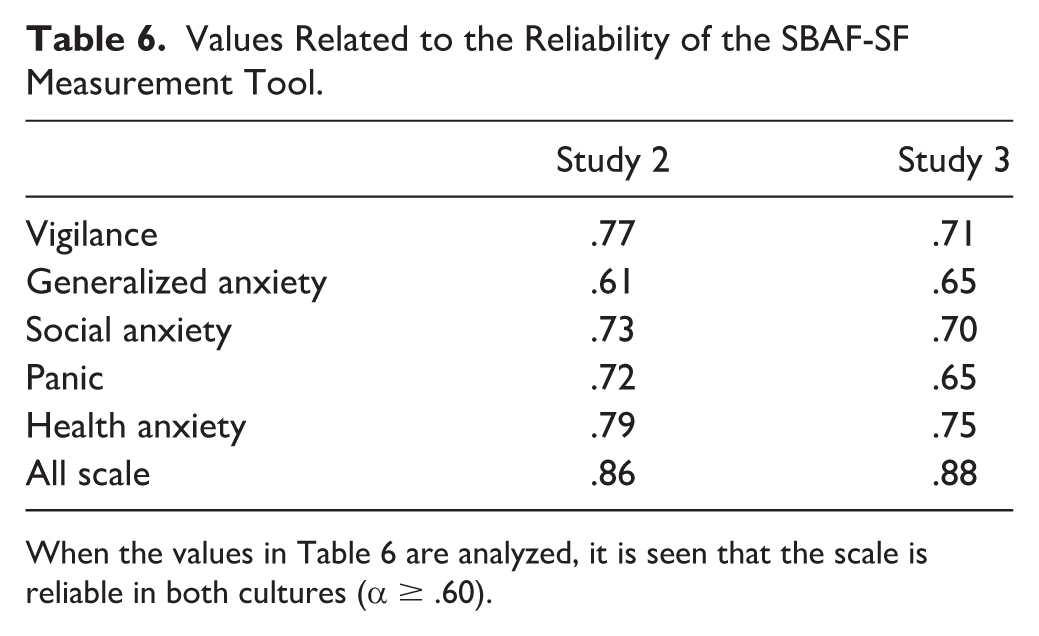
When the values in Table 6 are analyzed, it is seen that the scale is reliable in both cultures (α ≥ .60).
Divergent Validity
To evaluate the convergent and discriminant validity of the SBAF-SF, the relationships between the total and sub-dimensions of the SBAF-SF and anxiety sensitivity were analyzed by Pearson correlation. Table 7 shows the correlation values obtained from both Study 2 and Study 3.
Correlation Table.
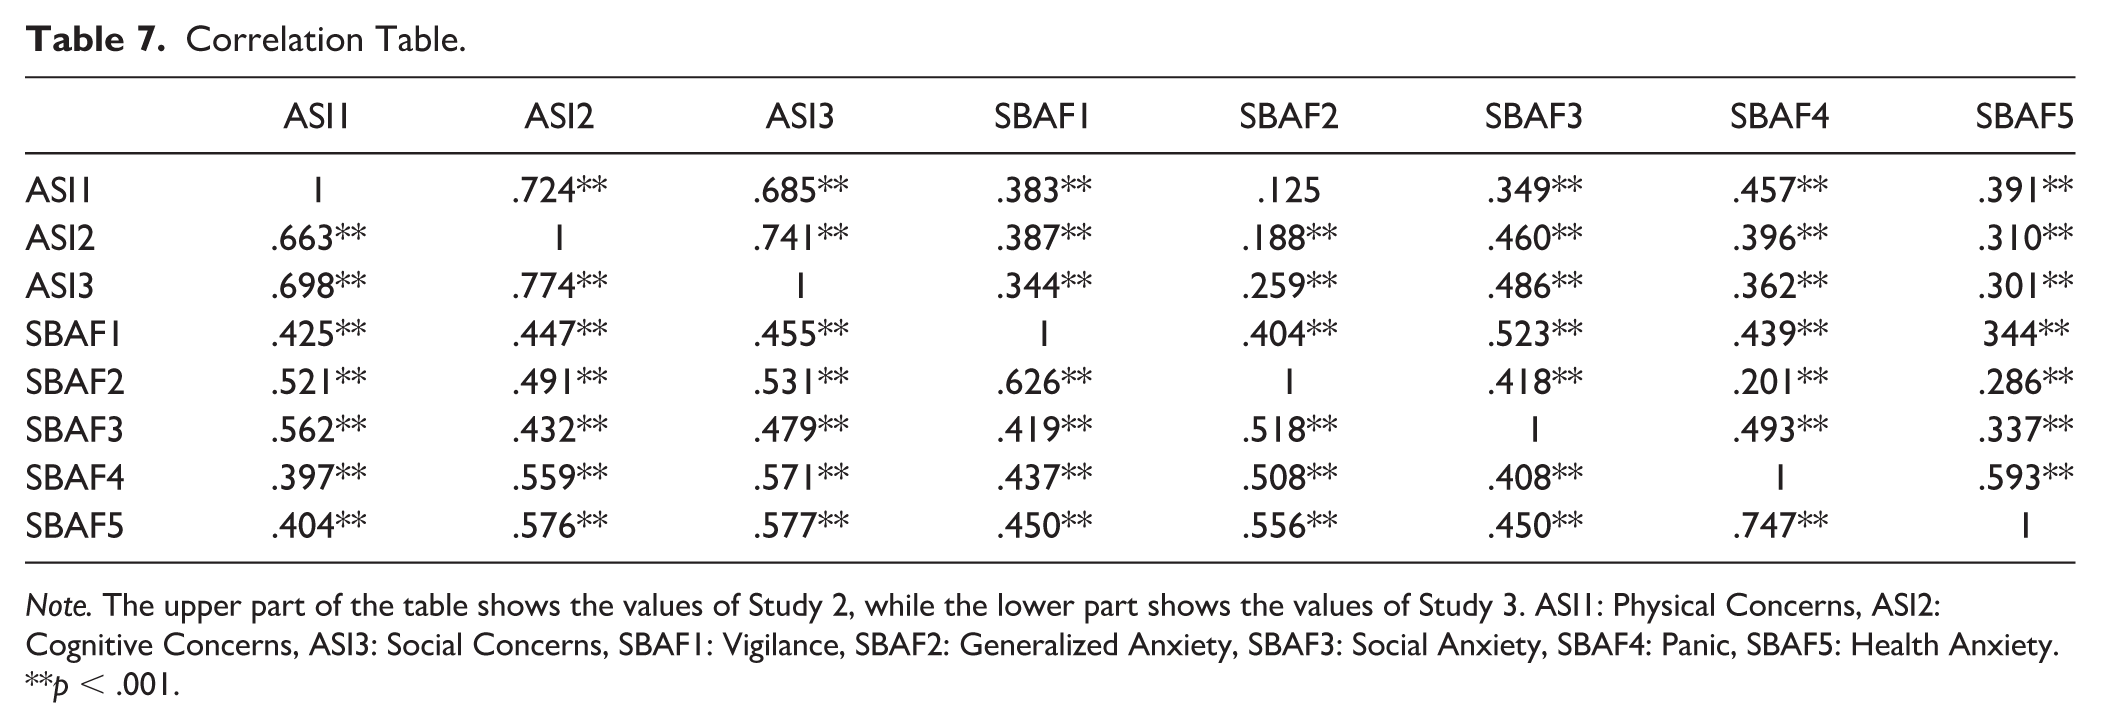
Note. The upper part of the table shows the values of Study 2, while the lower part shows the values of Study 3. ASI1: Physical Concerns, ASI2: Cognitive Concerns, ASI3: Social Concerns, SBAF1: Vigilance, SBAF2: Generalized Anxiety, SBAF3: Social Anxiety, SBAF4: Panic, SBAF5: Health Anxiety.
**p < .001.
When Table 7 is examined, it is seen that all sub-dimensions of safety behavior are significantly related to the sub-dimensions of anxiety sensitivity. However, only in Study 2, it was observed that there was no significant relationship between Generalized Anxiety, the sub-dimension of the SBAF-SF measurement tool, and Physical Concerns, the sub-dimension of the ASI-3 measurement tool.
Network Analysis
The results obtained from the network analysis are presented in Figure 4.
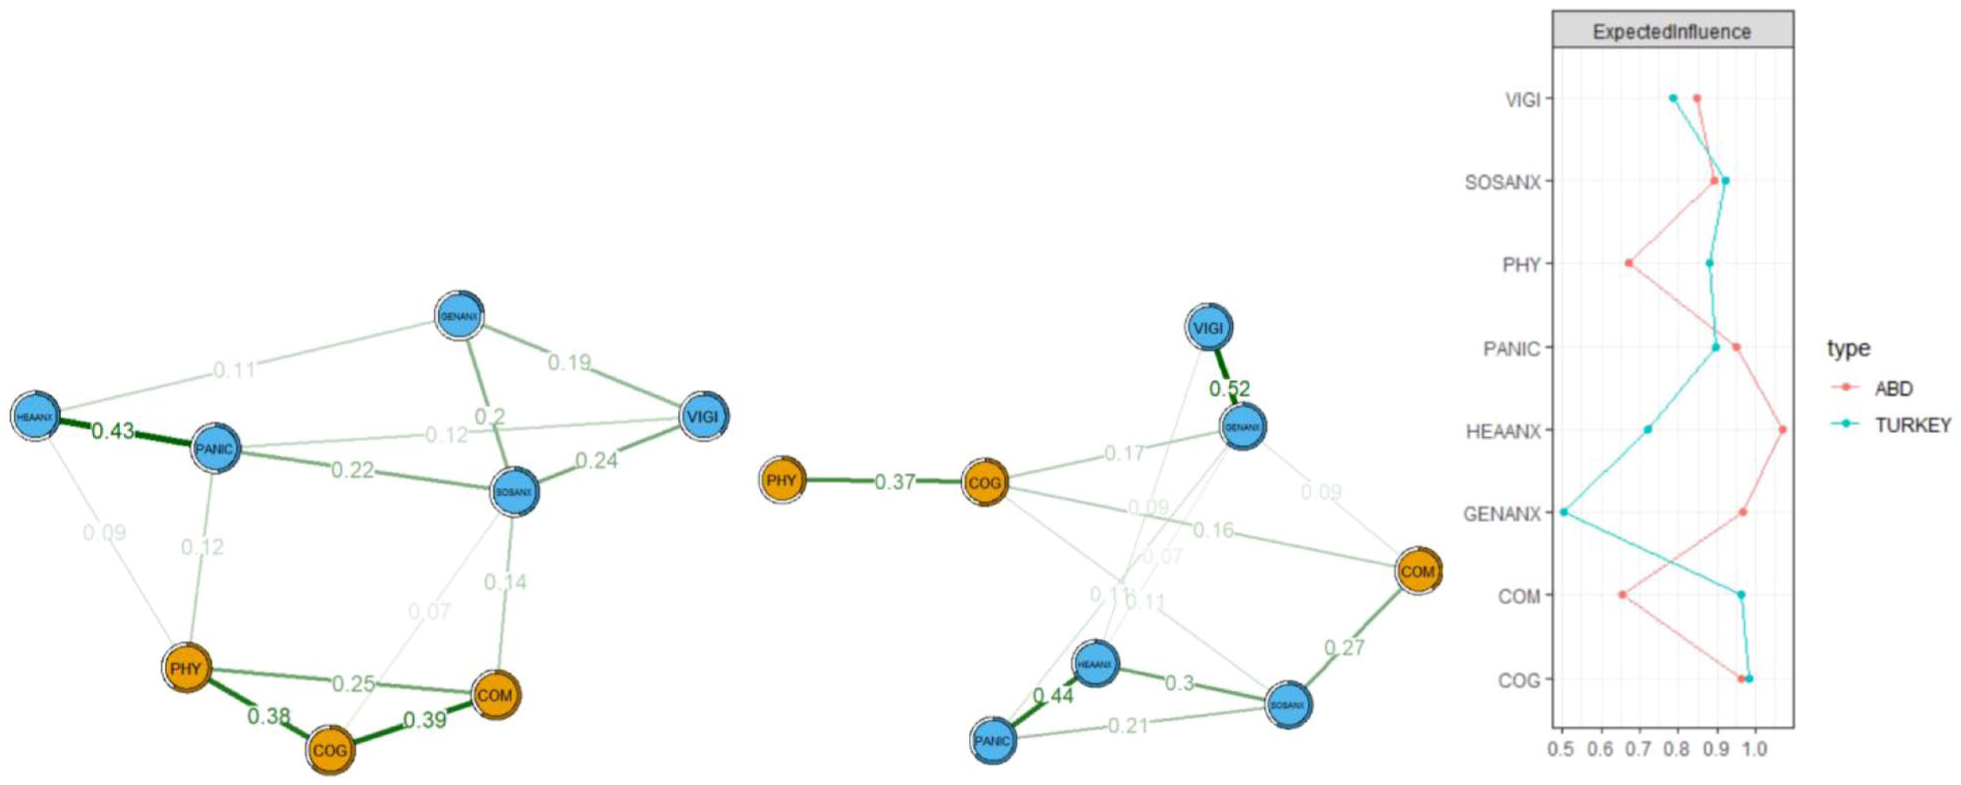
Network Structure and Expected Centrality of Influence Index for Turkey (Right) and USA (Left).
As shown in Figure 4, the expected effect value of cognitive anxiety (EI: 0.964) is higher and the most predicted node is cognitive anxiety (R2: .637) in the network structure of Turkey (Appendix Table A1). Among the edges between the nodes, the edge between “Panic” and “Health Anxiety” has the strongest positive relationship in the network model, while the relationship between “Generalised Anxiety” and “Physical Concerns” nodes has the strongest negative relationship (Appendix Figures A1 & A2).
In the network of the USA, the expected effect value of health anxiety (EI: 1.067) is the highest node, while the health anxiety node constitutes the highest predicted node (R2: .687) (Appendix Table A1). Among the edges between the nodes, the edge between “Vigilance” and “Generalised Anxiety” has the strongest positive relationship in the network model, while the relationship between “Social Anxiety” and “Generalised Anxiety” nodes has the strongest negative relationship (Appendix Figures A1 & A2).
The results of the bootstrap analysis of both network structures are shown in Appendix Figure A3. When the figure is analyzed, it is seen that 95% of the CIs are narrow. When the results of the bootstrapping of the case dropping subset of the EI values are analyzed, it is seen that the CS-C values of the Turkish network are 0.51, while the CS-C values of the USA network are 0.44, indicating that the EI results for both networks are stable (Appendix Figure A4).
As a result of the NCT conducted to determine whether the network structures differed or not, it was observed that there was a significant difference between the network structures of Turkey and USA (M = .307, p = .02), but there was no significant difference in terms of strength (S = .198, p = .53). Accordingly, the edges that differentiate in the network are given in Table 8.
Values Related to Edges That Differ Between Networks.
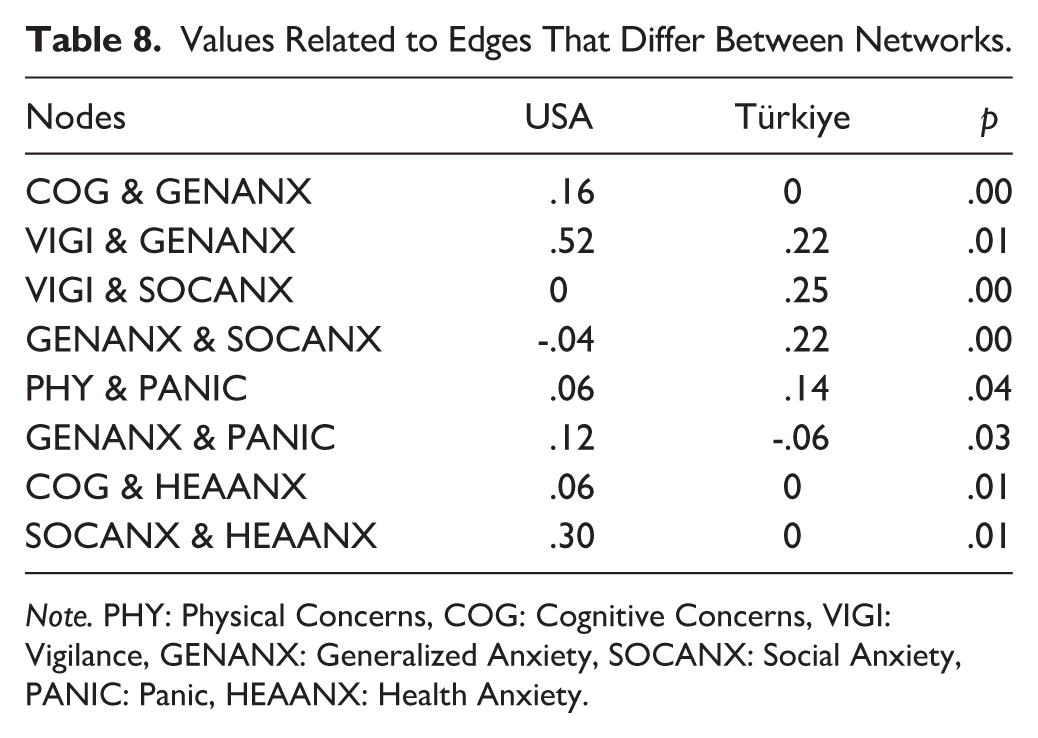
Note. PHY: Physical Concerns, COG: Cognitive Concerns, VIGI: Vigilance, GENANX: Generalized Anxiety, SOCANX: Social Anxiety, PANIC: Panic, HEAANX: Health Anxiety.
When Table 8 is analyzed, it is seen that the connections between Cognitive Concerns- Generalized Anxiety, Vigilance- Generalized Anxiety, Generalized Anxiety- Panic, Cognitive Concerns- Health Anxiety, Social Anxiety- Health Anxiety nodes in the USA network are more intense than in the Turkey network. However, the connections between the Vigilance- Social Anxiety, Generalized Anxiety- Social Anxiety, Physical Concerns- Panic nodes in the Turkey network are denser than the USA network.
Discussion
The purpose of this research was to create and test the validity and reliability of a short form of the SBAF. This work was carried out in three studies using both Turkish and English-speaking samples. Based on the results of a factor analysis of the full scale, SBAF, a short form was created with 15 items that still covers a wide range of safety-seeking behaviors, including physical concerns, cognitive concerns, vigilance, generalized anxiety, social anxiety, panic, and health anxiety. This measures fills an important gap in the literature for a tool that is easier to use in both research and clinical practice.
The results showed significant relationships between safety-seeking behaviors and anxiety sensitivity in both cultures. These findings support the SBAF-SF and are consistent with previous literature. Because anxiety sensitivity involves fear of sensations related to anxiety and arousal, it increases the need and desire to escape/avoid negative emotional or physical experiences (Otto et al., 2016; Taylor, 2014). Anxiety sensitivity regulates the relationship between fear and behavioral avoidance in anxious youth (Lebowitz et al., 2015), increases the negativity of negative experiences and directs maladaptive coping behaviors (Otto & Smits, 2018). Therefore, in parallel with the finding of this study, it can be seen that an increase in anxiety sensitivity is associated with an increase in safety-seeking behaviors.
However, an important result obtained in this study is that, unlike all other variables and the US sample, the relationship between general anxiety-related safety-seeking behaviors and physical anxiety sensitivity in Turkey is not significant. Specifically, our results showed that safety-seeking behaviors increased as physical anxiety sensitivity increased in the USA, but no such relationship was found in Turkey. The finding for the US sample is consistent with prior work in US samples showing that increased physical anxiety is frequently associated with increased safety-seeking behaviors (Jakes et al., 2025; Telch & Zaizar, 2020). Here, the relationship is bidirectional and anxiety sensitivity leads to an increase in safety-seeking behaviors as well as safety-seeking behaviors can also sustain health anxiety by promoting the misattribution of safety (Olatunji et al., 2011).
This finding may also have implications for resilience, as the presence of adaptive safety-seeking behaviors could buffer against excessive anxiety and stress, potentially mitigating risks for adverse outcomes such as suicidality. Specifically, restorative safety-seeking behaviors, which are enacted in response to heightened anxiety, may help individuals manage their distress and allow some degree of exposure to feared stimuli. In this way, such behaviors could enhance perceived self-efficacy and provide opportunities for coping, contrasting with preventive safety behaviors that might maintain avoidance and exacerbate anxiety (Goetz et al., 2016; Goodson & Haeffel, 2018; Helbig-Lang & Petermann, 2010). However, the precise mechanisms underlying this effect remain unclear, and further research is needed to better understand this relationship.
Safety-seeking behaviors can create different situations in the context of health or unhealth. For example, the use of a cane by someone with low back pain against the fear of falling is similar to safety behavior, but this is a pain behavior. Although these behaviors are specifically targeted and tried to be changed especially in cognitive behavioral interventions, this is true when the person with low back pain has little or no risk of falling. Therefore, this shows the complexity of the relationship between physical anxiety sensitivity and safety-seeking behaviors (Sharpe et al., 2022).
Research also reports that public health responses at both the individual and national level are influenced by cultural orientations (Jansen & van der Kroef, 2019; Leijen & van Herk, 2020), so it is important to include socio-cultural contexts when examining the determinants of health behaviors (Singer, 2012). Accordingly, conceptualisations of worry and anxiety do not adequately represent somatic complaints that are more frequently reported in cultures far from the USA. In parallel with this, Kapoor and Tagat (2022) reported that being culturally different from the USA was associated with lower anxiety in a study investigating preventive health behaviors related to anxiety across countries during COVID-19. Again, due to intercultural information processing differences, it is known that people in individualistic cultures such as the USA are generally motivated by approaching positive outcomes, while people living in collectivist cultures such as Turkey tend to be motivated by avoiding negative outcomes (Hamamura et al., 2009; Kapoor & Tagat, 2022). Considering that anxiety sensitivity reflects sensitivity to encountering undesirable situations, it can be speculated that individuals in individualistic cultures may exhibit more safety-seeking behaviors to ensure positive outcomes when physical anxiety sensitivity increases, thereby facilitating greater relaxation.
In the network analysis conducted for further evaluation of the direct and indirect relationships between anxiety sensitivity and safety-seeking behaviors, it was observed that cognitive anxiety sensitivity was the most important symptom in the Turkish network, while safety-seeking behaviors toward health anxiety was the most important symptom in the US network. While catastrophising beliefs about somatic and mental symptoms of anxiety increase anxiety sensitivity, some cultures may have extensive catastrophising cognitions about anxiety symptoms and this may lead to high levels of anxiety sensitivity (Hinton et al., 2021; Schneider & Schulte, 2008). In general, the “overthinking” syndrome, which creates fears about rumination and disturbing thoughts, has been found to be evident in many cultural groups (Hinton et al., 2016; Kaiser et al., 2015). Therefore, it is considered important to target anxiety symptoms such as somatic symptoms and related fears in the treatment planning of non-Western communities (Hinton et al., 2021). In parallel with this, it is reported that cultural context is important in anxiety research and treatment in the literature (Ishikawa et al., 2022; Lewis-Fernandez et al., 2010; Marques et al., 2014). Considering that understanding intercultural differences in symptom presentations is very important for correct diagnosis and treatment, it is considered that more intercultural studies should be conducted (Agorastos et al., 2012).
Strengths and Limitations
In this study, the psychometric properties of a short form of the SBAF were developed and tested in the in both Turkish- and English-speaking samples. The result is a practical measurement tool with intercultural validity and reliability available to use in both clinical and research-based studies for the measurement of safety-seeking behaviors. Although the research has a strong feature in this aspect, it has important limitations. The most important limitation of the study is that the psychometric properties of the scale were not examined in a clinical sample. In addition, the sample description did not include detailed information regarding actual symptom severity. We acknowledge that symptom severity may intersect with safety-seeking behaviors, and the lack of symptom data limits the ability to determine whether the measure may perform differently across clinical vs. non-clinical samples or among different diagnostic subtypes. We also recognize that the item reduction approach in Study 1 may not be fully generalizable to clinical populations. Regarding convergent and discriminant validity, the use of only the ASI-3 is limited. Future studies should incorporate additional disorder-specific symptom scales and other relevant constructs to strengthen convergent and discriminant validity assessments.
It is important to note that the present study did not include a trauma exposure measure, and the sample should be considered as a non-trauma-exposed population. Future studies should examine how trauma exposure may affect safety-seeking behaviors and their relationship with anxiety sensitivity. In addition, future research could examine potential links between safety-seeking behaviors, suicidality, and resilience as a buffering mechanism. Again, it is thought that conducting longitudinal studies in different clinical samples on how safety-seeking behaviors emerge would be valuable in terms of revealing causal relationships.
Footnotes
Appendix
Centrality Index & R2 Values.
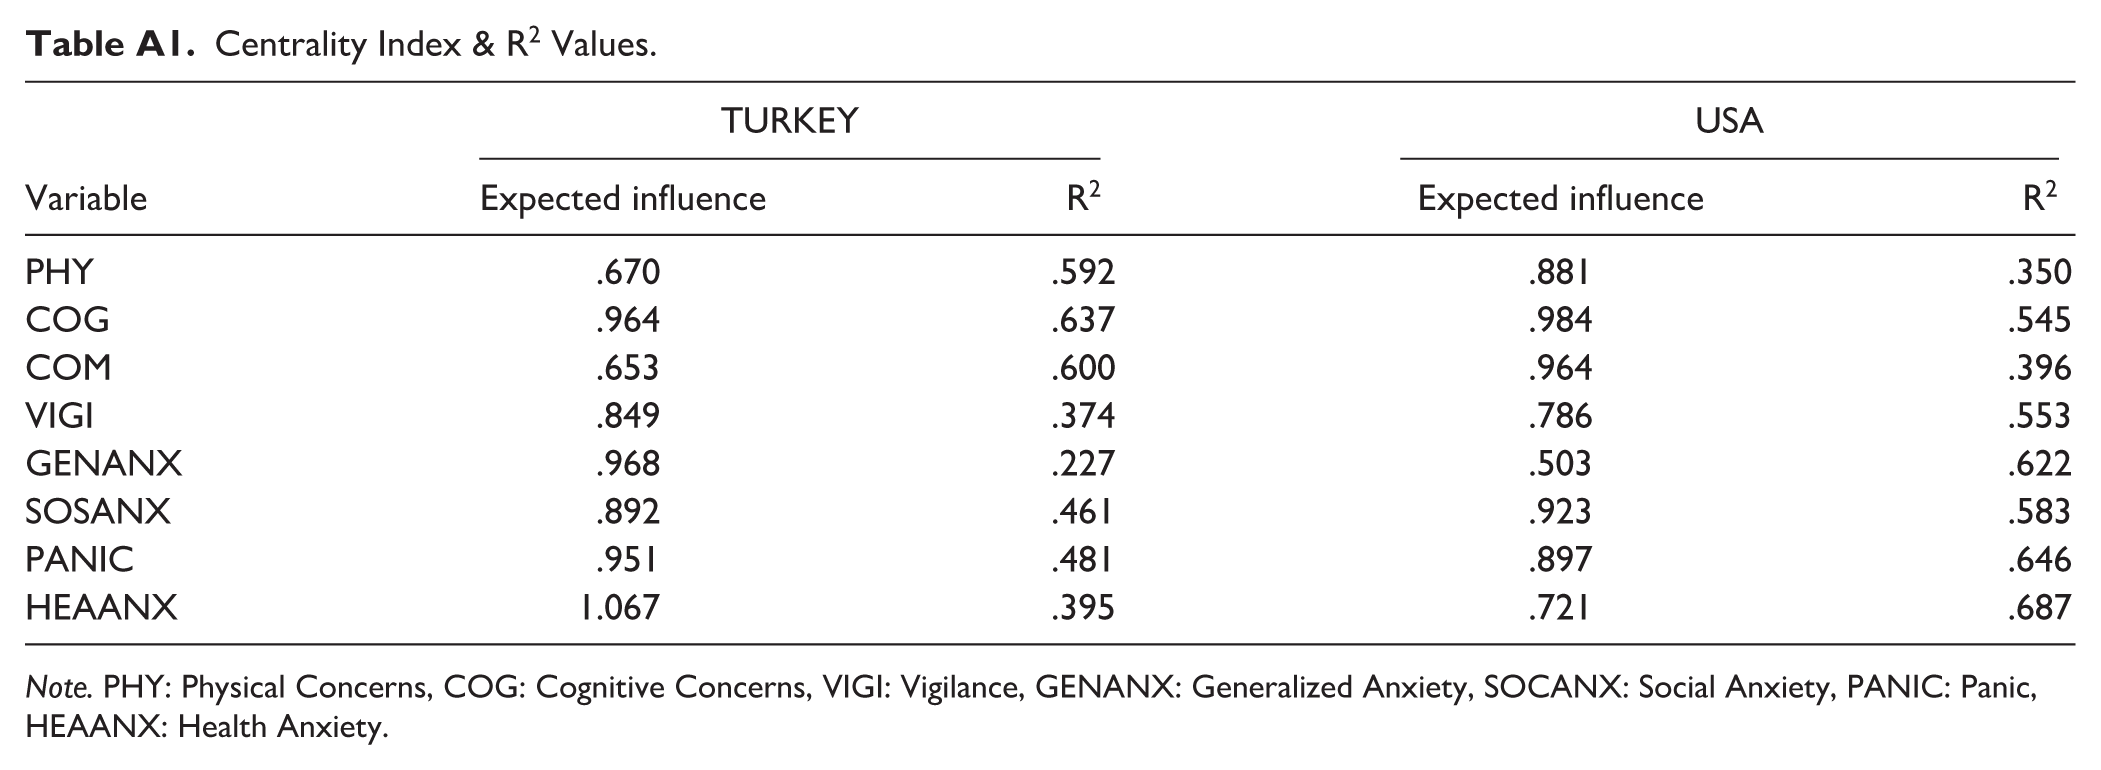
| TURKEY | USA | |||
|---|---|---|---|---|
| Variable | Expected influence | R2 | Expected influence | R2 |
| PHY | .670 | .592 | .881 | .350 |
| COG | .964 | .637 | .984 | .545 |
| COM | .653 | .600 | .964 | .396 |
| VIGI | .849 | .374 | .786 | .553 |
| GENANX | .968 | .227 | .503 | .622 |
| SOSANX | .892 | .461 | .923 | .583 |
| PANIC | .951 | .481 | .897 | .646 |
| HEAANX | 1.067 | .395 | .721 | .687 |
Note. PHY: Physical Concerns, COG: Cognitive Concerns, VIGI: Vigilance, GENANX: Generalized Anxiety, SOCANX: Social Anxiety, PANIC: Panic, HEAANX: Health Anxiety.
Author Contributions
Conceptualization: FC and IS. Data Collection: FC and GJH. Methodology: FC and IS. Data Analysis: FC. Writing—Original Draft: FC and IS; Review & Editing: IS, JTG and GJH. Supervision: IS, JTG and GJH.
Declaration of Conflicting Interests
The authors declared no potential conflicts of interest with respect to the research, authorship, and/or publication of this article.
Funding
The authors received no financial support for the research, authorship, and/or publication of this article.
Ethical Approval
This study complies with the 1964 Declaration of Helsinki and its subsequent amendments or comparable ethical standards, and ethical approval for the research process was obtained from Atatürk University Scientific Research and Publication Ethics Committee.
Data Available
The dataset can be provided by the corresponding author upon request.