
Abstract
Moral disengagement (MD), or the cognitive strategies used to avoid feelings of guilt in contexts of moral transgression, has been an established cognitive risk factor for engagement in antisocial and criminal behaviors. In justice-involved samples, MD is most frequently measured using the 32-item Mechanisms of Moral Disengagement Scale (MMD). The current study aims to develop a short-form version of the MMD with strong psychometric properties and predictive utility. Using data from a longitudinal study of justice-involved youth, we generated theoretically and data-driven short-form versions of the MMD. We then validated and compared the short-form versions to the full MMD in a different sample of justice-involved youth. Results indicate that a data-driven 11-item short form consistently performed well across both samples. Recommendations are made for future researchers interested in exploring MD, and implications in risk assessment are discussed.
Introduction
Developmental scientists have long aimed to identify biopsychosocial factors that predispose youth to antisocial behaviors known to be costly across both individual and societal levels. These studies have identified a host of environmental (e.g., exposure to violence; Wilson et al., 2009), physiological (e.g., reduced amygdala reactivity; Hyde et al., 2016), and personality characteristics (e.g., impulsivity; Blair, 2016) that are associated with interpersonal aggression and engagement in crime. More recently, an influx of research has explored cognitive mechanisms related to crime and identified moral disengagement (MD) as a relevant predictor of aggression (Gini et al., 2014), substance use (Quinn & Bussey, 2015), and offending (Chen & Sutton, 2024) in adolescent and young adult samples.
MD was first introduced by Albert Bandura, who was dissatisfied with the paucity of constructs linking broad moral thought to specific moral behavior (Bandura et al., 1996). He believed that individuals use cognitive strategies to justify or rationalize behaviors like stealing, violence, or interpersonal coldness that would typically be considered morally transgressive (i.e., harm-based conceptualizations of morality, Schein & Gray, 2018). He labeled these collective cognitive strategies as “MD” and proposed that they bridge general moral outlooks to behavior. Indeed, this assumption has been supported by empirical work that shows that greater MD (i.e., more disengagement) is linked to morally transgressive behaviors like bullying, cheating, and violence (Caprara et al., 2013; DeLisi et al., 2014; Gini et al., 2014).
Accordingly, Bandura developed the Mechanisms of Moral Disengagement (MMD) scale to assess MD through 32 items thought to represent eight unique cognitive strategies that can decrease guilt. They include moral justification (sample item: “It is alright to beat someone who badmouths your family”), euphemistic language (“Taking someone’s bicycle without their permission is just ‘borrowing it’”), advantageous comparison (“Damaging some property is no big deal when you consider that others are beating people up”), displacement of responsibility (“If kids are not disciplined they should not be blamed for misbehaving”), diffusion of responsibility (“It is unfair to blame a child who only had a small part in the harm caused by a group”), distorting consequences (“It is okay to tell small lies because they don’t really do any harm”), attribution of blame (“If people are careless where they leave their things it is their own fault if they get stolen”), and dehumanization (“Someone who is obnoxious does not deserve to be treated like a human being”). For each statement, participants are asked how much they agree on a scale of 1 (“Do not agree”) to 3 (“Agree”), with researchers most commonly taking an average score across the 32 items to assess MD (Chen & Sutton, 2024; Shulman et al., 2011).
Despite the theoretical assumption of eight dimensions, psychometric investigations have generally found a one-factor structure to best fit the measure, in part due to items cross-loading across factors (e.g., Pelton et al., 2004). Consequently, citing the MMD’s length and face-value item overlap, studies have started exploring shorter versions of the scale (summary in Concha-Salgado et al., 2022). Although seven short forms have been proposed, all of them were derived from university and school children, and only four include fewer than 24 items (M # of items = 19.29, SD = 7.5, range 8-28). Of those four, three used the Spanish version of the scale, with one being an unpublished Master’s thesis that tested a multifactor structure (Haro, 2014), one modifying the items for elementary school children (Caprara et al., 1995), and another using a 5-point Likert-type scale (Concha-Salgado et al., 2022). Only one version examined the original English measure with 12–15-year-old Australians, though also with a 5-point Likert-type scale (Newton et al., 2012). Overall, to our knowledge, no prior work has rigorously compared various short forms of the English version of the MMD in U.S. samples of justice-involved youth.
Furthermore, beyond these broader limitations, Bandura’s measure also has poorly worded items. Indeed, the MMD relies on outdated slang (e.g., item 15: “It is ok to treat badly someone who behaved like a ‘worm’”) and nonspecific, cognitively taxing items (e.g., item 27: “Compared to the illegal things people do, taking some things from a store without paying for them is not very serious”). For example, the latter item includes both comparisons and negative language (e.g., “without,” “not”) that unnecessarily increase the cognitive load of the question, potentially leading to inaccurate responding in younger youth and those with lower cognitive abilities (de Jong, 2009; Weijters & Baumgartner, 2012). Although little research has examined the relationship of the MDD with age and IQ, psychometrically speaking, the measure should not be significantly related to these factors to effectively capture MD. Nevertheless, despite this line of research reflecting a need for a shorter version of the MMD, no studies have assessed and compared the validity (construct, content, external, convergent, criterion, discriminant, and predictive) of different short forms in large longitudinal samples of at-risk youth. As a result, there are no widely accepted, or consistently used, short-form versions of the MMD.
This gap in the literature is imperative to address, as a recent proliferation of studies exploring MD in justice-involved youth has found that MD predicts problematic behaviors like criminal offending above and beyond the influence of other well-established psychosocial risk factors (e.g., callous unemotional traits; Chen & Sutton, 2024; Shulman et al., 2011; Walters, 2020). Though more investigation is necessary, it is plausible that MMD scores could be used to detect youth most at risk of negative outcomes, as has been done with related-yet-distinct variables like psychopathy (DeLisi et al., 2014). Thus, there is a need to effectively identify these youth who are most in need of intervention by using measures that are associated with both risky behaviors (e.g., offending) and characteristics (e.g., psychopathic traits). However, administering 32 items to assess a construct with a single factor may be inefficient, and a version that uses a more precise assortment of well-fitting items would decrease the time needed to assess MD and discourage participant burnout, ultimately leading to more accurate responses capturing individuals’ MD. Simply put, parsimony is valuable in research, and it is quite possible that short forms of the MMD would perform as well as the full measure with a fraction of the items.
Current Study
The current study leverages data from two large longitudinal studies of justice-involved youth to create and validate a short form of the MMD that identifies those most at risk for externalizing behaviors. In the first dataset, we identified the best-fitting MMD items to create two short forms. A data-driven short form was derived from items with the strongest factor loadings and a theoretically driven 8-item short form included the strongest factor loading items (i.e., on the overall MD factor) from each of Bandura’s eight dimensions of MD (e.g., moral justification). We then tested the validity of the short forms in both datasets by comparing their associations to those of the full MMD across variables that capture external (demographics), convergent (psychopathic traits), criterion (same wave offending and substance use), discriminant (IQ and age), and predictive (later externalizing behaviors) validity. Overall, we would expect the short forms to have moderate correlations (r ≈ .25–.35) with psychopathic traits and offending (Gini et al., 2014), small-to-medium correlations (r ≈ .15–.20) with substance use (Quinn & Bussey, 2015), and negligible associations (|r| < .10) with age, IQ, and demographic indicators (Pelton et al., 2004). Based on the totality of the results, we recommend a short form for future researchers to use and discuss future directions for measuring and interpreting MD.
Methods
Participants
To create the short forms, we examined data from the Pathways to Desistance study, a longitudinal study of 1,354 juvenile offenders (1,170 male, 184 female) in Philadelphia, PA (n = 700) and Phoenix, AZ (n = 654). Eligible participants were between 14 and 17 years old and were charged with a felony or serious nonfelony offense (e.g., sexual assault). At baseline (wave 1), the average age was 16 (SD = 1.14) and 41.5% of participants were Black, 33.5% were Hispanic, 20.2% were White, and 4.8% were of other ethnicities. Next, to validate the short forms, we analyzed data from the Crossroads Study, which included 1,216 13 to 17-year-old male adolescents (Mage = 15.80, SD = 1.29) who were arrested for moderate, nonfelony offenses in either Jefferson Parish, LA (n = 151), Orange County, CA (n = 532) and Philadelphia, PA (n = 533). The sample is 45.8% Hispanic, 36.9% Black, 14.8% White, and 2.5% Other Ethnicity.
Procedures
For the pathways sample, 2,008 individuals were approached, and 67% agreed to participate. They engaged in two 2-hour interviews at baseline and were followed up with every six months for a three-year period and then annually for four years. Data collection occurred from November 2000 to March 2010 and resulted in high retention rates across the 11 waves (range = 84–94%, M = 90%; for full study procedure, see Schubert et al., 2004), allowing for longitudinal analyses that spanned 13 years from adolescence to adulthood (ages 14–26). More details on the study and measures can be found at pathwaysstudy.pitt.edu. Similarly, the Crossroads study ran from July 2011 to July 2022 and mirrored the Pathways study’s procedures, though targeting youth who were charged with less serious offenses (e.g., vandalism, theft, mostly misdemeanors). The study also has 11 waves of data spanning from adolescence to early adulthood, with an average retention rate of 87%. Further descriptions of the study and measures are found at sites.uci.edu/crossroadsinfo/.
Measures
Mechanisms of Moral Disengagement Scale
The MMD (Bandura et al., 1996) was administered at every wave in the pathways study and at the final two waves of the crossroads study. Higher scores of the 32-item measure are indicative of individuals being more morally disengaged. A mean score of the 3-point Likert-type scale items was taken, with the pathways sample dropping in score across waves (wave 1: M = 1.62, SD = 0.35, N = 1,351; wave 11: M = 1.37, SD = 0.34, N = 1,131) to resemble the crossroads sample’s scores at later waves (wave 10: M = 1.37, SD = 0.28, N = 924; wave 11: M = 1.34, SD = 0.27, N = 733). Items were treated as categorical in analyses and are listed in the Appendix.
Psychopathy Checklist: Youth Version
The Psychopathy Checklist: Youth Version (PCL-YV; Forth et al., 2003) was administered at wave 1 of the pathways study and assesses psychopathic characteristics among youth. Interviewers completed the PCL-YV rating form, which takes the sum of 20 items rated on a 3-point ordinal scale: “0” does not apply to the youth, “1” applies to a certain extent, and “2” applies to the youth. The items capture varying domains of psychopathy, including interpersonal (e.g., grandiosity), affective (e.g., lack of empathy), lifestyle (e.g., impulsivity), and antisocial components (e.g., criminal versatility), with higher scores being indicative of more psychopathic characteristics. The mean score at baseline was 15.91 (SD = 7.73, N = 1,300, range: 0–39).
Youth Psychopathy Inventory
The Youth Psychopathy Inventory (YPI; Andershed et al., 2002) was administered at waves 2–11 of the pathways study, and consists of 50, 4-point Likert-type items (ranging from 1, “Does not apply well at all,” to 4 “Applies very well”) that are summed into a total score. Like the PCL: YV, the YPI incorporates interpersonal (e.g., manipulation), affective (e.g., callousness), and lifestyle components (e.g., thrill-seeking) with higher scores indicating more psychopathic traits. Since the PCL: YV was only administered at wave 1, we used the YPI at wave 11 to measure psychopathy in the pathways study (M = 98.89, SD = 22.06, range: 55–186, N = 1,131).
Inventory of Callous Unemotional Traits
Unlike the pathways study, the crossroads study administered the Inventory of Callous Unemotional Traits (ICU; Frick, 2004) at each wave to measure psychopathy. The ICU focuses on the affective component and sums 24 four-point Likert-type items to assess a lack of guilt, remorse, empathy, concern for others, and care regarding performance on important activities, as well as superficial or shallow expressions of emotions (0 = “Not at all true” to 3 “Definitely true”). Since the MMD was only administered at waves 10 and 11 in the crossroads study, we used the ICU scores from those two waves (wave 10: M = 21.44, SD = 8.52, N = 923, Range 1–51; wave 11: M = 21.12, SD = 8.17, N = 732, range: 1–42), with higher scores indicative of more CU traits.
Self-Reported Offending
The Self-Reported Offending scale (SRO; Huizinga et al., 1991) consists of 24 items asking participants whether they participated in illegal activities (e.g., damaged property, stole, sold drugs). At wave 1 of the pathways study, participants were asked if they had ever done these activities, while at waves 10 and 11 of both studies, the time frame was in the past year. A proportion variety score was created with the proportion of endorsed items divided by the number of questions the participant responded to. The variety score was used because psychopathy is linked to versatile criminality (Hare & Neumann, 2005), and offending variety scores are more internally consistent and stable than frequency scores (Bendixen et al., 2003). For pathways, the mean score at wave 1 was 0.33 (SD = 0.21, N = 1,351) and dropped to 0.05 by the final wave (SD = 0.09, N = 1,126). For crossroads, we again only used wave 10 and 11 scores, which had mean scores of 0.05 (SD = 0.09, N = 924) and 0.03 (SD = 0.07, N = 733), respectively.
Self-Reported Substance Use
Substance use was measured via variety score such that frequencies of use for nine substances (cannabis, opiates, cocaine, stimulants, ecstasy, sedatives, hallucinogens, inhalants, amyl nitrate) were dichotomized (0 = No use, 1 = Any use) and summed (range = 0–9). Of note, higher scores indicate more types of substances used and not frequency of use. Nevertheless, in the pathways study, lifetime substance use at wave 1 was 2.13 (SD = 1.97, N = 1,349) and dropped to 0.59 (SD = 1.08, N = 1,124) at the final wave when youth were asked about their use during the last year. In the Crossroads sample, the mean substance use score for the past year at wave 10 was 1.13 (SD = 1.47, N = 924) and 1.03 at wave 11 (SD = 1.42, N = 733).
Wechsler Abbreviated Scale of Intelligence
The Wechsler Abbreviated Scale of Intelligence (WASI; Wechsler, 1999) was administered at wave 1 of both studies and consists of the Vocabulary (42 orally defined items) and Matrix Reasoning subtests (35 incomplete grid patterns). These scores were combined to produce an age-based standardized general intellectual functioning score, with higher values indicating greater ability (pathways: M = 84.52, SD = 13.03, N = 1,342; crossroads: M = 88.43, SD = 11.59, N = 1,213; ranges: 55–128).
Demographic Variables
We created four dichotomous race/ethnicity variables (0 = No, 1 = Yes) in both studies, including one for White, Black, Hispanic, and other identifying participants. In addition, we used a continuous age variable from wave 1 for both studies and a binary (0 = Female, 1 = Male) sex variable in the pathways sample. See Participant section for demographic information.
Analytic Approach
Identifying Short-Form Items
In Mplus (Version 8; Muthén & Muthén, 1998–2017), we started by evaluating the factor structure of the full MMD at the first and most populated wave of the Pathways to Desistance study to ensure that a one-factor solution appropriately fits the scale. We ran exploratory factor analyses (EFAs) testing up to eight factors using a weighted least squares mean and variance adjusted (WLSMV) estimator with oblique rotation. To identify the best-fitting factor structure, we examined each model’s eigenvalues to determine how much variance each factor explained, retaining eigenvalues greater than one and using a scree plot to locate the point where additional factors contributed minimal variance. We also compared the models’ fit indices, looking for higher relative Comparative Fit Index (CFI) and Tucker Lewis Index (TLI) values and lower root-mean-square error of approximation (RMSEA) and standardized root mean squared residual (SRMR) values. Concurrently, we considered the clarity and distinctiveness of the factors, prioritizing models that demonstrated a simple structure (loadings ≥.30 on one factor, <.30 on others) without highly correlated factors (r <.60; Brown, 2015; Hair et al., 2019).
Next, given that we expect a one-factor solution and that the MMD is most often used as a mean or total score, we ran single-factor confirmatory factor analyses (CFAs) with a WLSMV estimator for the 32-item MMD at each wave of the Pathways study. To identify the best-fitting items across adolescence and young adulthood, we averaged the standardized factor loadings of each item across the 11 waves. For the data-driven short form, we included items with average factor loadings of 0.70 or greater, and for the 8-item theoretical short form, we compiled the items with the highest average factor loading from each type of MD (i.e., best item per type).
Then, to justify using a one-factor solution and mean scores across waves, we tested the longitudinal measurement invariance of the MMD and both short forms at the scale level by comparing configural, metric, and scalar invariance models across the 11 waves. These models test whether the overall factor structure, strength of item factor relationships, and item thresholds remain stable across time. Specifically, we ensured that the CFI, TLI, RMSEA, and SRMR were within .01 of each other by measure. However, given our sample’s broad age range (14–26), we omitted item-level invariance tests given that strict invariance would be difficult to achieve and is unnecessary for mean comparisons in longitudinal research (Putnick & Bornstein, 2016).
Nevertheless, we also ran two-parameter item response theory (IRT) analyses at each wave. The models used Bayesian estimation, 20,000 iterations (10,000 burn-in), and the item with the highest mean factor loading from the CFAs as the reference point for scaling other parameters. We then averaged values across waves for the standardized estimates of each item’s discrimination (i.e., ability to differentiate levels of MD), thresholds (i.e., points along the latent trait required to endorse higher response categories), and explained variance (R²). Ideally, our items would have discrimination estimates of 0.70, thresholds spanning from -2.0 to 2.0, and R² values greater than 0.50, as this would signal that each retained item stays informative and centrally targeted across waves, allowing it to differentiate reliably along the full MD continuum.
Testing Validity
We first tested the scales’ construct validity by running CFAs of the short forms across every wave of both studies. The models’ average fit statistics across waves were compared, looking for higher CFI and TLI values above 0.95 and lower relative RMSEA and SRMR indices below 0.06. Next, we ran a series of cross-correlational Pearson correlations at wave 1 of the pathways study and wave 10 of the crossroads study. In terms of content validity, we ensured that the short forms were highly correlated with the original scale (correlations above 0.90). For external validity, we tested whether the short forms and full scale were similarly associated with basic demographic variables (sex, race/ethnicity). Then, to test convergent validity, we compared the relationships between the different versions of the MMD and psychopathic traits (PCL: YV for Pathways, ICU for Crossroads). In addition, for criterion validity, we examined the association of the forms with offending and substance use at the same wave, and for discriminant validity examined the relationship between the forms and IQ and age.
Finally, we tested predictive validity with a series of regressions using structural equation modeling (SEM) and maximum likelihood parameter estimation with robust standard errors to account for non-normality of variables and missingness. Using Stata (version 18; StataCorp, 2025), we examined how the MMD and short forms at wave 1 of the pathways study and wave 10 of the crossroads study predicted substance use, offending, the full MMD, and psychopathic traits (YPI or ICU based on the study) at wave 11. The pathways models controlled for sex, race/ethnicity (using the largest group as reference), age, lifetime offending and substance use, and the PCL:YV score, all measured at wave 1. The crossroads models controlled for race/ethnicity and age at wave 1, as well as wave 10 ICU scores and participants’ offending and substance use within the past 12 months. All predictors were set to correlate with each other and all outcomes with each other. The general SEM framework is depicted in Figure 1.
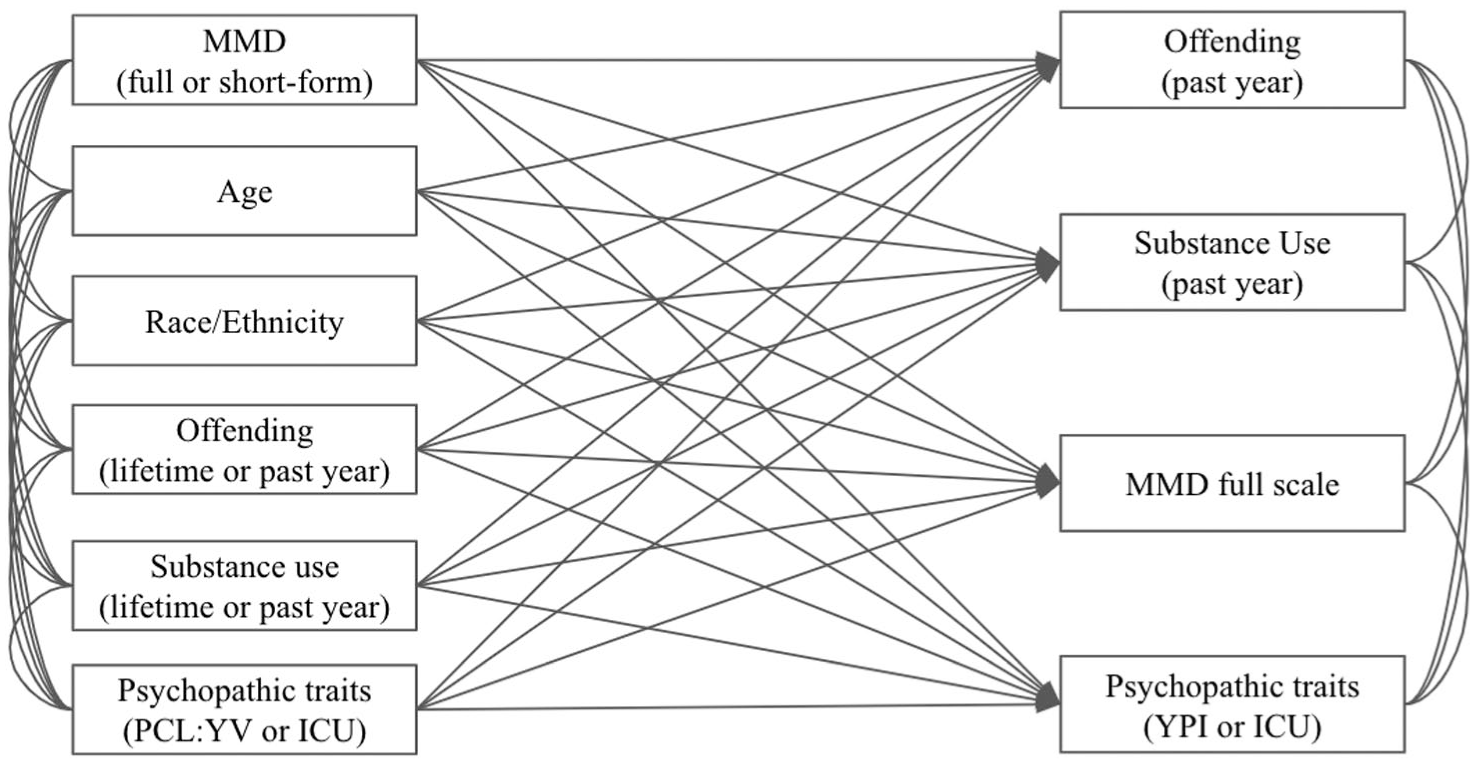
Predictive Validity SEM Models.
Selecting a Short Form
The best form was decided based on the totality of analyses. Specifically, it needed good fit statistics across waves and samples, as well as a high correlation with the original scale. In addition, correlations and regressions between the full scale and short forms should be similar across the variables of interest (i.e., standardized coefficients within 0.05 with matching significance or nonsignificance). However, weaker associations to demographic variables and stronger associations to predictive outcomes will be preferable, as it may point toward more demographic measurement invariance and precise identification of those at risk, respectively.
Results
Identifying Short-Form Items
Model fit indices, eigenvalues, and interfactor correlations from the EFAs are in Table 1. Although model fit improved with additional factors, gains were minimal beyond the three-factor solution, which was consistent with the drop in eigenvalues on the scree plot, where the curve leveled off after the third factor (see Supplemental Figure 1). As such, we focused on the item factor loadings of the one-, two-, and three-factor models (see Supplemental Table 1). The one-factor solution showed consistently strong loadings, with all items exceeding .40 except for item 1 (“It is alright to fight to protect your friends”; loading = .21). The two-factor solution also demonstrated a clear structure, with almost all items uniquely loading on one factor (i.e., ≥ .30 on one, < .30 on the other), with the exception of items 7 and 15 (“Some people deserve to be treated like animals”; “It is okay to treat badly somebody who behaved like a ‘worm’”). However, the two factors were moderately to highly correlated (r = .60), suggesting that they may reflect closely related facets of the same construct. Finally, while the three-factor solution produced lower interfactor correlations (r = .45 to .56), numerous items (3, 11, 21, 27, 29) cross-loaded across factors, reducing the distinctiveness of each. Taken together, while the multifactor solutions are viable, given that prior work often uses a one-factor solution and total scale scores, we leaned on parsimony while deciding to further examine the also adequate one-factor solution.
Model Information From Exploratory Factor Analyses at First Wave of Pathways Study.
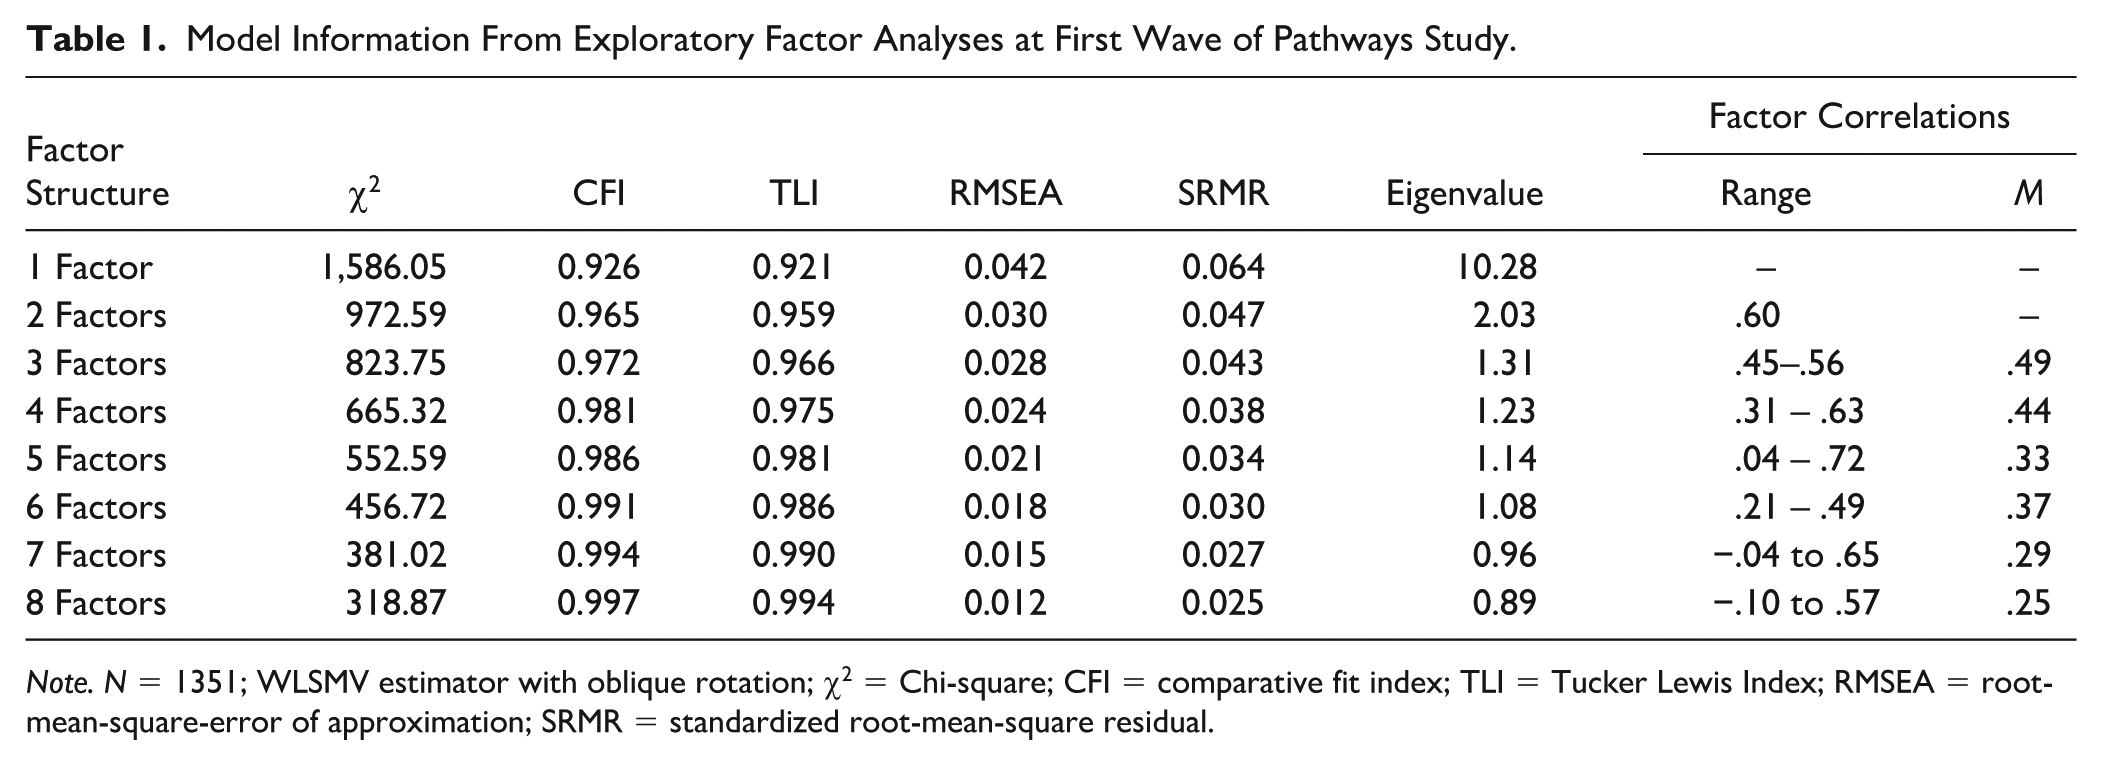
Note. N = 1351; WLSMV estimator with oblique rotation; χ2 = Chi-square; CFI = comparative fit index; TLI = Tucker Lewis Index; RMSEA = root-mean-square-error of approximation; SRMR = standardized root-mean-square residual.
Accordingly, the CFAs revealed that the 32-item MMD displayed good fit across the pathways data, with the average of the fit statistics across the 11 waves displayed in Table 2 and the full CFA results and factor loadings at each wave in Supplemental Tables 2 and 3. In terms of the items’ standardized factor loadings, only item 1 (“It is alright to fight to protect your friends”) displayed poor fit across waves (average standardized factor loading = 0.16), with the remaining items having average standardized factor loadings that ranged from 0.53 (item 4: “A kid in a gang should not be blamed for the trouble the gang causes”) to 0.77 (item 11: “Stealing some money is not too serious compared to those who steal a lot of money”). Of items that met the rounded 0.70 average factor loading threshold, item 15 (“It is okay to treat badly somebody who behaved like a ‘worm’”) had an average factor loading of 0.719 and was the highest loaded item in the Dehumanizing subtype (item 23 in that subtype had a similar average loading of 0.718). In addition, item 27 (“Compared to the illegal things people do, taking some things from a store without paying for them is not very serious”) had an average standardized factor loading of 0.698 across waves. However, given the stated issues with these two items (i.e., meaning of worm; cognitive load of item 27), they were excluded from the short forms. The final data-driven form included 11 items (MMD-11), and the 8-item theoretical form (MMD-8) with the best-fitting item from each subtype of MD replaced item 15 with item 23 (“Someone who is obnoxious does not deserve to be treated like a human being”) for the Dehumanizing subtype (see Table 3 for items included and scale means at the first and last waves analyzed).
Averages of CFA Fit Statistics Across Waves.
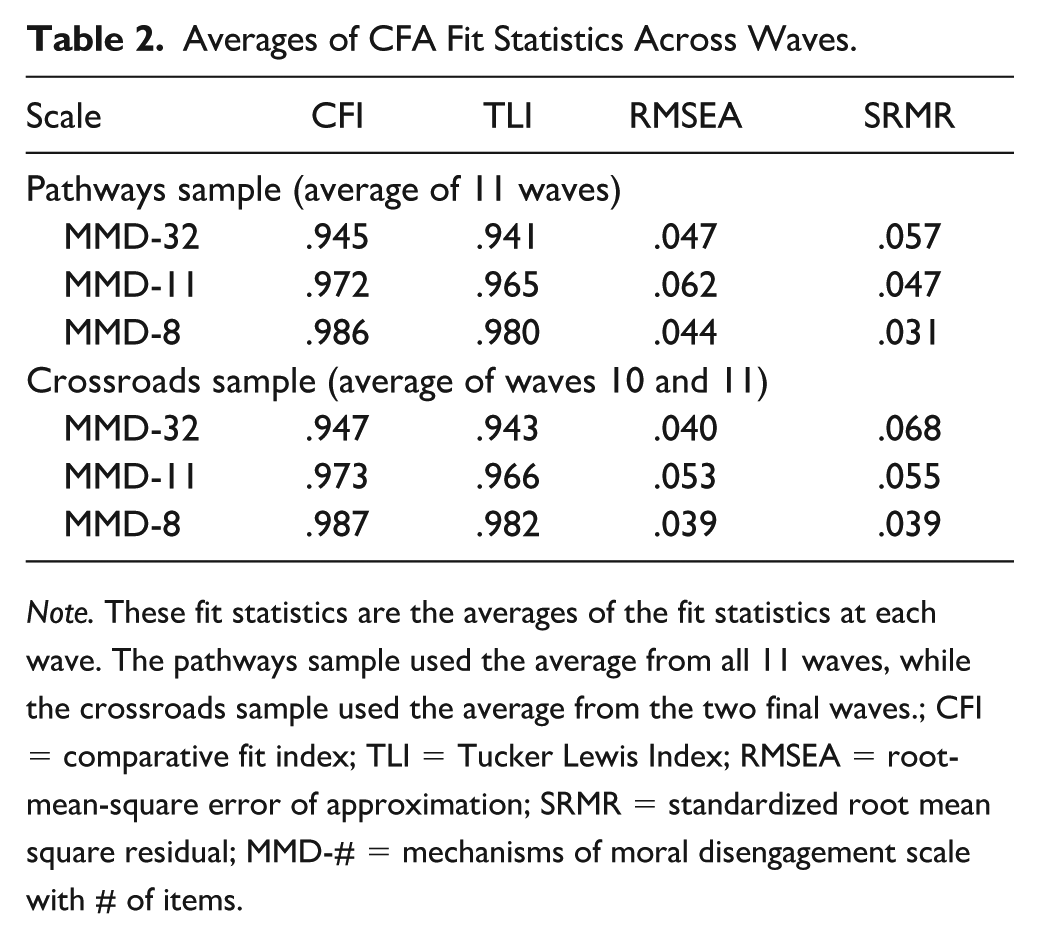
Note. These fit statistics are the averages of the fit statistics at each wave. The pathways sample used the average from all 11 waves, while the crossroads sample used the average from the two final waves.; CFI = comparative fit index; TLI = Tucker Lewis Index; RMSEA = root-mean-square error of approximation; SRMR = standardized root mean square residual; MMD-# = mechanisms of moral disengagement scale with # of items.
Mechanisms of Moral Disengagement Scale and Short Forms.
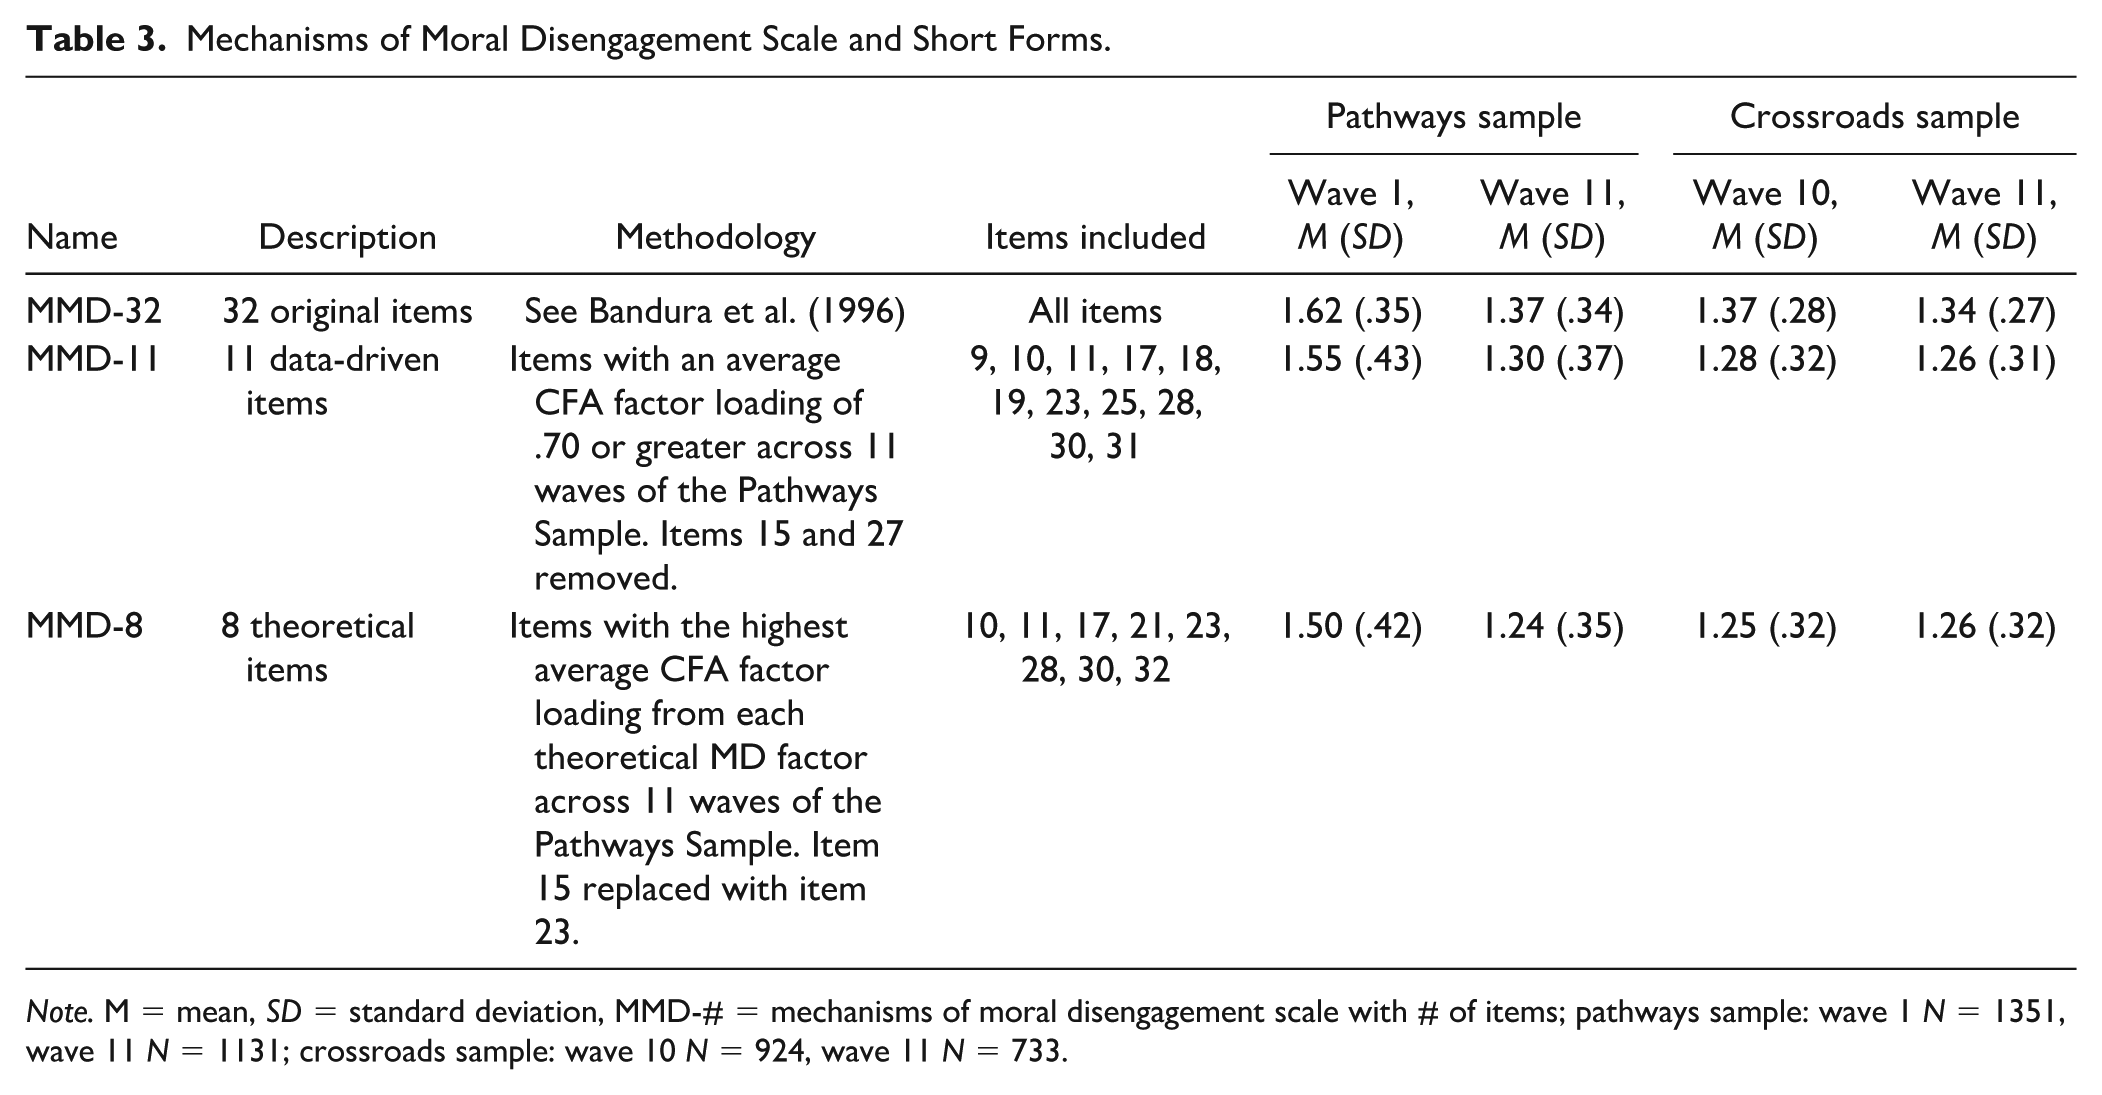
Note. M = mean, SD = standard deviation, MMD-# = mechanisms of moral disengagement scale with # of items; pathways sample: wave 1 N = 1351, wave 11 N = 1131; crossroads sample: wave 10 N = 924, wave 11 N = 733.
We then evaluated the short forms’ items using two-parameter IRT analyses of the full scale, with results across waves in Supplemental Tables 4 and 5, and averages in Supplemental Table 6. The MMD-11 items had strong average discrimination (range = 0.70–0.78) and R2 values (range = 0.50–0.61), indicating that they effectively distinguished individuals with varying levels of MD and reliably accounted for around half of the variance in responses. Although the MMD-8 had two items (21 and 32) slightly below our average discrimination and R2 thresholds of 0.70 and 0.50 (both 0.69 and 0.48, respectively), they remained the strongest Displacement of Responsibility and Attribution of Blame items. Nevertheless, the MMD-8 items had strong average discrimination and R2 values (ranges = 0.69–0.78 and 0.48–0.61, respectively). Furthermore, the average standardized threshold for both short forms’ items showed strong and well-distributed trait coverage (MMD-11 first threshold range = −0.04 to 1.13, second threshold range = 0.68 to 1.72; MMD-8 first threshold range = 0.22 to 1.04; second threshold range = 0.79 to 1.71), capturing low, moderate, and high levels of moral disengagement without substantial gaps. Notably, the MMD-8 did not extend as far into the lower end of the trait as the MMD-11, indicating a slightly diminished ability to discriminate among respondents with minimal MD.
Finally, results of our longitudinal invariance testing revealed that the full measure and both short forms were invariant across the 11 waves at the scale level, as evidenced by similar fit indices across configural, metric, and scalar models (MMD-32: CFI range = 0.984–0.988, TLI range = 0.984–0.987, RMSEA range = 0.041–0.045, SRMR range = 0.061–0.067; MMD-11: CFI range = 0.989–0.992, TLI range = 0.989–0.991, RMSEA range = 0.044–0.047, SRMR range = 0.054–0.059; MMD-8: CFI range = 0.994–0.997, TLI range = 0.994–0.995, RMSEA range = 0.030–0.033, SRMR range = 0.037–0.044). Together, these CFA and IRT analyses provide robust and complementary psychometric support for the items in both the MMD-11 and MMD-8. The CFA results confirmed the strong unidimensional structure and internal consistency of the items, while the IRT analyses further demonstrated the precision of item-level measurement and comprehensive coverage across the MD continuum. In addition, although we modeled MD as a single factor, the items retained in both short forms cover content reflected in the two- and three-factor EFA solutions (i.e., the items loaded on different factors in the multifactor solutions rather than clustering from a single one), further ensuring that the short forms maintain the conceptual breadth of the original measure. Nevertheless, overall, given this strong empirical foundation, we next validated the performance of these short forms across both samples.
Testing Validity
The Cronbach’s alphas across the samples and waves for the MMD-32 range from 0.88 to 0.93, for the MMD-11 range from 0.79 to 0.86, and for the MMD-8 range from 0.69 to 0.83. Next, as depicted in Table 2, the short forms have better statistical fit than the full scale across waves and samples, as evidenced by higher CFI and TLI values and lower RMSEA and SRMR values. Indeed, it appears that the MMD-8 has the best fit indices across serious and moderate offenders. However, as shown in Tables 4 and 5, the MMD-11 is more highly correlated with the full scale and in general, is similarly, if not more, associated with known risk constructs of the full scale (psychopathic traits, offending, substance use). In addition, in terms of discriminant validity, the MMD-8 is significantly correlated with the WASI in the Pathways sample when it should not be, and older, less severe offenders appear to score significantly lower on the MMD-32 than younger ones. However, this is not case for the MMD-11, seemingly indicating that the short form adequately captured the best items across adolescence and young adulthood.
Pearson Correlations at Wave 1 of the Pathways Study.
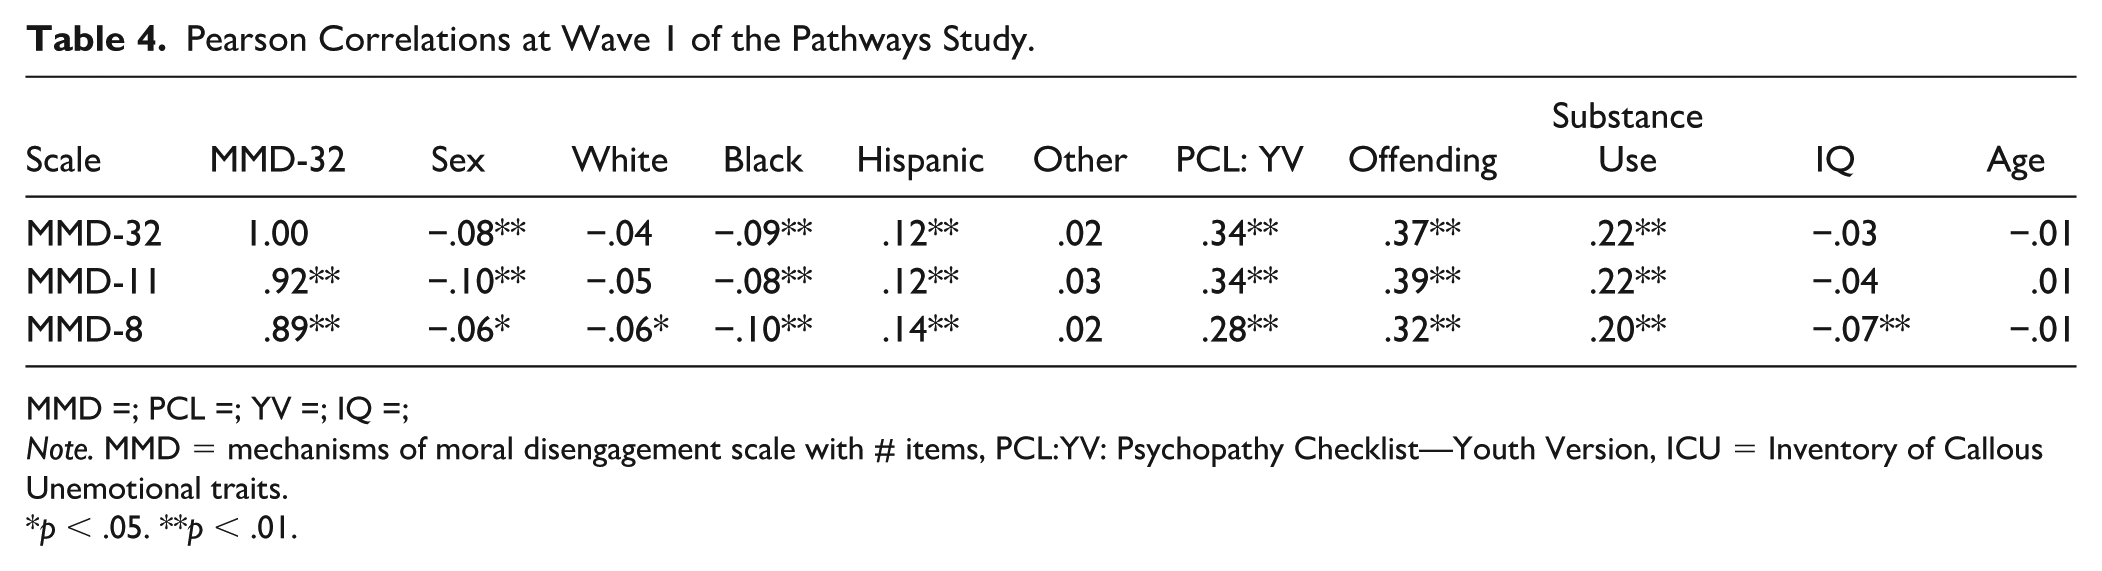
MMD =; PCL =; YV =; IQ =;
Note. MMD = mechanisms of moral disengagement scale with # items, PCL:YV: Psychopathy Checklist—Youth Version, ICU = Inventory of Callous Unemotional traits.
p < .05. **p < .01.
Pearson Correlations at Wave 10 of the Crossroads Study.
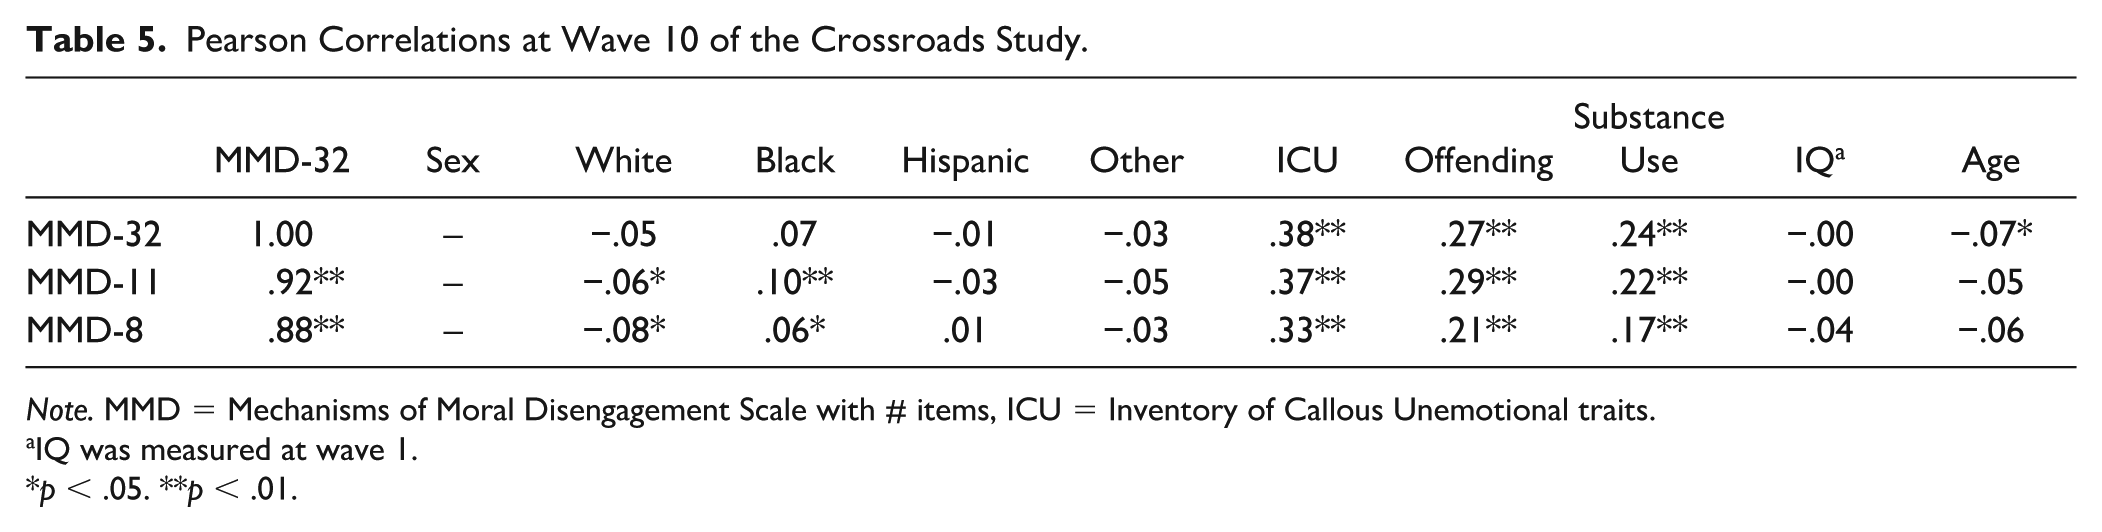
Note. MMD = Mechanisms of Moral Disengagement Scale with # items, ICU = Inventory of Callous Unemotional traits.
IQ was measured at wave 1.
p < .05. **p < .01.
Unlike these results, correlations with the other demographic variables are less clear. Broadly, it appears that the MMD-32, and consequently the short forms, differently measure MD based on the severity level of offenders. This is evident by both mismatching significant findings between samples (e.g., identifying as Hispanic is significantly correlated with the MMD in the Pathways sample but not in the Crossroads sample) and matching significant findings that contrast in directionality (e.g., identifying as Black is negatively associated with the MMD in the Pathways study and positively associated with the MMD short forms in the Crossroads study). Along these lines, although the MMD-8 was significantly associated with being white in both samples while the MMD-11 only had this significant association in the Crossroads sample, the differences in associations with demographics across versions are minor (i.e., less than .05). These findings could be due to psychometric non-invariance flaws of the overall MMD-32 or the Pathways sample including a small percentage of females who appear to score higher on the measure than males. However, post hoc analyses found no significant association between sex and race X2(3, N = 1354) = 6.56, p = .087, and that the male-only subsample of the Pathways study had similar correlations within .03 of their respective full sample results.
Finally, in terms of the predictive models (see Figure 1 and Tables 6 and 7), the short forms generally mirrored the magnitudes and effects of the MMD-32 while controlling for prior scores of the outcomes and demographic information. Specifically, in the Pathways sample, the MMD forms all similarly predicted offending, psychopathic traits, and MMD scores seven years later. In the Crossroads sample, the MMD-11 was slightly less predictive than the MMD-32 and MMD-8 at determining MMD-32 scores two years later, but was slightly more predictive of psychopathic traits than the MMD-8 during that time frame. This is likely due to the MMD-8 maintaining the eight theoretical subtypes of MD that the MMD-32 is based on. However, the MMD-11 was the only scale to significantly predict more types of substances used in the Pathways sample and more offending in the Crossroads sample. Of note, differences and nonsignificant results within and between samples could be due to the robustness of our controls and outcomes within the same model (i.e., including prior substance use and offending, as well as psychopathic traits along with the MMD), sample differences (e.g., offending severity), and the time frame between the predictor and outcomes across studies (i.e., 7 years vs. 2 years later). However, we ran post hoc sensitivity analyses using a 2-year time frame in the Pathways sample and found that the three scales all similarly predicted all outcomes (see Supplemental Table 7).
Predictive Validity From SEM Models: Wave 1 Predicting Outcomes at Wave 11 in the Pathways Sample (N = 1,354).
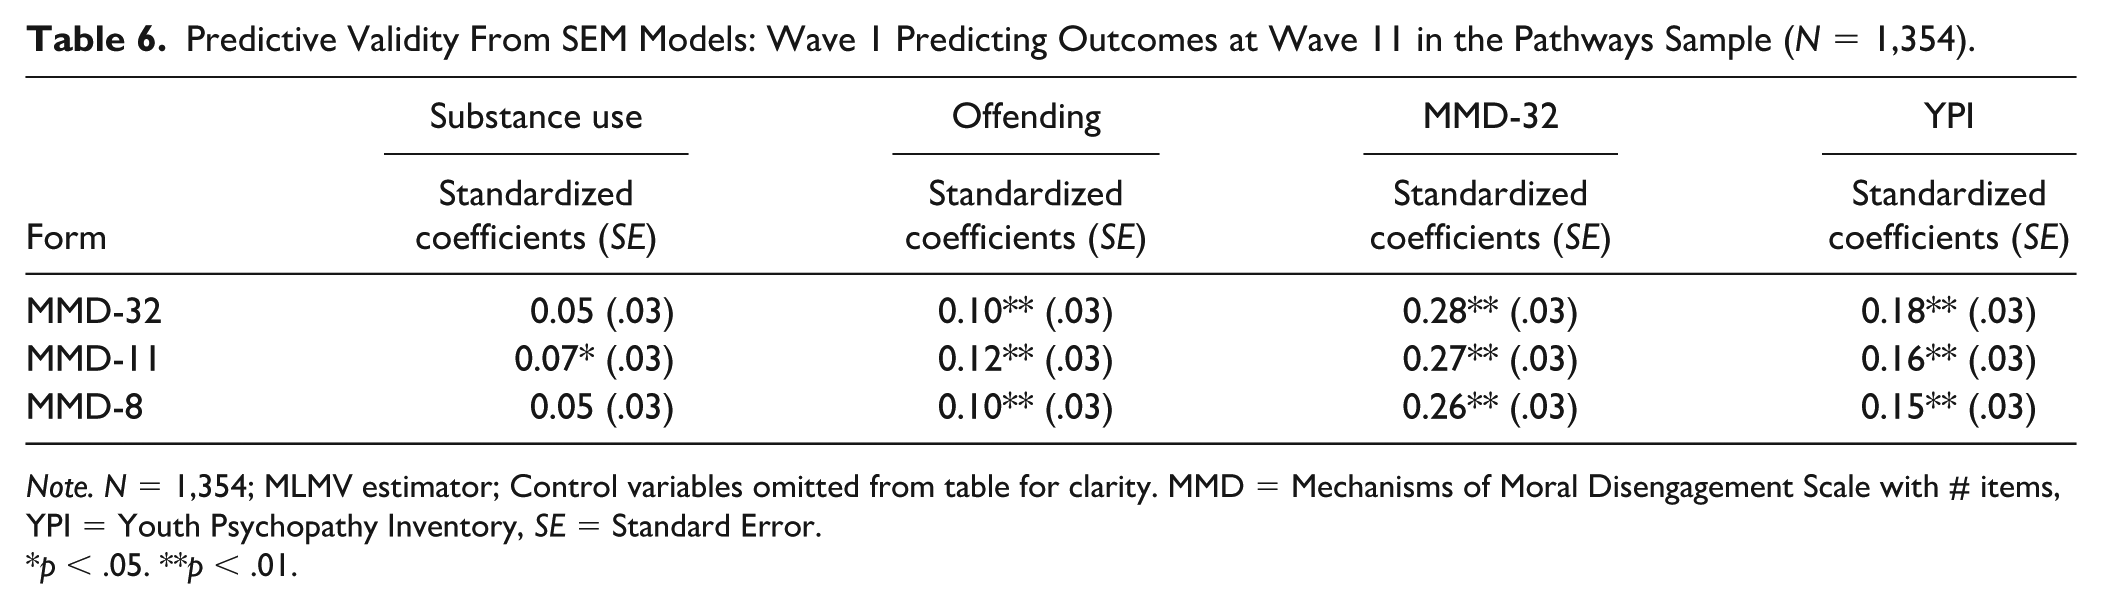
Note. N = 1,354; MLMV estimator; Control variables omitted from table for clarity. MMD = Mechanisms of Moral Disengagement Scale with # items, YPI = Youth Psychopathy Inventory, SE = Standard Error.
p < .05. **p < .01.
Predictive Validity From SEM Models: Wave 10 Predicting Outcomes at Wave 11 in the Crossroads Sample (N = 1,216).
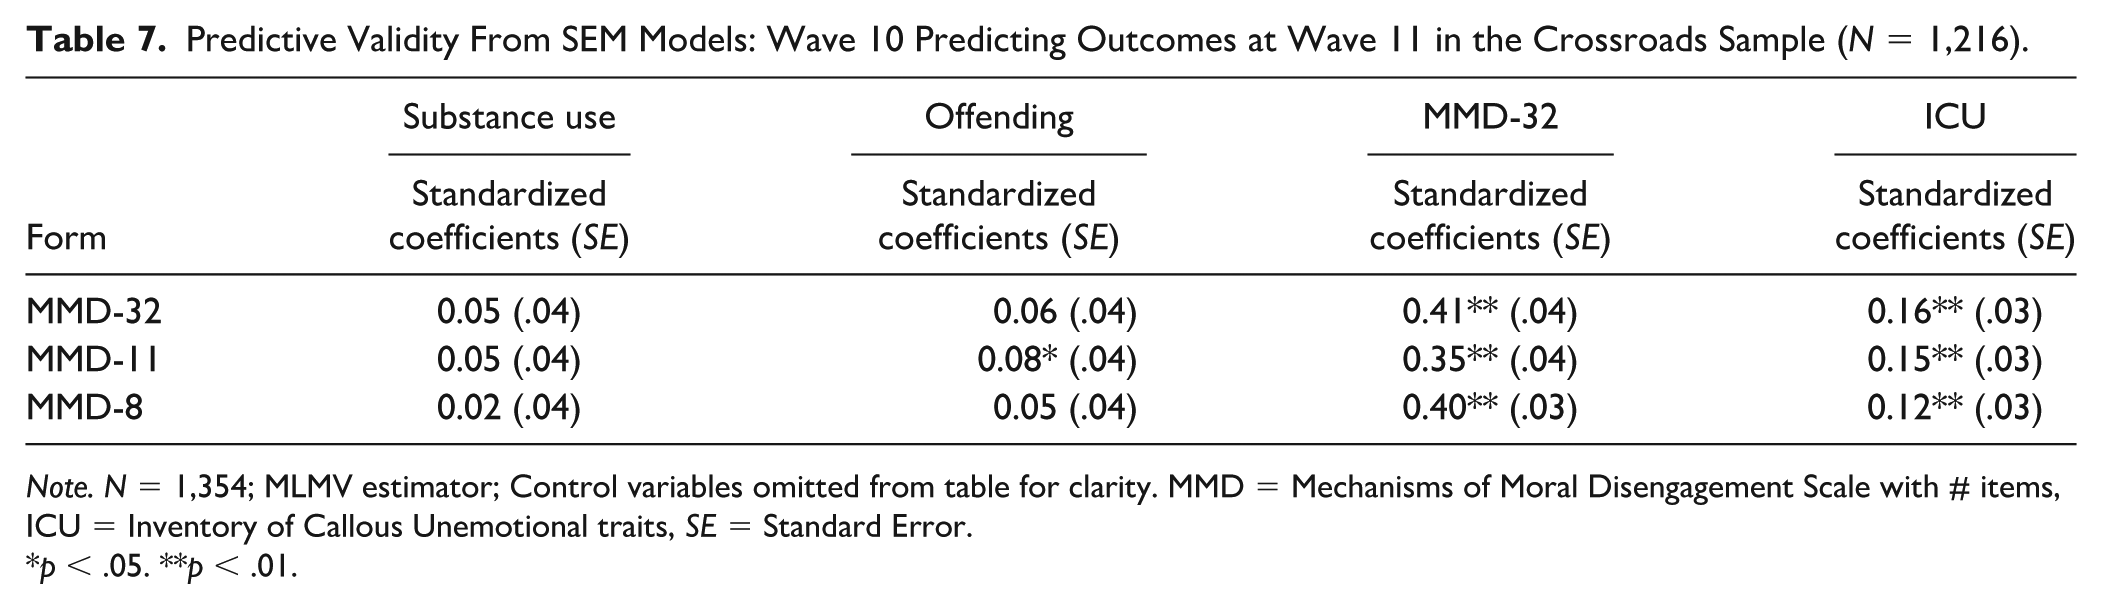
Note. N = 1,354; MLMV estimator; Control variables omitted from table for clarity. MMD = Mechanisms of Moral Disengagement Scale with # items, ICU = Inventory of Callous Unemotional traits, SE = Standard Error.
p < .05. **p < .01.
Selecting a Short Form
Although the MMD-8 has strengths (e.g., best factorial fit, least items, maintains each MD type), it failed our discriminant validity test with IQ and overall does not resemble the full scale in relation to varied related constructs as strongly as the MMD-11 does. In addition, the MMD-11 predicted the later use of more substances and offending when the MMD-32 and MMD-8 did not. Given the totality of the results, we recommend researchers and practitioners use the MMD-11 if they wish to shorten, or replace, the MMD-32 (see Table 8 for items).
Mechanisms of Moral Disengagement – 11 Item Short Form.
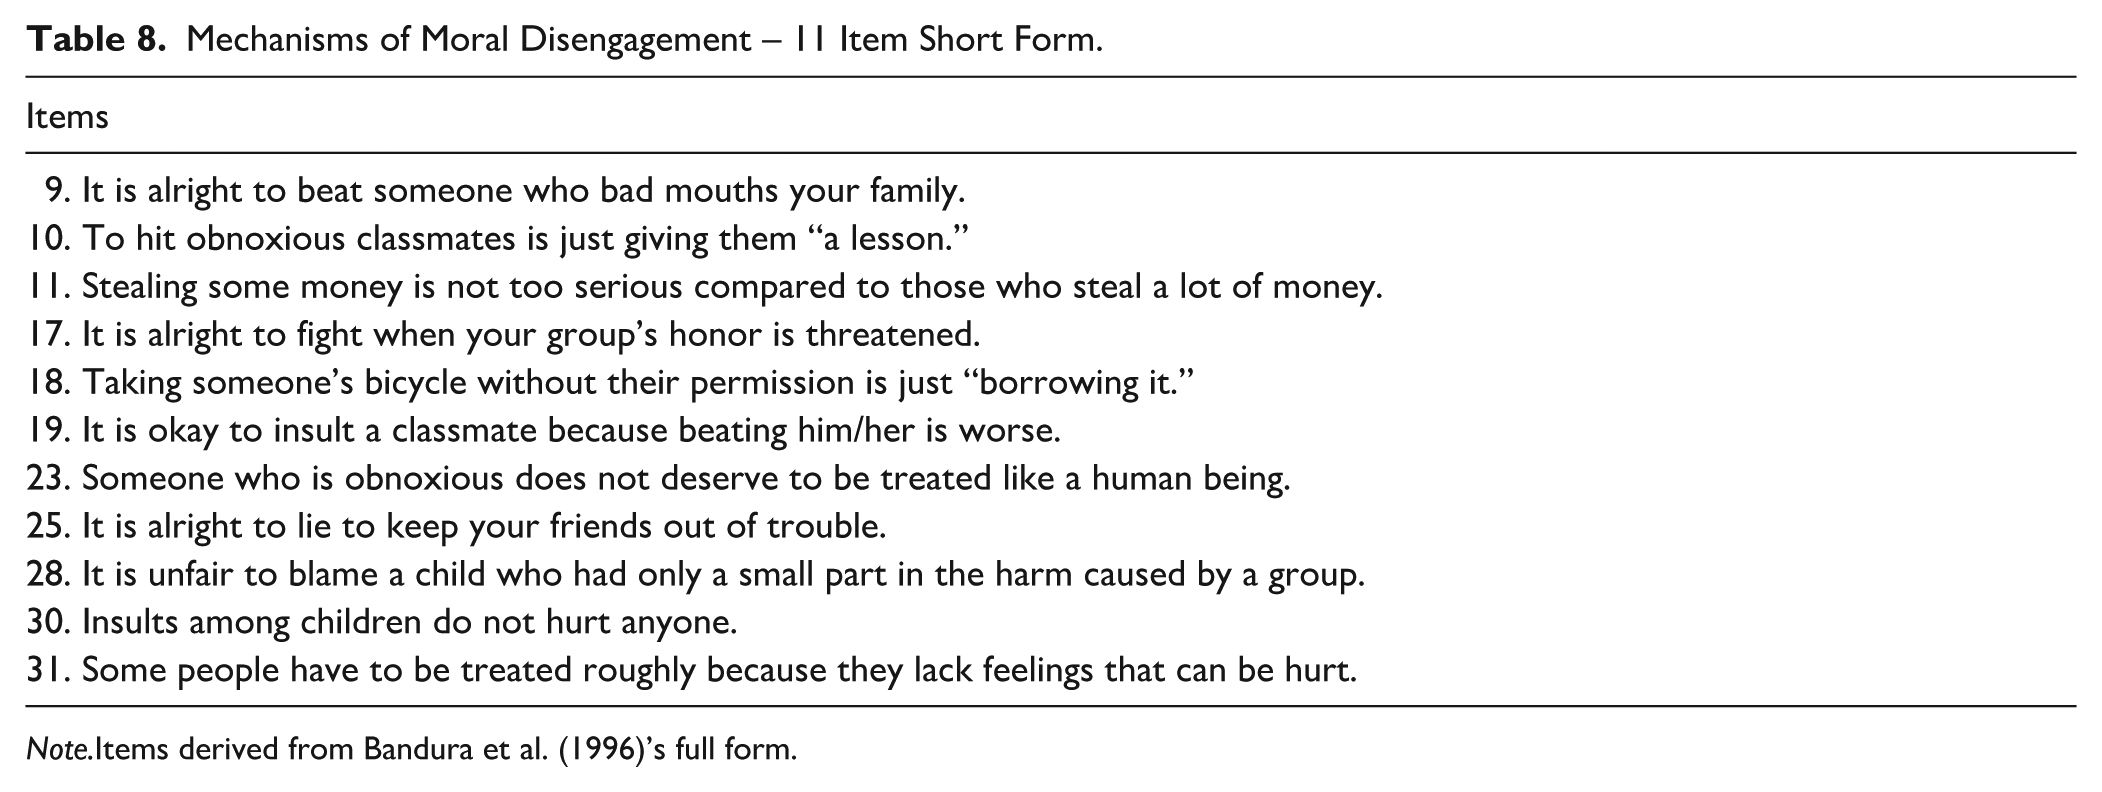
Note.Items derived from Bandura et al. (1996)’s full form.
Discussion
Scientists who conduct human subjects research need assessment tools that are both mindful of participants’ experiences and effective in assessing target constructs. Irrespective of compensation, when participants are asked to complete long or cognitively taxing measures, they may feel disinterested, unfocused, and like their effort outweighs the rewards. This could lead to reductions in effort, careless responding, lying (e.g., if truth telling is effortful), or termination of the survey—all of which contribute to poorer data quality. This may be especially pertinent for individuals with higher MD scores. Specifically, it is plausible that individuals with higher MD may be more likely to justify or rationalize disengaging with questionnaire content, for the sake of time or cognitive drain. In this sense, while it is imperative that all psychological constructs are measured in a manner that is mindful and effective, this may be particularly true in the case of MD. Further, when constructs are measured efficiently, it allows research to include more relevant constructs without unduly burdening participants. With this in mind, we created and validated an 11-item MD short form based on the most used measure of MD, the 32-item MMD.
We leveraged data from two large longitudinal studies of justice-involved youth who were interviewed across adolescence and young adulthood. These samples were ideal for the exploration of MD for two key reasons. First, youth in the Pathways to Desistance study had all been charged with moderate-to-severe offenses (mostly felonies), which makes this a particularly well-suited sample in which to develop a tool for identifying at-risk adolescents and young adults. Second, the longitudinal design allowed for explorations into the long-term psychometric properties and predictive utility of potential short forms. With 13 total waves of data, we established that the MMD-11 has acceptable construct, content, convergent, criterion, discriminant, and predictive validity. Importantly, the predictive models showed that the MMD-11 could differently predict several antisocial outcomes with varying magnitudes of effects within the same model, and in some cases, could do so more effectively than the original scale.
As discussed, we made data-driven and evidence-based item-selection decisions. Of note, item 1 (“It is alright to fight to protect your friends”) had particularly poor fit due to a lack of variability, with most participants responding “agree” across all waves and studies. We suspect this may reflect broader cultural norms that encourage helping friends in need, and suggest this item is particularly unhelpful. In addition, although some items with poor psychometric wording had high factor loadings, they were purposely excluded from the short forms on account of their use of outdated slang and/or undue cognitive complexity. In doing so, the MMD-11 avoids potential confusion (e.g., regarding the meaning of the word “worm”) and mitigates the cognitive load of items so that individuals will have an easier time responding. Finally, by only including items that were representative of the full scale, the MMD-11 more efficiently measures MD and, ideally, will increase the quality of responses through diminished response burden.
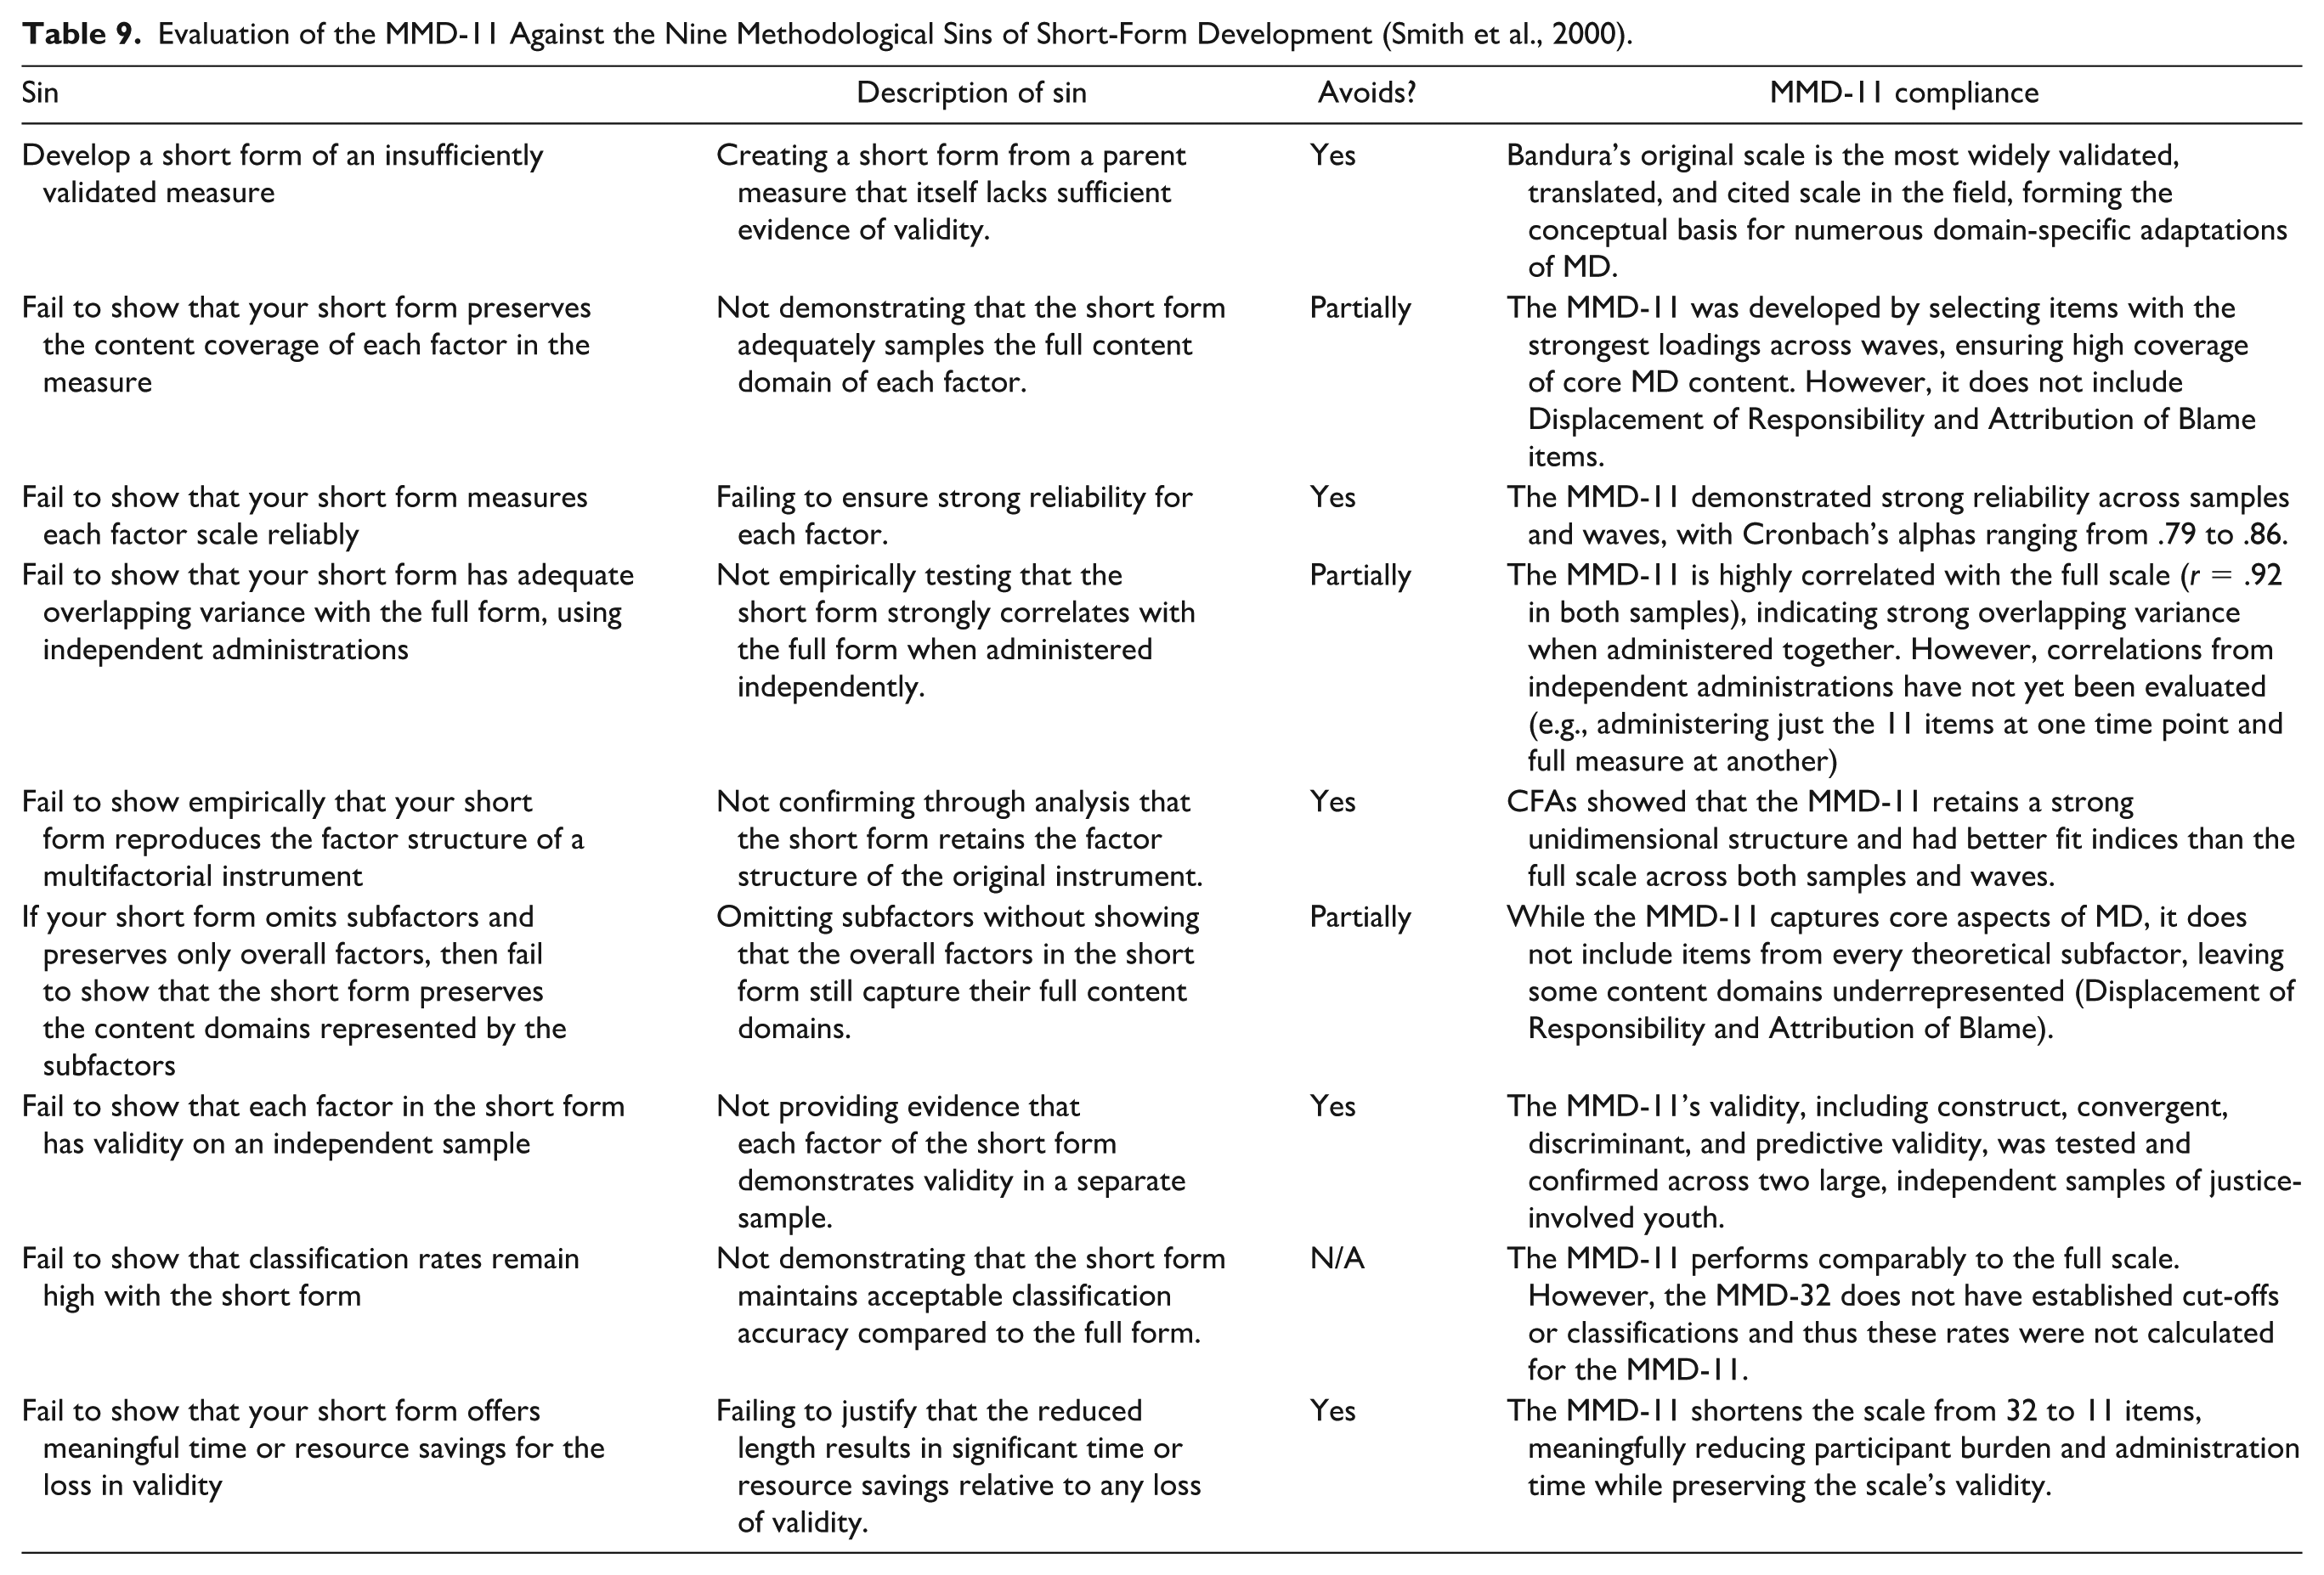
Despite these strengths, it appears that the MMD-32, and consequently the MMD-11, may not be invariant across races, ethnicities, sexes, and/or severity of offenders. Likewise, because only a small subset of participants demonstrated lower cognitive ability scores (i.e., around 15% with IQ scores below 70), it is unclear whether the short forms’ reading complexity is appropriate for individuals with below-average intellectual functioning. Future research will need to examine the intersectionality of these factors to determine how the items and short form differently identify individuals from varying backgrounds (e.g., gender, SES, IQ) and measure their levels of MD. Specifically, further IRT studies (e.g., differential item functioning) of the MMD-32 and MMD-11 are needed to determine the best ways to interpret and use the scales according to individuals’ diverse characteristics and developmental stages. Similarly, researchers will want to validate the MMD-11 across varied samples (e.g., community, non-US, non-male) and age groups (e.g., early childhood), given our reliance on later waves of the Crossroads study for scale validation, as well as validators (e.g., official arrest records, collateral reporting of substance use). The latter is particularly important since the MMD-11 does not include items from the Displacement of Responsibility or Attribution of Blame factors, which could be correlated with important criteria not included in our study (e.g., empathy, perspective taking). Nevertheless, the MMD-11 accomplished its goal of adequately resembling the full scale and identifying those most at risk for varied externalizing problems while avoiding most of the major pitfalls outlined in Smith and colleagues’ (2000) sins of short-form development (see Table 9).
Evaluation of the MMD-11 Against the Nine Methodological Sins of Short-Form Development (Smith et al., 2000).
Looking ahead, despite the strong fit of a one-factor model, researchers may want to further tease apart multi- and unexplored-factor structures of the MMD to ensure its effective usage. Specifically, while the one-factor model provided the most parsimonious fit in our EFA results, the two- and three-factor solutions also emerged as viable, suggesting that certain item clusters may capture distinct facets of MD. This pattern likely reflects the measure’s original design, as the MMD was not developed using rigorous psychometric procedures. As such, the four items in each of the eight theorized types rarely load onto their respective factor without cross-loading, ultimately producing a one-factor solution as the best fit model. However, little work has explored the use of a bifactor approach to analyze MD, which would account for both the shared effects of a broad MD factor (i.e., cross-loadings), as well as the specific effects of the eight subfactors. Indeed, these models have been found to yield more precise information beyond standard total scores in other risk-screeners (e.g., adverse childhood experiences; Decrop et al., 2024). Alternatively, perhaps the MMD has unintended factors that must be accounted for. For example, several of the items are in relation to a group, while others seem to tap into an antisocial or violent outlook. Either way, more psychometric studies of the MMD are needed.
Along these lines, it is important to acknowledge that our study relied exclusively on analyses of items embedded within the full scale. Consequently, administering the short form on its own may yield different response patterns due to reduced fatigue or item-context effects. As such, future research should validate the MMD-11 as a standalone measure in new samples to confirm its psychometric strengths. In addition, the MMD-11’s ability to predict outcomes should be validated through receiver operating characteristic analyses that identify thresholds and cut-off points that balance sensitivity, specificity, and predictive values across demographic groups to ensure equitable functioning. This will help create detailed guidance on administration, scoring interpretation, and measure limitations for its ethical and responsible use across settings.
Conclusion
Psychometric studies often don’t have strong theoretical implications, but they can have incredibly practical ones. In this study, we created and validated a short-form version of the most widely used measure of MD by cutting out 21 items while maintaining the overall properties of the scale and construct. Based on our results, we encourage researchers and practitioners to use the MMD-11 to help identify those most at risk for externalizing problems and crime.
Supplemental Material
sj-docx-1-asm-10.1177_10731911251407472 – Supplemental material for “Why Bother? There’s Always Another Question”: Shortening Bandura’s Mechanisms of Moral Disengagement Scale
Supplemental material, sj-docx-1-asm-10.1177_10731911251407472 for “Why Bother? There’s Always Another Question”: Shortening Bandura’s Mechanisms of Moral Disengagement Scale by Romain Decrop, Emma Rodgers, Paul J Frick, Laurence Steinberg and Elizabeth Cauffman in Assessment
Footnotes
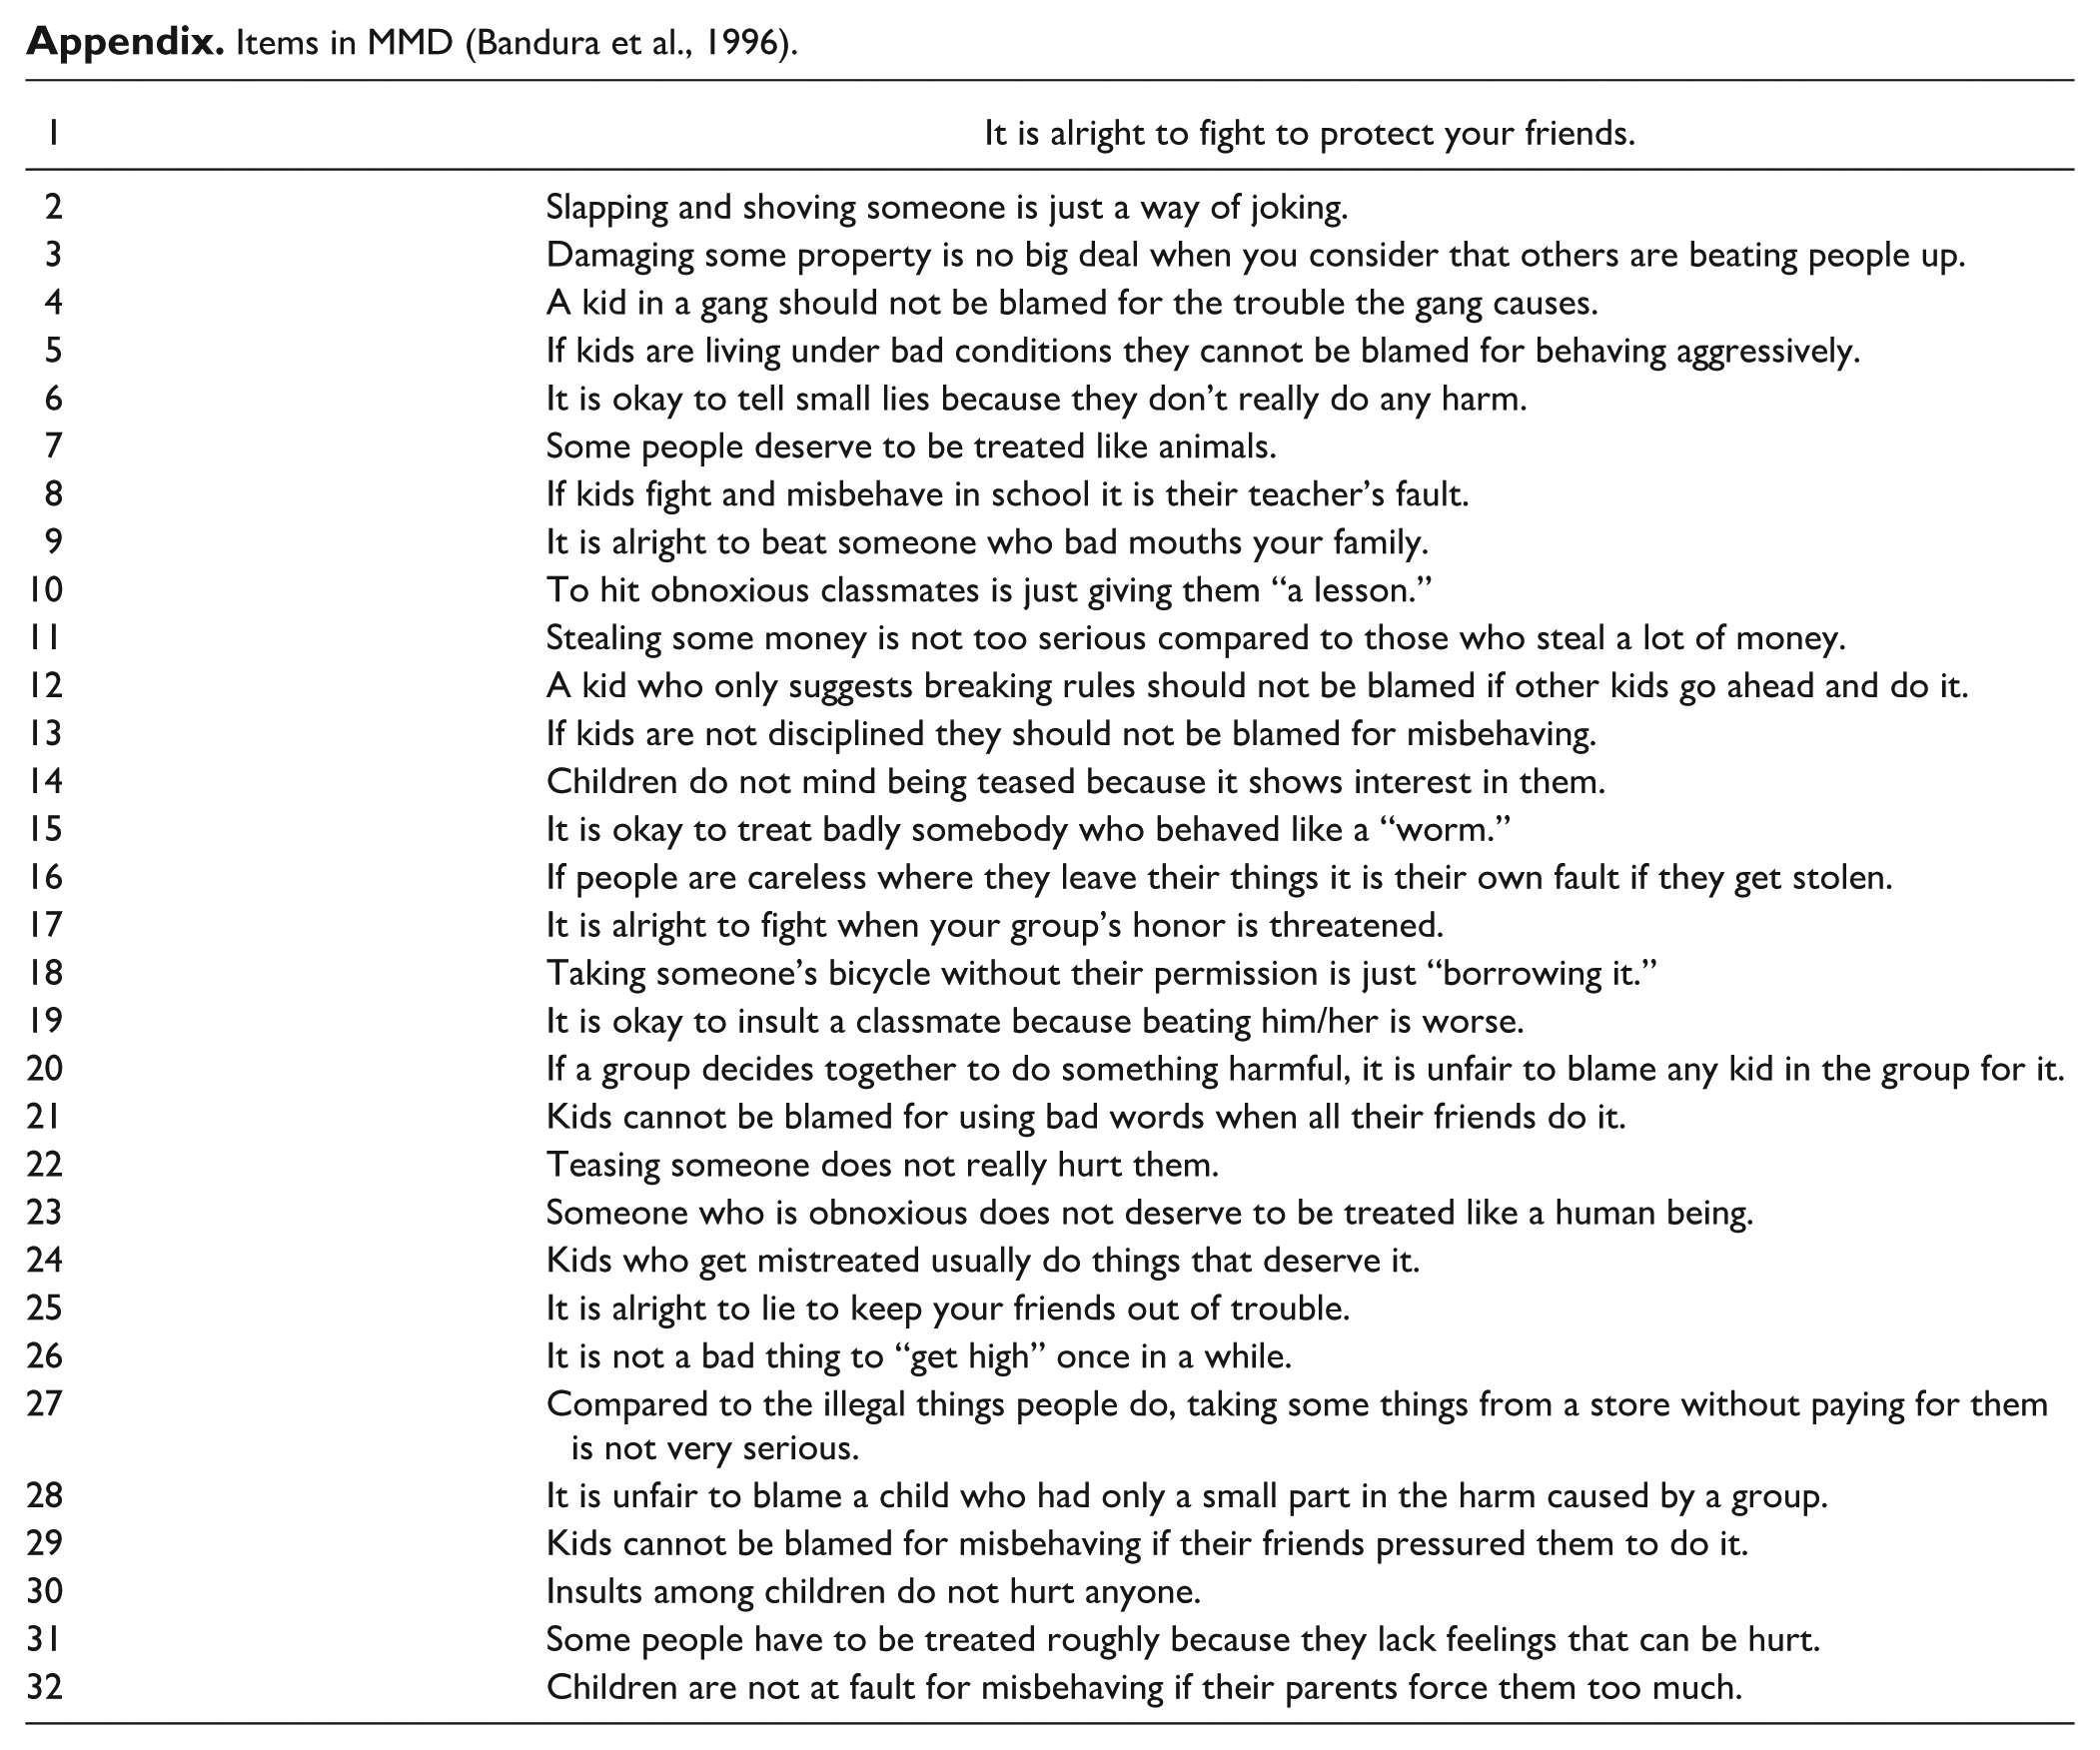
Appendix
Items in MMD (Bandura et al., 1996).
| 1 | It is alright to fight to protect your friends. |
|---|---|
| 2 | Slapping and shoving someone is just a way of joking. |
| 3 | Damaging some property is no big deal when you consider that others are beating people up. |
| 4 | A kid in a gang should not be blamed for the trouble the gang causes. |
| 5 | If kids are living under bad conditions they cannot be blamed for behaving aggressively. |
| 6 | It is okay to tell small lies because they don’t really do any harm. |
| 7 | Some people deserve to be treated like animals. |
| 8 | If kids fight and misbehave in school it is their teacher’s fault. |
| 9 | It is alright to beat someone who bad mouths your family. |
| 10 | To hit obnoxious classmates is just giving them “a lesson.” |
| 11 | Stealing some money is not too serious compared to those who steal a lot of money. |
| 12 | A kid who only suggests breaking rules should not be blamed if other kids go ahead and do it. |
| 13 | If kids are not disciplined they should not be blamed for misbehaving. |
| 14 | Children do not mind being teased because it shows interest in them. |
| 15 | It is okay to treat badly somebody who behaved like a “worm.” |
| 16 | If people are careless where they leave their things it is their own fault if they get stolen. |
| 17 | It is alright to fight when your group’s honor is threatened. |
| 18 | Taking someone’s bicycle without their permission is just “borrowing it.” |
| 19 | It is okay to insult a classmate because beating him/her is worse. |
| 20 | If a group decides together to do something harmful, it is unfair to blame any kid in the group for it. |
| 21 | Kids cannot be blamed for using bad words when all their friends do it. |
| 22 | Teasing someone does not really hurt them. |
| 23 | Someone who is obnoxious does not deserve to be treated like a human being. |
| 24 | Kids who get mistreated usually do things that deserve it. |
| 25 | It is alright to lie to keep your friends out of trouble. |
| 26 | It is not a bad thing to “get high” once in a while. |
| 27 | Compared to the illegal things people do, taking some things from a store without paying for them is not very serious. |
| 28 | It is unfair to blame a child who had only a small part in the harm caused by a group. |
| 29 | Kids cannot be blamed for misbehaving if their friends pressured them to do it. |
| 30 | Insults among children do not hurt anyone. |
| 31 | Some people have to be treated roughly because they lack feelings that can be hurt. |
| 32 | Children are not at fault for misbehaving if their parents force them too much. |
Acknowledgements
The authors would like to thank all those involved in the data collection and dissemination of the Pathways to Desistance and Crossroads Studies.
Data Availability Statement
The data from the Pathways to Desistance study are openly available in ICPSR at https://icpsr.umich.edu/web/NAHDAP/studies/29961. Data from the Crossroads study is not publicly available, but reasonable requests for the data can be requested from the investigators of the original study. Contact information can be found at ![]() .
.
Declaration of Conflicting Interests
The authors declared no potential conflicts of interest with respect to the research, authorship, and/or publication of this article.
Funding
The authors received no financial support for the research, authorship, and/or publication of this article.
Ethical Approval Statement
The University of California, Irvine’s Institutional Review Board approved this secondary data analysis study on August 15th, 2023 (IRB #20141706).
Consent for Publication
Not applicable.
Informed Consent Statement
Written parental or participant consent was obtained when data was originally collected. This consent included permission for researchers to later conduct secondary data analyses like the current study. Information on the Pathways to Desistance study procedures and measures can be found in Schubert et al. (2004) or at pathwaysstudy.pitt.edu, while those for the Crossroads Study can be found at ![]() .
.
Supplemental Material
Supplemental material for this article is available online.
Methodological Disclosure
We report how we determined our sample size, all data exclusions, all manipulations, and all measures in the study.