
Abstract
Assessing the credibility of presented problems is an essential part of the clinical evaluation of attention-deficit/hyperactivity disorder (ADHD) in adulthood. We conducted a systematic review and meta-analysis to examine Continuous Performance Tests (CPTs) as embedded validity indicators. Eighteen studies (n = 3,021; 67 effect sizes) were analyzed: eight simulation studies and ten analogue studies. Moderating variables included study design (simulation vs. criterion) and sample type (student vs. nonstudent). CPTs effectively distinguish between credible and noncredible performance (g = 0.73). Effect sizes were nearly twice as large in simulation studies (g = 0.94) compared to criterion group studies (g = 0.55), underscoring the influence of study design on the interpretation of research findings. Student and nonstudent groups did not differ significantly. CPTs are valuable as embedded validity indicators. Given the moderate effects, clinical decisions should not rely on a single CPT but on a variety of measures.
Keywords
Background
Continuous Performance Tests (CPTs) are among the most commonly used neuropsychological tasks in both clinical practice and research on attention-deficit/hyperactivity disorder (ADHD; Pettersson et al., 2018). CPTs are computerized tasks that measure how well a person can stay focused and control their responses (DuPaul et al., 1992; Fuermaier et al., 2019, 2024). During a CPT, individuals are usually asked to respond quickly to certain visual or auditory signals while ignoring others. These tasks provide an objective way to measure attention and response control, unlike self-report questionnaires or clinical interviews that rely on someone’s memory or personal interpretation (Pagán et al., 2023; Rosvold et al., 1956). CPTs have been used in research and clinical practice since the 1950s (Pagán et al., 2023; Rosvold et al., 1956), and many versions have been developed over time. CPTs are commonly used within ADHD assessments to provide a better understanding of the cognitive problems that occur frequently. For example, at the group level, adults with ADHD show longer reaction times, greater variability, more distractibility (omissions), and more impulsive behavior (commissions) in comparison to adults without ADHD. Sometimes, CPT performance patterns may appear atypical compared to what is commonly observed in adults with ADHD. For example, an individual might show extremely slow reaction times or an unusually high number of errors that deviate from established response patterns. Such atypical results may indicate noncredible performance, meaning that the observed test scores might not accurately reflect the person’s actual cognitive abilities (Larrabee, 2012). In this respect, CPTs can be classified as embedded performance validity indicators that help the clinician to validate the performance level while also using the same test data to assess cognitive functioning (Rogers, 2018). Previous studies have found some promising evidence that CPTs can be useful as embedded performance validity indicators in adult ADHD assessments. However, the results have not been consistent across studies. This inconsistency raises questions about the reliability and generalizability of previous findings and highlights the need for the current meta-analysis to evaluate the utility of CPTs in assessing performance validity in adults undergoing ADHD assessment.
Performance tests, including CPTs, are not mandatory components of diagnostic evaluations of ADHD. While only self-report measures are required for establishing a diagnosis, performance tests are still frequently employed by clinicians, with approximately 30% reporting their use to assess impairment (Fuermaier et al., 2024). They hold an important role in the diagnostic process, particularly for treatment planning and clinical decision-making. When CPTs are included in the assessment of ADHD, it is essential to evaluate their validity given that the estimated prevalence of noncredible responding ranges from 9% to 16% (Mascarenhas et al., 2023; Ovsiew et al., 2023). Clinicians are generally not able to reliably detect or predict noncredible performance solely based on their clinical judgment (Dandachi-FitzGerald et al., 2017; Faust et al., 1988). The failure to include such validity measures may lead to the interpretation of invalid neuropsychological performance data, which can negatively affect the diagnostic assessment, treatment recommendations, and evaluation. The importance of incorporating validity tasks in neuropsychological assessments is emphasized by statements from the National Academy of Neuropsychology (NAN; Bush et al., 2005) and the American Academy of Clinical Neuropsychology (AACN; Sweet et al., 2021).
Noncredible performance can appear in various forms, such as malingering, factitious disorder, careless responding due to boredom, and the inability to perform the task according to instructions because of severe psychopathology or cognitive dysfunction. These forms of noncredible performance may have different underlying and interacting reasons. The interaction between the fundamental factors motivation, setting, and performance capacity may explain why people perform in a noncredible way (Dandachi-FitzGerald et al., 2024). Malingering, for example, may be the result of an extrinsic motivation to receive financial compensation, access to medication, or legal advantages. However, more intrinsic motivational factors can also explain noncredible test performance, for example, when people adopt a sick role (e.g., factitious disorder) or use symptoms as an excuse for failure. Performance is also influenced by the setting, which may include research participation, forensic evaluations, clinical treatment, or academic assessments. For example, students participating in research to obtain mandatory course credits may respond carelessly (DeRight & Jorgensen, 2015). In contrast, an individual undergoing a forensic evaluation to determine eligibility for disability benefits is more likely to exhibit malingering (Sweet et al., 2021). Another important factor is performance capacity, which reflects an individual’s actual cognitive and emotional ability to meet the demands of testing. For example, in some cases, individuals with significant cognitive impairments (i.e., dementia) may exhibit performance patterns resembling intentional underperformance (McGuire et al., 2019). However, these patterns may not stem from deceptive intent (e.g., feigning or malingering) but rather from a genuine inability to engage with the task effectively. Understanding the reasons for noncredible performance necessitates an integrated understanding of motivational factors, setting, and performance capabilities.
CPTs can be classified as embedded performance validity indicators. In contrast to freestanding performance validity indicators, which are designed to solely measure performance validity, embedded validity indicators, such as atypical hit patterns and reaction times, are derived from existing neuropsychological tests (Sweet et al., 2021). The benefit is that, if the test results are deemed valid, the collected test data can be interpreted and used in the clinical evaluation, which saves time and clinical resources. For example, if an attention test contains an embedded validity indicator, the clinician is able to validate the performance level while also using the same test data to assess cognitive functioning, which may reduce the need to administer separate validity and attention tests.
While this dual function makes embedded validity indicators efficient tools in clinical practice, their value depends on their discriminative accuracy. To examine how well CPTs distinguish between credible and noncredible performance, we calculated an effect size that reflects the size of the difference between two groups: individuals with a credible CPT performance and those whose performance was classified as noncredible. In this context, a larger effect size means that a CPT is better able to differentiate individuals who are responding in a credible manner from those whose test data suggest noncredible responding. The utility of CPTs as embedded performance validity indicators for distinguishing credible from noncredible performance in adult ADHD assessments has been investigated in various studies. While some studies have yielded promising results supporting the use of CPTs as embedded performance validity indicators in distinguishing credible from noncredible performance (C. Berger et al., 2021; Quinn, 2003; Winter & Braw, 2022), these findings have not been consistently replicated (Scimeca et al., 2021; Sollman et al., 2010; Suhr, Sullivan, & Rodriguez, 2011). This discrepancy suggests a lack of stability in the observed effects, raising questions about the generalizability of these findings. To better understand this variability, we examine four key moderators in our meta-analysis.
The first important source of variability lies in the diversity of CPTs assessed across studies. Clinicians and researchers are often uncertain about which specific CPT variant to use. Different CPTs measure different aspects of cognitive functioning. For example, the Perception and Attentional Functions test (WAFV) from the Vienna Test System (VTS; Schuhfried, 2013), includes tasks where participants respond to rare target stimuli. This design is monotonous, making it a measure of sustained attention and vigilance as performance must be maintained over time despite low levels of targets (Tucha et al., 2017). In contrast, other tasks, such as the Test of Variables of Attention (TOVA; Leark et al., 2007), have a mixed test design. The first half of test administration is regarded as “low‑stimulation,” with rare targets, while the second half is “high‑stimulation,” with more frequent targets. Although these CPTs vary in length and cognitive demands, many assess overlapping cognitive functions. Therefore, it remains an open question whether different CPT variants vary substantially in their sensitivity to noncredible performance.
The second source of variability is that the differences not only exist between various CPTs themselves but also in the specific outcome measures used to assess performance. There is also considerable uncertainty among clinicians and researchers regarding which specific CPT outcome measures are most informative, including indicators of processing speed, measures of distractibility (e.g., omissions), and measures of impulsivity (e.g., commissions). This uncertainty largely stems from the absence of studies directly comparing different CPT outcome measures in the context of embedded performance validity indicators in ADHD. We selected omission errors, commission errors, reaction time, and reaction time variability as our four main outcome measures. Additional measures, such as Hit Reaction Time Block Change or Hit Reaction Time Inter-Stimulus Interval Change from Conners-3, are derived from at least one of these core measures and are thus not independent from these core outcomes (Conners, 2014). Another argument to focus on the four indices is that they are included in the majority of studies.
Several studies have not identified any single CPT outcome measure that consistently outperforms others (Fuermaier et al., 2022; Robinson et al., 2023). Thus, we explored potential differences in the sensitivity of CPT outcome measures without presuming that any particular metric would show superior discriminative value.
The third source of variability is the variation in study designs. Some studies employed a criterion-group design, in which clinical data, often accessed from routine clinical care, are utilized. Within this design, the researcher examines two sets of clients: one group highly suspected of performing noncredibly according to an external credibility criterion (typically one or more established validity tasks), and another group highly likely of performing credibly according to the same criterion. All clients complete the CPT. While the CPT is originally designed as an attention test, in this context, it is used as a measure of validity. Thus, in this design on the development of embedded measures, researchers do not compare one validity test against another; rather, they compare a routine clinical measure (i.e., performance on the CPT) against a criterion of credibility. One of the main advantages of this approach is the high external validity because the study is carried out in clinics with clients who are performing the tests for practical reasons (Schroeder et al., 2019).
In contrast, other studies adopt a simulation group design (also called analogue design, see Rogers, 2018), in which clinical data of individuals with ADHD who were classified as credible based on a criterion of credibility (typically one or more validity tasks) are compared to the CPT performance of individuals without ADHD who were instructed to either perform normally or feign ADHD in an experimental setting (Rogers, 2018). In this study, we included only adults without ADHD instructed to feign and those in the credible group, as our aim was to examine whether CPTs can distinguish between these two groups. The advantage of this approach is the strong internal validity due to operationalized circumstances, consistent instructions, and manipulation checks (Rogers, 2018). The methodological differences between these two designs are nontrivial because individuals in criterion-group designs within a clinical setting may be more cautious to avoid detection, as it can impact their clinical trajectory, leading to more subtle effects. In contrast, individuals in simulation studies are explicitly instructed to simulate or feign ADHD characteristics, and are therefore more likely to exaggerate these characteristics. Thus, each design has distinct implications for the validity and interpretation of the results. Although it has been noted that effect sizes differ between simulation and criterion-group designs (Rogers, 1993), these differences have not been systematically evaluated across studies. This represents an important gap, as understanding the magnitude of these discrepancies is critical for interpreting the discriminative ability of CPT indicators. We hypothesized that simulation designs produce larger effect sizes relative to criterion-group designs.
The fourth source of variability is the sample composition. A substantial number of studies relied on student samples. Students in the criterion group design may have a more clear incentive to simulate ADHD characteristics, as a diagnosis may grant access to academic accommodations such as extended testing time, private test-taking environments, and reduced academic workload (Sullivan et al., 2007; Tucha et al., 2015). Furthermore, access to medication is an especially relevant incentive for students, as many may view the prescription of medication as a means to enhance academic performance, concentration, and alertness (e.g., Faraone et al., 2020). Given the widespread belief in the academic benefits of these medications and the relative ease of obtaining or sharing them both on and off campus, college students are likely disproportionately affected by misuse and diversion (Garcia et al., 2022). In a survey with over 1,000 students in the Netherlands, more than half believe it is easy to simulate ADHD (Fuermaier et al., 2021). Students often have heightened access to social and online resources related to ADHD characteristics, which may increase their ability to simulate characteristics during assessments. We therefore hypothesized that studies with nonstudent samples had larger effects compared to student samples.
In conclusion, the current body of research on the utility of CPTs as embedded performance validity indicators in ADHD assessment is characterized by inconsistencies in findings and methodological variability. We had two main objectives. First, we aimed to assess the general utility of CPTs as embedded performance validity indicators for detecting noncredible performance in ADHD assessments. We hypothesized that CPTs would demonstrate moderate effectiveness in distinguishing credible from noncredible performance. Second, we explored four potential sources of variability. To the best of our knowledge, this is the first meta-analysis to synthesize the evidence on CPTs as embedded performance validity indicators.
Method
We conducted the systematic review in accordance with the Preferred Reporting Items for Systematic Reviews and Meta-Analyses (PRISMA) 2020 guidelines for reporting systematic reviews (Page et al., 2021). The corresponding PRISMA checklist is provided in Supplement 1.
Literature Search
We registered our multilevel meta-analysis on Open Science Framework (OSF; DOI 10.17605/OSF.IO/PBDYV). P.T. searched for articles until February 2025 using scientific databases (i.e., PsycInfo, Scopus, PubMed, Web of Science, and Google Scholar). Furthermore, references of identified articles were checked to include all relevant studies meeting the inclusion criteria. The search was performed with the following essential keywords: “ADHD,” “Performance validity test,” “Continuous performance test,” “Malingering,” “non-credible performance,” and “Adult” (for full search terms per database, see Supplement 2). A.B.M.F., who has expertise in this area, compiled a reference list over the years and supplemented the literature search. Each article was reviewed by first screening the title and abstract, followed by a thorough examination of the full text based on the inclusion criteria. If a paper did not provide the necessary information, P.T. contacted the authors via email. Refer to Figure 1 for a flowchart outlining the search process and see Supplement 3 for a list of studies that appeared to meet the inclusion criteria, but which were excluded, and the reasons for exclusion.
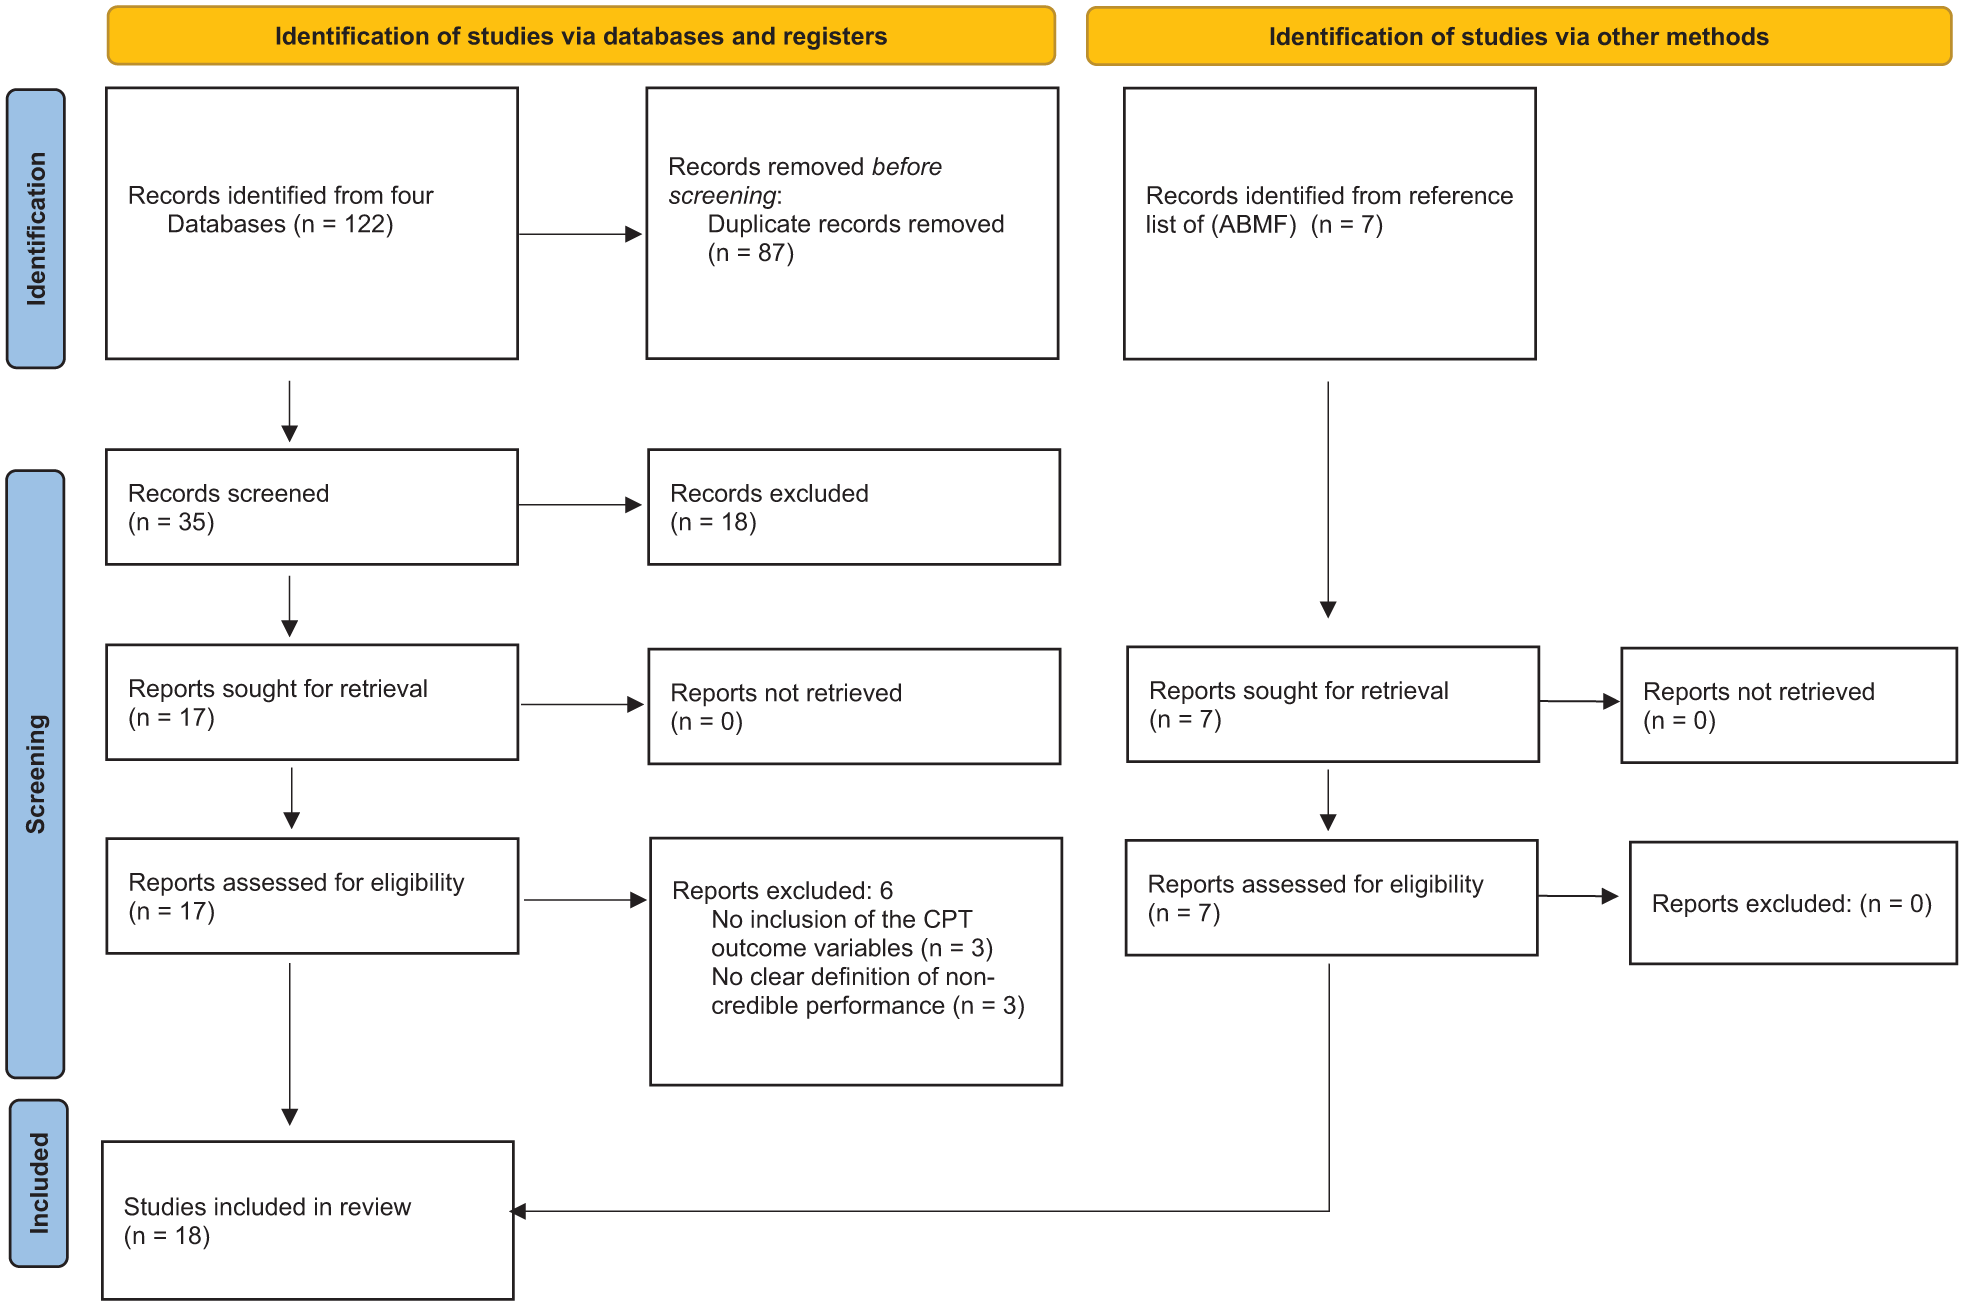
PRISMA Flowchart of Literature Search.
Study Selection
We included studies if they conducted a CPT measuring at least one of four CPT measures: omission errors (OM), commission errors (COM), reaction time (RT), or reaction time variability (RTSD). In addition, studies were required to either follow a criterion group or a simulation group design for the detection of noncredible performance in adult ADHD. Throughout this study, we labeled the group of individuals demonstrating credibility in the criterion-group design and simulation group design as the credible group. Conversely, we labeled the group that demonstrated noncredibility in the criterion-group design and the individuals without a classification of ADHD who were instructed to feign within the simulation design as the noncredible group. The means and standard deviations of the CPT measures for the credible and noncredible groups were required for inclusion.
Data Extraction
PT extracted the following data from the included articles. First, PT sorted the studies by design (i.e., criterion group design or simulation group design). Second, we identified the specific CPT variant(s) and CPT outcome measures used in each study. Then, we classified the studies based on whether they used student or nonstudent samples. Fourth, we extracted the sample size, mean age, and gender distribution for both the credible and noncredible groups. Fifth, we collected the means and standard deviations for each group on the four CPT outcome measures.
Data Analysis
We performed the certainty assessment following the Grading of Recommendations, Assessment, Development and Evaluation (GRADE) guidelines to determine the quality of evidence. See the GRADE approach handbook to see how we graded each study from very low to high (Grade Working Group, 2013–2023). Study quality was assessed using the Joanna Briggs Institute (JBI) Critical Appraisal Checklist for Analytical Cross-Sectional Studies (JBI, 2020). We used the “metafor” package (Viechtbauer, 2010) in R Studio (R Studio Team, 2022) for data analysis. We created p-curves with the p-curve app 4.10 (https://www.p-curve.com/app4/). The code is publicly available on OSF (DOI 10.17605/OSF.IO/PBDYV).
In cases where multiple noncredible groups were reported, we calculated the overall mean and standard deviation using a weighted average based on sample size. When studies provided standard errors instead of standard deviations, standard deviations were first derived from the reported values. For all outcomes, lower effect sizes meant poorer performance. We transformed scores in case the original study used a different format.
We conducted a multilevel meta-analysis using a random-effects model to account for dependencies among effect sizes within studies. The model was fitted using the restricted maximum likelihood (REML) estimation method with the rma.mv() function. Effect sizes were calculated using standardized mean differences (SMD; Hedges’s g), and a forest plot was made. Hedges’s g of 0.2 is considered a small effect, 0.5 as medium effect, and 0.8 as large effect (Cohen, 1992).
We assessed overall heterogeneity with the Q statistic. Our multilevel model distinguished two sources of variance: between‑study variance (Level 3) and within‑study variance (Level 2, e.g., differences between CPT outcomes within the same study). Variance at each level was estimated using sigma squared (σ2): at Level 3, σ2 reflects how much true effect sizes vary across studies, whereas at Level 2, σ2 captures the variability of multiple effect sizes reported within the same study. To express the proportion of total variability explained at each level, we calculated I2 values. Following Higgins and Thompson (2002), I2 values of 25%, 50%, and 75% indicate low, moderate, and substantial heterogeneity, respectively.
We analyzed each moderator separately (i.e., study design and sample composition) with a multilevel meta-regression using a random-effects model. The models were fitted using the REML estimation method with the rma.mv() function. We calculated the effect size per category (
Certainty Assessment: CPT Outcomes
We included a certainty assessment of the four CPT outcomes to investigate inconsistency, indirectness, imprecision, publication bias, and the overall certainty of the evidence.
Study Quality
Furthermore, we assessed the risk of bias using the Risk of Bias—Symptom and Performance Validity (RoB-SPV) tool (Puente-López et al., 2025). We rated each study based on the selection of a clinical comparison group, design-specific components, and an overall assessment, using a scale of low risk of bias, some concerns, and high risk of bias.
Robustness Checks
Meta-analyses are susceptible to biases such as the influence of outliers and highly influential studies, as well as small-study effects (including publication bias), which can distort the estimated effect sizes.
Outliers and Influential Points
Outliers or influential studies may disproportionately affect the robustness and validity of the estimate (Viechtbauer & Cheung, 2010). To examine whether outliers or influential effect sizes influenced our final results, we conducted four distinct analyses. We performed a pooled estimate confidence interval (CI) analysis with a sensitivity analysis (Harrer et al., 2021), the leave-one-out method based on both effect size and study level, Cook’s Distance analysis (Viechtbauer, 2010), and a difference in betas (DFBETAs) analysis (Viechtbauer, 2010). For a detailed explanation of the procedures used, see Supplement 5(a).
Small-Study Effects
Small-study effects refer to the tendency of smaller studies to report different (often larger) effect sizes in comparison to larger studies (Schwarzer et al., 2015; Sterne et al., 2000). Publication bias is a well-known reason for the phenomenon of small-study effects, which arises when studies with significant results are more likely to be published than those with nonsignificant findings, leading to an overrepresentation of positive effects in the literature (Easterbrook et al., 1991). To address small-study effects, we conducted the following analyses: a p-curve analysis (Simonsohn et al., 2015), the test of excessive significance (Ioannidis & Trikalinos, 2007), and an assessment of funnel plot asymmetry through visual inspection, the multilevel Egger’s regression test (Rodgers & Pustejovsky, 2021), and a Trim-and-Fill analysis (Duval & Tweedie, 2000). For a detailed explanation of the procedures used, see Supplement 5(b).
Results
Literature Search and Study Characteristics
We identified 18 studies, see flow chart Figure 1, of which 67 effect sizes from 18 studies could be included in the final analysis. Because several studies reported multiple effect sizes based on overlapping samples, the number of independent participants (i.e., participants contributing unique data to the analysis) was 3,021. Approximately half of the participants in the credible group were female (50.98%, sd = 14.87), compared to 53.59% (sd = 19.65) in the noncredible group. The average age in the credible group was 26.86 (sd = 4.97) years and in the noncredible group 24.05 (sd = 4.55) years. In total, eight studies did not report sex and age in their sample.
Eight studies employed a simulation group design, whereas 10 studies adopted a criterion-group design. A total of 10 different CPT variants were administered: three studies utilized Conners Continuous Performance Test—II (Conners II; Conners, 2000), while five studies employed Conners Continuous Performance Test—3 (Conners 3; Conners, 2014). One study employed the Integrated Visual and Auditory Plus CPT (IVA +; Sanford & Turner, 1995), and three studies used the MOXO-d-CPT (I. Berger & Goldzweig, 2010). One study employed the Test of Attentional Performance (TAP; Zimmermann & Fimm, 2012), another study conducted the Quantified Behavior Test Plus (Qb+; Ulberstad, 2012), and two studies utilized the WAFV—VTS Perception and Attention Function—Vigilance (WAFV; Schuhfried, 2013). Furthermore, one study employed the Psychology Experiment Building Language (pCPT; Mueller & Piper, 2014), another used the Tests of Attentional Distraction (TOAD; Morey, 2016), and finally three studies employed the Test of Variables of Attention (TOVA; Leark et al., 2007). 17 studies assessed the CPT measures only visually, with the exception of Quinn (2003), who also assessed the CPT measures via the auditory information channel. OM was assessed in 18 studies, COM in 17 studies, RT in 10 studies, and RTSD in 13 studies. Among the 18 studies, 11 were conducted with samples from student groups (see Table 1 for study characteristics and see Figure 1 for a flowchart of the literature search).
Study Characteristics.
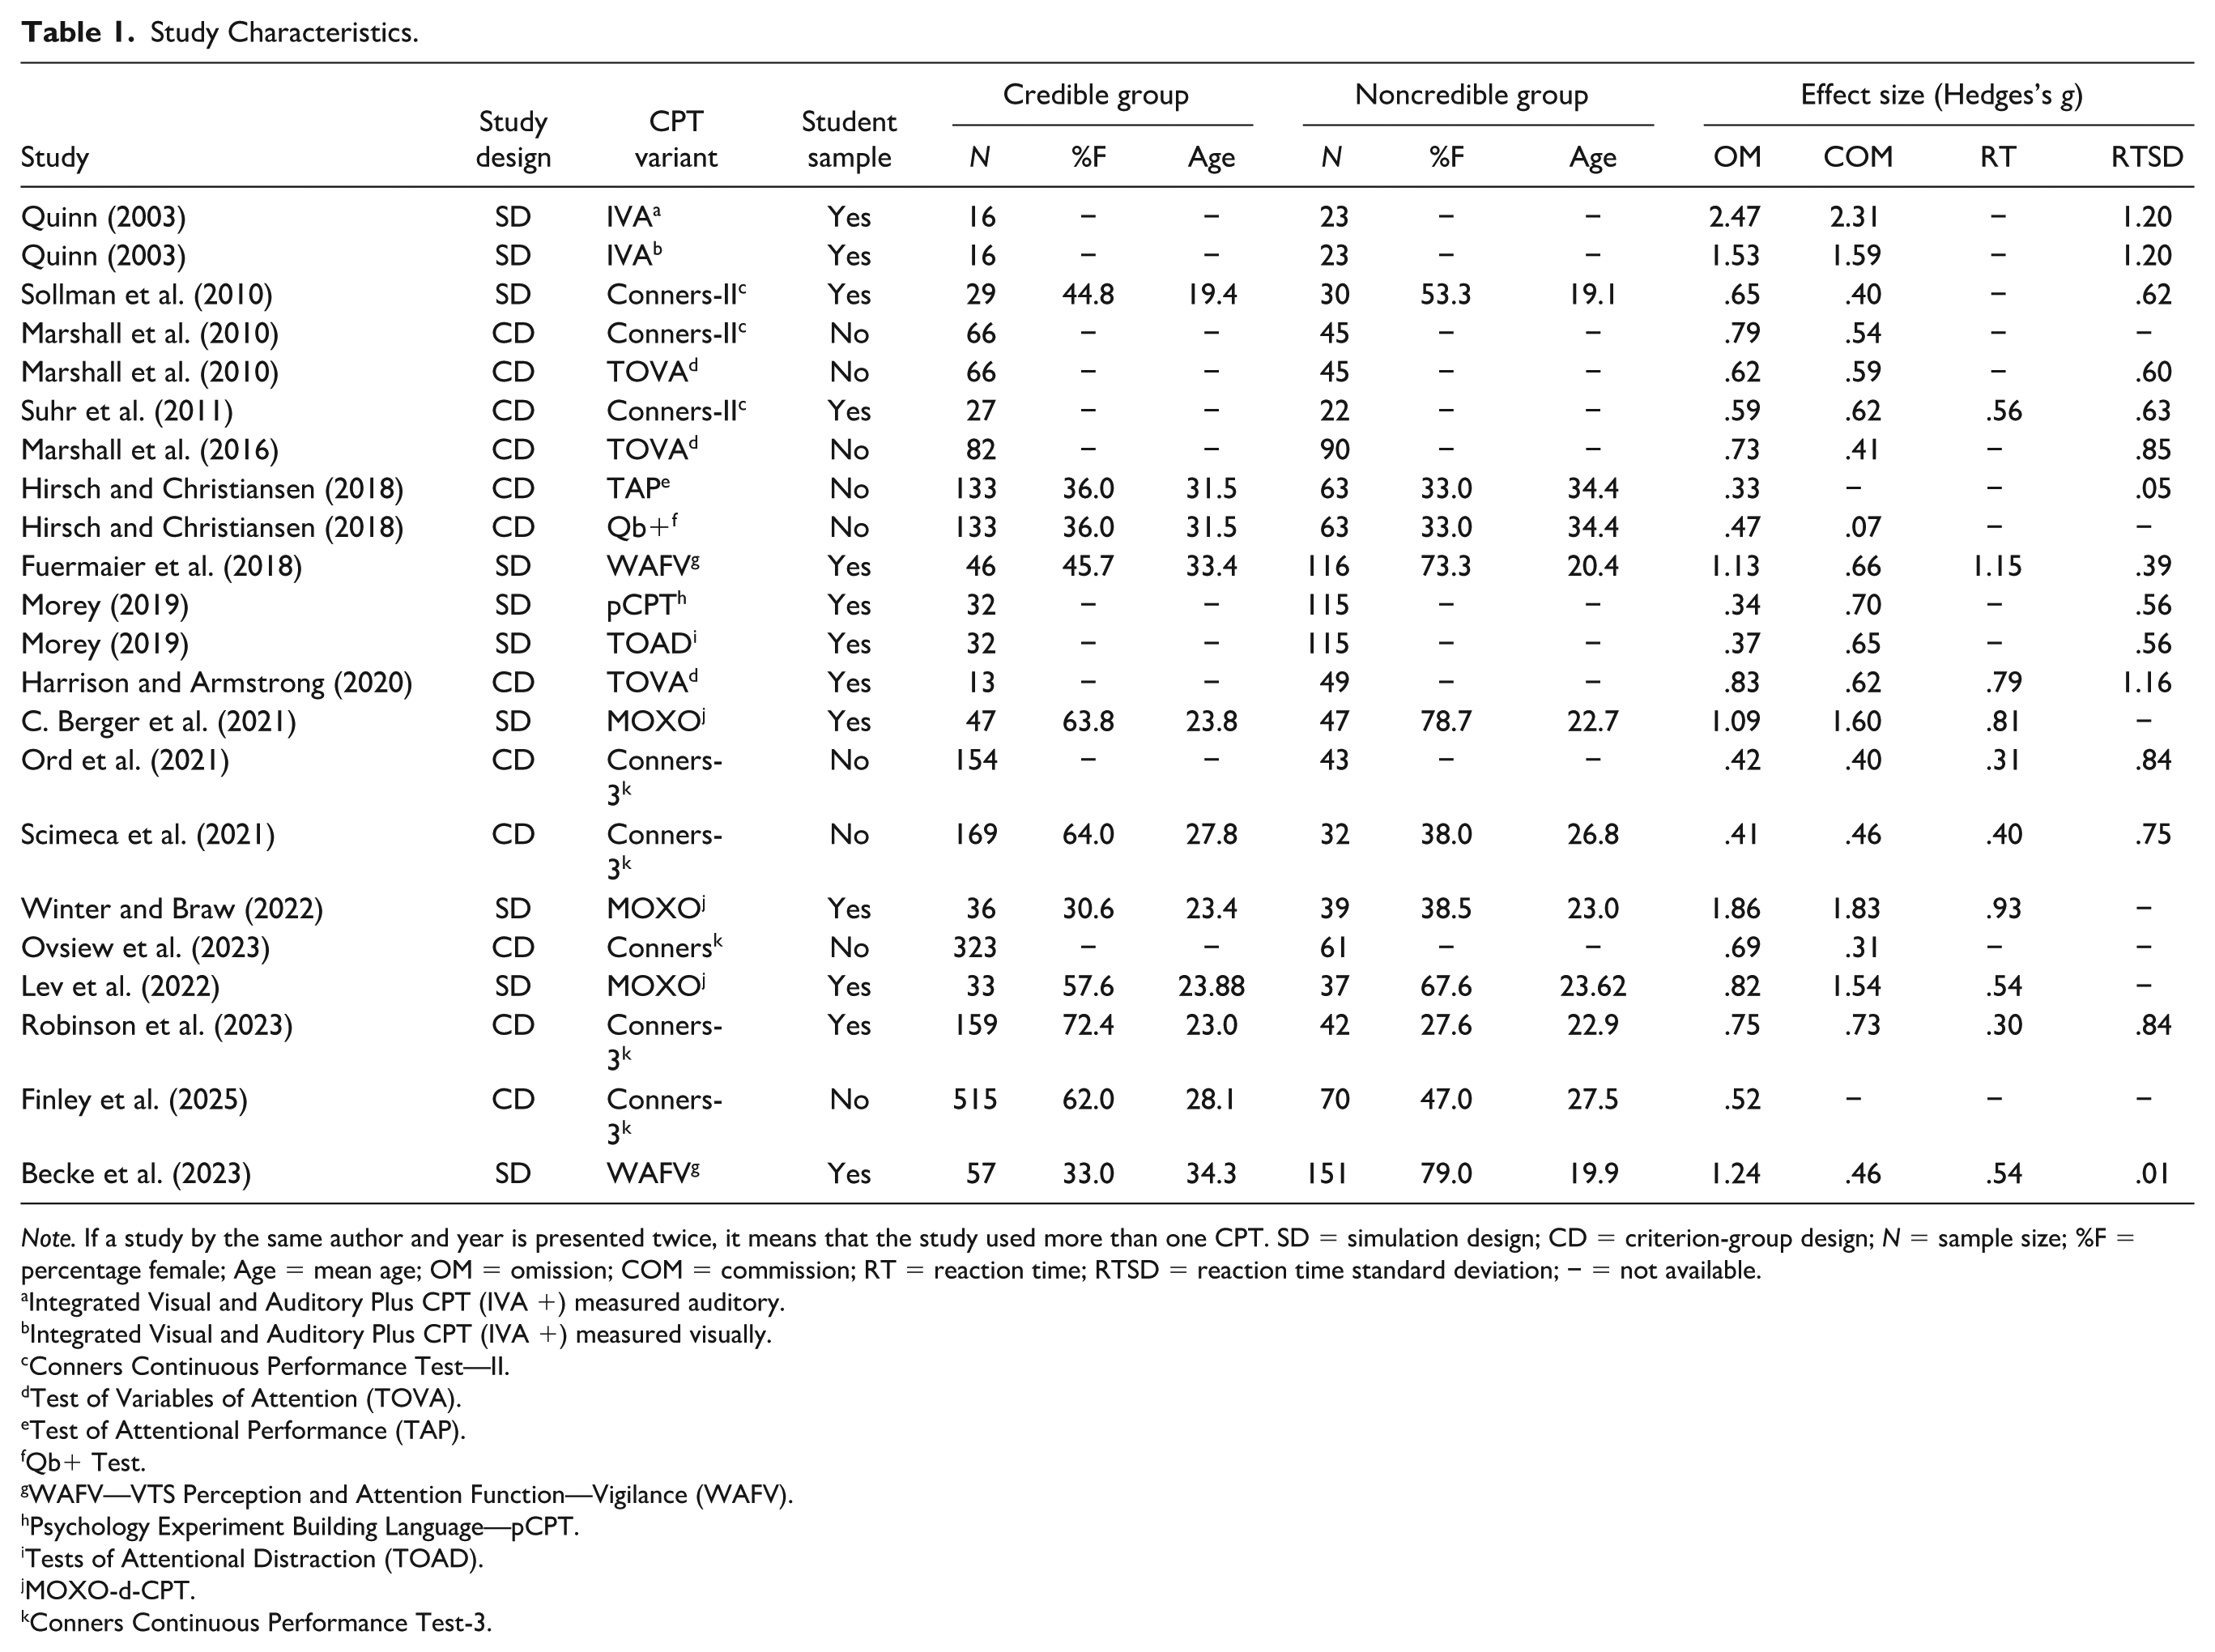
Note. If a study by the same author and year is presented twice, it means that the study used more than one CPT. SD = simulation design; CD = criterion-group design; N = sample size; %F = percentage female; Age = mean age; OM = omission; COM = commission; RT = reaction time; RTSD = reaction time standard deviation; − = not available.
Integrated Visual and Auditory Plus CPT (IVA +) measured auditory.
Integrated Visual and Auditory Plus CPT (IVA +) measured visually.
Conners Continuous Performance Test—II.
Test of Variables of Attention (TOVA).
Test of Attentional Performance (TAP).
Qb+ Test.
WAFV—VTS Perception and Attention Function—Vigilance (WAFV).
Psychology Experiment Building Language—pCPT.
Tests of Attentional Distraction (TOAD).
MOXO-d-CPT.
Conners Continuous Performance Test-3.
Certainty Assessment CPT Outcomes
Certainty of evidence for CPT outcomes ranged from low to high. OM and RTSD showed moderate certainty, downgraded due to heterogeneity and publication bias. COM had low to moderate certainty, with high heterogeneity and strong publication bias. RT had the highest certainty (moderate to high), with limited heterogeneity and no publication bias. Full details are in Supplement 4, Table 1.
Study Quality
Across the 18 included studies, 16 showed some concerns regarding risk of bias. The specific reasons for these concerns varied by study design. Clinical comparison groups were generally well selected, although few studies systematically evaluated whether control groups were free from external motivations (e.g., litigation or secondary gain), which could compromise the validity of the comparison. Simulation studies varied in the clarity and completeness of their procedures, with inconsistent reporting of compliance checks and almost no consideration of participants’ prior familiarity with the simulated condition. Criterion-group studies showed heterogeneity in the standards used to classify valid and invalid performance, raising concerns about misclassification bias. General methodological aspects were often suboptimal: dropout rates exceeding 5% were common, methodological reporting sometimes lacked sufficient detail for replication, and control for clinical or linguistic confounders was inconsistently applied. In line with the RoB-SPV recommendations, we do not provide a single overall bias rating. Instead, these findings indicate a mixed methodological quality across the literature. Some domains (e.g., clinical sampling) were generally strong, whereas others (e.g., control group incentive assessment, simulation reporting) showed notable variability.
Robustness Checks
Outliers and Influential Studies
The four analyses conducted to identify outliers and influential studies did not indicate the presence of any such studies. Consequently, all studies were included in the main analysis. Detailed results for each analysis are provided in Supplement 6(a).
Small-Study Bias
The outcomes of the analyses conducted for small-study bias were less straightforward. The p-curve analysis suggests the presence of genuine underlying effects in the included studies. The test of excessive significance did not indicate an excess of significant findings, which suggests no indication of bias related to the selective reporting of statistically significant results. However, despite the trim-and-fill analysis not suggesting missing studies on the left side of the funnel plot, the visual asymmetry of the funnel plot and the significant Egger’s test raise concerns about the presence of small-study effects. Specifically, smaller studies tend to have higher standard errors and larger effect sizes, whereas larger studies are associated with lower standard errors and smaller effect sizes, which likely accounts for the observed asymmetry. Taken together, while there is evidence supporting the presence of true effects in our meta-analysis, the distribution of effect sizes suggests that they may still be inflated due to small-study bias. Detailed results for each analysis are provided in Supplement 6(b).
Main Analysis: Utility of CPTs
CPTs differentiated significantly between credible and noncredible groups (g = 0.73, 95% CI = [0.55, 0.91], p < .001; see Figure 2). Heterogeneity was significant, Q(66) = 244.23, p < .001, with larger heterogeneity between studies (σ2 = 0.10, sd = 0.32, I2 = 54.82%, k = 18) than within studies (σ2 = 0.04, sd = 0.21, I2 = 23.90% across 67 levels).
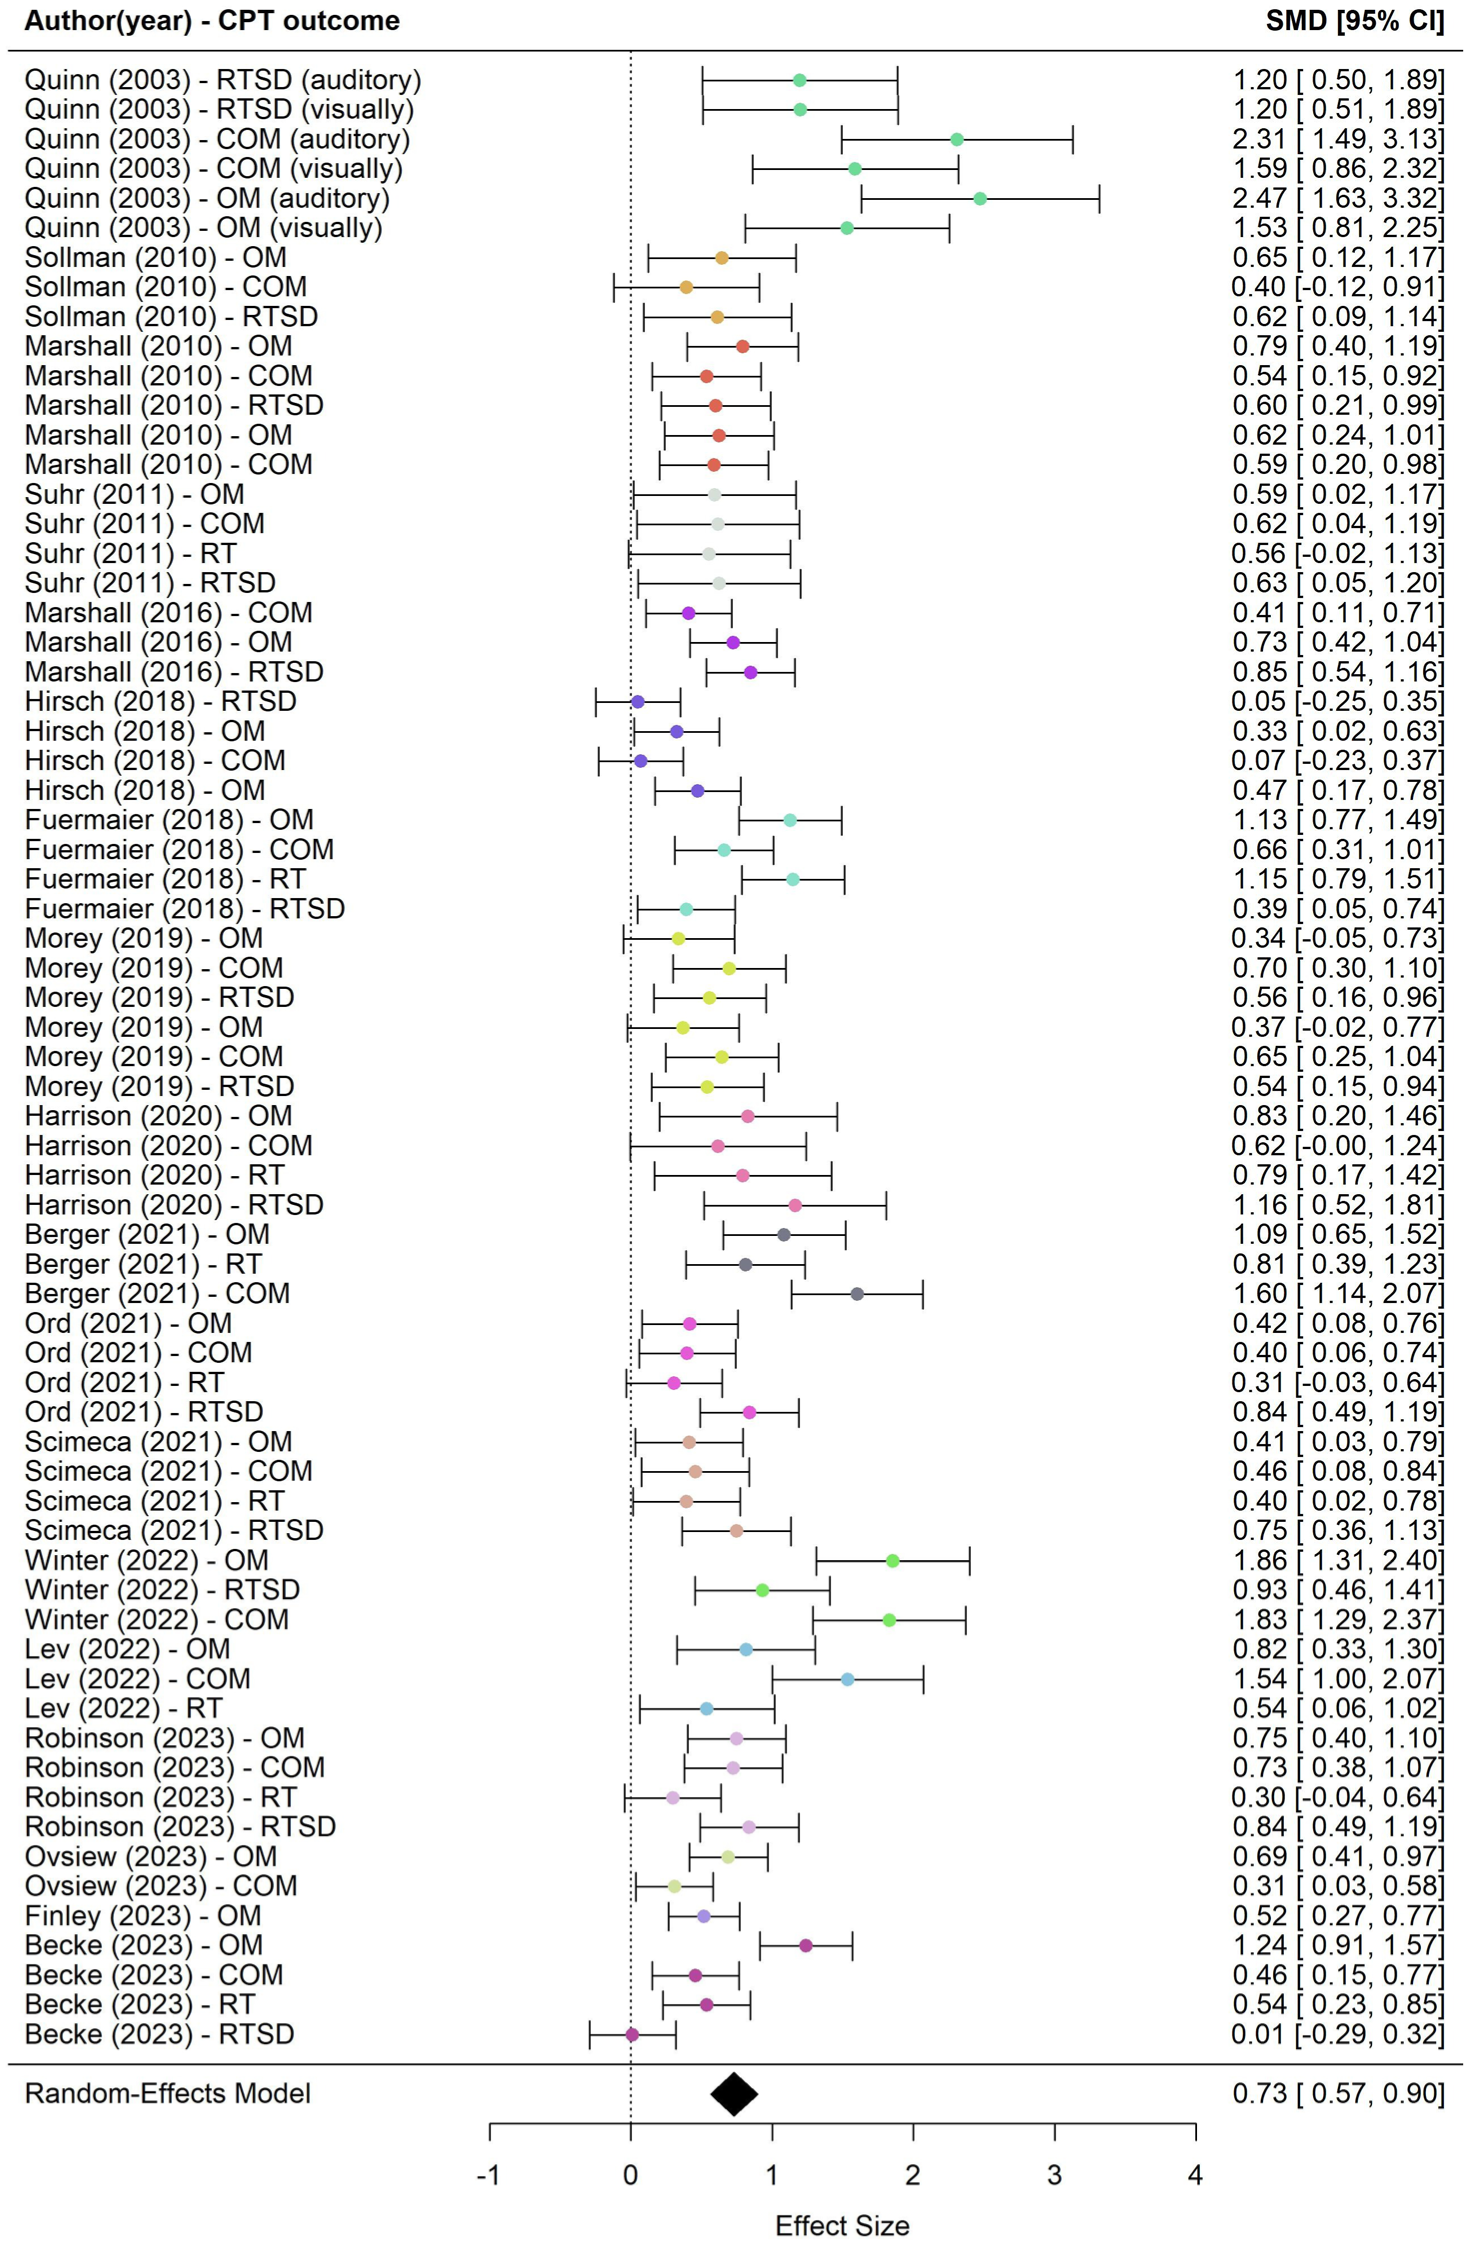
Forest Plot of All the Effect Sizes.
Moderator Analyses
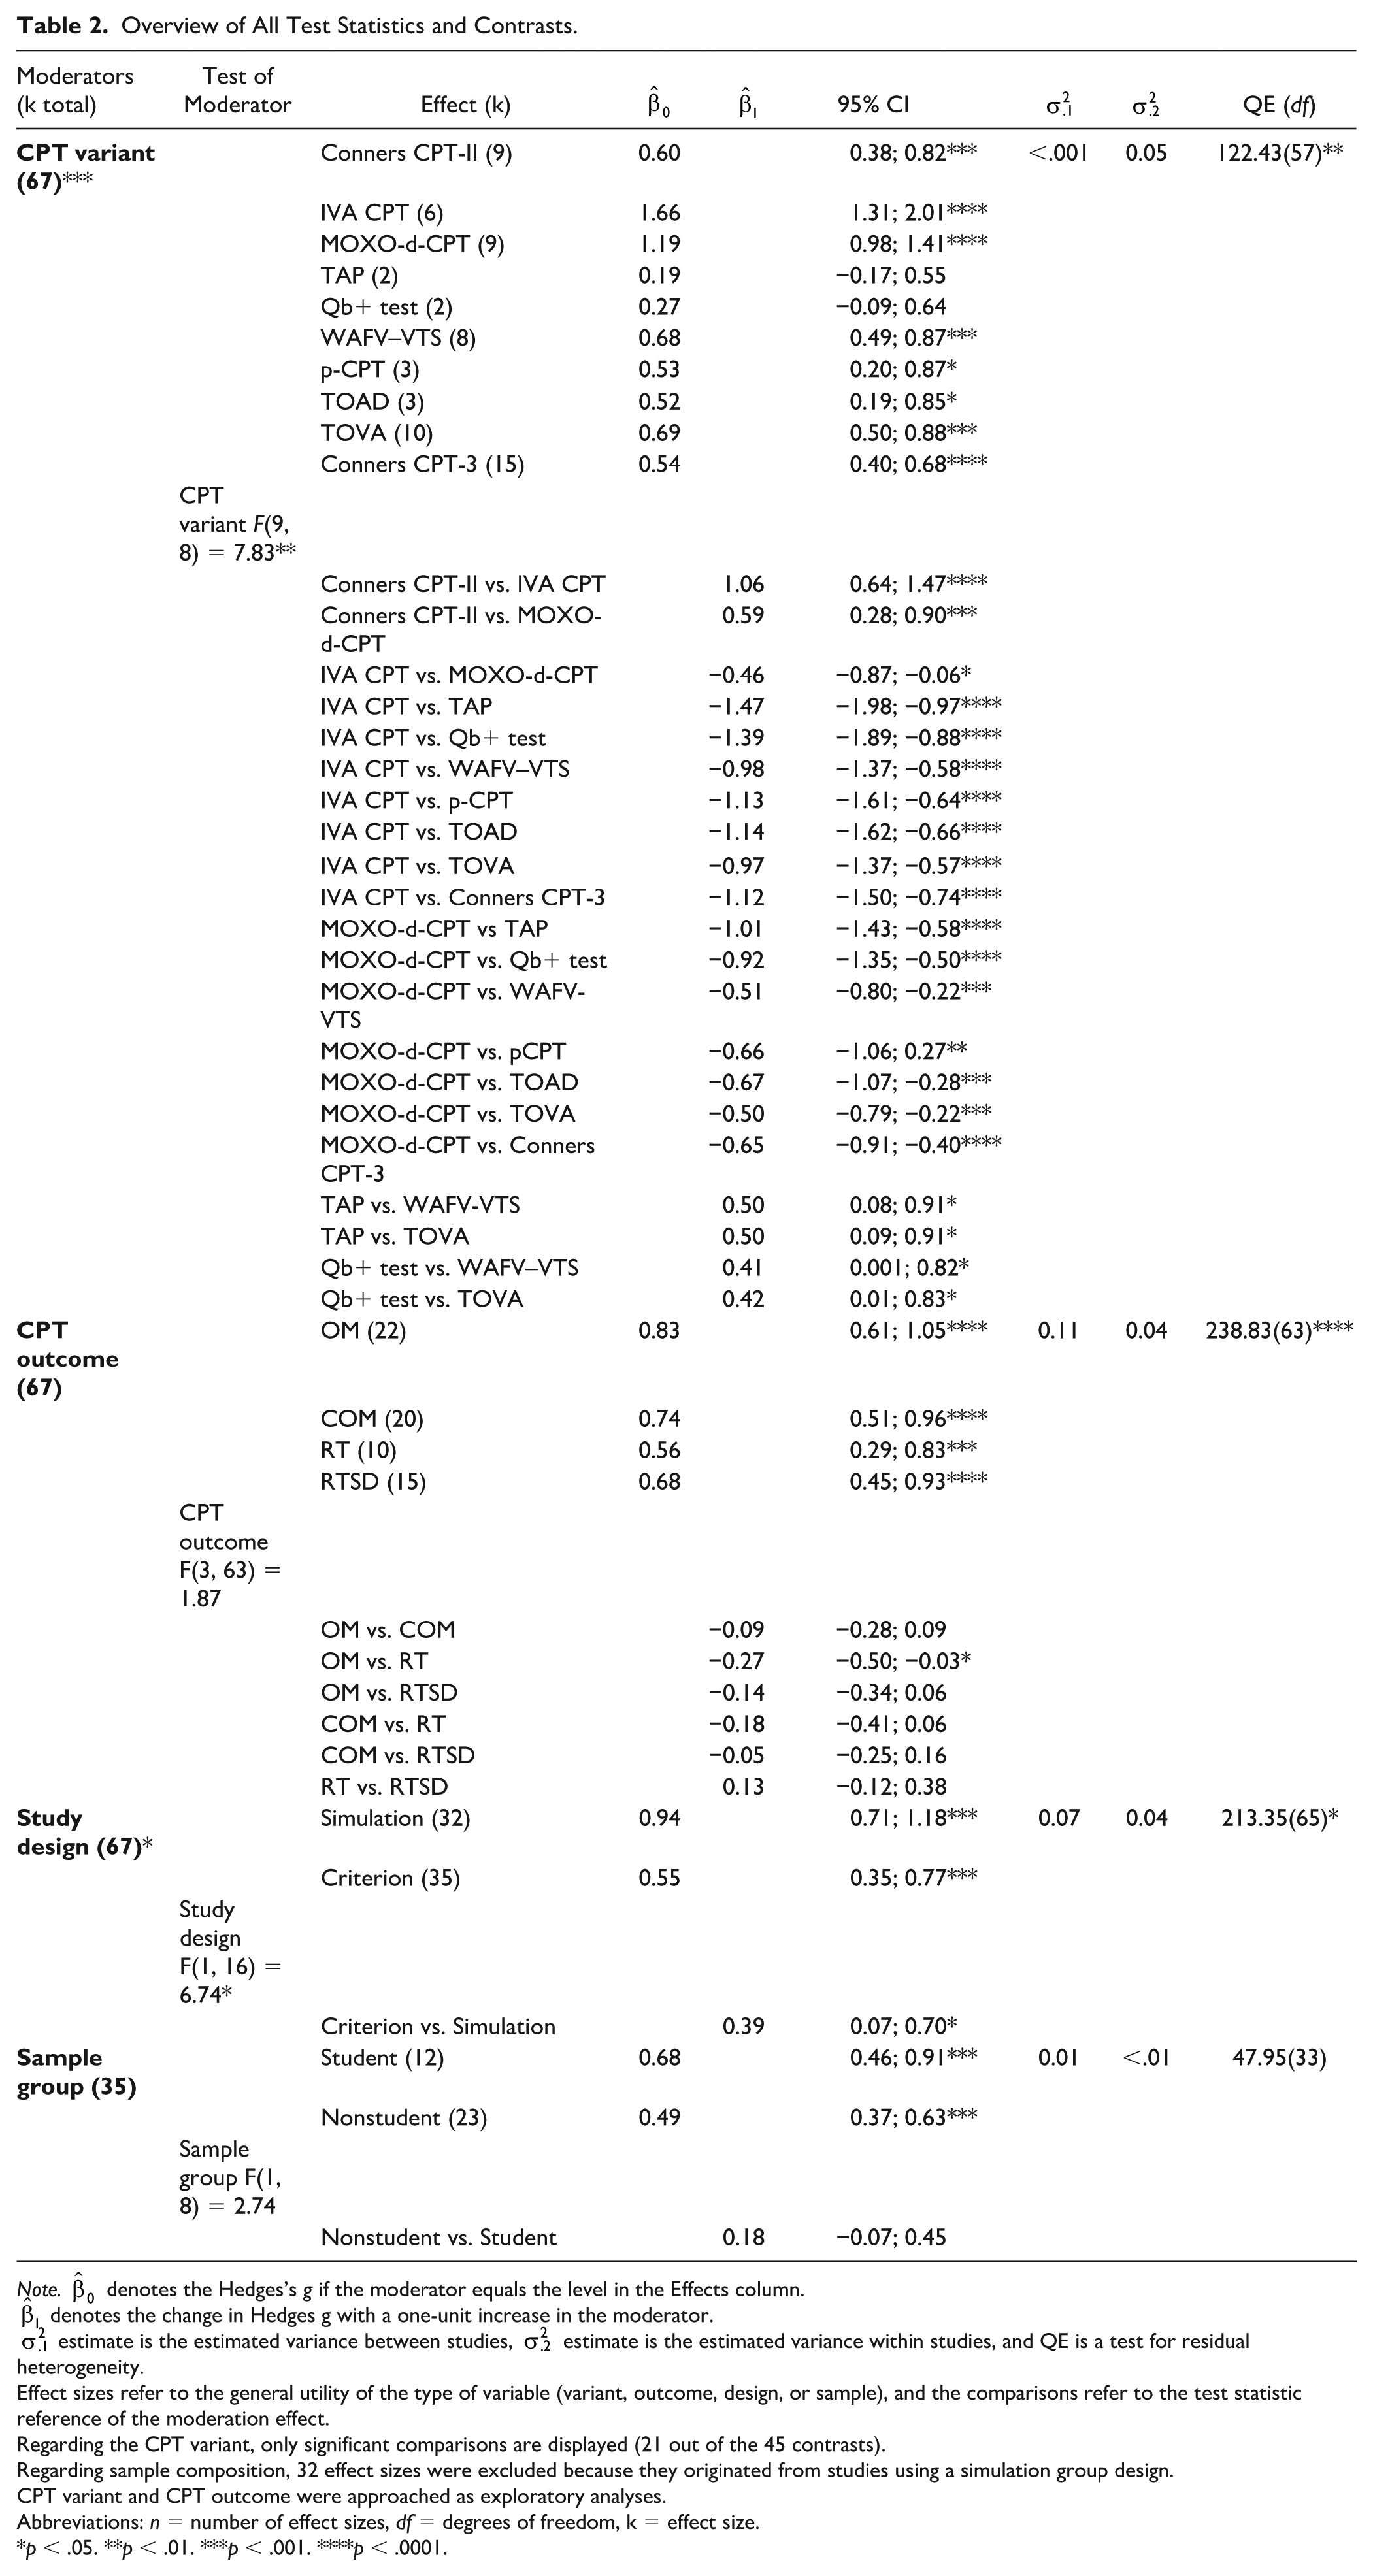
Moderator analyses revealed significant variability in effect sizes across CPT variants, CPT outcomes, and study design. Regarding the CPT variant, the largest effect was observed for the IVA CPT, which significantly outperformed all other variants. This suggests the IVA CPT seems the most sensitive CPT in distinguishing between credible and noncredible performance. Among CPT outcome domains, OM showed the highest average effect size. Effect sizes for OM were significantly higher than for RT, indicating this outcome may be more sensitive to group differences. No significant differences were found between other CPT outcomes. Furthermore, simulation group designs produced larger effects than criterion group designs. The contrast between the two designs was significant, suggesting study design influenced the observed effects. Finally, there were no statistically significant differences between student and nonstudent groups. Note that this moderator analysis was limited to criterion-group studies, as all simulation-group studies used student participants, making comparisons not possible. For a detailed overview of all statistics and contrasts, see Table 2.
Overview of All Test Statistics and Contrasts.
Note.
Effect sizes refer to the general utility of the type of variable (variant, outcome, design, or sample), and the comparisons refer to the test statistic reference of the moderation effect.
Regarding the CPT variant, only significant comparisons are displayed (21 out of the 45 contrasts).
Regarding sample composition, 32 effect sizes were excluded because they originated from studies using a simulation group design.
CPT variant and CPT outcome were approached as exploratory analyses.
Abbreviations: n = number of effect sizes, df = degrees of freedom, k = effect size.
p < .05. **p < .01. ***p < .001. ****p < .0001.
Discussion
CPTs are a key ingredient in both clinical and research settings for assessing cognitive functions in adults evaluated for ADHD (Pettersson et al., 2018). In addition to their established role in evaluating attention and impulsivity, CPTs have seen growing interest as embedded validity indicators, as several studies highlight their utility to distinguish credible from noncredible performance (C. Berger et al., 2021; Morey, 2019; Winter & Braw, 2022). Despite their widespread use, the evidence remained inconclusive as to whether CPTs can reliably serve as embedded indicators of performance validity, and our current meta-analysis aimed to synthesize this evidence. As hypothesized, we found a moderate-to-large effect (g = 0.73) in distinguishing credible from noncredible performance in clinical or experimental assessments of ADHD using CPTs.
To better understand the impact of the differences between the studies in our meta-analysis, we looked at two possible moderators that might explain this variation and also carried out two exploratory moderator analyses. For the first moderator, we considered whether the type of study design (i.e., criterion‑group vs. simulation‑group) could shed light on the variation we found across studies. Notably, studies employing a simulation group design yielded significantly larger effects than those using a criterion group design (Hedges’s g = 0.94 vs. 0.55). This higher sensitivity in simulation designs compared to criterion group designs is consistent with long-standing concerns about the limited generalizability of simulation research (Rogers, 1993). One plausible explanation is that the motivation behind pretending to have ADHD in an experimental context (focus on showing ADHD characteristics) differs from actual circumstances in clinical practice (focus on avoiding getting caught), which may result in exaggeration of ADHD characteristics in the simulation group. However, it is important to consider that other methodological differences between designs, such as sample characteristics, preparation, or assessment context, may also contribute to the observed sensitivity differences. Furthermore, relying solely on criterion-group designs is not desirable, as the less controlled environment may lead to distorted effect sizes. Ultimately, the choice of research design has a significant impact on the magnitude of the observed effect sizes. This means that, as a researcher or clinician, one should avoid drawing conclusions about the utility of CPTs as embedded validity measures based on a single type of research design. To obtain more accurate and ecologically valid assessments, it is essential to integrate evidence from both simulation and criterion-group designs when evaluating CPTs, thereby ensuring that clinical recommendations are grounded in realistic expectations.
For the second moderator analysis, we examined the effect of sample composition. Students may systematically differ from nonstudents in their motivation, knowledge of ADHD, and incentives to feign ADHD characteristics. We hypothesized that students, who generally have greater access to social and online information about ADHD characteristics, would be better positioned to simulate these characteristics during assessments and, as a result, be more difficult to detect than non‑student participants. No significant differences were observed between student and nonstudent samples. Important to note is that the robustness of the finding may be limited because of the exclusion of the studies that utilized a simulation design, which may have reduced statistical power.
For the first exploratory moderator analysis, we tested whether different versions of the CPT might have influenced the results. Indeed, we found differences across the various CPT versions. The IVA CPT demonstrated the largest effect, followed by the MOXO‑d‑CPT. The TAP and the QbTest yielded the lowest effect size. It is important to note that some CPT variants were only represented by a single study, and other CPTs by multiple studies. This imbalance limits the reliability of estimating moderator effects for underrepresented CPT variants. We did not identify any specific test characteristic, based on a review of the test manuals, that could clearly explain the substantial differences observed between the CPT variants. The observed differences between CPT variants should be confirmed in future research using larger samples. Of particular relevance is that with the exception of the TAP and QbTest, all CPT variants showed significant predictive power in differentiating credible from noncredible performance, with effect sizes ranging from medium to very large (Cohen, 1992).
In our second exploratory moderator analysis, we examined whether the four major CPT outcomes varied in their ability to distinguish between credible and non‑credible performance. Overall, omissions, commissions, reaction time, and variability in reaction time all showed comparable levels of predictive utility. Notably, omission errors appeared somewhat more sensitive than reaction time, though the reason for this difference remains unclear and warrants further investigation in larger samples. Importantly, all four outcomes demonstrated meaningful sensitivity in distinguishing credible from non‑credible performances.
Limitations
The current study is not without limitations. While robustness analyses indicated that the observed effect shows evidential value and no single study or effect size substantially influenced the overall effect size, it is likely that the results are influenced, at least in part, by small‑study effects. Findings from Egger’s test and the asymmetry of the funnel plot suggest that the originally reported effect size is likely overestimated, thereby warranting caution in the interpretation of its magnitude. Finally, the RoB-SPV evaluation indicated that most included studies presented some risk of bias, particularly regarding reporting transparency and the assessment of participant incentives. Such methodological inconsistencies may limit the comparability of studies.
Furthermore, research findings and current guidelines underscore the importance of utilizing multiple performance validity indicators (Rhoads et al., 2021; Soble, 2021; Sweet et al., 2021). Given that a single performance validity indicator failure may occur even in a credible group (indication of a false-positive), conclusions regarding noncredible performance should not be based solely on one performance validity indicator (Victor et al., 2009), unless performance is significantly below chance level on a forced-choice measure (Sweet et al., 2021). On the contrary, the likelihood of failing multiple performance validity indicators in a credible group, including individuals with cognitive impairment, is low (Critchfield et al., 2019), except in cases involving individuals with severe functional disabilities (Sweet et al., 2021). However, the criteria for classifying noncredibility differed across studies, specifically in terms of how many failed performance validity indicators were required for classification of noncredibility. In more than half of the included studies, noncredibility was determined based on a single external performance validity test (PVT) (typically well-established PVTs such as the Word Memory Test (WMT; Green, 2003) or Test of Memory Malingering (TOMM; Tombaugh, 1996)). The remaining studies employed more stringent or alternative criteria, such as failure on two or more PVTs, or a combination of one failed PVT and additional indicators (e.g., evidence of impaired cognitive functioning). The inclusion of different criteria may have resulted in misclassification of participants and (undesired) variability across studies, ultimately affecting the sensitivity estimates of the CPTs.
Finally, although we report group differences using Hedges’s g, it is important to note that this only shows the average difference between credible and noncredible groups. It does not tell us how well the CPT can correctly classify individual participants or how accurately it works at specific cutoff scores.
Future Research
Future research should go beyond group-level effects and focus on classification accuracy at the individual level. Specifically, studies are needed to examine how well CPTs can correctly identify noncredible performance using classification metrics, such as sensitivity, specificity, positive predictive value, and negative predictive value (Lange & Lippa, 2017). These metrics would provide a clearer picture of the practical and clinical utility of CPTs as embedded validity indicators, helping to determine not just whether group differences exist, but whether the tests can meaningfully separate individuals in real-world assessment settings.
Furthermore, future research should examine the utility of CPTs as embedded validity indicators in child and adolescent populations. Recent years have seen a growing support for the inclusion of performance and symptom validity testing in pediatric assessments (Kirk et al., 2020). Several freestanding PVTs, such as the TOMM and the Medical Symptom Validity Test (MSVT; Green, 2004), originally developed for adults, have also demonstrated effectiveness in pediatric settings (Blaskewitz et al., 2008; Constantinou & McCaffrey, 2003; Rienstra et al., 2010). However, embedded validity indicators such as CPTs, particularly in populations with ADHD, require further validation to establish their utility and clinical applicability (Kirk et al., 2020).
Conclusion
In conclusion, despite some limitations, our findings (Hedges’s g = 0.73) support the value of CPTs as embedded validity indicators in adult ADHD assessments. Effect sizes were nearly twice as large in simulation studies compared to criterion designs, highlighting the importance of integrating both approaches for a comprehensive evaluation of CPT utility before issuing clinical recommendations. Most CPT variants and outcomes showed predictive value. Based on these findings, clinicians and researchers can make more informed decisions about which CPT measures and variants to use in practice and research. However, the limited number of studies prevents firm conclusions about differences between them.
These findings carry meaningful practical implications. Our quantitative synthesis revealed patterns that are not evident in individual studies. For instance, Quinn (2003), a small study reporting unusually large effects, has been cited far more often than larger studies with more moderate findings. While factors such as publication timing may partly explain this pattern, it suggests that the field may have given disproportionate attention to a single study, which may have contributed to an overestimation of CPTs’ effectiveness as embedded validity measures.
However, CPTs do hold considerable promise as embedded validity indicators, particularly given their ability to simultaneously assess cognitive functioning and performance validity, increasing efficiency while complementing other validity tests. Moreover, their typically low face validity (Rogers, 2018) reduces the likelihood of intentional or unintentional performance distortion, further strengthening their clinical value. Given their widespread use in neuropsychological practice (Pettersson et al., 2018), CPTs are well-positioned for expanded use as embedded validity measures without requiring major changes to standard assessment protocols.
Of note, while our findings reflect a medium-to-large effect size (Cohen, 1992), the classification proposed by Rogers (2018), developed specifically for validity assessment, places this effect in the small range. As such, a single CPT should not be used in isolation to detect noncredible performance at the individual level. This reflects a broader shift in validity assessment toward interpreting performance validity as a position on a continuous scale derived from multiple PVTs, rather than applying a binary pass/fail decision based on a single cutoff score from one measure (Boone, 2009; Erdodi, 2019; Erdodi et al., 2014). This is particularly relevant given the lack of consensus on the most appropriate measures and optimal cut scores, which can significantly influence sensitivity and specificity estimates (Bigler, 2012; Erdodi, 2019). Thus, in clinical practice, CPTs should be interpreted in conjunction with other embedded and freestanding validity indicators to ensure a more robust and nuanced assessment of response validity.
Supplemental Material
sj-docx-1-asm-10.1177_10731911251401306 – Supplemental material for Evaluating Continuous Performance Tests as Embedded Measures of Performance Validity in ADHD Assessments: A Systematic Review and Meta-Analysis
Supplemental material, sj-docx-1-asm-10.1177_10731911251401306 for Evaluating Continuous Performance Tests as Embedded Measures of Performance Validity in ADHD Assessments: A Systematic Review and Meta-Analysis by Pinar Toptas, Tycho J. Dekkers, Annabeth P. Groenman, Geraldina F. Gaastra, Dick de Waard and Anselm B. M. Fuermaier in Assessment
Footnotes
Support and Contributors
A.B.M.F., P.T., T.J.D., and G.F.G. designed the study. A.B.M.F. and P.T. conducted the literature search. P.T. performed the data analysis. A.P.G. checked the code and supervised the statistical analysis; G.F.G. also contributed to the statistical support. P.T. wrote the manuscript. A.B.M.F. and T.J.D. provided supervision, and A.B.M.F., T.J.D., D.deW., A.P.G., and G.F.G. reviewed and edited the manuscript. All authors approved the final version of the manuscript.
Declaration of Conflicting Interests
The authors declared the following potential conflicts of interest with respect to the research, authorship, and/or publication of this article: T.J.D. is in the steering committee of the European ADHD Network (EUNETHYDIS), which receives funding for educational activities by Medice and Takeda. A.B.M.F. has a contract with Schuhfried GmbH for the development and evaluation of neuropsychological instruments. The other authors report no potential conflicts of interest.
Funding
The authors received no financial support for the research, authorship, and/or publication of this article.
Availability of Data,Code,and Other Materials
The data and R code are made publicly available on OSF (DOI 10.17605/OSF.IO/PBDYV). Supplements can be found at Sage Assessment.
Supplemental Material
Supplemental material for this article is available online.
References
Supplementary Material
Please find the following supplemental material available below.
For Open Access articles published under a Creative Commons License, all supplemental material carries the same license as the article it is associated with.
For non-Open Access articles published, all supplemental material carries a non-exclusive license, and permission requests for re-use of supplemental material or any part of supplemental material shall be sent directly to the copyright owner as specified in the copyright notice associated with the article.