
Abstract
This study compared various response formats in fitting confirmatory factor analysis models. Participants responded to the eight-item center for epidemiologic studies depression scale across five different response formats in a within-subjects experimental design: the Likert-type scale, three types of slider response formats, and a number-entry response format. We compared the different response formats based on item-level scores, factor structure and psychometric properties of the scale, mean comparisons across groups, and individuals’ sum scores. Similar results were observed across the response formats with respect to factor structure, measurement invariance, reliability, and validity of test scores. However, inconsistent results were found regarding group mean comparisons across groups. Individuals’ item scores and sum scores also varied across different response formats, as did participants’ subjective evaluations of response formats in terms of perceived accuracy, enjoyment, difficulty, and mental exhaustion. Based on study findings, we provide recommendations and discuss implications for researchers designing and conducting clinical assessments.
Keywords
Introduction
Self-report stands as the most popular assessment method in psychological research (Paulhus & Vazire, 2007). Within this domain, the Likert scale has been the prevailing self-report response format and has been widely used to measure a variety of constructs such as attitudes (Carlson et al., 2000; Sexton et al., 2006), emotion (Gross & John, 2003; Lovibond & Lovibond, 1995), personality (Cattell et al., 1993; Costa & McCrae, 1992), interest (Chu et al., 2022; Su et al., 2019), and values (Rosenberg, 1965; Steger et al., 2006).
When modeling psychological measurement data generated from self-report questionnaires, confirmatory factor analysis (CFA) is the prevailing technique used within the structural equation modeling framework (Crowley & Fan, 1997). As a linear model, traditional CFA assumes that observed variables (i.e., questionnaire items) are measured on a continuous scale. Data generated by Likert scales, however, are discrete in nature. Although measurement models specifically designed for categorical or ordinal items exist (e.g., ordinal factor analysis models, Muthén, 1978, 1984; item response theory models, Embretson & Reise, 2000), it is a common practice to treat data obtained from Likert scales as continuous and to apply traditional CFA models when the number of response categories is large (i.e., ≥5; Rhemtulla et al., 2012). 1 This practice may have stemmed from having limited options to measure attitudinal and behavioral data. Recent advancements in technology and the growing popularity of online data collection, however, have resulted in alternative response formats that may be more appropriate for psychometric models that assume continuous data. One such alternative, continuous rating scales (e.g., sliders), has attracted increased attention from researchers.
While extensive literature exists on the psychometric performance of Likert scales, research on sliders is comparatively limited. Research on the comparability between the two is likewise limited. Given the widespread use of CFA models, and the potential fallibility of using Likert data in this context, this study compares the performance of Likert and slider scale formats in CFA to help inform clinical researchers conducting psychometric studies in this context. To achieve this goal, we first provide a brief overview of the historical development and usage of Likert and slider scales. We then compare the differences in the data generated by the two types of scales. Finally, we summarize the findings from existing literature comparing the two response formats and introduce the current study.
The Likert Format
Likert scales were devised in the 1930s (Likert, 1932) and initially only employed a symmetrical format with five options ordered as “Strongly Disagree,” “Disagree,” “Neutral,” “Agree,” and “Strongly Agree.” Over the years, however, numerous variations of Likert-type scales emerged (Bishop & Herron, 2015), including scales that can exhibit asymmetry, exclude a neutral midpoint, and/or incorporate partial labeling (Ho, 2017; Pedhazur & Schmelkin, 1991). The number of options in Likert-type scales usually falls between 2 and 11, with each response category assigned a numerical value for subsequent analysis (Ho, 2017; Wakita et al., 2012). Throughout this paper, we use the term “Likert scales” as a general designation encompassing both Likert and Likert-type scales.
In clinical-related studies, the Diagnostic and Statistical Manual of Mental Disorders (DSM-5) outlines diagnostic criteria for many mental disorders that require the presence of specific symptoms over a defined period. For instance, many anxiety disorders require symptoms such as fear or avoidance to persist for at least 1 month in children and 6 months in adults. Similarly, major depressive disorder necessitates multiple symptoms be present for a minimum of two weeks (American Psychiatric Association, 2015). Practitioners often use frequency-based Likert scales to assess the duration and frequency of symptoms and to aid in diagnosis. These scales typically use response options ranging from “never” to “every day” or “rarely” to “often” to measure symptom severity across a range of conditions, such as depression (Radloff, 1977), anxiety (Spitzer et al., 2006), perceived stress (S. Cohen, 1988), and loneliness (Hays & DiMatteo, 1987). Given their central role in clinical assessment and diagnosis, this paper focuses on frequency-response Likert scales.
The Slider Format
The earliest continuous rating scale used was the graphic rating scale (GRS; M. H. S. Hayes & Patterson, 1921), which typically consists of a series of points forming a continuum and may include descriptive anchors for each point. Visual analogue scales (VAS) emerged shortly thereafter as a more widely recognized format. Popular online survey tools such as Qualtrics often offer a response format similar to VAS, known as slider scales, which have been frequently used in both marketing and social science research. In this paper, we use the term “slider” as a general term for the various continuum response formats mentioned above.
Slider scales offer configurable ranges and can be used with or without numerical markers (Lewis & Erdinç, 2017). They can directly obtain precise values with decimal points and can also be used to collect discrete data. Throughout the text, we employ the term “short-range slider” to denote slider formats with a shorter response range (e.g., 0–14) and “full-range slider” to indicate slider formats spanning a 0 to 100 continuum. Alongside sliders, prior researchers have also examined another response format involving directly entering numbers into a text box (Couper et al., 2006). This response format (available in Qualtrics) permits the inclusion of decimals and enables the generation of continuous data. We refer to this response format as the “number-entry format” in our study.
Likert Versus Slider Under CFA Models
CFA models have been widely used to investigate the factor structure and psychometric properties of measurement instruments in clinical studies (e.g., Lee, 2012; Robins et al., 2001; Van Dam & Earleywine, 2011). As discussed earlier, the traditional CFA models assume that the relationships between latent factors and observed variables are linear, requiring the observed variables (i.e., questionnaire items) to be measured on a continuous metric. While it is common to treat the data obtained from Likert scales as continuous, especially when the number of response categories is large (i.e., ≥5; Rhemtulla et al., 2012), treating data generated from Likert scales as continuous may be problematic from a measurement perspective (Stevens, 1946).
Likert questionnaires typically require subjects to respond to statements reflecting their attitudes or frequency, with responses subsequently assigned numeric values such as 0, 1, 2, 3, or 4. Statistically speaking, the data generated by Likert scales are discrete and ordinal in nature, even when a relatively large number of response categories are used. While the categories on Likert scales exhibit a meaningful order, the distances between adjacent response categories are not necessarily equal. Using evidence from real data, previous studies have shown that the “equal distance” assumption is likely to be violated with Liker scales (Sideridis et al., 2023). Wakita et al (2012) also suggested that the “psychological distance” between response categories is influenced by the number of response categories.
In clinical assessment, some Likert scales are also designed with asymmetric labels for response categories, which are very likely to result in unequal intervals between adjacent categories. For example, the revised five-point Center for Epidemiological Studies-Depression (CES-D) scale (W. W. Eaton et al., 2004) has five response categories that are labeled as “Not at all or less than one day,” “1–2 days,” “3–4 days,” “5–7 days,” and “nearly every day for 2 weeks.” When interpreting the meaning of response categories, the distance between “Not at all or less than one day,” and “1–2 days” differs clearly from that between “5–7 days” and “nearly every day for 2 weeks.” Using Likert scales, especially with a relatively small number of response categories, may result in a loss of information and ceiling or floor effects when categorizing latent continuous variables (Couper et al., 2006; Voutilainen et al., 2016).
The slider is regarded as a viable alternative questionnaire format with several advantages. First, it offers a more continuous scale between two anchors, allowing respondents to provide feedback along a continuum (Cook et al., 2001). Unlike Likert scales, which capture only discrete integer values, sliders enable continuous data collection that prevents loss of information (Huang, 2025). This capability is a key reason for the growing preference for slider scales. Specifically, though Likert scales assume the presence of underlying continuous variables, observed data are measured using a collapsed set of fewer number categories. The act of cutting a continuous scale into several categories introduces errors into analysis, such as categorization errors and transformation errors (DiStefano, 2002) and inevitably results in the loss of measurement information (Bollen & Barb, 1981). In contrast, the wider response range and finer granularity of sliders provide more information and improve the relative stability of data positions. Moreover, the broader response range offered by sliders can mitigate ceiling or floor effects, increasing the likelihood of achieving normally distributed data (Voutilainen et al., 2016).
Despite the benefits of slider scales, criticisms persist that primarily focus on the challenge of missing data within the format (Toepoel & Funke, 2018). Prior research has indicated that in contrast to Likert scales, sliders are associated with longer completion times, higher rates of non-completion and breakoff (Couper et al., 2006) and may lead to higher dropout rates among respondents with lower levels of education (Funke et al., 2011). In addition, some contend that humans have limitations in discerning intricate psychological nuances within sliders, suggesting that additional response categories beyond certain limits introduce more noise than meaningful signals (Cox III, 1980). The complexity of the slider design may also bring additional challenges. For example, factors such as the number of ticks, dynamic labels, and starting points may lead to varying degrees of bias in the subjects’ responses (Funke, 2016; Matejka et al., 2016).
Previous Work
Weighing the advantages and disadvantages of Likert scales and sliders remains a key challenge for psychometric researchers. Few studies provide evidence comparing their performance on several psychometric indicators, and conclusions remain vague. Regarding descriptive statistics, some studies have reported no difference in the mean values obtained from Likert and slider scales (Colvin et al., 2020; Couper et al., 2006; Funke, 2016; Funke & Reips, 2012), whereas others have found significant differences between the two (Lewis & Erdinç, 2017). Research has also indicated that sliders are less vulnerable to bias from confounding factors, such as age and gender, as compared to Likert scales (Hilbert et al., 2016; Voutilainen et al., 2016).
Regarding reliability, several studies have employed Cronbach’s alpha or McDonald’s omega coefficient to assess the internal consistency of data collected via Likert and sliders. While some studies have concluded that there is no discernible difference in reliability between the two response formats (Colvin et al., 2020; Lewis & Erdinç, 2017), others have yielded conflicting evidence (Cook et al., 2001; Couper et al., 2006; Hilbert et al., 2016; Rausch & Zehetleitner, 2014). Finally, with respect to validity, most studies have obtained relatively consistent results that indicate Likert scales and sliders demonstrate nearly identical criterion-related, convergent and discriminant validity (Bolognese et al., 2003; Colvin et al., 2020; Harland et al., 2015; Lewis & Erdinç, 2017; Toepoel & Funke, 2018). Hilbert et al. (2016) revealed that while the correlations among the three underlying factors related to response format were not perfect, and argued that although the psychometric properties were similar, the questionnaires did not appear to measure the same information when the response format was changed.
The Current Study
Although evidence suggests that sliders produce more continuous data and may offer advantages over Likert scales (Reips & Funke, 2008), Likert scales remain more popular and are perceived as easier to complete (Bolognese et al., 2003; Toepoel & Funke, 2018). Few studies have compared Likert and slider scales across various psychometric dimensions, and no consistent conclusions have been drawn. This has resulted in insufficient data to guide practitioners in balancing theoretical assumptions, data quality, and respondent preferences, highlighting a critical gap in the field. This study aims to provide additional empirical evidence to compare Likert-type and slider response formats in the context of fitting CFA models and to offer recommendations for designing and conducting self-report clinical assessments. Specifically, the current study seeks to address the following research question: When applying CFA models in psychometric studies, does using data from commonly used Likert scales and slider scales lead to different conclusions?
To achieve the research aim, we use a widely adopted frequency-type scale (i.e., CES-D) as an example to compare Likert and slider response formats in terms of their performance on a variety of psychometric measures. Data analysis was approached with a practitioner’s perspective in mind. After collecting questionnaire data, researchers typically first examine item data distributions to assess item quality and determine the appropriate estimation method. Next, they evaluate the structural validity of the questionnaire (e.g., model fit indices in CFA or multi-group confirmatory factor analysis [MCFA] models), as well as its internal consistency reliability (e.g., Cronbach’s alpha and McDonald’s omega) and convergent/discriminant validity to assess the scale’s reliability and validity. Subsequently, researchers may compare mean differences in questionnaire scores between target groups of interest (e.g., genders). They then assign total questionnaire scores to each participant to study individual standings within the group or to facilitate screening diagnoses. Researchers may also consider participants’ subjective reactions to the scale to enhance response experience.
Following the logical sequence outlined above, we compared Likert and sliders on five aspects relevant to applied researchers: (a) item-level scores, (b) psychometric properties (including reliability and validity), (c) group mean difference, (d) individual scores, and (e) respondent subjective evaluations. We also integrate visualization technology into data analysis to offer a more intuitive data presentation and to uncover hidden insights (Keim, 2002).
Methods
Participants
The study involved 400 participants, ranging in age from 18 to 86 years (M = 30.89, Mdn = 27, SD = 10.73). The sample size (n = 400) was selected to reflect a moderate to large sample for factor analysis applications (Comrey, 1992). In terms of gender, 147 (37.3%) of participants self-identified as female, 247 (62.7%) as male, and 6 (1.5%) participants’ gender information was missing. 48.2% of participants identified as White, 8.7% as Asian, 15.8% as Black, 18.1% as Mixed, and 9.2% as other races.
Procedure
Participants were recruited in 2023 via the Prolific website without any exclusion criteria. They were asked to enter their unique Prolific IDs, which allowed them to upload their demographic details (e.g., age, gender, race, etc.) as provided during their platform registration. After consenting, participants were given approximately 40 to 60 min to complete the survey, which included 128 questions. Measures relevant to the research goals of the current study were used in the data analysis, as described in the section below. Participants received $12 as compensation upon completing the survey. The research was approved by the Institutional Review Board at the University of South Carolina.
Measures
Four different questionnaires were utilized for the current study. The primary instrument was the short version of the CES-D Scale, which was used to compare differences across response formats in measuring depression. Previous studies showed that depression is positively associated with perceived stress, negatively associated with life satisfaction, and weakly associated with narcissism (Gentile et al., 2013; Koivumaa-Honkanen et al., 2004; Zhang et al., 2015). Thus, the Perceived Stress Scale (PSS-4), Satisfaction with Life Scale (SWLS), and Narcissistic Personality Inventory (NPI-16) were also included. In addition, respondents were also asked to rank order each response format with regard to perceived accuracy, perceived difficulty, enjoyment, and how exhausting they are.
CES-D Scale: The original CES-D (Radloff, 1977) is a self-report measure consisting of 20 items. The CES-D 8 (Van de Velde et al., 2009) is a widely used one-dimensional short version of the CES-D 20. It comprises eight items that assess how often an individual experiences depressive symptoms. Cronbach’s alpha for the CES-D 8 was α = .91 in this research.
We employed CES-D 8 as the target instrument using five distinct response formats (see Figure 1). As previous studies have suggested that variables with five or more categories can be treated as continuous (Rhemtulla et al., 2012), format 1 employed a 5-point Likert scale (W. W. Eaton et al., 2004) where “Not at all or less than one day” was coded as 0, “1–2 days” as 1, “3–4 days” as 2, “5–7 days” as 3, and “Nearly every day for 2 weeks” as 4. Format 2 utilized a short-range slider, spanning from 0 to 14 points without decimal values, with each point representing the number of days the respondent experienced a given feeling. 2 Format 3 featured a full-range slider spanning from 0 to 100, accommodating decimal values, yet with just two endpoint labels (0 and 100). Participants had the option to click and drag the slider to navigate to a specific point on the continuum, or they could directly click on any position along the continuum to move the slider there. Specific values were displayed at the right endpoint of the continuum. Format 4 employed a full-range slider with anchor labels, functioning nearly identically to Format 3 except that Format 4’s inclusion of 11 evenly spaced anchors along the continuum without grid lines. Finally, format 5 offered a numerical input box where participants can input any number within the range of 0 to 100, inclusive of two decimal places. When converting the original response scale of the CES-D 8 questionnaire, which measures frequency (e.g., the number of days the subject felt depressed in the past two weeks), into a full-range slider, the instruction specified that the scale of 0 to 100 denotes the percentage of time in the past 2 weeks during which subjects experienced feelings of depression.
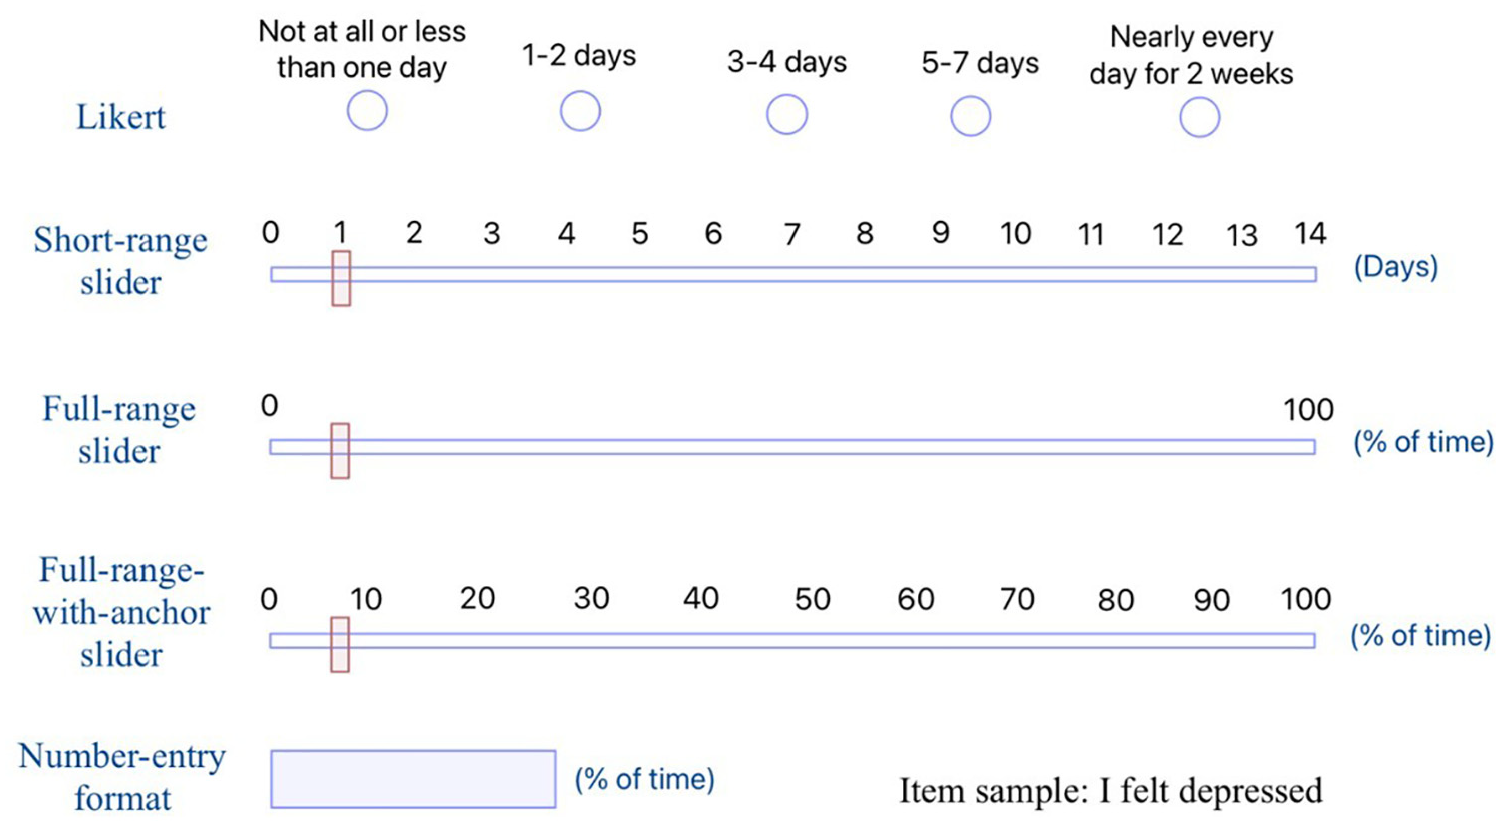
Sample of Five Different Response Formats of the CES-D 8.
A within-subject experiment design was employed to examine the five different formats of the CES-D 8. Each format was randomly ordered with equal probability to mitigate any potential order effects. The presentation order of each item within each questionnaire was also randomized to neutralize any potential impact of previous responses, including factors like response inertia and practice effects (Campbell & Stanley, 1963).
Short Form PSS-4: The PSS-4 (S. Cohen et al., 1983) is a short version of the original PSS, designed to assess an individual’s evaluation of stressful situations. The PSS-4 is comprised of four items (e.g., “In the last month, how often have you felt that you were unable to control the important things in your life?”) and utilized a 5-point Likert scale that ranges from “never” to “very often.” Cronbach’s alpha for the PSS-4 was α = .84 in this study.
SWLS: The SWLS (Diener et al., 1985) is a brief 5-item scale employed to assess an individual’s overall cognitive judgments of life satisfaction (e.g., “In most ways my life is close to my ideal.”). In this study, a 5-point Likert scale was used, ranging from “strongly disagree” to “strongly agree.” Cronbach’s alpha for the SWLS was α = .93 in this study.
NPI-16: The NPI-16 (Ames et al., 2006) is a short measure of narcissism, comprising 16 paired items. In each pair, items consistent with narcissism are coded as 1 (e.g., “I really like to be the center of attention.”), while items inconsistent with narcissism are coded as 0 (e.g., “It makes me uncomfortable to be the center of attention.”). Cronbach’s alpha for the NPI-16 was α = .70 in this study.
Subjective Evaluations of Different Response Formats: After completing the CES-D questionnaires, participants were asked to provide their subjective evaluations of different response formats by rank-ordering the five formats in terms of accuracy, enjoyment, difficulty, and mental exhaustion. For example, participants were given the following item and instructions for accuracy: “Please rank the formats you just completed in terms of how accurately you think they assessed your feelings (please drag each format to change their order), 1 = most accurate, 5 = least accurate.”
Data Analysis
For item-level comparisons, we conducted descriptive analysis of each item separately. Data distributions were compared through various measures including mean, standard deviation, skewness, and kurtosis. To gain more meaningful comparisons across response formats with varying scales, we additionally calculated the mean and standard deviation based on the percent of maximum possible (POMP) score (P. Cohen et al., 1999): POMP = [(observed − minimum)/(maximum − minimum)] × 100, where observed = the observed score, minimum = the minimum possible score on the scale, and maximum = the maximum possible score on the scale. A pairwise t-test with Bonferroni correction (Abdi, 2007) was performed on POMP mean values to test mean differences among various response formats. In addition, we conducted the one-sample Kolmogorov–Smirnov (KS) test of normality to assess the goodness of fit to a theoretical distribution (Massey, 1951), with the (D) test statistic representing the maximum vertical deviation between sample and the reference distribution. We also created distribution plots to compare subjects’ responses on Likert with scores on other response formats.
For psychometric performance comparison, we first compared the factor structure across formats using CFA to determine the factor structure of the CES-D 8 scale in each response format. Given descriptive analysis indicated that items were non-normally distributed across all formats, we used robust maximum likelihood (MLR) for model estimation. Model fit indices considered were: the Satorra–Bentler (SB) scaled (mean-adjusted) chi-square statistic (Satorra & Bentler, 2001); the comparative fit index (CFI; Bentler, 1990) (good ≥ 0.95; acceptable ≥ 0.90); the Tucker–Lewis index (TLI; Tucker & Lewis, 1973) (good ≥ 0.95; acceptable ≥ 0.90; Hu & Bentler, 1999); the root mean square error of approximation (RMSEA; Steiger, 1989) (acceptable ≥ 0.06; unworthy ≥ 0.10; Browne & Cudeck, 1992; Hu & Bentler, 1999); the standardized root mean squared residual (SRMR; Bentler, 1995) with a cutoff value of ≤0.08.
MCFA with the MLR estimator was conducted to assess potential differences in measurement invariance (MI) across response formats. While MI can be examined across multiple identifying characteristics in clinical assessment settings, we consider only one example here (i.e., gender) to explore how scale format may impact invariance findings. Gender differences are considered an important factor in clinical assessment studies (N. R. Eaton et al., 2012), with a great number of studies examining the issue of MI of questionnaires across gender groups (e.g., Nelemans et al., 2019; Ock et al., 2020; Suh et al., 2017). Three nested models (i.e., configural invariance model, metric invariance model, and scalar invariance model; Cheung & Rensvold, 2002) were fitted and compared by using the SB scaled chi-square difference tests (Satorra & Bentler, 2001), ΔCFI and ΔRMSEA. In each model, the female group served as the reference group. A significant result of the SB scaled chi-square difference test statistic (TRd) indicates rejection of the null hypothesis of MI. ΔCFI ≤ 0.01 and ΔRMSEA ≤ 0.015 would indicate invariance (Chen, 2007).
Regarding reliability, we evaluated both Cronbach’s alpha (Cronbach, 1951) and McDonald’s omega (McDonald, 1999). Cronbach’s coefficient alpha serves as a widely recognized indicator for assessing the internal consistency of a questionnaire. While there is no clear and unified standard for its interpretation (Taber, 2018), we adopted the commonly used cutoff value in practical research (i.e., excellent ≥ 0.90; good ≥ 0.80; acceptable ≥ 0.70). McDonald’s omega, which does not rely on the assumption of essential tau-equivalence (A. F. Hayes & Coutts, 2020), is an alternative indicator recommended for assessing internal consistency. The adopted cutoff value for the McDonald’s omega aligns with the cutoff value traditionally used for Cronbach’s alpha. When considering convergent/discriminant validity, Pearson correlation coefficients (Pearson, 1920) were examined between applicable response formats. A higher absolute value indicates a stronger linear relationship (Schober et al., 2018).
For group mean comparisons, we performed t-tests to compare the mean depression scores from the five response formats across gender groups. Cohen’s d (J. Cohen, 1962) was utilized to assess the effect size, where an absolute value of 0.2 was defined as a small effect size, 0.5 was defined as a medium effect size, and 0.8 was defined as a large effect size. For individual scores comparison, we also drew scatterplots to compare participants’ sum scores on the Likert format with their sum scores on other response formats.
For subjective ranking comparison, we provided stacked bar charts to visualize subjects’ subjective ranking of different response formats in terms of accuracy, enjoyment, difficulty, and mental exhaustion. As discussed earlier, for a given evaluation criterion (e.g., difficulty), respondents were asked to rank the five response formats in order from 1 (most difficult) to 5 (least difficult). We then counted the number of times each rank was assigned to a response format and plotted the frequency distributions using stacked charts.
We obtained complete data for all survey questions, except for six participants whose gender information was missing. Since cross-gender comparisons were conducted, we used the complete data set of 394 participants for all analyses reported in the current manuscript. 3 All data analyses were conducted using R version 4.2.2 (R Development Core Team, 2022), both CFA and MCFA models were conducted using the lavaan package version 0.6-18 (Rosseel, 2012).
Results
Item-Level Comparison
Descriptive Statistics
Table 1 presents the descriptive statistics for one negatively worded item and one positively worded item, respectively. Additional tables for other items are available in the Supplemental Materials. For negatively worded items (e.g., “I felt depressed”), the Likert format consistently showed the highest means (ranged from 40.74 to 52.09 across items) and the lowest skewness (ranged from −0.03 to 0.39 across items) based on the POMP scores. However, for positively worded items (e.g., “I was happy”), the Likert format yielded the lowest means (Mpomp = 40.74 and 40.48), and the highest skewness values (0.24 and 0.21, respectively). For all items, the Likert format consistently yielded the highest standard deviations (ranged from 30.60 to 35.26 across items). After applying Bonferroni correction for multiple comparisons, significant differences in POMP means between Likert and other response formats were detected, except for items 1 and 5 (see Supplemental Material). Overall, full-range slider formats and number-entry format produced more similar distributions across all items (Figures 2 and 3 depict the histograms for one negatively worded item and one positively worded item, respectively). Additional figures for other items can be found in the Supplemental Materials. Though the Likert format consistently showed the highest D value among all formats, indicating the greatest deviation from a normal distribution, the KS test indicated that the distributions were significantly non-normal for all formats on all items (D ranged from 0.08 to 0.23, all ps < .05).
Descriptive Statistics of Sample Items of CES-D 8.
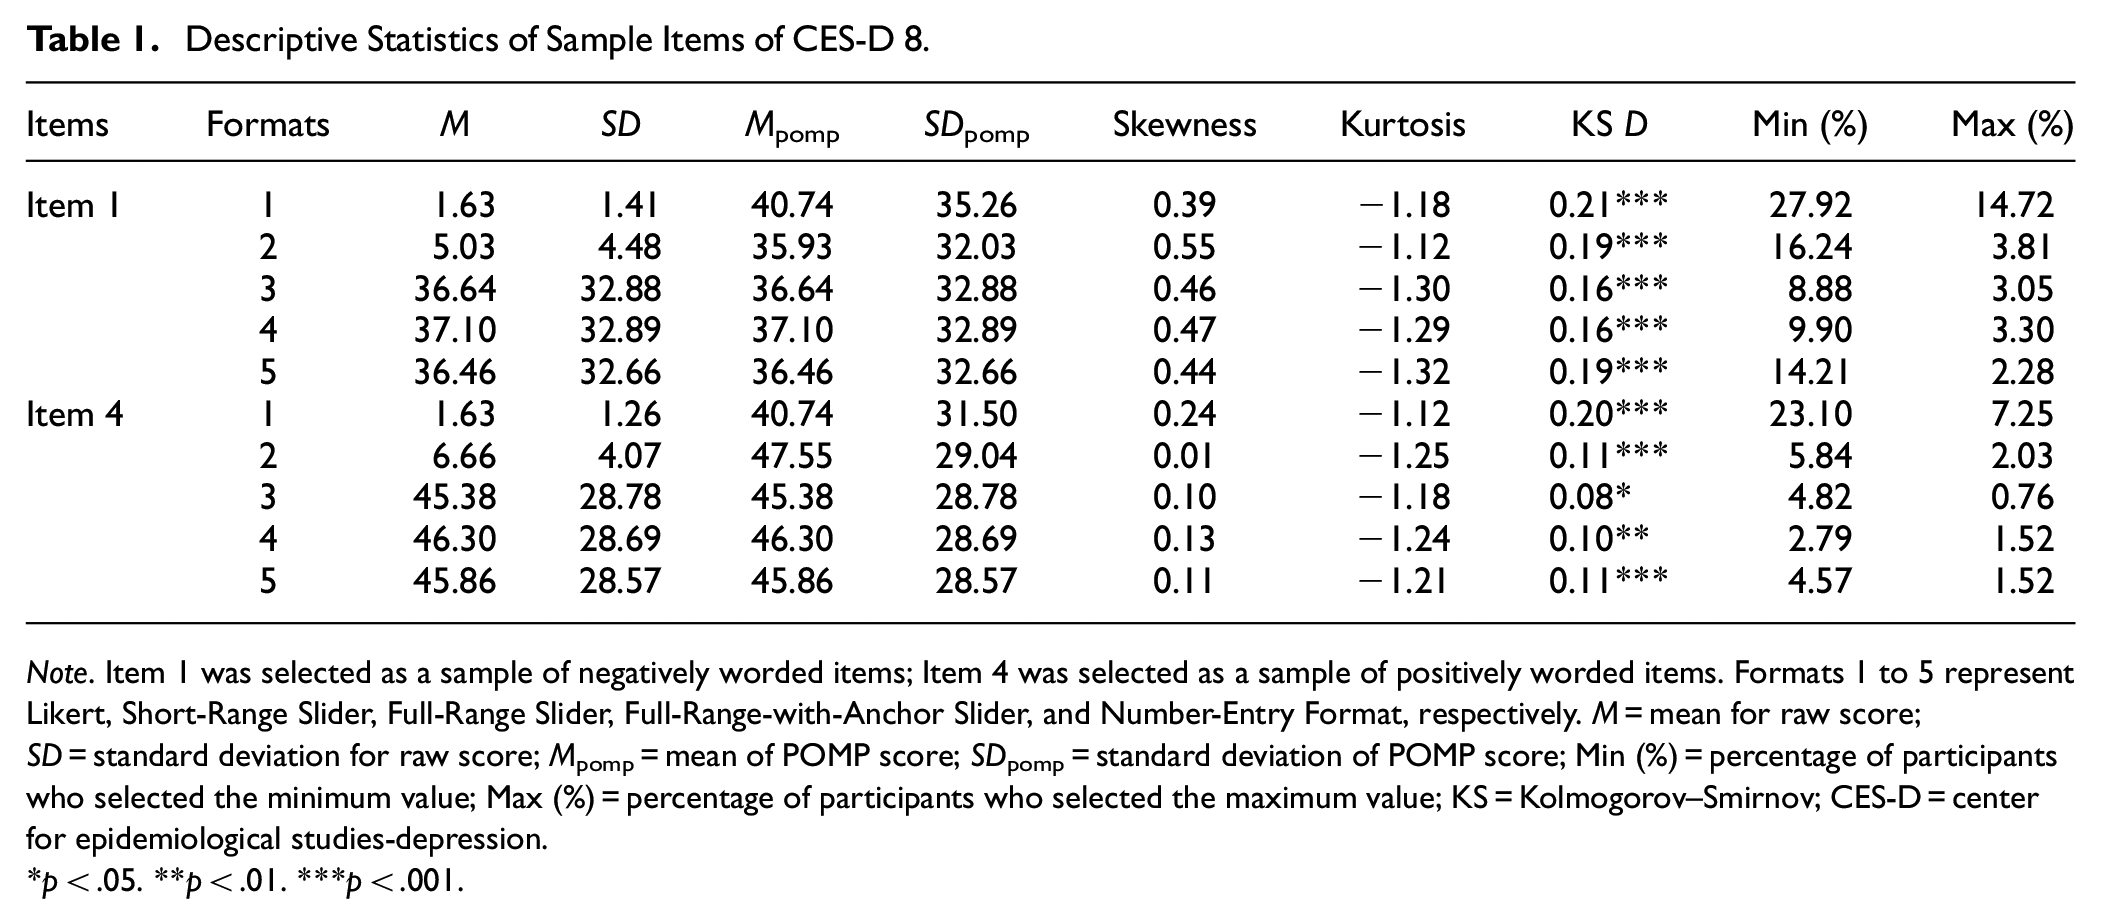
Note. Item 1 was selected as a sample of negatively worded items; Item 4 was selected as a sample of positively worded items. Formats 1 to 5 represent Likert, Short-Range Slider, Full-Range Slider, Full-Range-with-Anchor Slider, and Number-Entry Format, respectively. M = mean for raw score; SD = standard deviation for raw score; Mpomp = mean of POMP score; SDpomp = standard deviation of POMP score; Min (%) = percentage of participants who selected the minimum value; Max (%) = percentage of participants who selected the maximum value; KS = Kolmogorov–Smirnov; CES-D = center for epidemiological studies-depression.
p < .05. **p < .01. ***p < .001.
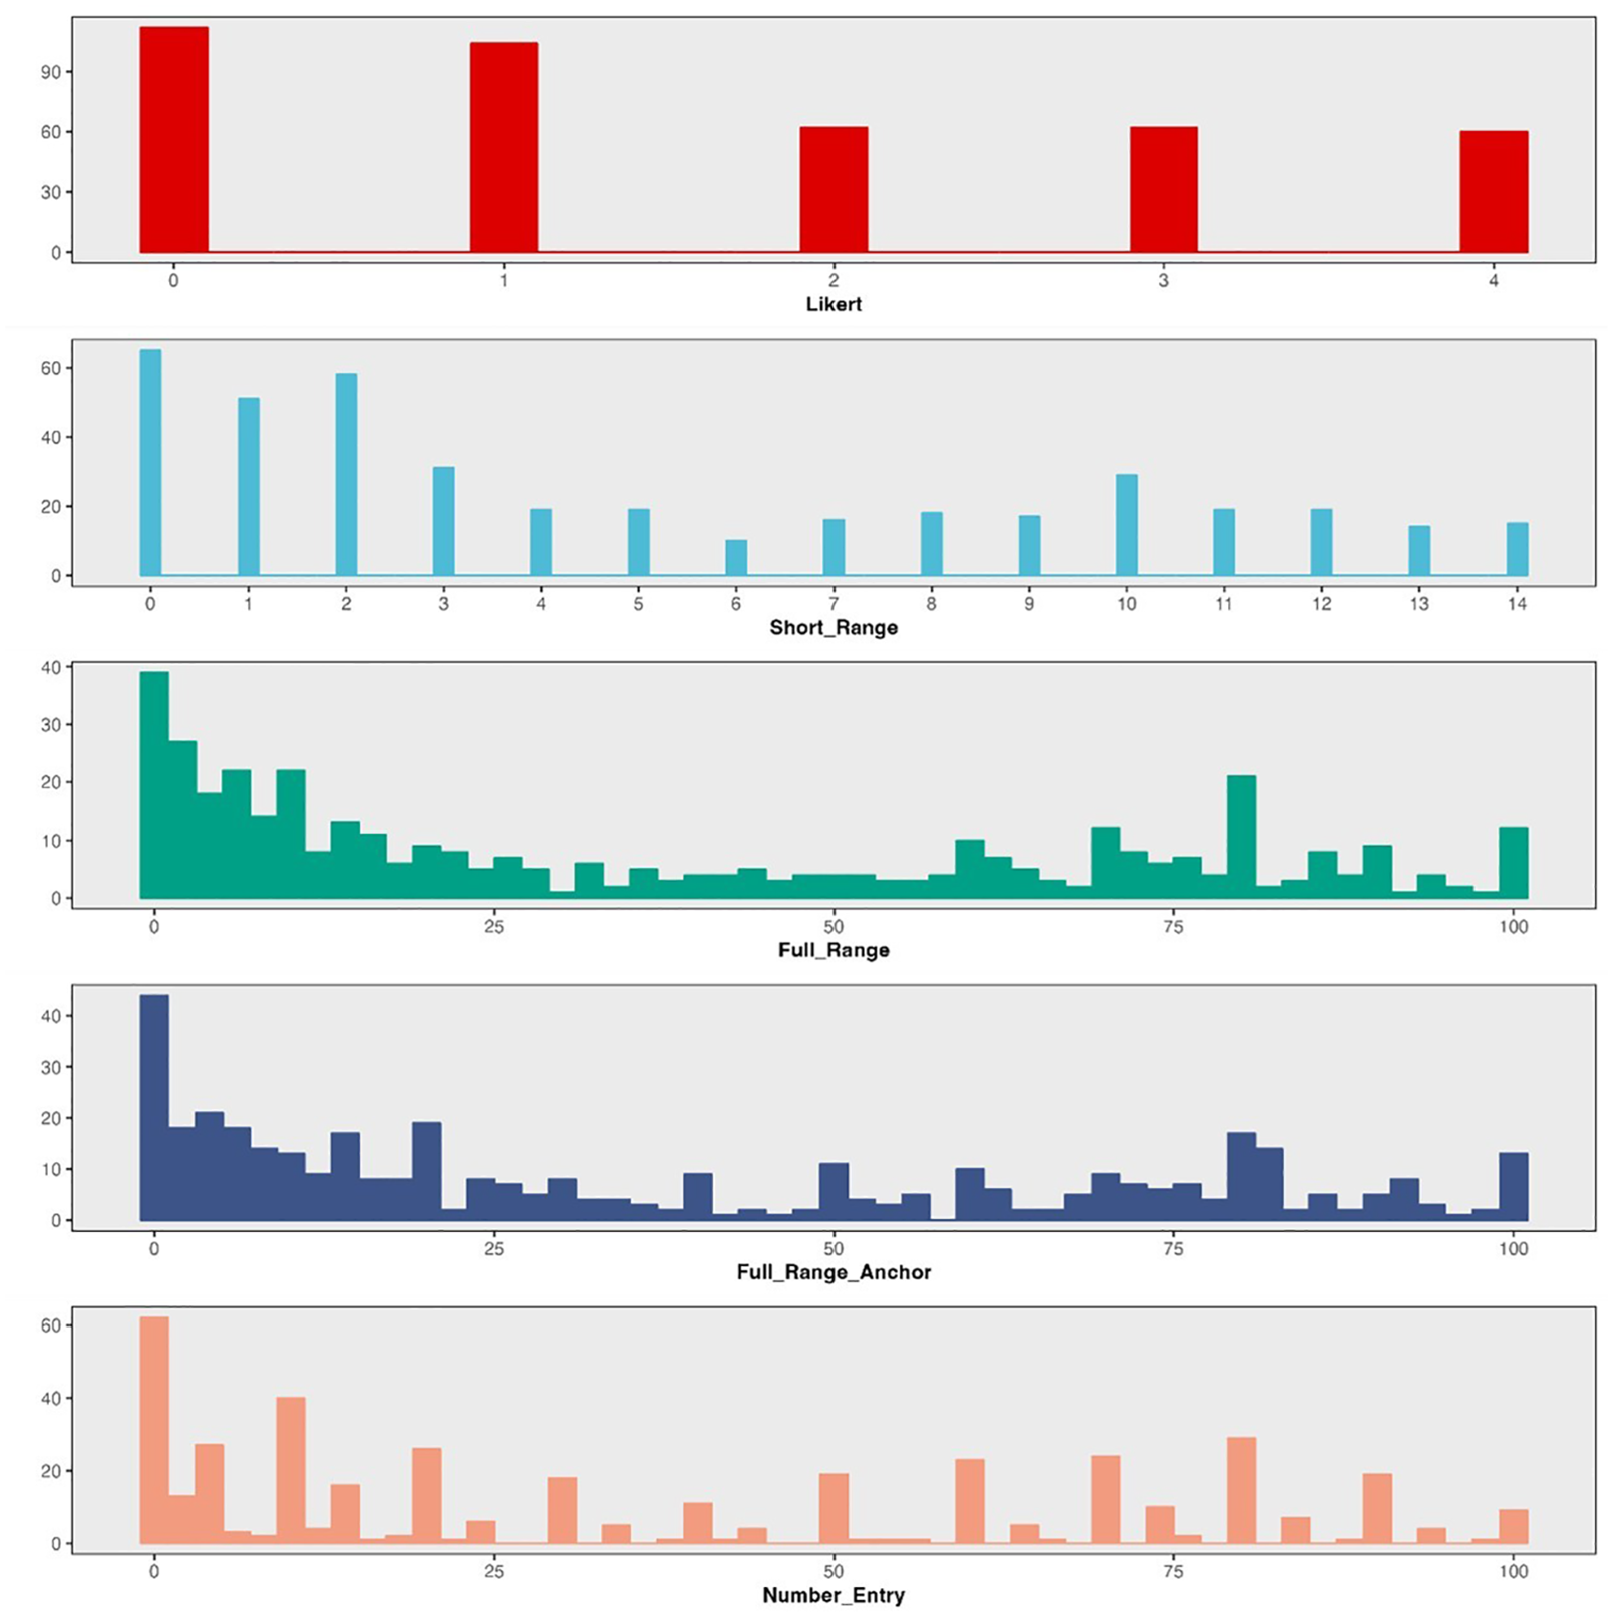
Distribution of Difference Response Formats on Item 1 of CES-D 8.
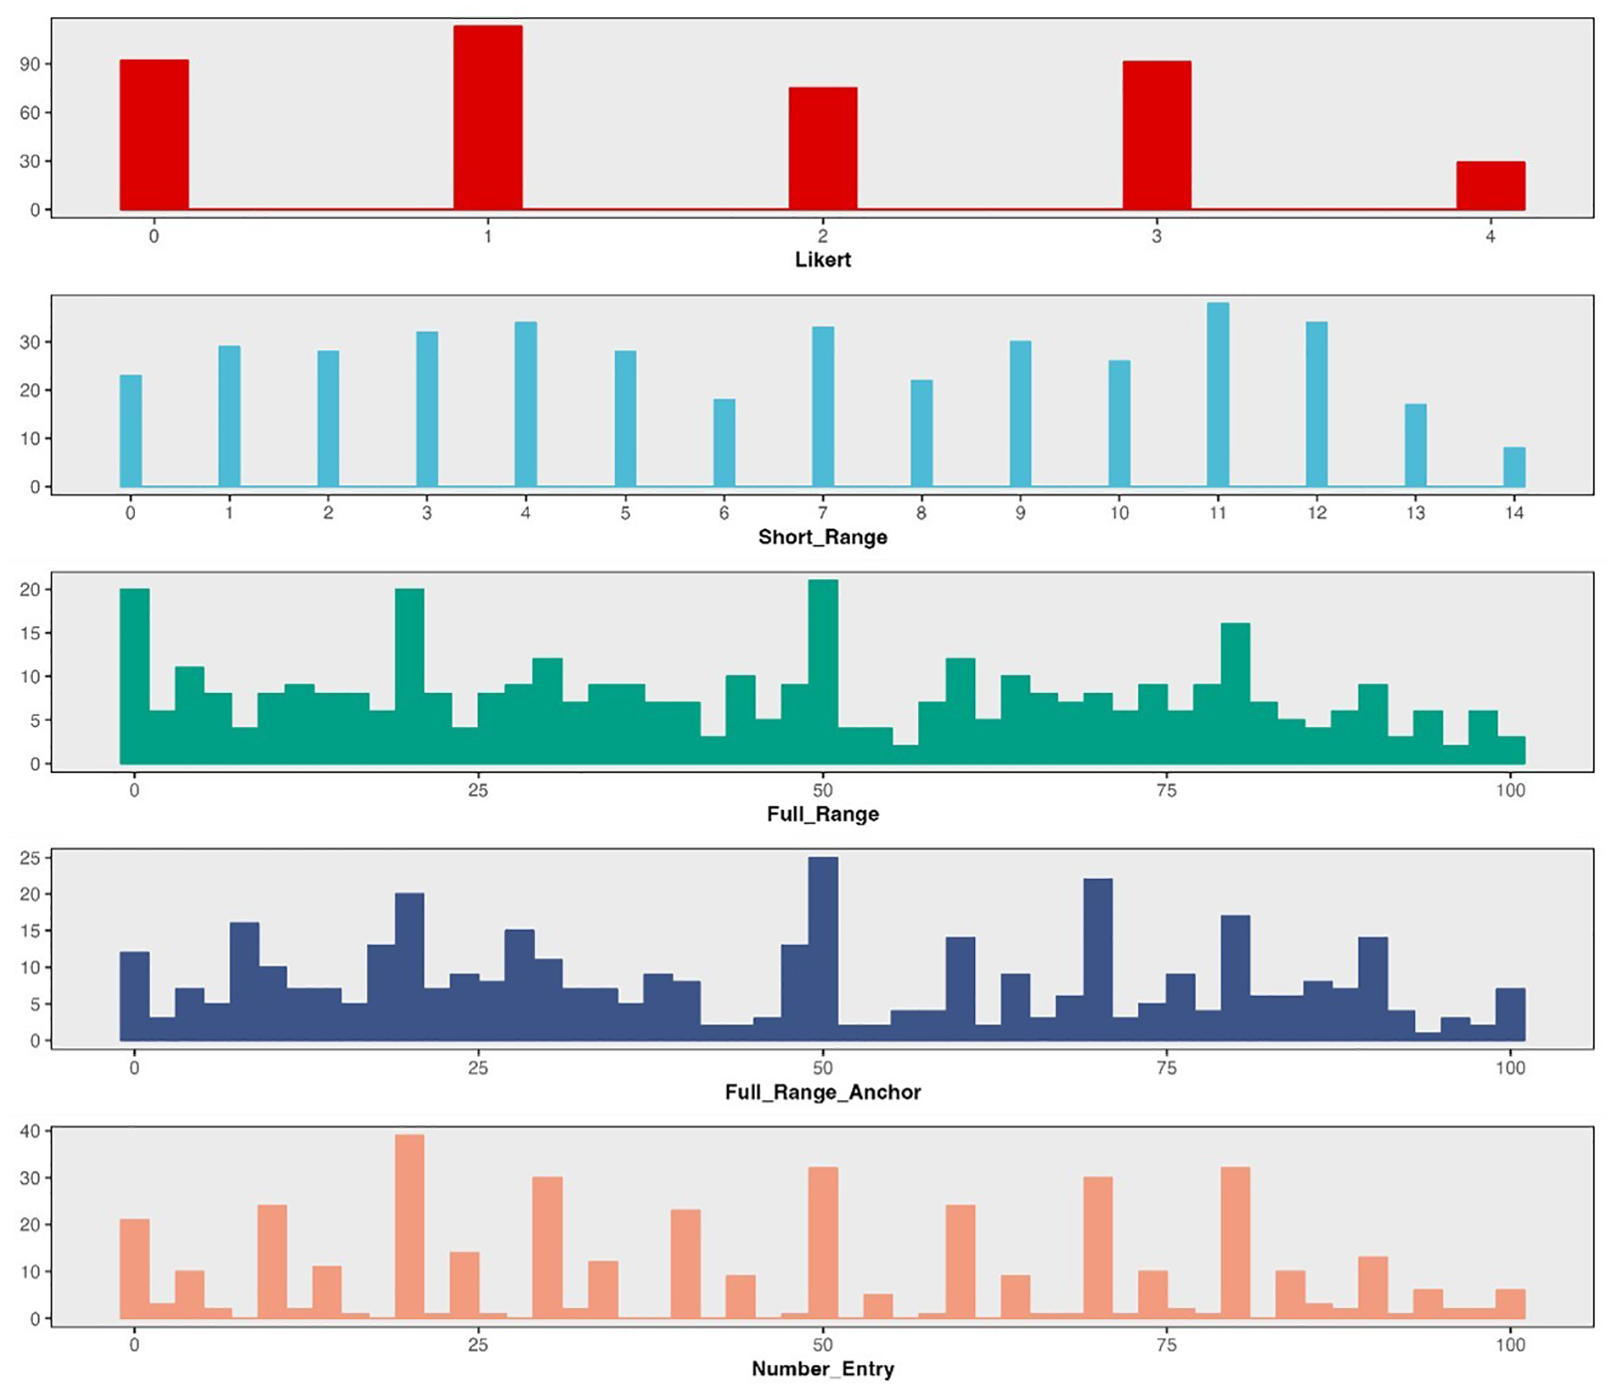
Distribution of Difference Response Formats on Item 4 of CES-D 8.
The Likert format exhibited stronger ceiling and floor effects compared to other response formats across all items. Specifically, the proportion of participants selecting the minimum value on Likert ranged from 13.20% to 27.92%, while the proportion selecting the maximum value ranged from 6.50% to 18.75%. In comparison, 2.79% to 16.24% selected the minimum value and 0.76% to 5.84% selected the maximum value on other formats.
Item Category Matching
To better understand the assumption of “equal intervals,” we created merged distribution plots to examine the relationship between the distributions of Likert response categories and the scores obtained from other, more continuous response formats. If slider scales better represent true continuous responses, when the equidistance assumption holds, we would expect the responses of the five Likert categories to be evenly distributed along the continuous scores generated by the slider formats in the merged distribution plot. On the other hand, if the distributions of Likert categories do not align evenly with these intervals and there is a large area of overlap, it may indicate a violation of the equidistance assumption.
In general, we observe a mismatch between participants’ scores on the Likert format and their scores on other response formats. Figures 4 and 5 illustrate how subjects’ response on the Likert scale corresponds to scores on slider and number-entry formats, respectively. We chose one positively worded item and one negatively worded item as examples for each (see Supplemental Materials for additional figures). For negatively worded items, the distribution of score matches flattens as the category number increases, reflecting a broader range of potential scores. For instance, selecting the option “0” on the Likert scale (i.e., “Not at all or less than one day”) correspond to a range of 0 to 40 on the slider (i.e., 0%–40% of the time over the past two weeks), whereas selecting option “1” (i.e., “1–2 days”) may span from 0 to 75 (i.e., 0%–75% of the time over the past two weeks). This demonstrates that adjacent categories correspond to varying distances with noticeable overlap, pointing to uneven distributions (see Figure 4). Although reverse-coded items exhibited a reduction in overlap, differences in the corresponding distances between categories persist, indicating a consistent violation of the equidistance assumption (see Figure 5).
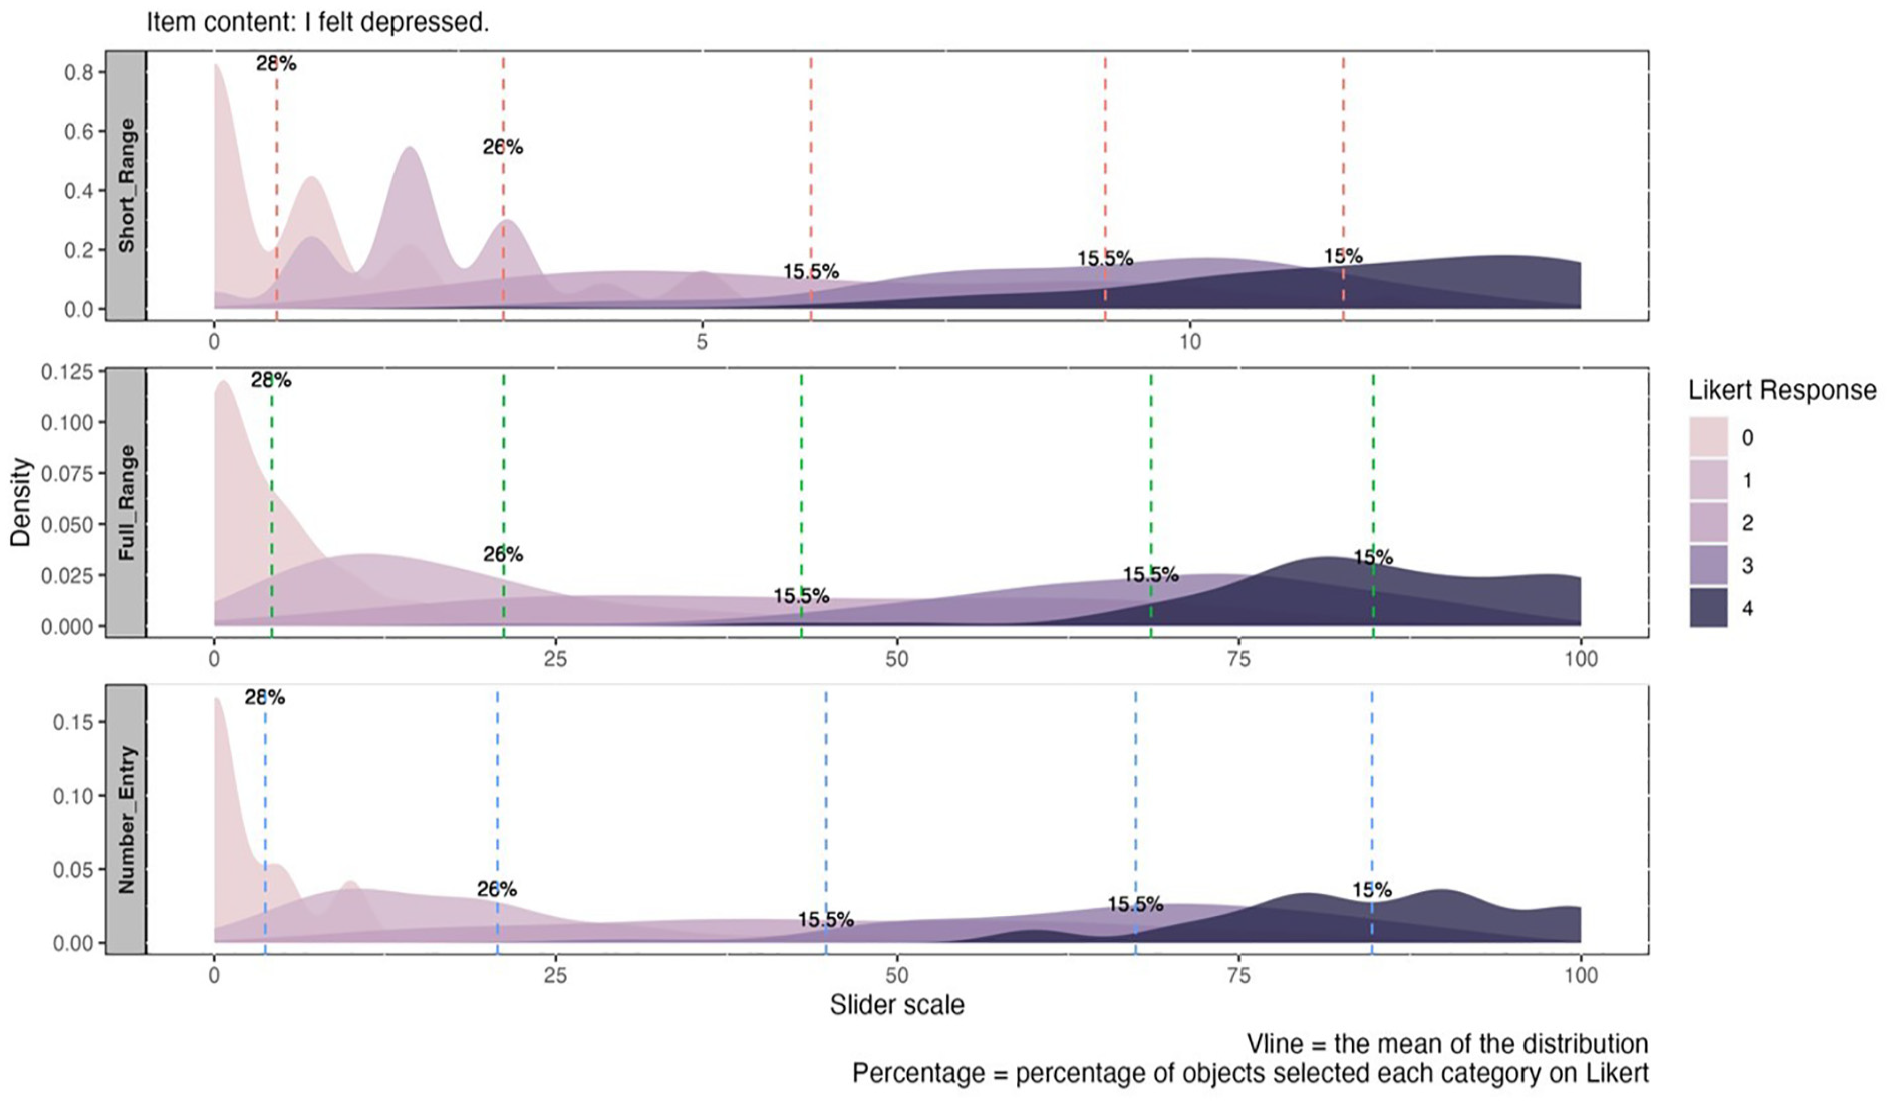
Merged Distribution Plot for Different Categories on Likert Versus Other Response Formats for Negatively Worded Item.
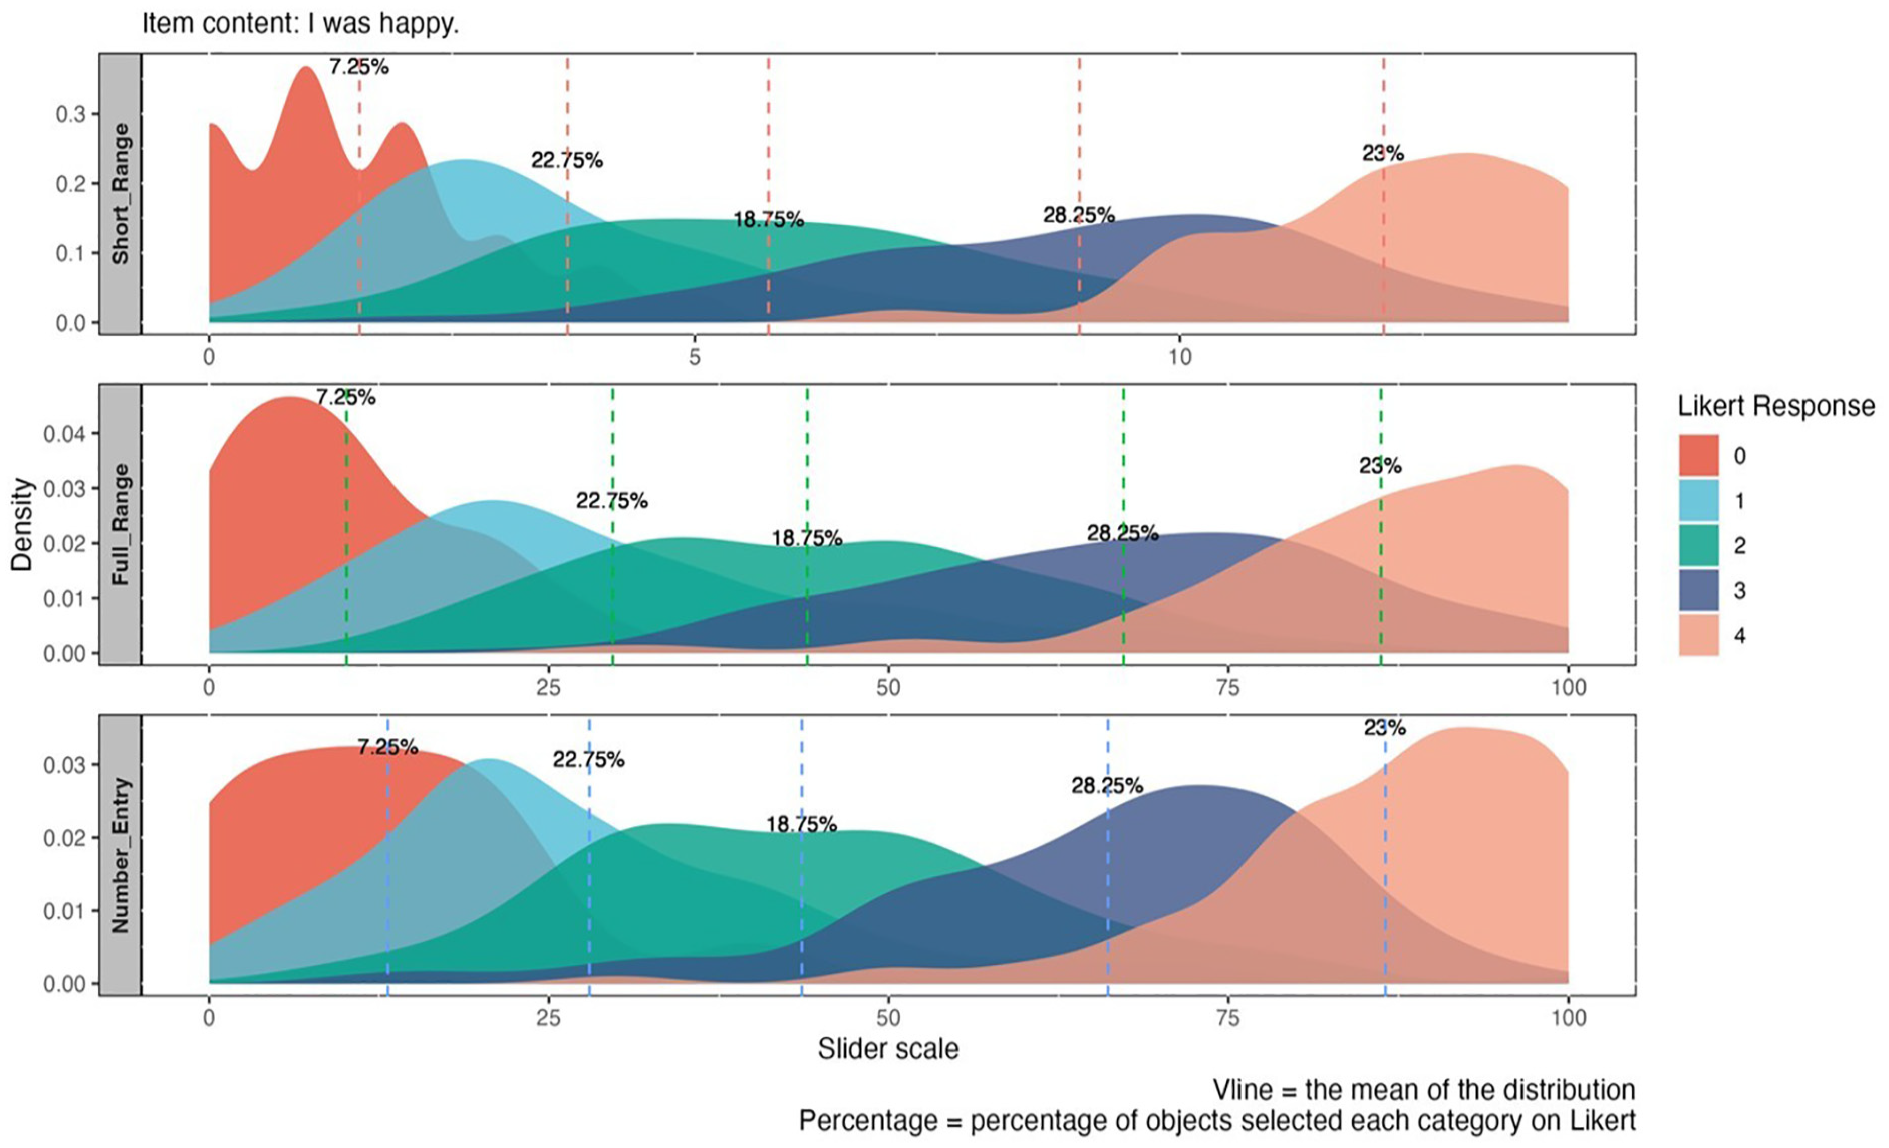
Merged Distribution Plot for Different Categories on Likert Versus Other Response Formats for Positively Worded Item.
Psychometric Property Comparison
Confirmatory Factor Analysis
A one-factor model was fitted to the data, revealing very poor model fit indices across all response formats (RMSEA ranged from 0.223 to 0.264; CFI ranged from 0.776 to 0.802; TLI ranged from 0.686 to 0.723). Considering the two positively worded items could potentially introduce method bias (Siddaway et al., 2017), we subsequently tested a unidimensional model that allowed for correlated residuals between these items. This adjustment resulted in significant improvement in model fit across formats (see Table 2). Thus, the unidimensional correlated-residual model was used for subsequent comparison of factor structures.
Goodness of Fit Indices of CES-D 8.
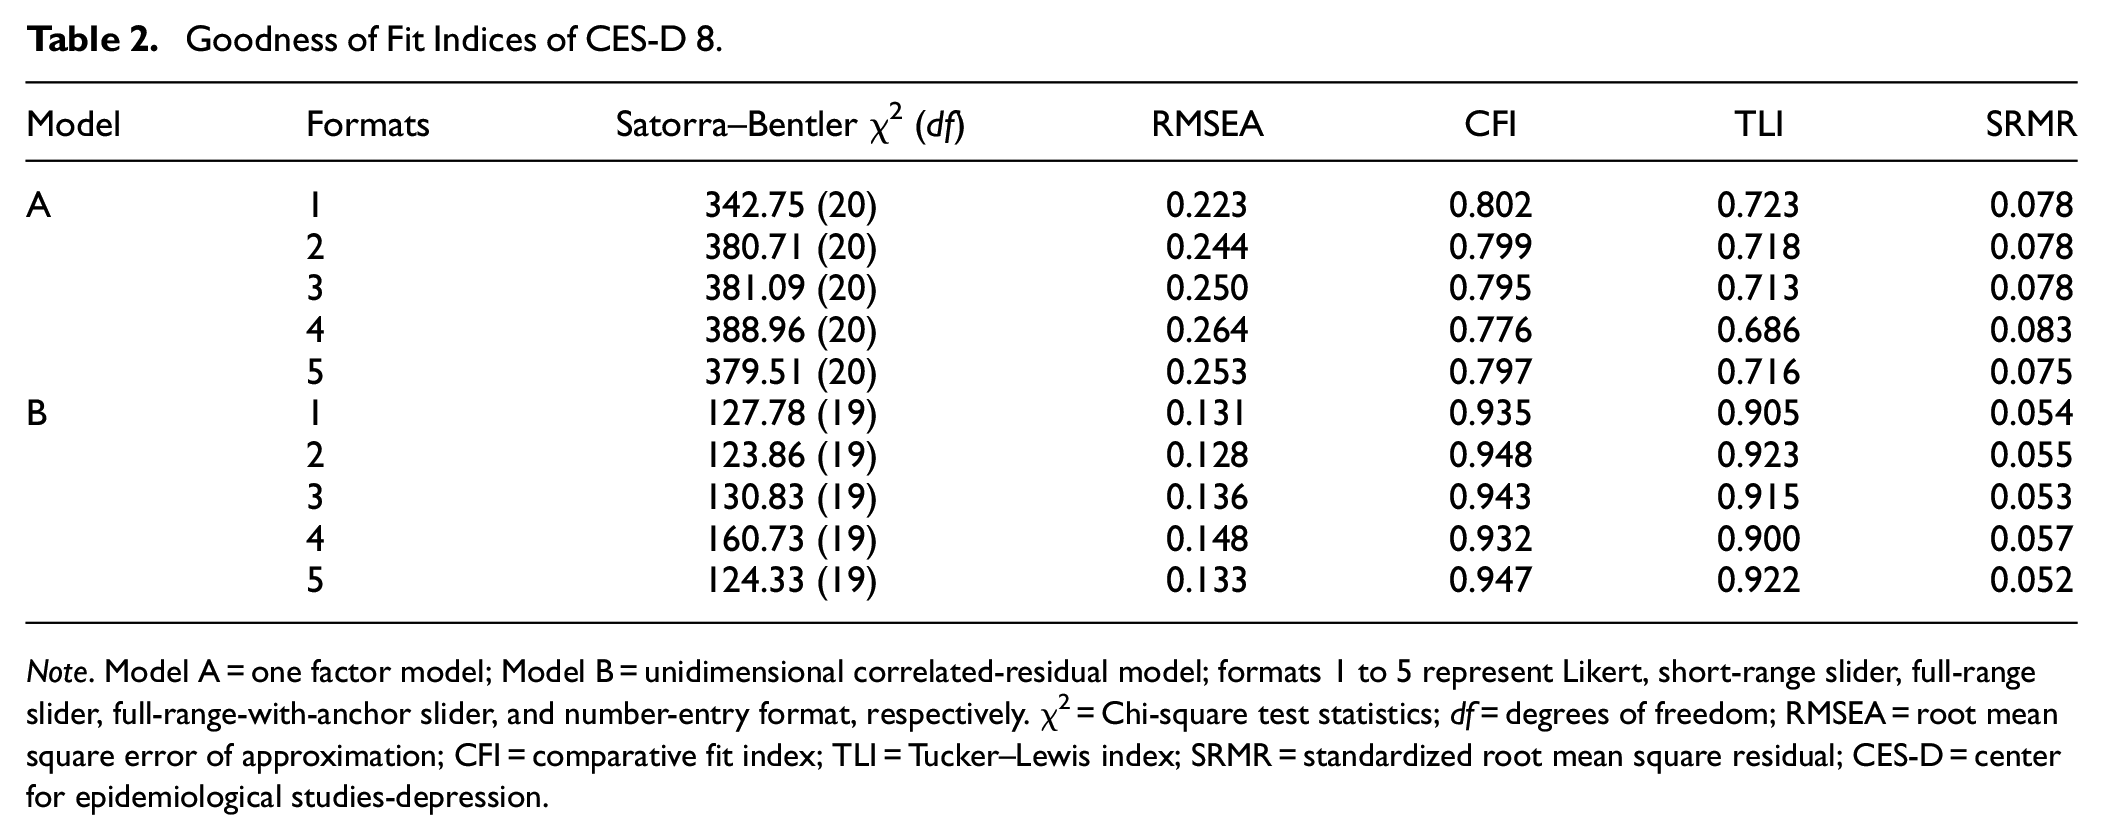
Note. Model A = one factor model; Model B = unidimensional correlated-residual model; formats 1 to 5 represent Likert, short-range slider, full-range slider, full-range-with-anchor slider, and number-entry format, respectively. χ2 = Chi-square test statistics; df = degrees of freedom; RMSEA = root mean square error of approximation; CFI = comparative fit index; TLI = Tucker–Lewis index; SRMR = standardized root mean square residual; CES-D = center for epidemiological studies-depression.
Model Fit indices from different response formats provide consistent suggestions for model fit. The Likert (SBχ2/df ≈ 127.78/19, CFI = 0.935, TLI = 0.905, RMSEA = 0.131, SRMR = 0.054) and full-range-with-anchor slider (SBχ2/df ≈ 160.73/19, CFI = 0.932, TLI = 0.900, RMSEA = 0.148, SRMR = 0.057) yielded relatively poor values for the model fit indices. Variations across all other formats were minimal (see Table 2), with RMSEA values ranging from 0.128 to 0.136, CFI from 0.943 to 0.947, TLI from 0.915 to 0.923, and SRMR from 0.052 to 0.055. The short-range slider produced slightly better results (SBχ2/df ≈ 123.86/19, CFI = 0.943, TLI = 0.915, RMSEA = 0.128, SRMR = 0.055). All response formats yielded similar standardized factor loadings across all items (see Supplemental Materials).
Measurement Invariance
MI analysis was conducted across gender for each response format with the unidimensional correlated-residual model. Given that the demographic variable indicators for subjects’ gender provided by Prolific only encompassed males and females, the gender comparative analysis in this article solely focuses on these two gender groups. Table 3 summarizes the model fit indices and results of the difference tests for each nested model across all response formats. Overall, all formats achieved scalar invariance given ΔRMSEA (ranged from −0.007 to −0.013) and TRd values (ranged from 2.930 to 9.933, all ps > .05), though the number-entry format failed to achieve metric invariance based on ΔCFI (ΔCFI = −0.021).
Measurement Invariance of CES-D 8.
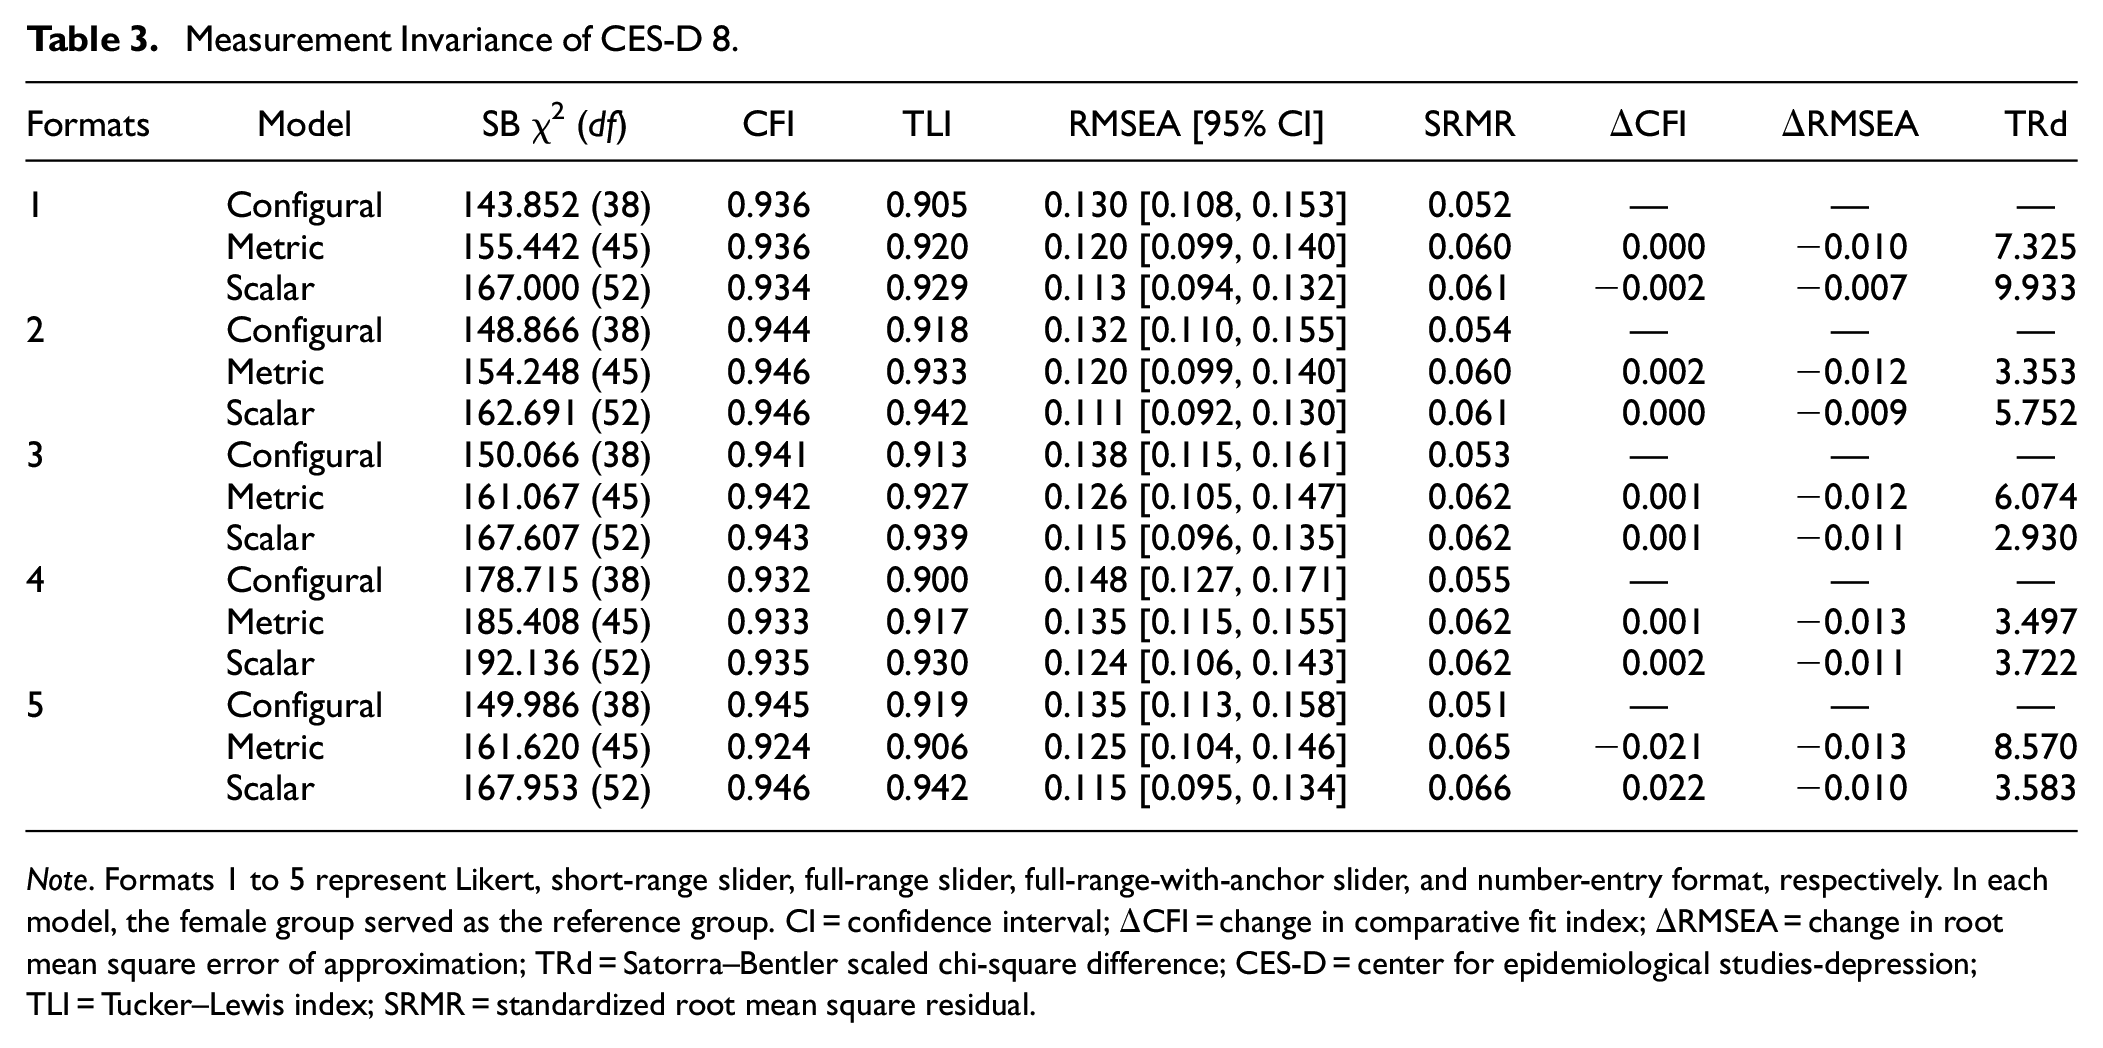
Note. Formats 1 to 5 represent Likert, short-range slider, full-range slider, full-range-with-anchor slider, and number-entry format, respectively. In each model, the female group served as the reference group. CI = confidence interval; ΔCFI = change in comparative fit index; ΔRMSEA = change in root mean square error of approximation; TRd = Satorra–Bentler scaled chi-square difference; CES-D = center for epidemiological studies-depression; TLI = Tucker–Lewis index; SRMR = standardized root mean square residual.
Reliability and Convergent/Discriminant Validity
Sliders and number-entry format displayed similar values for both Cronbach’s alpha (all α = .91) and MacDonald’s omega (range from .90 to .91) compared to Likert scale (α = .89 and ω = .89) (see Table 4). Regarding convergent/discriminant validity, almost identical correlation coefficients were observed among different response formats and the SWLS (r ranged from −.70 to −.72; all ps < .001), the PSS (r = .80 for the short-range slider and r = .81 for all other formats; all ps < .001), and the NPI (r = −.17 and p < .001 for the full-range slider; r = −.16 and p < .01 for all other formats), respectively. Overall, these results indicate that both reliability and convergent/discriminant validity performances across all response formats were essentially the same.
Reliability, Convergent, and Discriminant Validity of Different Response Formats for CES-D 8.
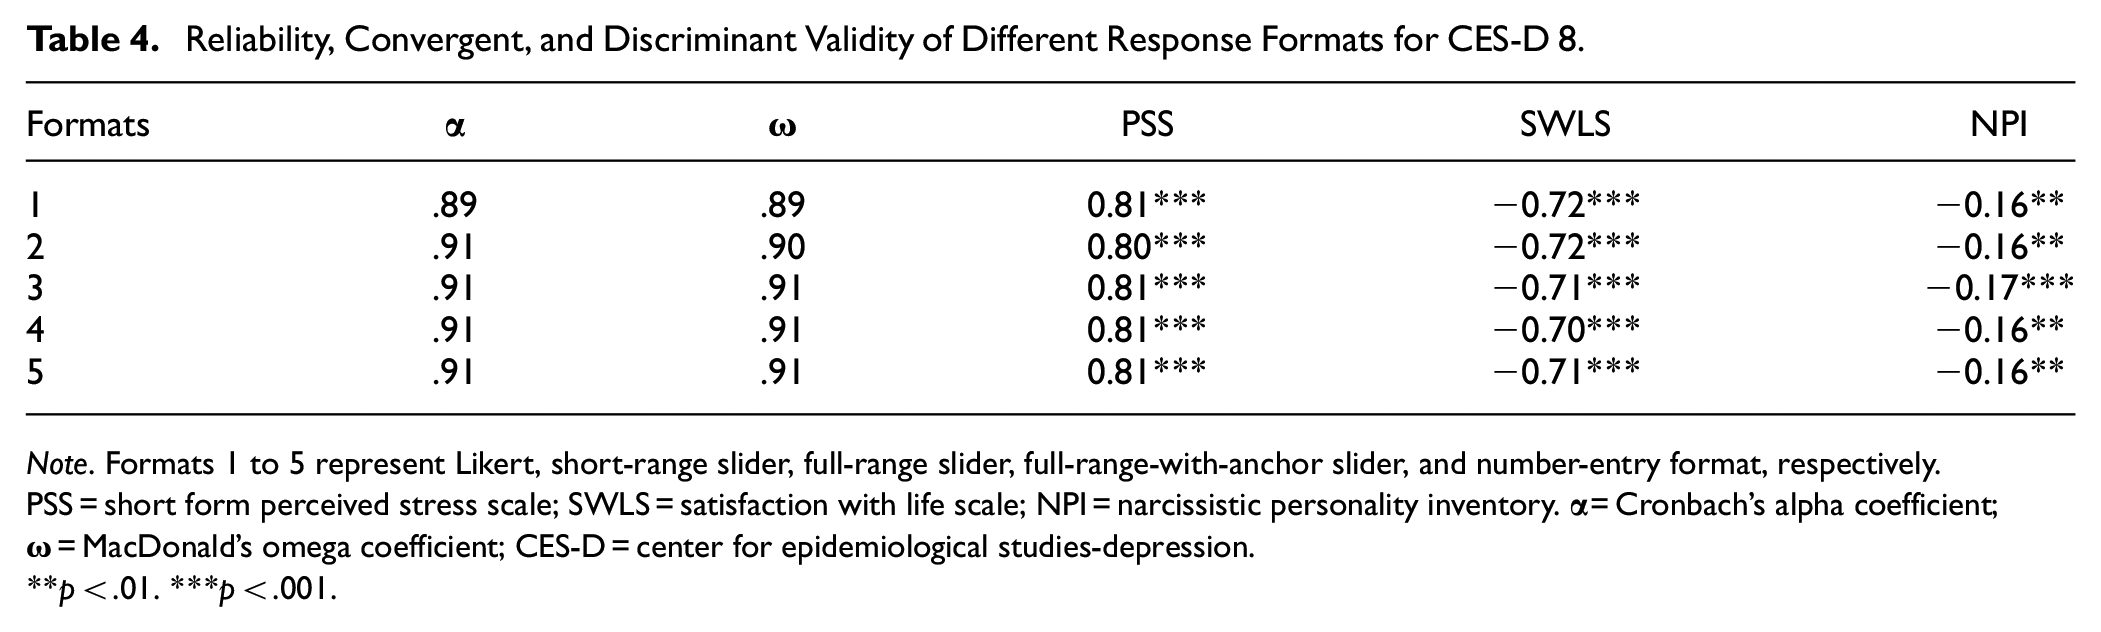
Note. Formats 1 to 5 represent Likert, short-range slider, full-range slider, full-range-with-anchor slider, and number-entry format, respectively. PSS = short form perceived stress scale; SWLS = satisfaction with life scale; NPI = narcissistic personality inventory.
p < .01. ***p < .001.
Cross-Gender Comparison
Results indicated that the mean values for males (M ranged from 13.46 to 312.83) were consistently lower than those for females (M ranged from 15.28 to 350.26) across all response formats (see Table 5). Given the potential bias introduced by directly using observed test scores to compare group means (Borsboom, 2006), t-test results are meaningful only if the response formats hold the same meaning for both males and females. Based on the MI results, we proceeded with comparisons of group means across all response formats, as they demonstrated strong equivalence. Results indicated that different conclusions were obtained when comparing means across gender groups using different response formats. Specifically, the gender difference reached statistical significance only when utilizing Likert scales (t[392] = −2.2, p < .05). The Likert scale also yielded higher absolute Cohen’s d values (|Cohen’s d| = .23) compared to other formats (|Cohen’s d| ranged from .15 to .20).
The Effect of Different Response Formats on Mean Difference Between Genders.
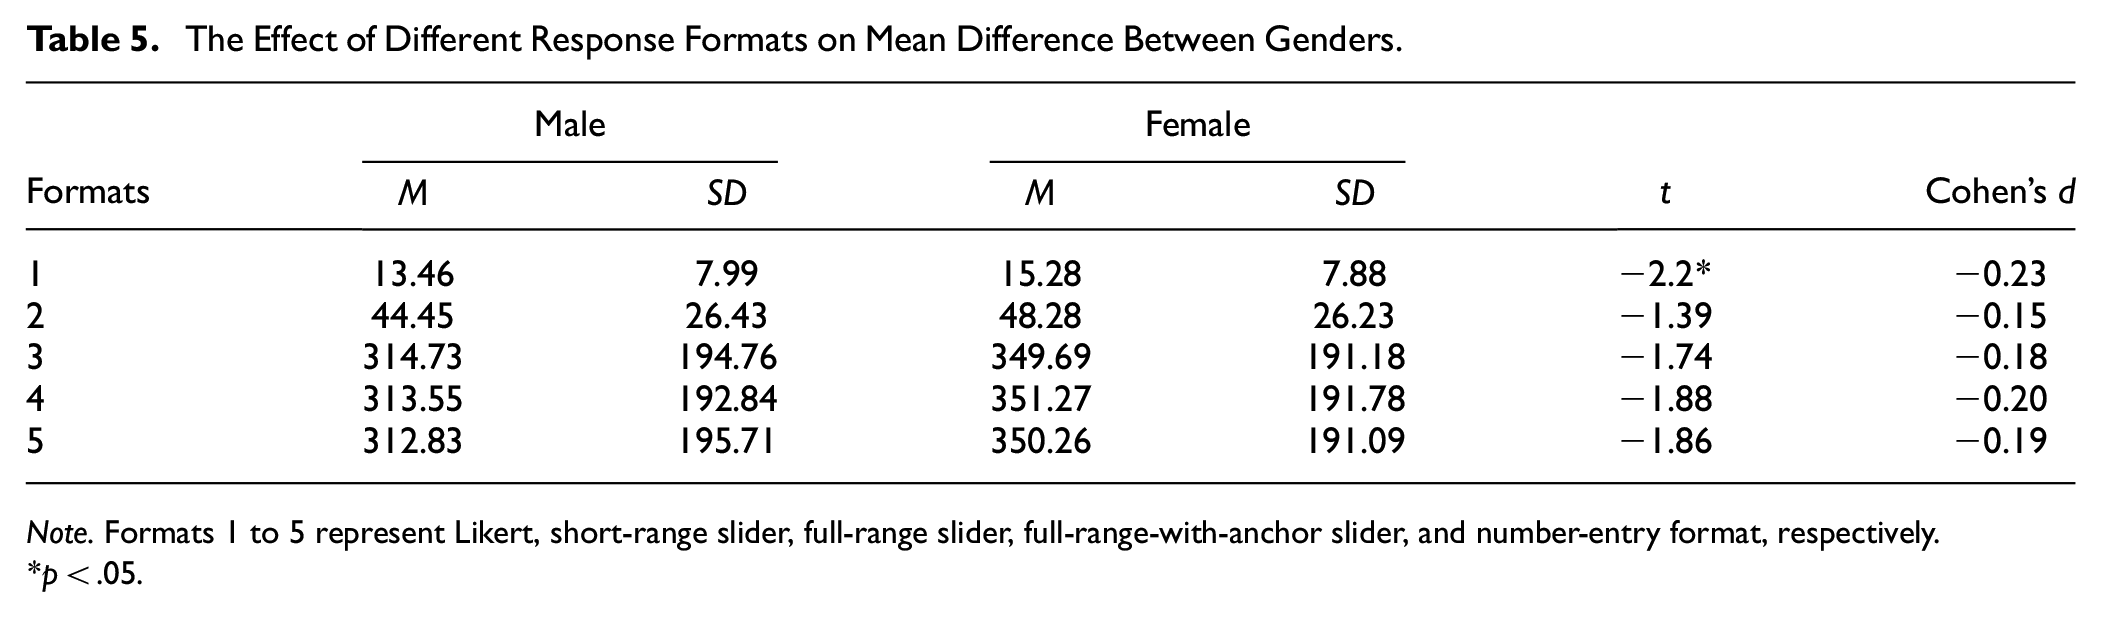
Note. Formats 1 to 5 represent Likert, short-range slider, full-range slider, full-range-with-anchor slider, and number-entry format, respectively.
p < .05.
Individual Score Comparison
Sum Score Descriptive Analysis
Two full-range slider formats and number-entry format yielded similar mean and standard deviation values (see Table 6). The POMP score revealed that the Likert scale demonstrated the highest POMP mean (Mpomp = 44.18), whereas other formats maintained relatively consistent POMP means (Mpomp ranged from 40.84 to 40.97). After Bonferroni correction, the differences between Likert and other response formats were not significant, however (see Supplemental Material). Although the two full-range sliders and number-entry format displayed a flatter shape (and thus greater data dispersion; see Figure 6) compared to the Likert scale, the POMP standard deviation (ranged from 23.56 to 24.95), skewness (ranged from 0.16 to 0.22), and kurtosis (ranged from −0.98 to 1.05) exhibited minimal variation across different response formats (see Table 6). The KS test indicated that all response formats show relatively the same pattern (D ranged from 0.08 to 0.09, all ps < .05).
Descriptive Statistics of Sum Scores of CES-D 8.
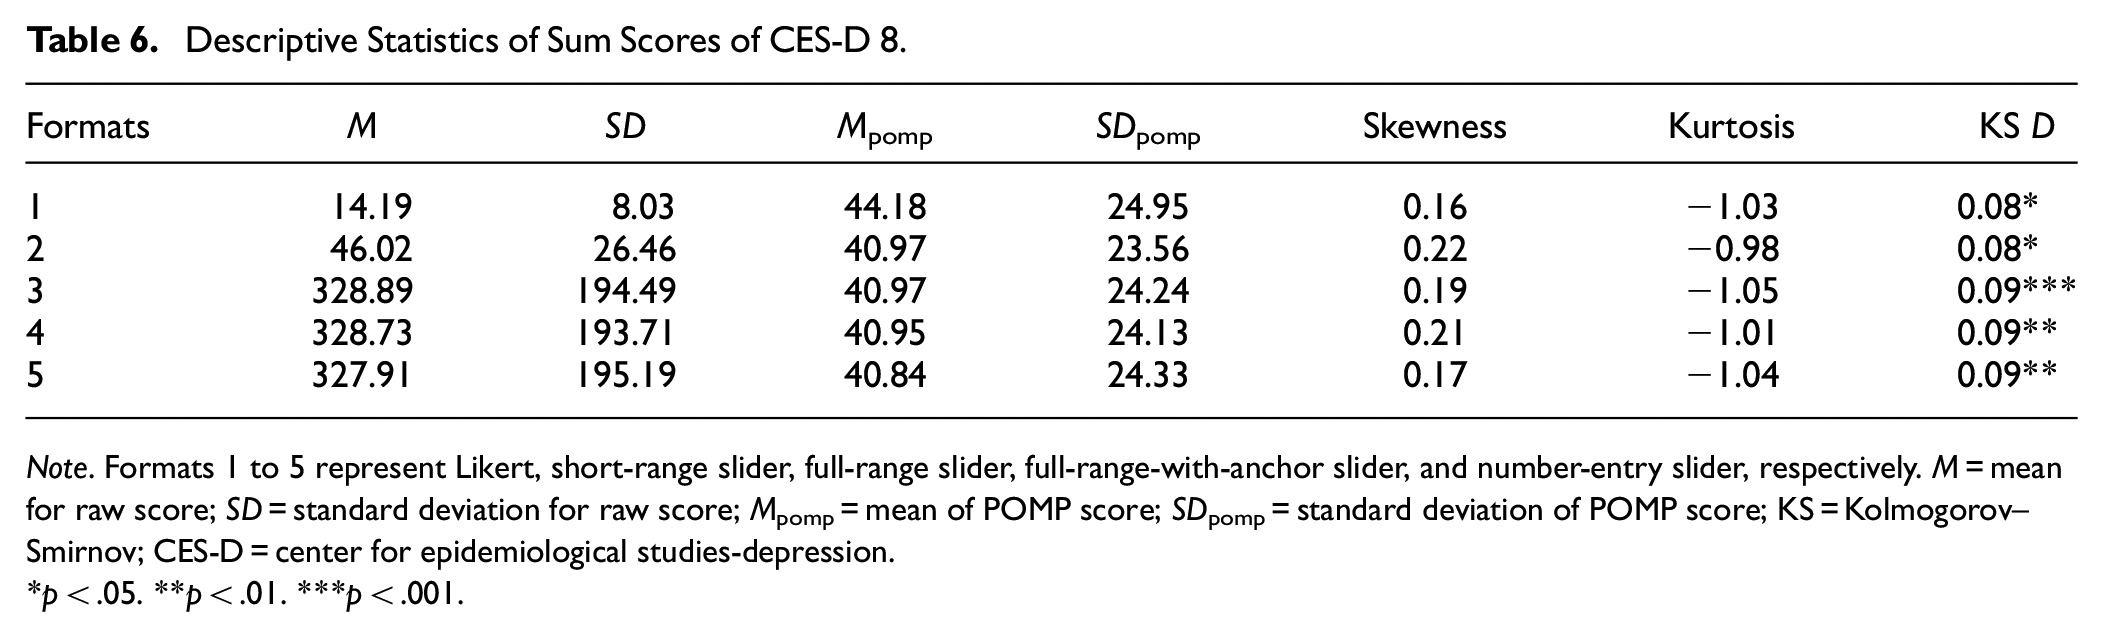
Note. Formats 1 to 5 represent Likert, short-range slider, full-range slider, full-range-with-anchor slider, and number-entry slider, respectively. M = mean for raw score; SD = standard deviation for raw score; Mpomp = mean of POMP score; SDpomp = standard deviation of POMP score; KS = Kolmogorov–Smirnov; CES-D = center for epidemiological studies-depression.
p < .05. **p < .01. ***p < .001.
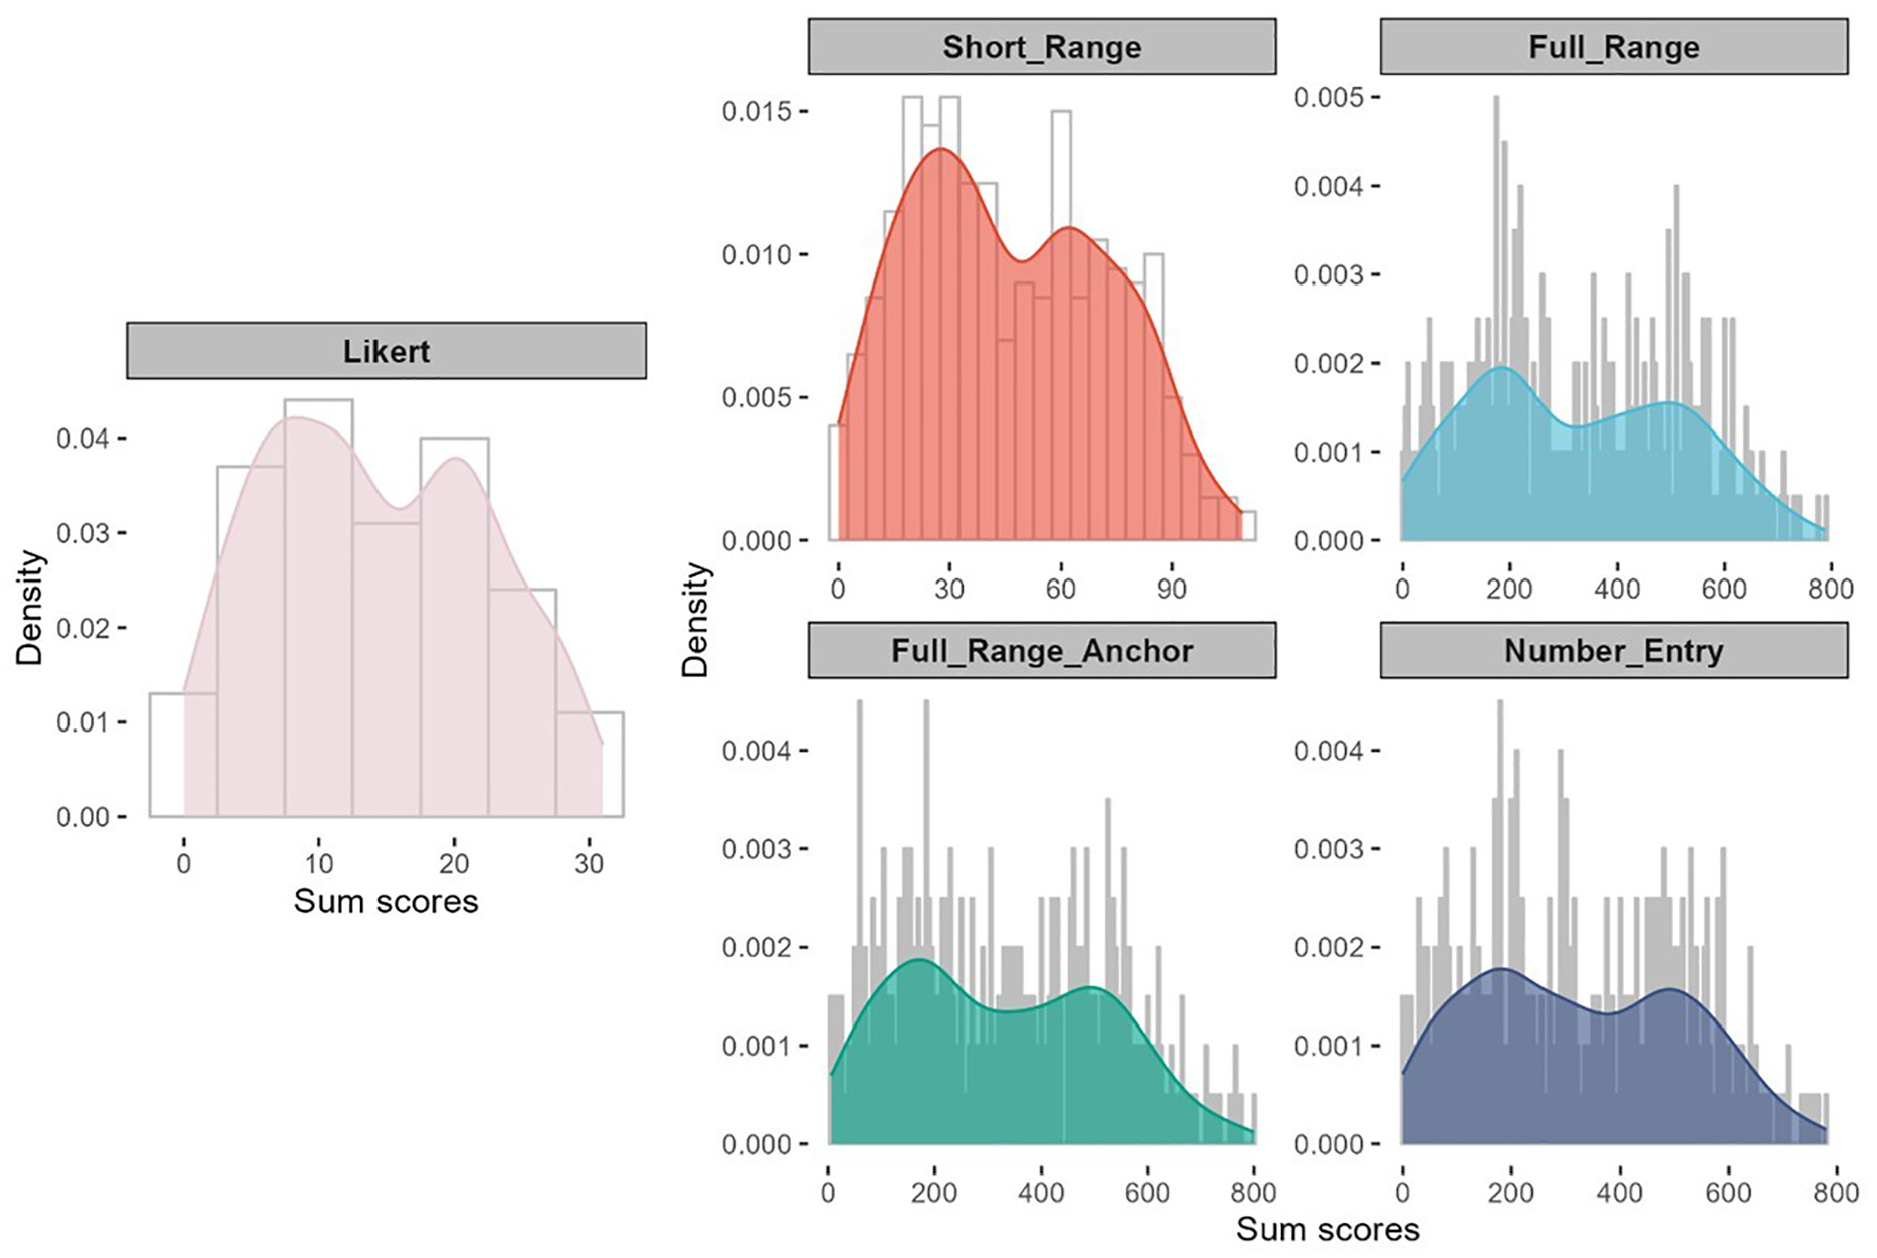
Sum Score Distribution Plot for Different Response Formats of CES-D 8.
Sum Score Scatterplot
In Figure 7, we illustrate the scatterplot of sum scores for each slider format and the number-entry format in comparison to the sum scores obtained from the Likert scale. Ideally, we would expect high correlations between depression scores generated from different response formats, with the same participant maintaining a similar (if not identical) position in the sample distribution, regardless of the response format. For instance, a participant scoring at the mean on the Likert scale should also score around the mean on the slider.
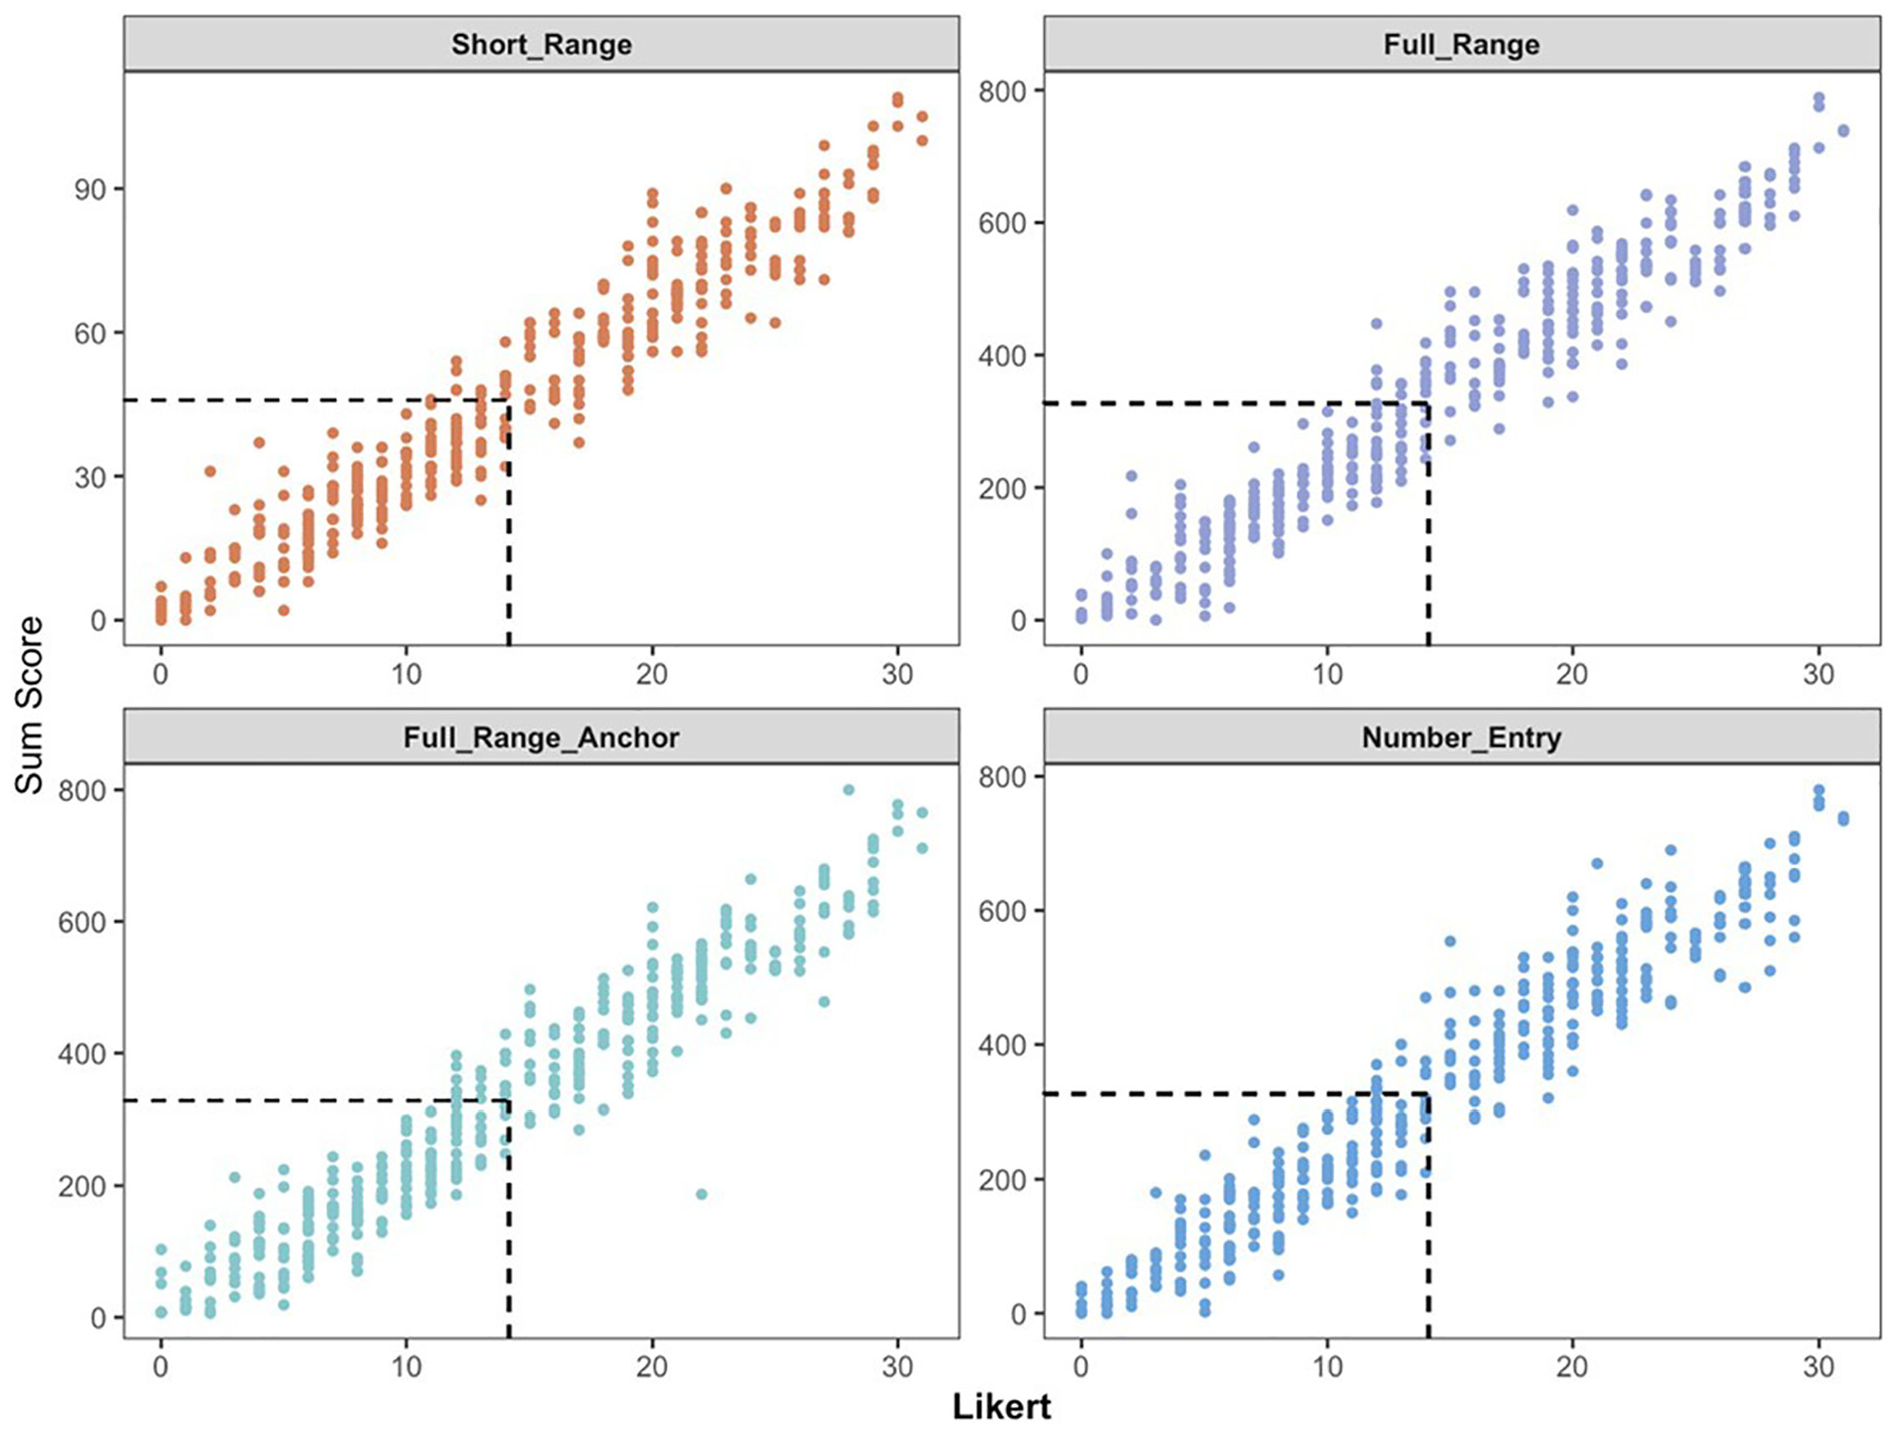
Scatterplot of Sum Scores for Different Response Formats of CES-D 8.
Overall, the subjects’ scores on the Likert scale did not exhibit strong consistency with scores obtained from other response formats. Specifically, while subjects’ sum scores at the mean on the Likert scale should correspond to scores around 45 on the short-range slider and 330 on the full-range/number-entry formats, their actual scores on these formats exhibited a wider range: approximately ranging from 30 to 60 on the short-range slider, 220 to 420 on the two full-range sliders, and 220 to 500 on the number-entry format. This mismatch suggests that employing different response formats to assign scale sum scores to subjects can result in inconsistent conclusions, potentially yielding scores that deviate above or below the mean.
Subjective Evaluations of Different Response Formats
Finally, we evaluated participants’ subjective assessments of different response formats with respect to perceived accuracy, enjoyment, difficulty, and mental exhaustion (see Figure 8). In the figure, each panel represents an evaluation criterion, the X-axis shows the response formats, and the Y-axis indicates the number of times each rank was assigned by the respondents. Each column in the chart is a stacked bar that illustrates the distribution of rankings for a specific response format. The height of the bar reflects the count, and the color denotes a particular ranking level (with darker shades representing higher ranks). Regarding accuracy and enjoyment, the Likert scale received the highest number of top ranks, with 161 and 209 respondents, respectively. The full-range slider, however, received the fewest top ranks, with 30 and 22 respondents for accuracy and enjoyment, respectively. The number-entry format was considered the most difficult (by 135 respondents) and the most mentally exhausting response format (by 136 respondents). Using the full-range slider, especially with anchors, greatly improved the experience; only 53 and 51 respondents ranked this format as the most difficult and exhausting.
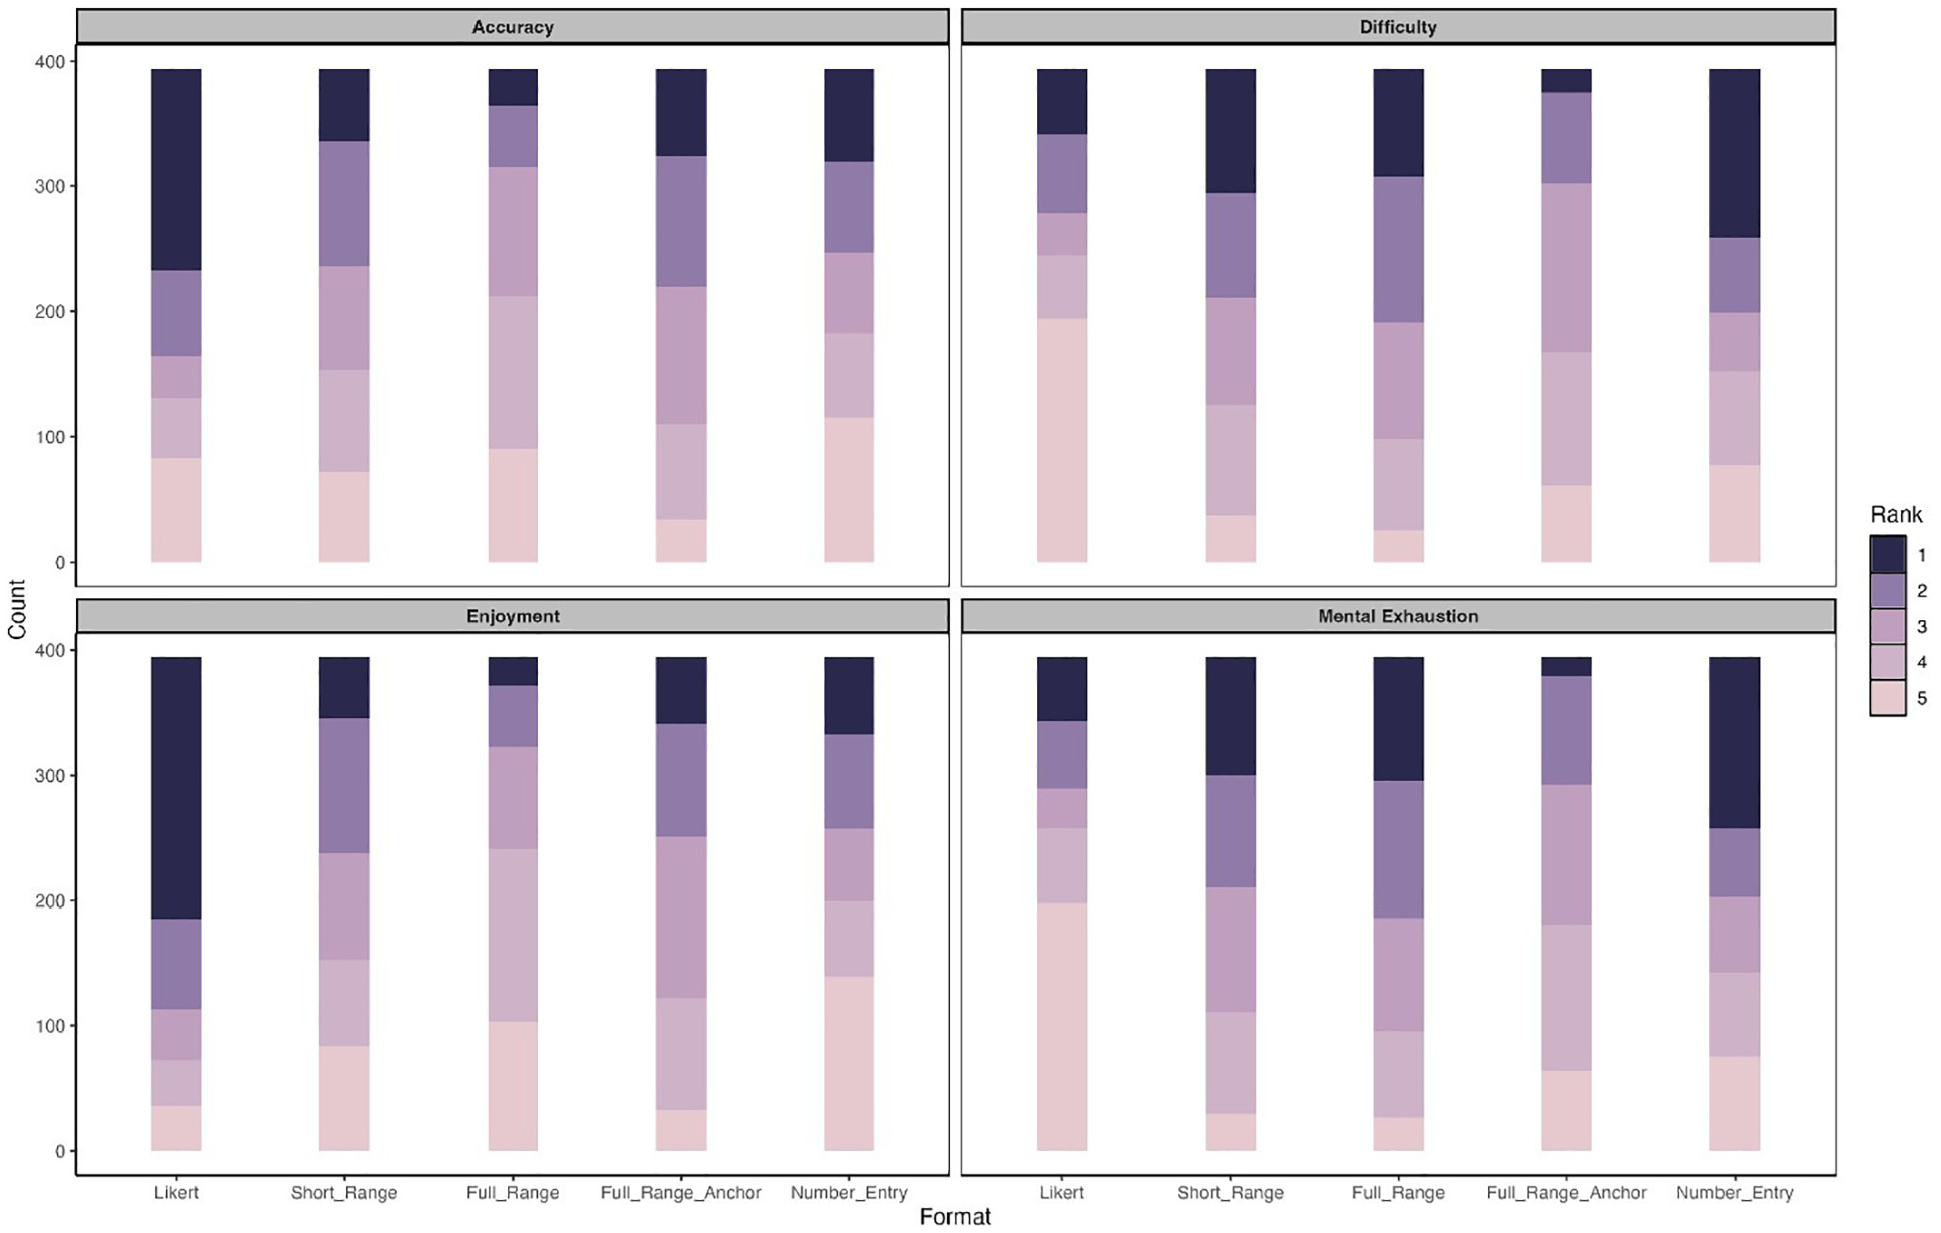
Stacked Bar Charts of Participants’ Subjective Ranking for Different Response Formats.
Discussion and Conclusions
Summary of Major Findings
This study examined the Likert format and four slider response formats (i.e., short-range slider, full-range slider, full-range slider with anchor points, and number-entry format) in the context of fitting CFA models. Comparisons were conducted following common practices in psychometric studies for developing and evaluating clinical assessment. First, at the item level, we found significant POMP mean differences between the Likert scale and the slider scales for most items. In addition, the patterns of the difference depend on the wording of the items. In comparison to slider scales, the Likert scale tends to yield higher POMP means for negatively worded items but lower means for positively worded items. All response formats generated non-normal distributions across all items. Consistent with other research, slider scales proved more effective at reducing ceiling and floor effects (Bolognese et al., 2003; Harland et al., 2015; Voutilainen et al., 2016).
Assuming that slider scales better represent true continuous response scores, plotting the distribution of Likert response categories against the scores obtained from slider scales indicates that the intervals between adjacent response categories for items on the CES-D scale are not equal. Consistent with the conclusions of previous studies, these findings suggest that the Likert format does not reflect constant increments and, therefore, should not be analyzed using models designed for continuous data (García-Pérez, 2024; Sideridis et al., 2023). As discussed earlier, we hypothesize that the unequal intervals may be partially due to the five response categories being labeled asymmetrically (i.e., “Not at all or less than one day,” “1–2 days,” “3–4 days,” “5–7 days,” and “nearly every day for 2 weeks”). To further investigate this issue, we conducted additional analyses by artificially categorizing the data from a short-range slider (0–14 days) into five symmetrical categories (i.e., “0–2 days,” “3–5 days,” “6–8 days,” “9–11 days,” and “12–14 days”). 4 Results indicate that when using the artificial symmetrical five-point response categories, the responses are distributed more evenly along the continuous scores, suggesting that the intervals between adjacent categories are more equal with the new Likert data labeled symmetrically. These findings align with previous research demonstrating that participants are more likely to mentally divide the entire continuum evenly when using slider formats (Reips & Funke, 2008). The results further suggest that symmetrical designs increase the likelihood of response categories being perceived as equidistant.
Regarding model fit indices, we observed that different response formats tend to yield similar results on model fit indices. This result is somewhat inconsistent with findings from previous studies, which suggest that a larger number of response categories are associated with higher power to detect model misspecifications, leading to worse model fit (Maydeu-Olivares et al., 2009). It should be noted that the findings from Maydeu-Olivares et al. (2009) were based on a comparison of Likert scales with two versus five categories, however. Our findings further suggest that with a relatively large number of response categories (i.e., 5), the difference in model fit between the Likert scale and the continuous slider is negligible, consistent with results reported by Sung and Wu (2018). Regarding MI, all response formats attained strong equivalence considering ΔRMSEA and TRd, with the only exception being the ΔCFI values for the number-entry format, indicating that the effect of response formats on model fit indices in MCFA models is negligible. Therefore, using different response formats to conduct MI analysis is likely to yield consistent conclusions.
All response formats produced very similar internal consistency reliability coefficients, with alpha and omega values being nearly identical across formats. This is consistent with conclusions from prior studies (Colvin et al., 2020; Lewis & Erdinç, 2017; Maydeu-Olivares et al., 2009). Likewise, the response formats showed almost identical convergent and discriminant validity, supporting previous findings that suggest differences in validity across response formats are minimal (Colvin et al., 2020; Simms et al., 2019).
Regarding the group mean difference comparison, t-test showed that the mean difference between males and females was significant only on the Likert scale and was not significantly different on all sliders. This finding is inconsistent with previous research, which concluded that different response formats had no impact on the significance of group mean differences (Hilbert et al., 2016). The different results may be due to the use of longer-range sliders in this study. All slider formats exhibit higher standard deviations and smaller effect sizes, which may suggest the need for larger sample sizes to increase power. Thus, the non-significant results from the slider formats may have resulted from Type II errors. On the other hand, because Likert scales produce ordinal data, the distances between categories are unequal and not comparable, meaning that algebraic operations may be less meaningful. Additionally, the asymmetric response category design can lead to a loss of information in higher segment scores.
In our comparison of individual subjects’ scores between Likert and other formats, the results showed that, at the sum score level, the mean differences in the responses using different response formats were not significant. However, the scatterplot reveals a discrepancy in the distribution of sum scores between the Likert scale and other formats. The same individual may occupy different positions within the same sample, depending on whether Likert or slider scores are used. This finding is in line with the conclusion of Bolognese et al. (2003), who suggested that subjects’ Likert ratings may correspond to a wide range of slider values, implying differences in the use of various response formats.
Based on participants’ rankings of various response formats in terms of accuracy, enjoyment, difficulty, and mental exhaustion, the Likert scale emerged as the most preferred. Most participants rated it as the most accurate and enjoyable format, consistent with findings from previous studies (Bolognese et al., 2003; Toepoel & Funke, 2018). This preference may stem from the ease with which participants can anchor their responses to the limited categories on a Likert scale, reflecting inherent human constraints in discerning complex psychological subtleties (Cox III, 1980). In contrast, most participants considered the number-entry format to be the most difficult and mentally exhausting, making it a less recommended response format.
Empirical Recommendations
In summary, by comprehensively comparing the Likert and various slider response formats in fitting CFA models, the findings are mixed. Similar results were observed across the different response formats with respect to factor structure, MI, reliability, and validity of test scores. However, inconsistent results emerged regarding mean differences across gender groups. Individuals’ item scores and sum scores also varied across different response formats, as did participants’ subjective evaluations of response formats in terms of perceived accuracy, enjoyment, difficulty, and mental exhaustion. Based on the research findings, it is not surprising that we cannot recommend one format over the others unanimously. The selection of a response format should depend on the specific research goals. We offer the following recommendations on selecting response formats for researchers using CFA analyses in conducting clinical assessments.
1. Investigating Factor Structure and Psychometric Properties
If the research goal is solely to investigate factor structure, conduct MI tests, or examine the psychometric properties (e.g., reliability and validity) of a measure, both Likert scales with five categories and more continuous slider scales are likely to yield similar conclusions. Researchers may choose to use Likert scales, as respondents often perceive them as more accurate and enjoyable, enhancing the overall participant experience
2. Designing Likert-Type Scales for Continuous Data Analysis
If researchers plan to adopt a Likert-type scale and treat the responses as continuous in data analysis, we recommend designing the category labels in a symmetrical manner to better achieve equal intervals between adjacent categories.
3. Assessing and Interpreting Individual Test Scores
If the research goal is to assess and interpret individual test scores, researchers should exercise caution, as the same individual may occupy different positions within the same sample depending on whether the Likert or slider scores are used. With more measurement information, slider scales may be preferred. However, future studies are needed to provide additional evidence through simulations and qualitative analyses.
Limitations
Despite several strengths, our work also has limitations. First, when comparing the response formats in terms of reliability and validity, we considered only measures of internal consistency (i.e., Cronbach’s alpha and McDonald’s omega) and convergent/discriminant validity. Future studies should further investigate the effect of response formats on other reliability and validity indicators, such as test-retest reliability and predictive validity. Second, we focused only on a single scale that measures the frequency of depressive symptoms: the CES-D. We expect that our findings can be generalized to other clinical assessment instruments that use the same or similar frequency-based response categories, such as the Generalized Anxiety Disorder Scale (Spitzer et al., 2006) and the Patient Health Questionnaire (Kroenke et al., 2001). Future research could explore and further compare the use of Likert and slider response formats in other types of psychological measurement, such as attitude-based scales (e.g., the Rosenberg Self-Esteem Scale; Rosenberg, 1965).
Supplemental Material
sj-docx-1-asm-10.1177_10731911251329977 – Supplemental material for Comparing Likert and Slider Response Formats in Clinical Assessment: Evidence From Measuring Depression Symptoms Using CES-D 8
Supplemental material, sj-docx-1-asm-10.1177_10731911251329977 for Comparing Likert and Slider Response Formats in Clinical Assessment: Evidence From Measuring Depression Symptoms Using CES-D 8 by Guyin Zhang, Amanda J. Fairchild, Bo Zhang, Dingjing Shi and Dexin Shi in Assessment
Footnotes
Acknowledgements
DS gratefully acknowledges the support of the McCausland Faculty Fellowship. DS also thanks the University of South Carolina for granting him a sabbatical leave, which provided the time necessary to help make this research possible. GZ acknowledges Hengwei Hu for his valuable ideas and comments on the data visualization in this article.
Author’s Note
Dingjing Shi is also affiliated with Georgia Institute of Technology, Atlanta, GA, USA.
Declaration of Conflicting Interests
The author(s) declared no potential conflicts of interest with respect to the research, authorship, and/or publication of this article.
Funding
The author(s) received no financial support for the research, authorship, and/or publication of this article.
Data Availability Statement
Methodological Disclosure
We report how we determined our sample size, all data exclusions, all manipulations, and all measures in the study.
Supplemental Material
Supplemental material for this article is available online.
Notes
References
Supplementary Material
Please find the following supplemental material available below.
For Open Access articles published under a Creative Commons License, all supplemental material carries the same license as the article it is associated with.
For non-Open Access articles published, all supplemental material carries a non-exclusive license, and permission requests for re-use of supplemental material or any part of supplemental material shall be sent directly to the copyright owner as specified in the copyright notice associated with the article.