
Abstract
Very few empirically validated tools exist for assessing reactive attachment disorder (RAD) and disinhibited social engagement disorder (DSED). The RAD and DSED assessment interview (RADA), a semistructured diagnostic interview, was updated in 2018 from the CAPA-RAD interview to reflect the diagnostic criteria changes in the Diagnostic and statistical manual of mental disorders (5th ed.; DSM-5). The aim of this study was to validate the RADA on school-age children in Canada. Caregivers of 5 to 12-year-old children from the community (n = 98), in foster care (n = 147), and in residential care (n = 123) completed the RADA interview and a series of questionnaires. Confirmatory factor analysis (CFA) of the RADA interview supported a four-factor structure similar to the DSM-5 symptom clusters. A short “strictly DSM-5” version of the RADA showed a two-factor structure—RAD and DSED—and an excellent fit to the data. Scales of both structures showed good-to-excellent internal consistency, interrater reliability, convergent validity, and known-group validity. Classifying the children yielded RAD and DSED rates of <1% and 18%, respectively, for children in foster care and 7% and 10%, respectively, for children in residential care. This study supports the validity of the RADA interview for school-age children and is the first to provide RAD and DSED rates for children in residential care.
Keywords
Reactive attachment disorder (RAD) and disinhibited social engagement disorder (DSED) are listed in the most widely used psychiatric nosological systems known as Diagnostic and Statistical Manual of mental disorders (5th ed.; DSM-5; American Psychiatric Association [APA], 2013), International Classification of Diseases, 11th Revision (ICD-11), and Diagnostic Classification of Mental Health and Developmental Disorders of Infancy and Early Childhood (DC: 0-5). These disorders are diagnosed in children as of age 9 months (APA, 2013; Zeanah & Gleason, 2015). RAD is characterized by a relative lack of attachment behavior toward caregivers (little or no comfort seeking and little or no response to comfort offered) and a social and emotional disturbance, that is, low social or emotional reactivity, few positive emotions, or unexplained episodes of fright, sadness, and/or irritability in the presence of caregivers. DSED is characterized by social disinhibition and an inappropriate manner of approaching and interacting with strangers marked by little or no hesitation to go toward unfamiliar adults, overly familiar verbal or physical behavior, and venturing away from caregivers in unfamiliar settings without checking back with them, which could easily result in wandering off with a stranger. DSM-5 criteria for RAD and DSED included in this study are detailed in Table 1. Briefly, the DSM-5 algorithm for behavioral manifestations of RAD requires meeting 2/2 for criteria A and 2/3 for criteria B. For DSED, it consists of meeting 2/4 for criteria A and criteria B.
DSM-5 Diagnostic Criteria for RAD DSED
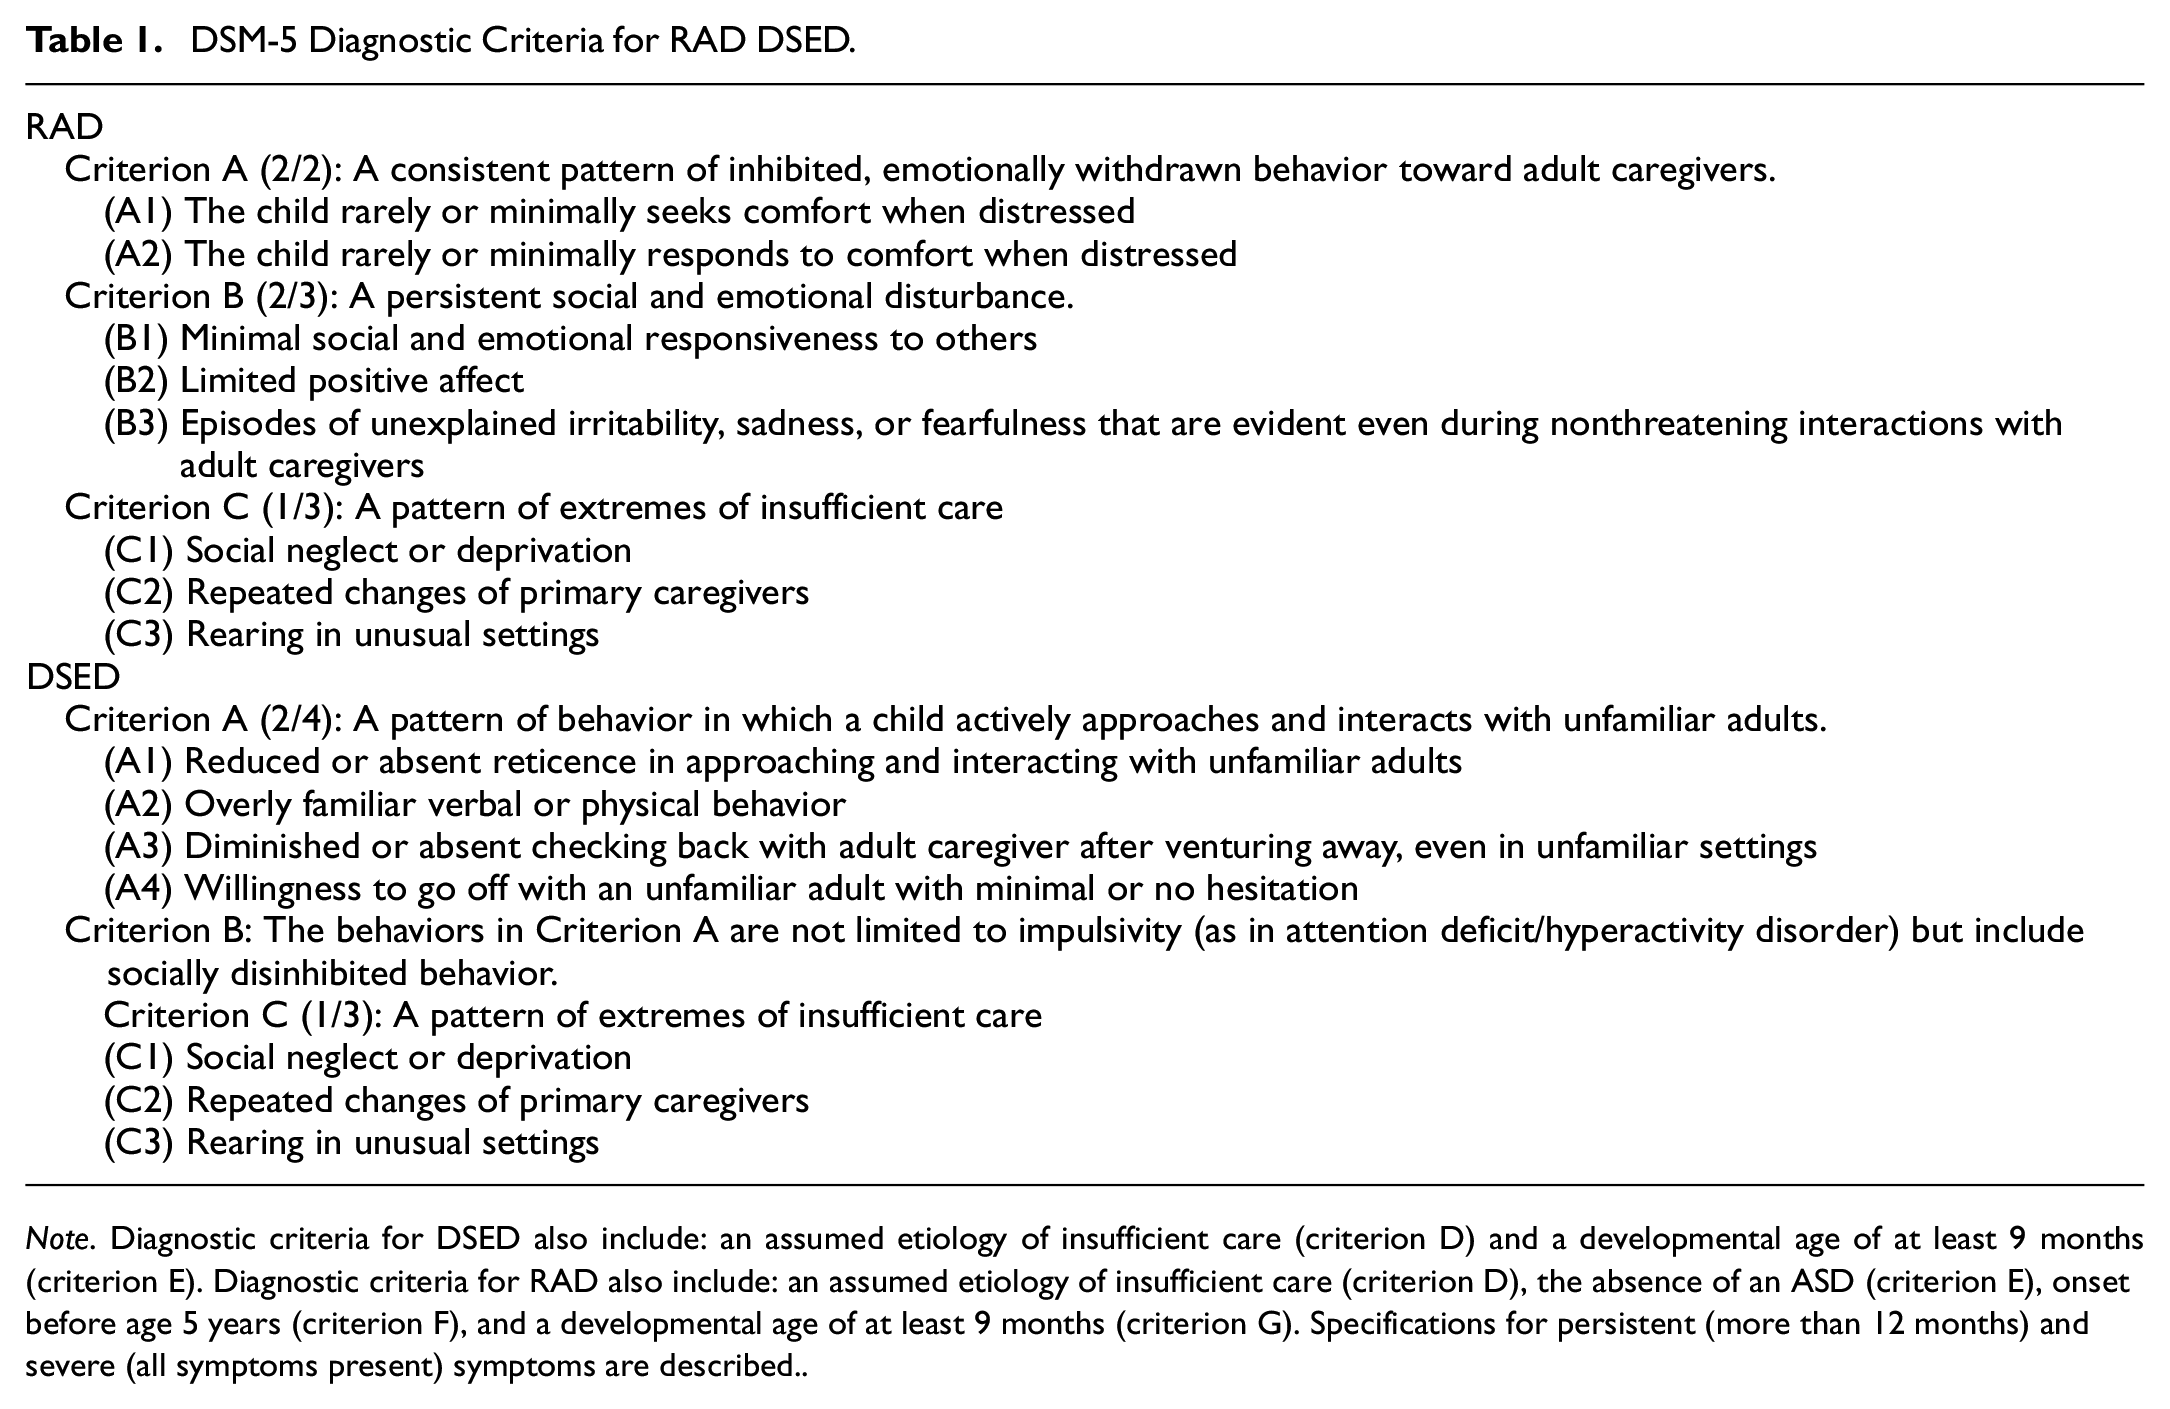
Note. Diagnostic criteria for DSED also include: an assumed etiology of insufficient care (criterion D) and a developmental age of at least 9 months (criterion E). Diagnostic criteria for RAD also include: an assumed etiology of insufficient care (criterion D), the absence of an ASD (criterion E), onset before age 5 years (criterion F), and a developmental age of at least 9 months (criterion G). Specifications for persistent (more than 12 months) and severe (all symptoms present) symptoms are described.
Research has shown that RAD and DSED are associated with low emotional and social functioning (Gleason et al., 2011; Guyon-Harris et al., 2019; Kay & Green, 2016; Moran et al., 2017; Seim et al., 2021; Sonuga-Barke et al., 2017). Moreover, these disorders are commonly observed in children who have suffered maltreatment or who have been placed by child protection services in foster or residential care (Lehmann et al., 2013). Yet, these disorders are among the least investigated in the DSM (Atkinson, 2019). The aim of this study was to contribute to the validation of the RAD and DSED assessment interview (RADA), as based on the DSM-5 behavioral criteria, and better document the rates of each of these disorders in school age children from the community or placed out-of-home by child protection services.
A swell of empirical studies of RAD and DSED over the past two decades has led to some changes in how these disorders are conceptualized. In particular, the diagnostic criteria were largely revamped from the Diagnostic and Statistical Manual of Mental Disorders (4th ed.; DSM-IV; APA, 1994) to the DSM-5 and from the ICD-10 to the ICD-11 (see Monette et al., 2022). Some 20 instruments (questionnaires, semistructured interviews, and observation checklists) have been created to date to assess RAD, DSED, and their associated symptoms (Lehmann et al., 2020). These tools have been employed primarily in research settings and very few of these were developed for clinical purposes. However, most of these instruments do not cover all of the DSM-5 diagnostic criteria. While there seems to be a consensus among the three most up-to-date nosological systems (DSM-5, ICD-11, DC: 0-5) regarding the operationalization of the RAD and DSED disorder, the same cannot be said of their assessment methods, as some of them are based on the DSM-IV and ICD-10 criteria. Consequently, instruments developed before DSM-5 and rates of RAD and DSED measured before DSM-5 may not fully correspond to the current conception of these disorders. This is particularly the case for RAD (formerly inhibited RAD in the DSM-IV), as its criteria have changed more significantly than those for DSED (formerly disinhibited RAD in DSM-IV).
Rates of RAD and DSED
Many studies undertaken prior to the release of the DSM-5 did not distinguish between RAD and DSED and, consequently, reported combined rates for RAD cases of the inhibited type and the disinhibited type (Boris et al., 2004; Boris & Zeanah, 1998). In this study, we use the term “RAD/DSED” to refer to studies that did not separate RAD and DSED. The rate for RAD/DSED has varied widely across studies, except in those that have focused on the general population, which have consistently reported a rate of around 1% (Minnis et al., 2013, 2020; Skovgaard et al., 2007; Upadhyaya et al., 2019). However, among children in foster care, rates of RAD/DSED have ranged from 19% to 38% (Boris & Zeanah, 1998; Lehmann et al., 2013; Zeanah & Emde, 1994; Zeanah et al., 2004). To our knowledge, no study has ever documented the rate of RAD/DSED among primary school-age children in residential care.
Other studies have reported the rates of RAD and DSED separately. The rate for DSED in the general population has been estimated at less than 1% (Gleason et al., 2011). Among children placed in foster care by child protection services, the rate of this disorder has been estimated to be between 12% and 30% (Jonkman et al., 2014; Kliewer-Neumann et al., 2018). As for RAD, no study has reported rates for the general population—and establishing population prevalence of RAD is challenging because prevalence appears to be extremely low (Minnis et al., 2013). A few studies have observed rates varying from 2% to 5% for children in foster care (Bruce et al., 2019; Jonkman et al., 2014; Kliewer-Neumann et al., 2018). Moreover, there is only one study, with adolescents, that documents the separate rates of RAD and DSED for children in residential care (Seim et al., 2021).
Clinical Assessment of RAD and DSED
The last practice parameter for attachment disorder published by the American Academy of Child and Adolescent Psychiatry (Zeanah et al., 2016) laid out guidelines for the diagnostic evaluation of children suspected of having an attachment disorder. First, for institution-reared (orphanages), adopted, foster care and residential care children, clinicians should screen systematically for attachment disorder to determine whether a more formal assessment of RAD or DSED is called for. Second, clinicians who evaluate children for RAD and DSED should document attachment behaviors at a very early age and at intake. To this end, it is highly recommended to carry out a structured observation of children with familiar and unfamiliar adults. Clinicians should conduct a comprehensive diagnostic assessment given the prevalence of comorbid disorders. Third, clinicians should pay particular attention to the current and past living environments of children who manifest signs of RAD or DSED, given that adversity at an early age (social neglect, serial placements in foster care, and institutional rearing in early childhood) is a core feature of these disorders, and they should report any suspected maltreatment to proper authorities. Finally, clinical evaluation of attachment disorders should be conducted with standardized instruments and based on a multi-informant and multimethod approach (i.e., a combination of questionnaire, observation checklist, and interview).
To date, three instruments have been developed for assessing RAD and DSED according to the DSM-5 diagnostic criteria: (a) the Early TRAuma-Related Disorders Questionnaire (ETRAD-Q; Monette et al., 2022) validated on community, foster care, and residential care Canadian school-age children; (b) the RADA semistructured interview (Lehmann et al., 2020) validated on Norwegian adolescents in foster care; and (c) the Disturbance Attachment Interview (DAI; Smyke & Zeanah, 1999) used in numerous studies with currently or previously institution-reared, foster care, and at risk children, and demonstrating satisfactory psychometric properties (Giltaij et al., 2017; Gleason et al., 2011; Humphreys et al., 2017; Jonkman et al., 2014; Oliveira et al., 2012; Oosterman & Schuengel, 2007). The ETRAD-Q can be used to screen for both RAD and DSED. Children who score high on this instrument should then be subjected to a more detailed diagnostic evaluation using a semistructured interview such as the RADA or the DAI. Semistructured interviews help to avoid certain biases associated with questionnaires and structured interviews, where respondents are presented with multiple predetermined answers to choose from (respondent-based). In semistructured interviews the assessor determines scores based on the information provided by the informant (assessor-based; Polanczyk et al., 2015). In contexts where respondents are caregivers of children victims of maltreatment, carrying out the most objective assessment possible can help limit certain biases in the responses provided, particularly if the caregiver is suspected of maltreatment or is implicated in legal proceedings.
The RAD and DSED Assessment
The RADA semistructured interview (Lehmann et al., 2020; Minnis et al., 2018), an updated version of the validated CAPA-RAD interview (Minnis et al., 2009), serves to assess RAD and DSED based on the latest DSM-5 diagnostic criteria. The RADA has undergone a factor validation study with Norwegian adolescents in foster care, 11–17 years of age (Lehmann et al., 2020). The study yielded a three-factor structure: a DSED factor, a factor grouping the low selective attachment (RAD cluster A symptoms), and a factor grouping the low social and emotional responsiveness and emotional unpredictability (RAD cluster B symptoms), as found by Lehmann et al. (2020). However, no RADA validation study has ever been conducted specifically with children in middle childhood (5–12 years old).
Objectives and Hypotheses
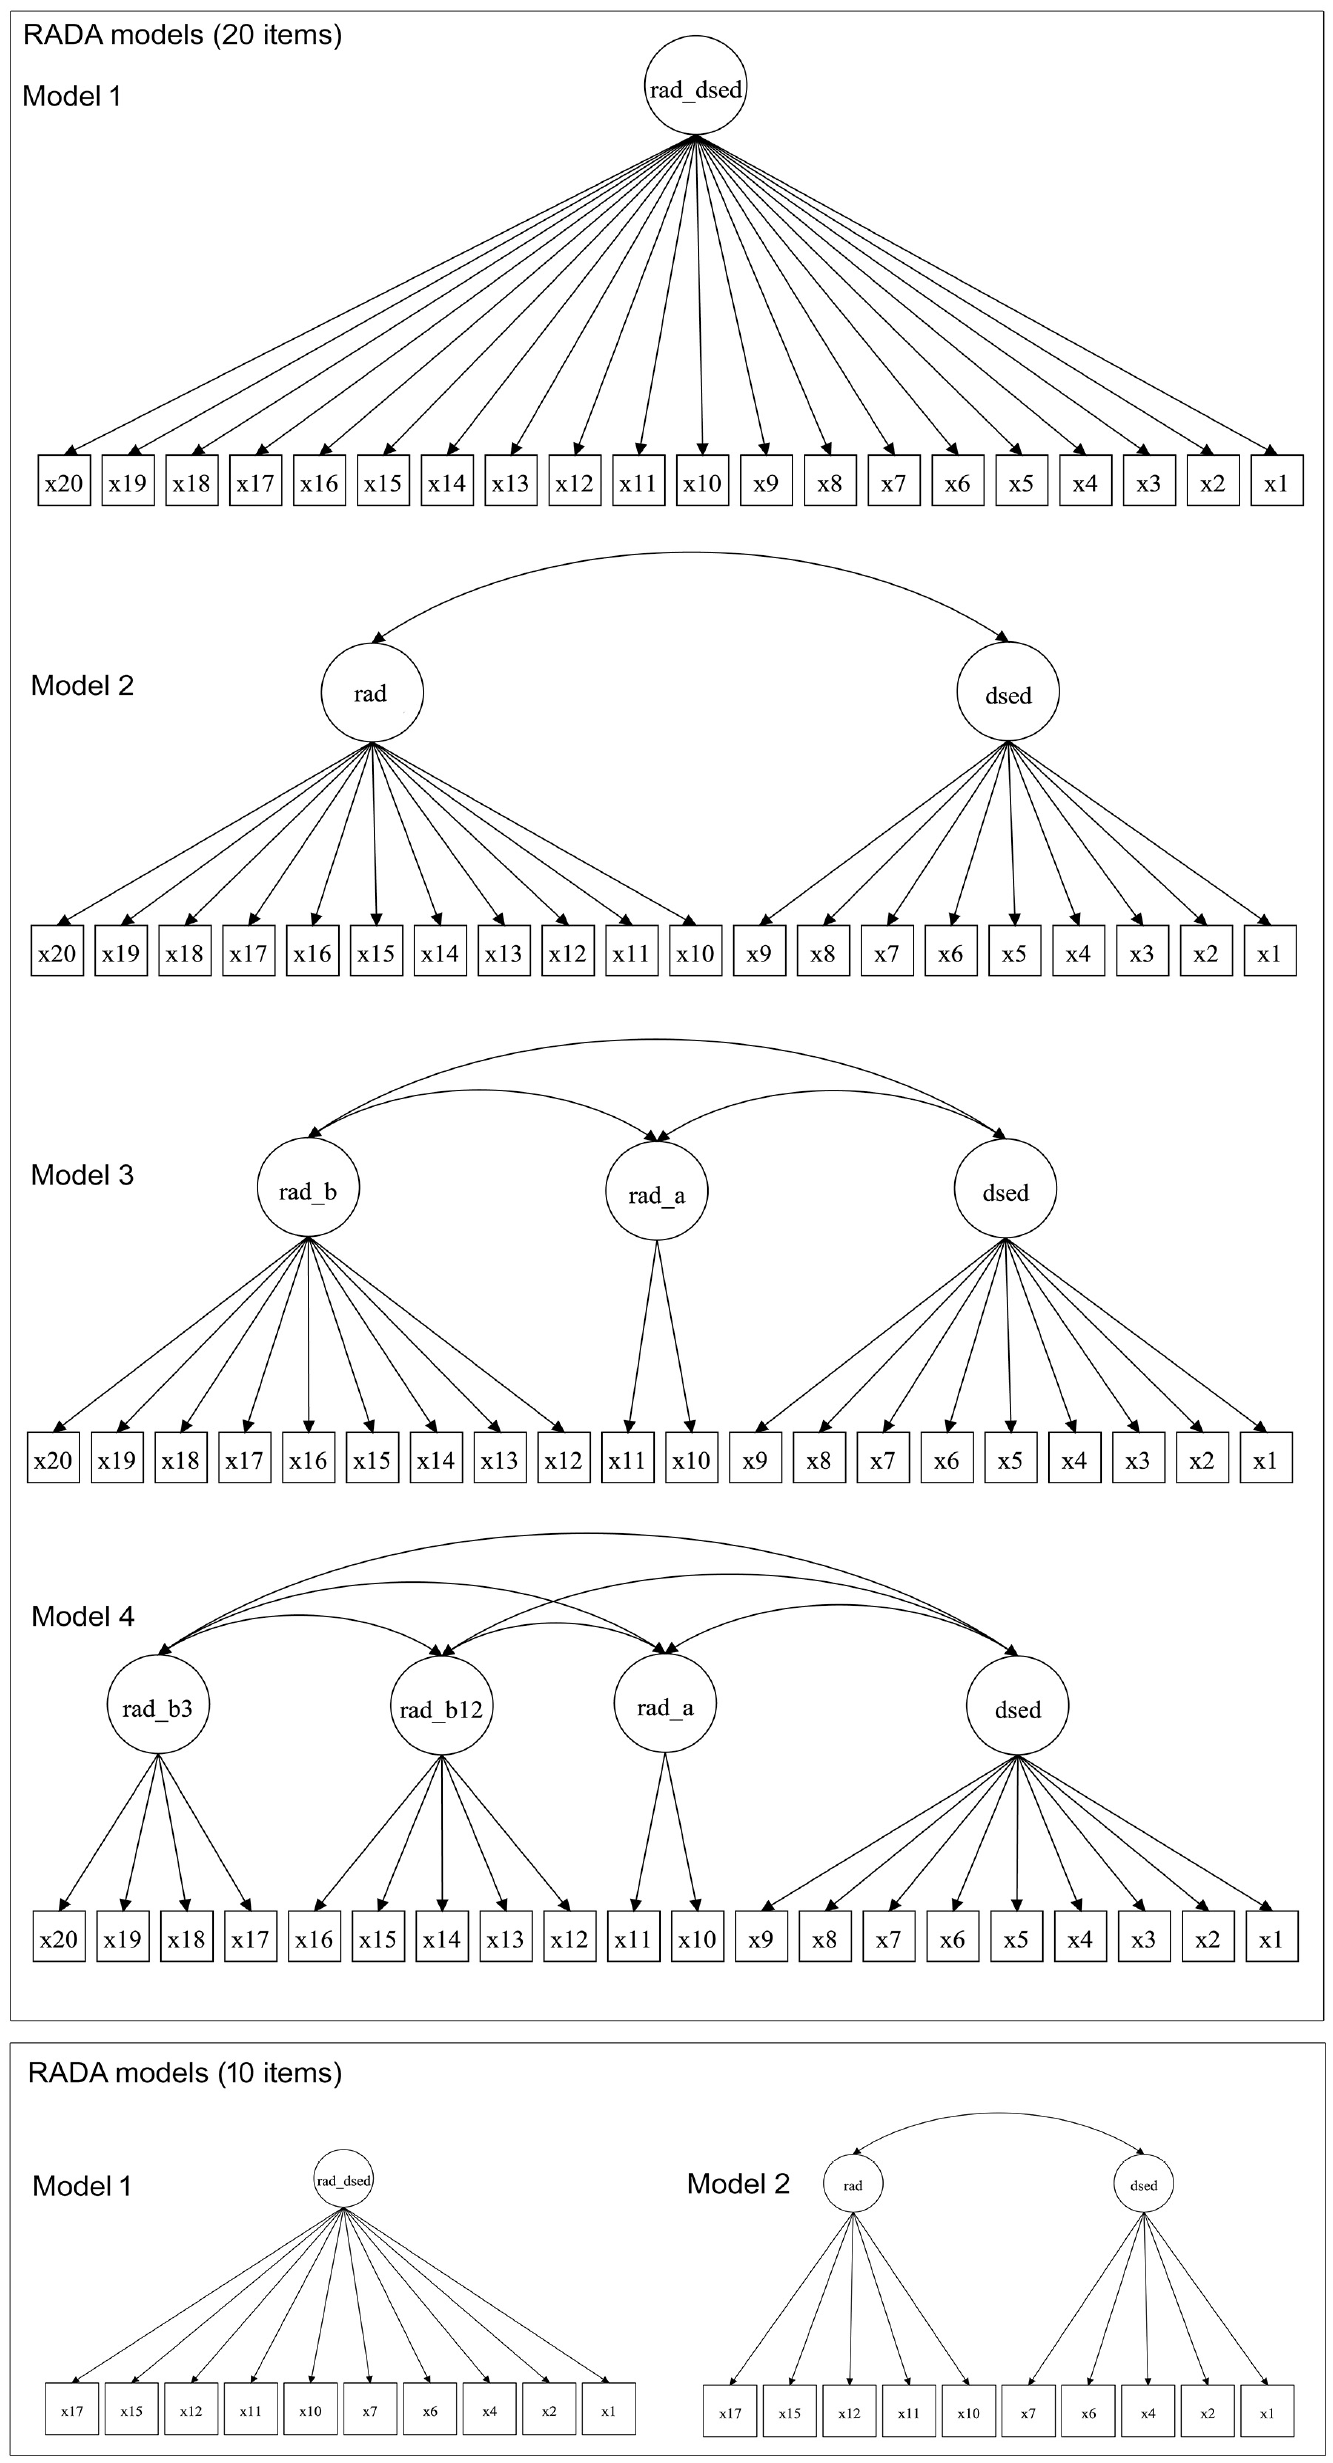
This study aims to validate the DSM-5-based RADA semistructured interview and to determine the rates of RAD and DSED among children in the care of child protective services. Specifically, we sought to examine the RADA’s factor structure, reliability (internal consistency, interrater agreement), and validity (convergent and known-group) through interviews with caregivers of school-age children from the community (COM), in foster care (FC), and in residential care (RC). Moreover, we aimed to estimate the rates of RAD and DSED for all three groups using a DSM-5 algorithm (the Method section details how this algorithm was operationalized in the RADA interview). Factor models were tested on the complete 20-item version and on a shorter 10-item version. Based on the factor structures obtained in previous studies (Lehmann et al., 2020; Monette et al., 2022), we tested four models for the 20-item version. We examined which of the four models would best fit the data. The following models were tested: (a) a model with one general attachment disorder factor; (b) a model with two factors, one for the RAD disorder and another for the DSED disorder; (c) a model with three factors, comprising a factor for the low selective attachment items (RAD cluster A), a factor grouping the low social (RAD B1), emotional responsiveness (RAD B2), and emotional unpredictability (RAD B3) items, and a factor for the DSED items, similar to the factor structure obtained by Lehmann et al. (2020) and representing DSM-5 symptoms clusters; and (d) a model with four factors, comprising a factor for the low selective attachment items (RAD cluster A), a factor for the low social and emotional responsiveness items (RAD B1 and B2), a factor for the emotional unpredictability items (RAD B3), and a factor for the DSED items, similar to the factor structure obtained by Monette et al. (2022) for the ETRAD-Q measure. We hypothesized that models 3 or 4 will best fit the data given they are based on factor structures found by Lehmann et al. (2020; model 3) and Monette et al. (2022; model 4). Considering the fewer items in the 10-item shorter version, we only tested two models: (a) a model with one general attachment disorder factor and (b) a model with two factors, one for RAD and another for DSED. We hypothesized that the model with the best fit would be the two-factor model comprising a factor for the RAD items and a factor for the DSED items.
Regarding convergent validity, we expected higher RADA scores to be positively correlated with two other attachment disorder measures, namely, the ETRAD-Q and the Relationship Problem Questionnaire (RPQ), and with higher functional impairment as measured by the Barkley Functional Impairment Scale for Children and Adolescents (BFIS-CA), as described by DSM-5 (APA, 2013). In terms of known-group validity, we expected residential care children to present more RAD and DSED symptoms on the RADA scales compared with foster care children, as they are documented having experienced more placements, and both residential care and foster care children to present more symptoms compared with community children (Monette et al., 2022). Finally, we expected no DSED or RAD cases in the community group.
Method
Participants
The final sample comprised 368 French-Canadian caregivers of children 5 to 12 years of age. These were divided into three groups: (a) the community group consisted of 98 biological parents (mean age of children = 8.08 years, SD = 2.10, 56% males) recruited from five urban and suburban school boards in the province of Quebec, Canada; (b) the foster care group comprised 147 foster parents (mean age of children = 8.95 years, SD = 2.35, 56% males) recruited through child protective services; and (c) the residential care group consisted of 123 child care workers (mean age of children = 9.16 years, SD = 1.46, 61% males) recruited through child protective services. The foster parent and the residential care child care worker should be the primary caregiver of the child for at least 6 months.
Instruments
Sociodemographic Questionnaire
Caregivers completed a 20-item questionnaire covering child characteristics, such as age, sex, and known mental health disorders diagnosed by an accredited professional (psychologist or physician), and caregiver characteristics, such as caregiver relationship to child, education level, and family income.
RADA Interview (French Version Translated by the S.M., Last Author of the Present Article)
The RADA interview is a revised version of the CAPA-RAD interview (Minnis et al., 2009) updated to reflect the DSM-5 criteria (Lehmann et al., 2020; Minnis et al., 2018). It assesses RAD and DSED symptoms in children and adolescents. The RADA comprises 20 “core items” (9 DSED symptom items and 11 RAD symptom items) and 13 additional items that do not directly measure RAD and DSED. These additional items measure behaviors potentially related to RAD and DSED. The full version (33 items) is designed for clinical trials and is currently being used in a large randomized controlled trial of an intervention for children aged 5 to 12 in foster or adoptive placements (ClinicalTrials.gov Identifier: NCT04187911). Only the 20 “core items” were used in this study. The RADA can be administered to caregivers online, over the phone, or face to face. Each item comprises a set of two to five questions to help investigate caregiver responses in greater depth. Caregiver responses on each item are coded 0 (symptom not present), 1 (symptom somewhat present, but not clinical), or 2 (symptom definitively present, clinical level). Two coders blind to other study measures separately coded the same 30 interviews (audio-recorded) for interrater agreement. Explicit, detailed scoring criteria were added to those laid out by Minnis et al. (2018) and made available to coders. Then, we developed a coding algorithm based on the DSM-5 (see procedure below) to classify children according to whether they met the DSM-5 criteria for RAD or DSED. Final scores range from 0 to 22 on the DSED scale and from 0 to 18 on the RAD scale. Interrater statistics are detailed in the results section.
Early TRAuma-Related Disorders Questionnaire (ETRAD-Q)
The ETRAD-Q is a 42-item questionnaire based on DSM-5 criteria, completed by caregivers. It assesses levels of RAD and DSED symptoms in 5- to 12-year-old children (Monette et al., 2022). The RAD scale comprises three subscales: Low selective attachment (DSM-5 A1 and A2 criteria), Low social and emotional responsiveness (DSM-5 B1 and B2 criteria), and Emotional unpredictability (DSM-5 B3 criterion). The DSED scale comprises two subscales: Interaction with unfamiliar adults (DSM-5 A1, A3 and A4 criteria) and Social disinhibition (DSM-5 A2 and B criteria). Items are rated on a 4-point Likert-type scale: “0 = not at all true (never, very rarely happened),” “1 = a little bit true (happened sometimes, occasionally,” “2 = pretty much true (happened often, frequently),” and “3 = very much true (happened very often, very frequently).” The ETRAD-Q has demonstrated excellent psychometric properties, including test–retest reliability, internal consistency, and convergent and known-group validity (Monette et al., 2022). In this study’s sample, internal consistency of the RAD and DSED scales was excellent (McDonald’s Omega of .93 and .94, respectively).
Relationship Problems Questionnaire (RPQ)
Completed by caregivers, this 10-item questionnaire measures symptoms of inhibited and disinhibited RAD based on the DSM-IV diagnostic criteria (APA, 1994) and their ICD-10 counterparts (Minnis et al., 2002; Vervoort et al., 2013; World Health Organization, 1992). A RAD scale (six items) and a DSED scale (four items) can be computed from this questionnaire (Vervoort et al., 2013). The RPQ has been used extensively in the past with school-age children (Kay et al., 2016; Minnis et al., 2009; Spilt et al., 2016). Items are rated on a 3-point Likert-type scale, with higher scores indicating higher levels of RAD or DSED symptoms. It has demonstrated excellent psychometric properties, including internal consistency and convergent validity with the CAPA-RAD (Kay et al., 2016; Minnis et al., 2009). In this study’s sample, internal consistency of the RAD and DSED scales was good to excellent (McDonald’s Omega of .73 and .92, respectively). An 11-item version, including an item examining failure to seek comfort is available but has not been formally validated.
Barkley Functional Impairment Scale for Children and Adolescents (BFIS-CA)
The BFIS-CA is a 15-item caregiver-report questionnaire used to assess the severity of children’s functional impairment in different settings (e.g., interactions with caregivers, interactions with peers, academic performance, activities in the community, personal care, domestic tasks, following rules, sports; Barkley, 2012). Items are rated on a 10-point Likert-type scale, with higher scores indicating higher functional impairment. In this study’s sample, internal consistency of the scale was excellent (McDonald’s Omega of .93).
Procedure
Signed informed consent was obtained from all participating caregivers (biological parents, foster parents, child care workers). Data collection took place from 2016 to 2021. Caregivers of children with an autism spectrum disorder, as per caregiver report, were excluded from analyses because RAD and autism spectrum disorder show confounding symptomatic similarities (autism spectrum disorder is an exclusionary diagnosis for RAD in the DSM-5) and research has shown that children with autism spectrum disorder are likely to score high on RAD and DSED measures (Davidson et al., 2015). For caregivers of the community group, the research coordinator contacted the principals of the participating elementary schools. Then, principals emailed parents to invite them to participate in the research project. Schools were offered C$5.00 per parent recruited, up to a maximum of C$400.00 per school. In order to maximize the representativeness of the community sample, we stratified the sample by child variables (age and sex) and caregiver education. Regarding the sex and age of the children, we selected children in order to see a roughly equal number of males and females and an equal number of children in each age level. Regarding education, given that study informants in the community group were more likely to be women, we aimed to recruit caregivers with a level of caregiver education similar to that of the women aged 24 to 55 years in the 2021 Canadian census in the province of Quebec (Statistique Canada, 2023). In this sample, 6% of the recruited caregivers have no diploma (vs. 8% in the Canadian census), 25% have a high school diploma (vs. 28%), 32% have a vocational diploma (vs. 21%), and 37% have a university diploma (vs. 43%). Thus, the community sample can be considered comparable to the general population in terms of the caregivers’ level of education.
Foster parents and residential care workers were approached through practitioners at the child protective services. These parents and workers were invited to take part in the study if the children had been living in the same residential setting or foster family for at least 6 months. Gift cards worth C$100.00 were distributed at random among participating foster care parents at time of interview and C$25.00 were offered to residential care workers to purchase sports equipment or educational material for their residential centers. Caregivers of all three groups completed the French version of the RADA interview over the phone or in person. They also completed the sociodemographic questionnaire, ETRAD-Q, RPQ, and BFIS-CA questionnaires online (community and residential care groups) or in hard copy format (foster care group).
Analysis Plan
There were no missing values on the RADA items. Mplus (version 8.2; Muthén & Muthén, 1998–2017) was used to run confirmatory factor analyses (CFAs) on the RADA items. The JASP package (JASP Team, 2020) was used to compute McDonald’s omega internal consistency coefficients. The CFA models were examined using the RADA data for the whole sample (n = 368). The CFA models were estimated using a robust diagonally weighted least squares estimator (WLSMV) with DELTA parameterization to account for multivariate nonnormality and categorical data (ordinal data with three options). The SPSS 26 was used to measure correlations to determine convergent validity, carry out Kruskal–Wallis H analyses to examine known-group validity, and compute weighted kappas to assess inter-rater agreement. RAD and DSED rates were estimated for each group.
CFA: Model Comparison
CFA were run to test two models for the short “strictly DSM-5” version of the RADA (10 items) and four models for the original “core items” RADA (20 items; see Figure 1). Based on our hypotheses, the models tested for the 20 core items RADA were the following: (a) Model 1 comprised a single general attachment disorder (AD) factor; (b) Model 2 comprised two factors: RAD and DSED; (c) Model 3 comprised three factors replicating the DSM-5 symptom clusters (RAD symptom cluster A of low selective attachment, RAD symptom cluster B of low social and emotional responsiveness and emotional unpredictability, DSED symptoms) found by Lehmann et al. (2020); and (d) Model 4 comprised four factors replicating the four ETRAD-Q symptom clusters (RAD symptom cluster A of low selective attachment, RAD symptom cluster B1–B2 of low social and emotional responsiveness, RAD symptom cluster B3 of emotional unpredictability, and DSED symptoms) obtained by Monette et al. (2022). For the 10-item version RADA, we tested two models: (a) a model with one general attachment disorder factor (AD) and (b) a model with two factors (RAD and DSED).
CFA: Model comparison.
Model fit was evaluated using standard fit indices (Jackson et al., 2009): chi-square (χ2), comparative fit index (CFI), Tucker–Lewis index (TLI), root mean square error of approximation (RMSEA), and standardized root mean square residual (SRMR). The recommended cut-offs for good fit are .95 or greater for CFI (.90 or greater is sometimes referred to as an acceptable fit), .95 or greater for TLI (.90 or greater is sometimes referred to as an acceptable fit), .06 or lower for RMSEA (.08 or lower is sometimes referred to as an acceptable fit), and .06 or lower for SRMR (.08 or lower is sometimes referred to as an acceptable fit; Hu & Bentler, 1999; West et al., 2012). The DIFFTEST option of the SAVEDATA command in Mplus was used to calculate the difference (with chi-squares) between models and find the best fit (Muthén & Muthén, 1998–2017).
MIMIC Modeling
Before comparing the groups of children on their RADA scores (sum of items of each scale/factor, revealed by CFA), we sought to analyze RADA invariance. The small sample size (particularly the community group, n = 98) did not allow traditional multiple-group invariance analyses. Consequently, we opted to carry out Multiple Indicators Multiple Causes (MIMIC) modeling (Brown, 2015). MIMIC models can be used to test whether members of different groups (in our case: 0 = community, 1 = maltreated in FC or RC) vary in terms of the probability of an item response based on their level of the underlying latent trait that the item is intended to measure. It is comparable to testing intercept invariance when conducting multiple-group CFA. Using MIMIC modeling, we investigated whether the group variable was associated with differences in specific item scores regardless of how participants scored on latent factors. Items might display differential item functioning (DIF), meaning that they would be easier or more difficult to endorse depending on group membership and independent of a subject’s underlying latent trait (in our case, latent factors of RAD and DSED). We fit the MIMIC models using the procedure proposed by Brown (2015). The latent factors were first regressed on the group variable. Next, based on modification indices (MI) >4, a direct path from the group variable to a specific RADA item was added. The model was then re-estimated until there were no MIs >4.
Rates
Rates of RAD and DSED classification on the RADA were computed using a classification algorithm based on DSM-5 diagnostic criteria A and B. Specifically, children fell into the RAD classification if they scored 2 on: (a) both items 10 and 11 (criteria A1 and A2: rarely or minimally seeks and responds to comfort when distressed); and (b) at least two out of three of items 12 (criterion B1: minimal social and emotional responsiveness to others), 15 (criterion B2: limited positive affect), and 17 (criterion B3: episodes of unexplained irritability, sadness, or fright that are evident even during non-threatening interactions with adult caregivers). Children fell into the DSED classification if they showed: (a) a score of 2 on at least two out of four of the following items/combination of items: items 1 or 2 (both items reflecting criterion A1: reduced or absent reticence in approaching and interacting with unfamiliar adults), item 4 (criterion A2: overly familiar verbal or physical behavior), item 6 (criterion A3: diminished or absent checking back with adult caregiver after venturing away, even in unfamiliar settings), and item 7 (criterion A4: willingness to go off with an unfamiliar adult with minimal or no hesitation); and (b) if they had a score of 6 (or more) on the total of items 1, 2, 4, 6, and 7 (corresponding to +3 standard deviations for criterion B, based on the community group standard deviation).
Results
Descriptive Statistics
According to caregiver report, children were 5 to 12 years old. As shown in Table 2, post hoc analyses using the Scheffé post hoc criterion for significance indicated that the children in the COM group, MCOM = 8.08 years, were significantly younger than those in the foster care group, MFC = 8.95, and the residential care group, MRC = 9.16, F (2, 367) = 8.60, p = .001. The foster care and residential care groups did not differ significantly in terms of age. The proportion of males in the three groups was similar, ranging from 56.1% to 61.8%, χ2 (2, N = 368) = 1.16, p = .56. Based on caregiver report of diagnoses formulated by a physician or psychologists, the proportion of children in the foster care (23%) and residential care (37%) groups with an attachment disorder (RAD, DSED, or attachment disorder) was significantly higher than for those in the community group (0%), χ2 (2) = 43.71, p = .001. Furthermore, foster care children had longer placement duration than residential care children, MFC = 3.96 years, MRC = 1.40 years, t (267) = 9.65, p = .00. The frequencies of the different scores (0, 1, 2) for each RADA item for each sample are presented in Supplemental Table 1.
Descriptive Statistics
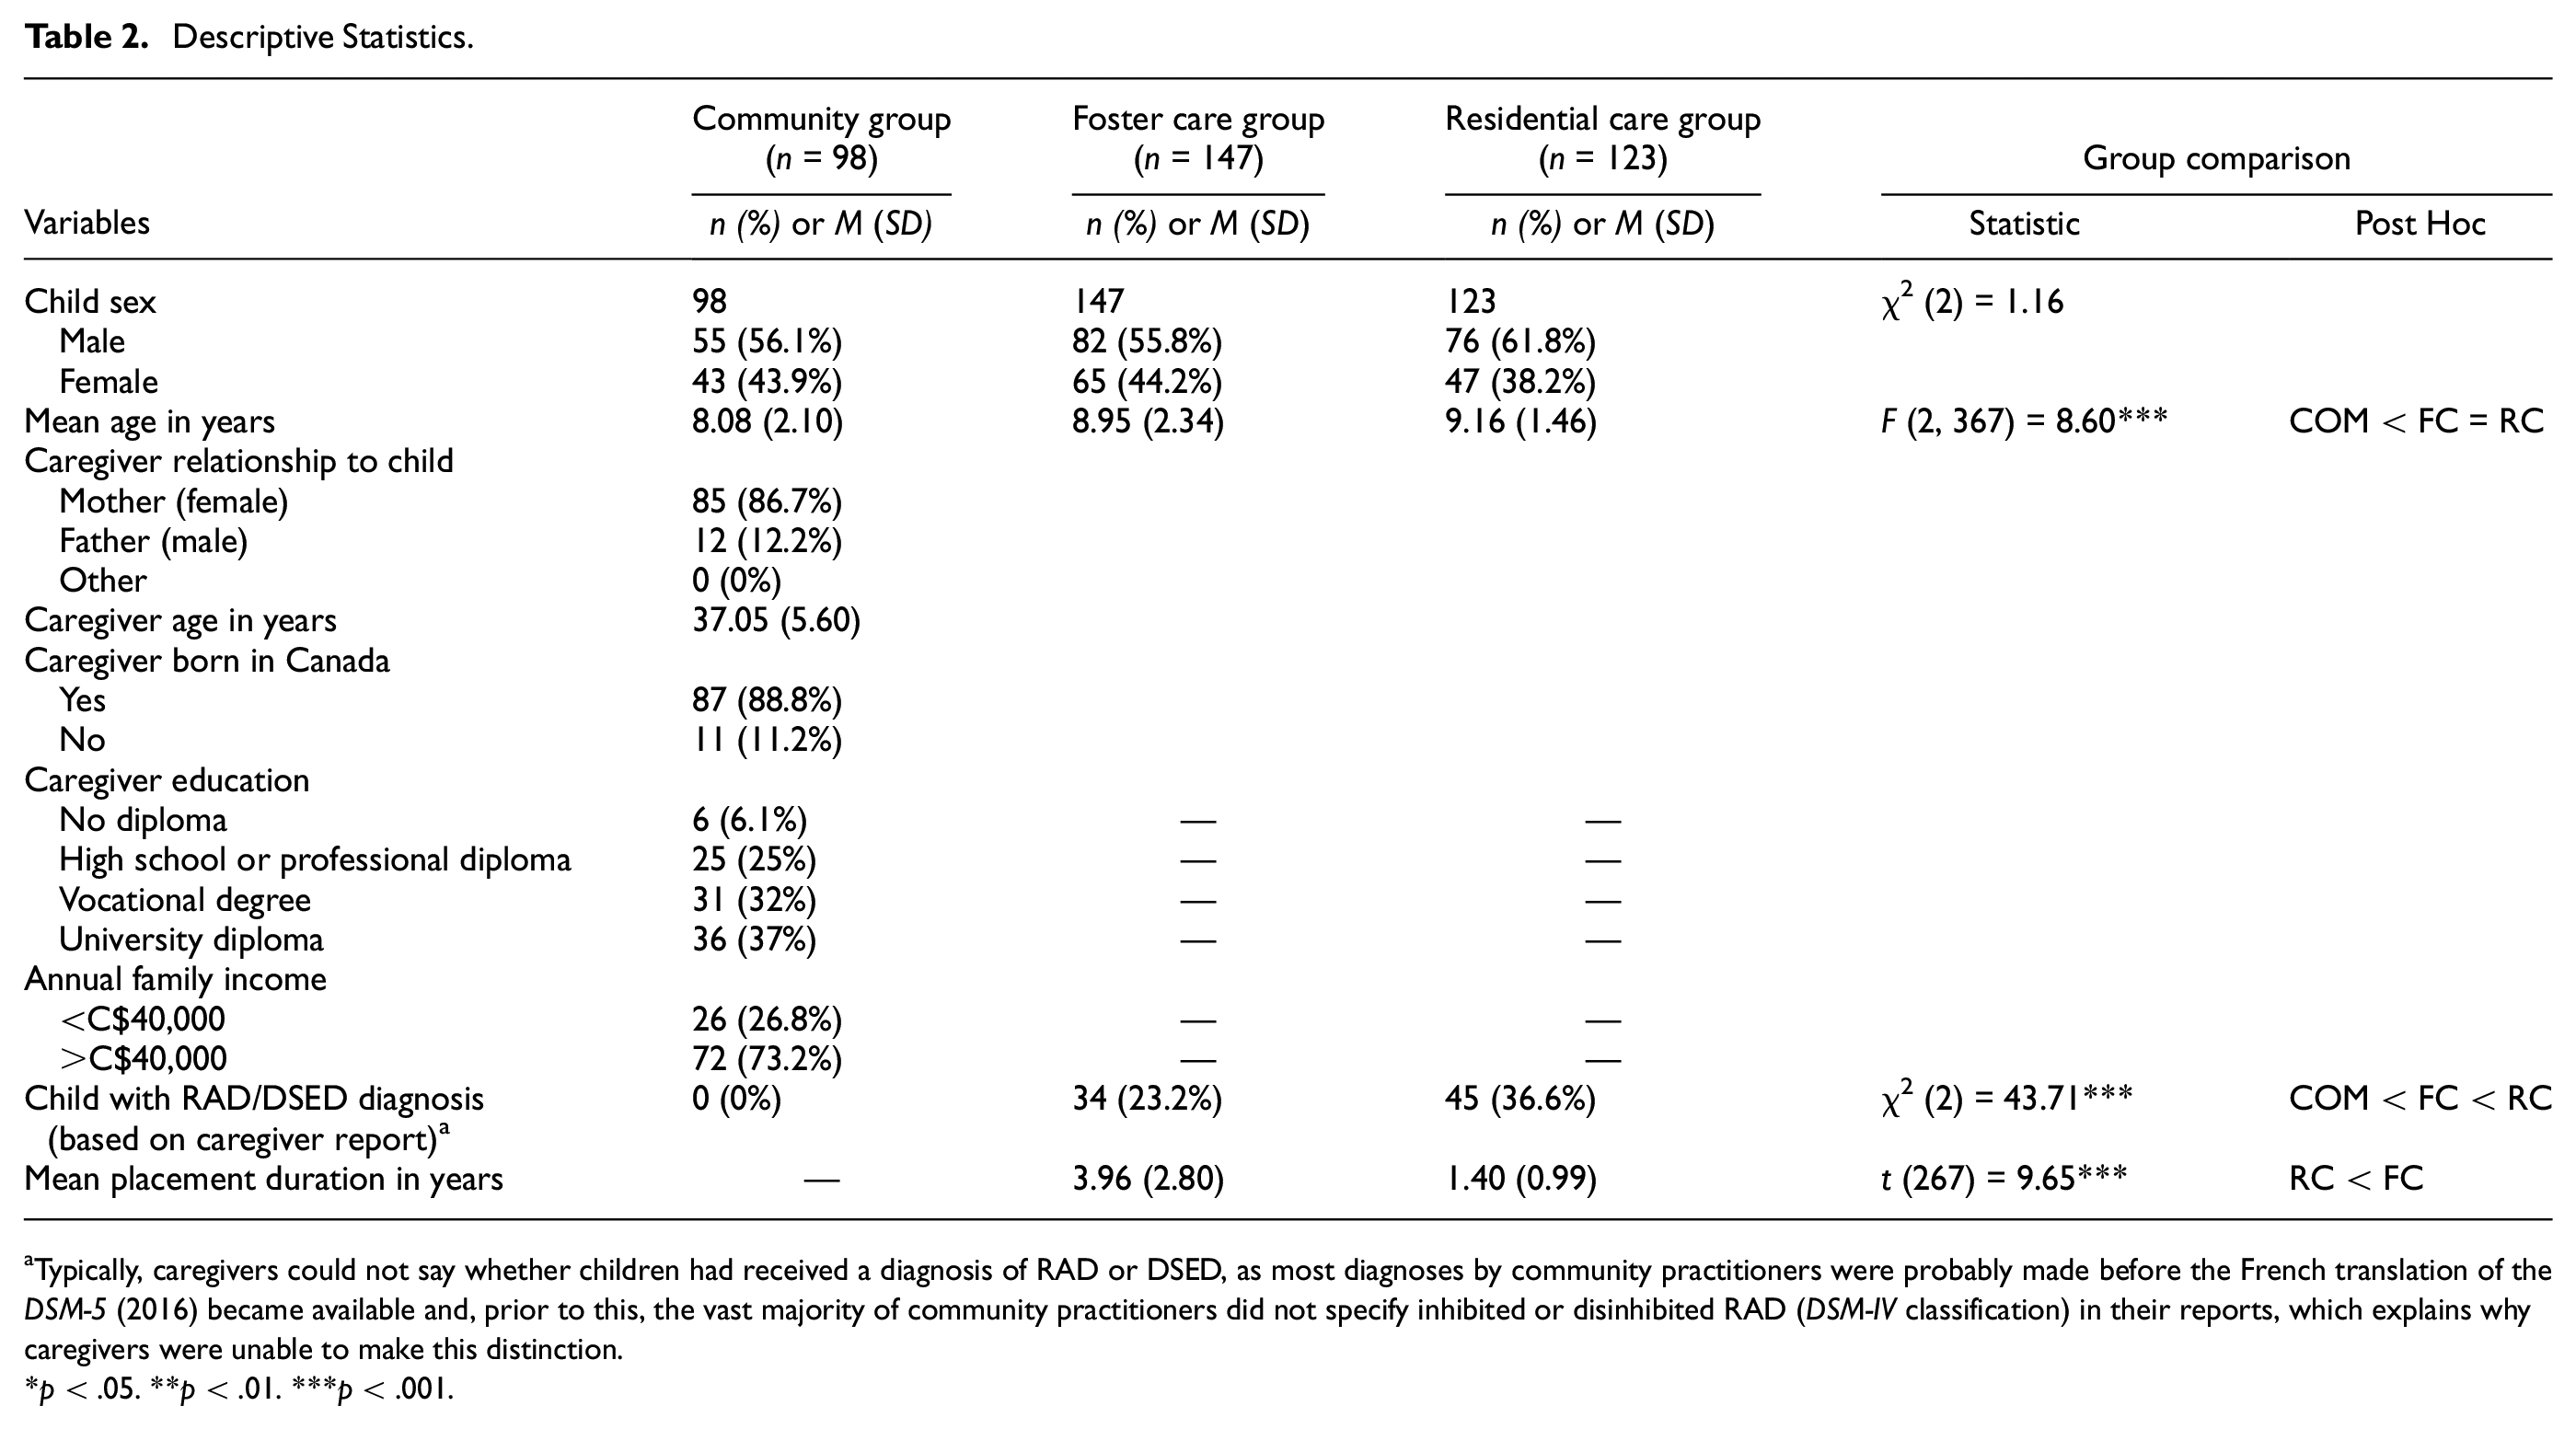
Typically, caregivers could not say whether children had received a diagnosis of RAD or DSED, as most diagnoses by community practitioners were probably made before the French translation of the DSM-5 (2016) became available and, prior to this, the vast majority of community practitioners did not specify inhibited or disinhibited RAD (DSM-IV classification) in their reports, which explains why caregivers were unable to make this distinction.
p < .05. **p < .01. ***p < .001.
Confirmatory Factor Analysis: Model Comparison
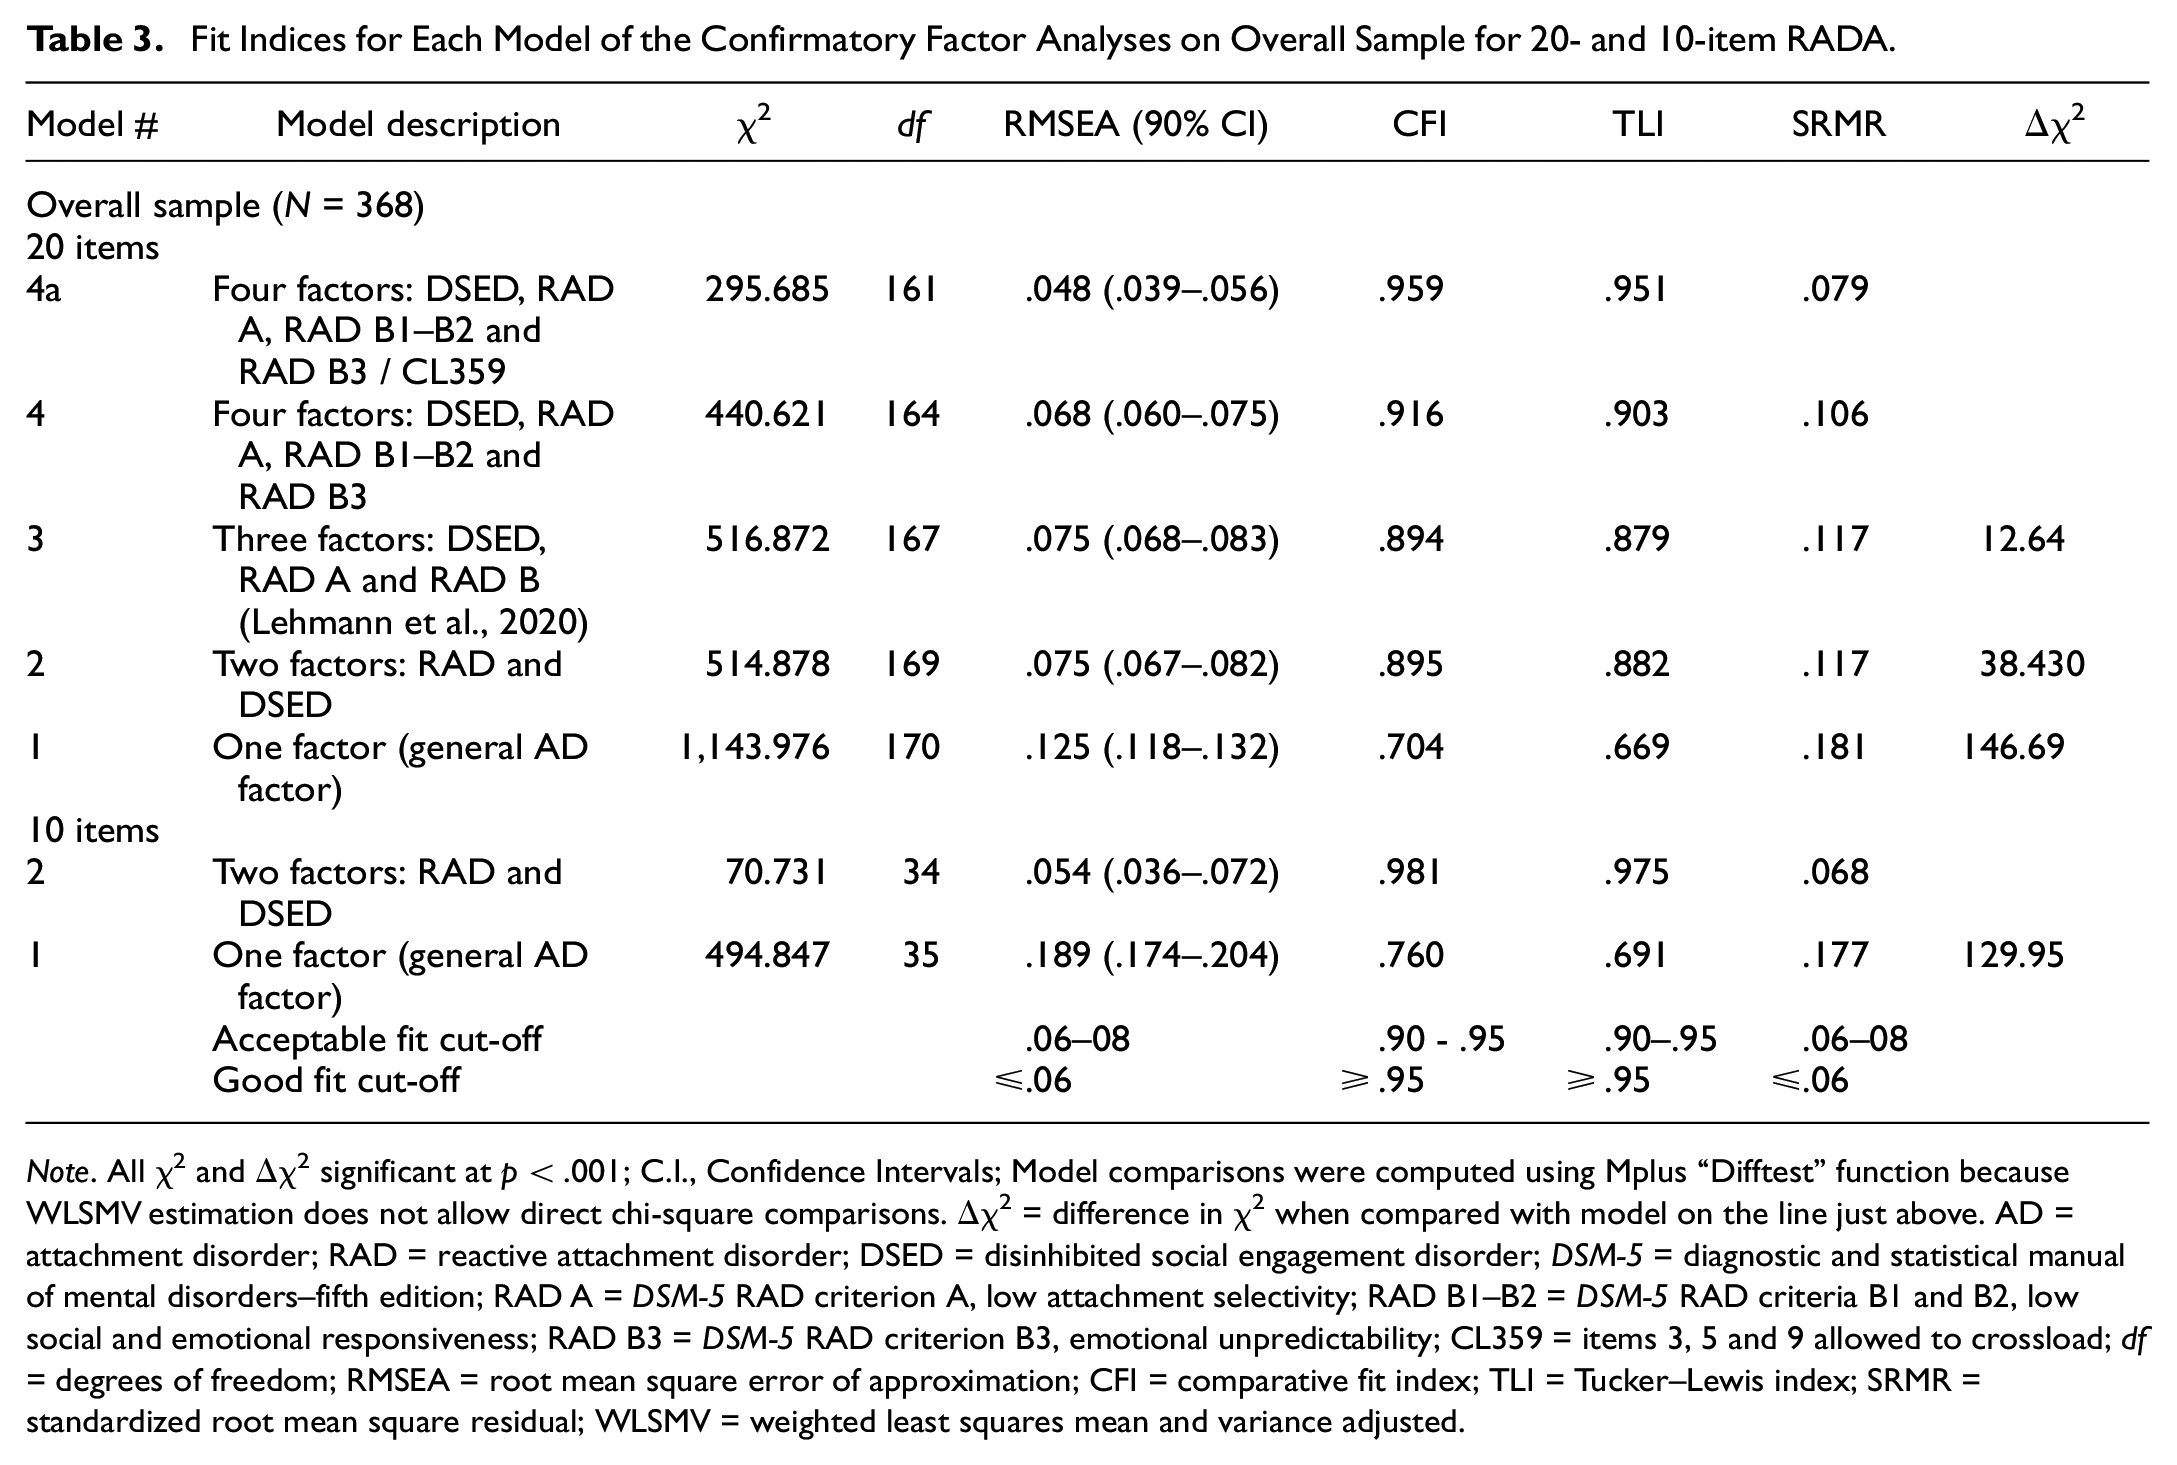
Table 3 gives the fit indices for the models tested on the two versions of the RADA. For the 20-item RADA, Model 4 obtained the best fit indices, χ2 (164) = 440.621, RMSEA = .068, CFI = .916, TLI = .903, and SRMR = .106. When the models were compared in terms of the difference in χ2 for nested models, Model 4 proved superior to the others for the overall sample. Based on the RADA item frequencies, factor loadings and the modification indices, we allowed item 3 “comfort seeking with strangers” and item 5 “invading social boundaries” to crossload on the RAD A factor and item 9 “demanding/attention seeking” to crossload on the RAD B3 factor. We repeated the analyses cross-loading items 3, 5, and 9 (see Model 4a in Table 3 and Figure 2) and obtained even better fit indices, χ2 (113) = 295.685, RMSEA = .048, CFI = .959, TLI = .951, and SRMR = .079. The final four factors of Model 4a were: (a) RAD A: Low attachment selectivity; (b) RAD B1–B2: Low social and emotional responsiveness; (c) RAD B3: Emotional unpredictability; and (d) DSED. The three RAD factors proved highly correlated, r = .62, .78, and .85, whereas the correlation between the DSED factor and the RAD A, RAD B1–B2, and RAD B3 factors was low to moderate, r = .10, .15, and .34. Factor loadings are presented in Table 4 and Figure 2.
Fit Indices for Each Model of the Confirmatory Factor Analyses on Overall Sample for 20- and 10-item RADA
Note. All χ2 and Δχ2 significant at p < .001; C.I., Confidence Intervals; Model comparisons were computed using Mplus “Difftest” function because WLSMV estimation does not allow direct chi-square comparisons. Δχ2 = difference in χ2 when compared with model on the line just above. AD = attachment disorder; RAD = reactive attachment disorder; DSED = disinhibited social engagement disorder; DSM-5 = diagnostic and statistical manual of mental disorders–fifth edition; RAD A = DSM-5 RAD criterion A, low attachment selectivity; RAD B1–B2 = DSM-5 RAD criteria B1 and B2, low social and emotional responsiveness; RAD B3 = DSM-5 RAD criterion B3, emotional unpredictability; CL359 = items 3, 5 and 9 allowed to crossload; df = degrees of freedom; RMSEA = root mean square error of approximation; CFI = comparative fit index; TLI = Tucker–Lewis index; SRMR = standardized root mean square residual; WLSMV = weighted least squares mean and variance adjusted.
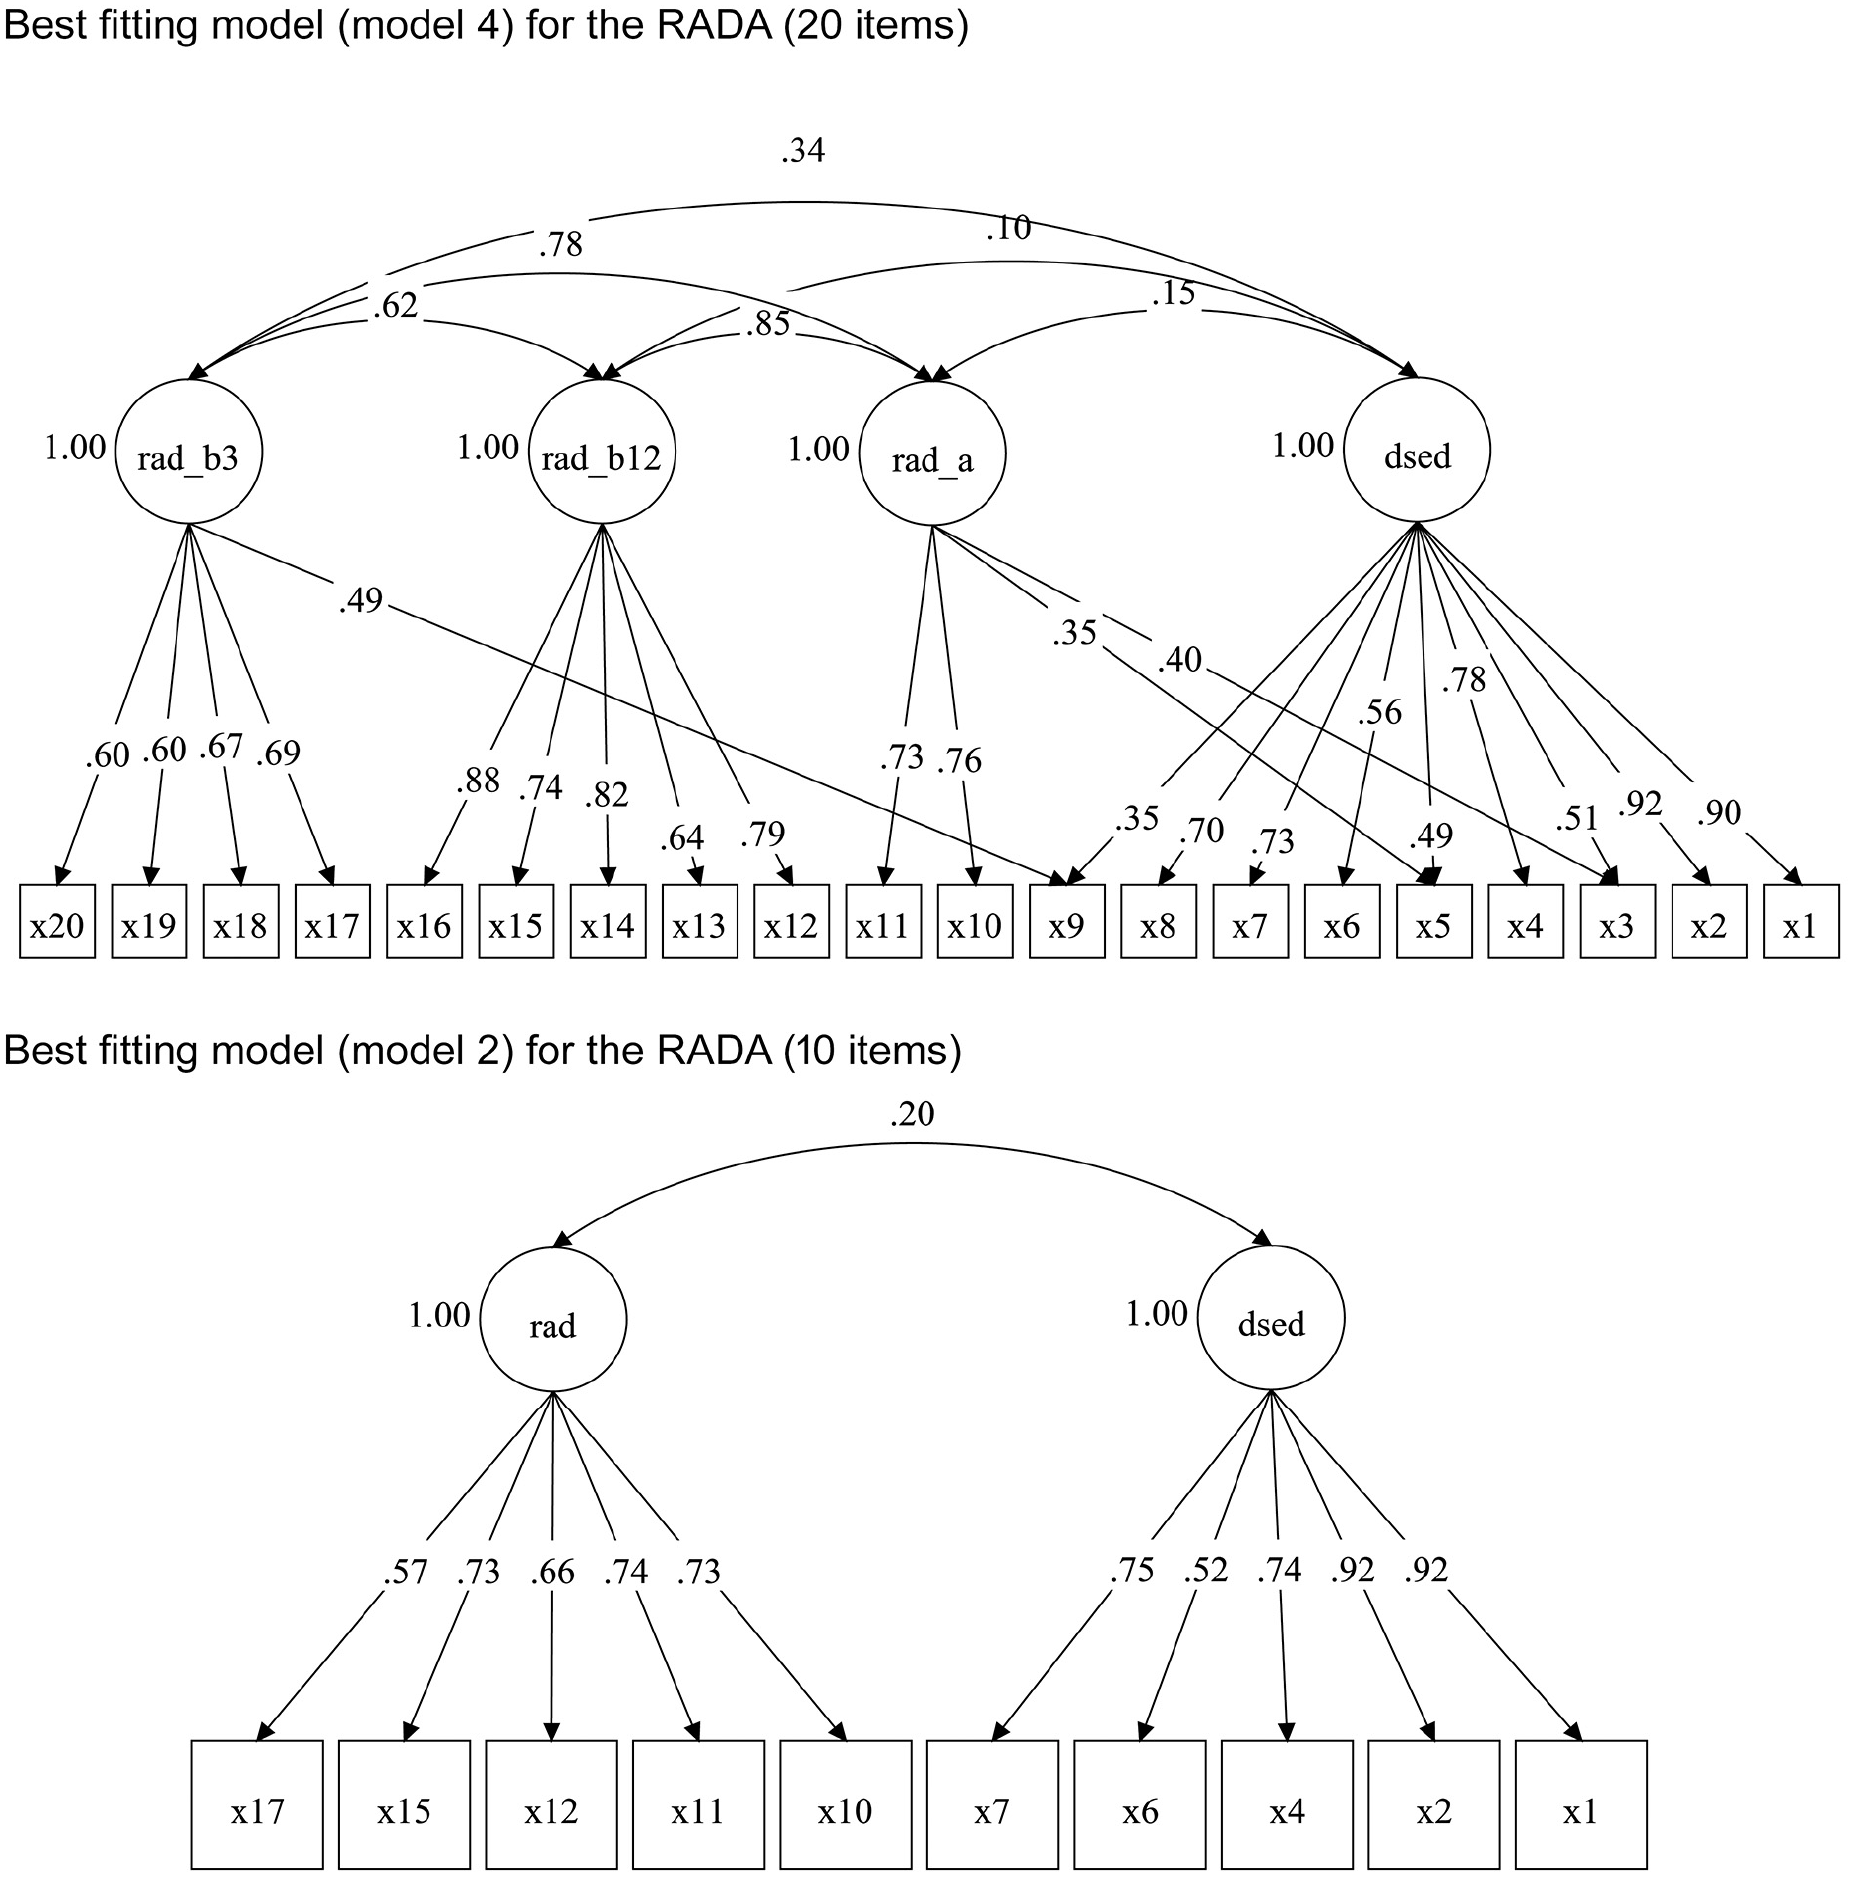
Best fitting models for the RADA.
RADA Standardized Factor Loadings for CFA Models 4a and 2 (Overall Sample, N = 368)
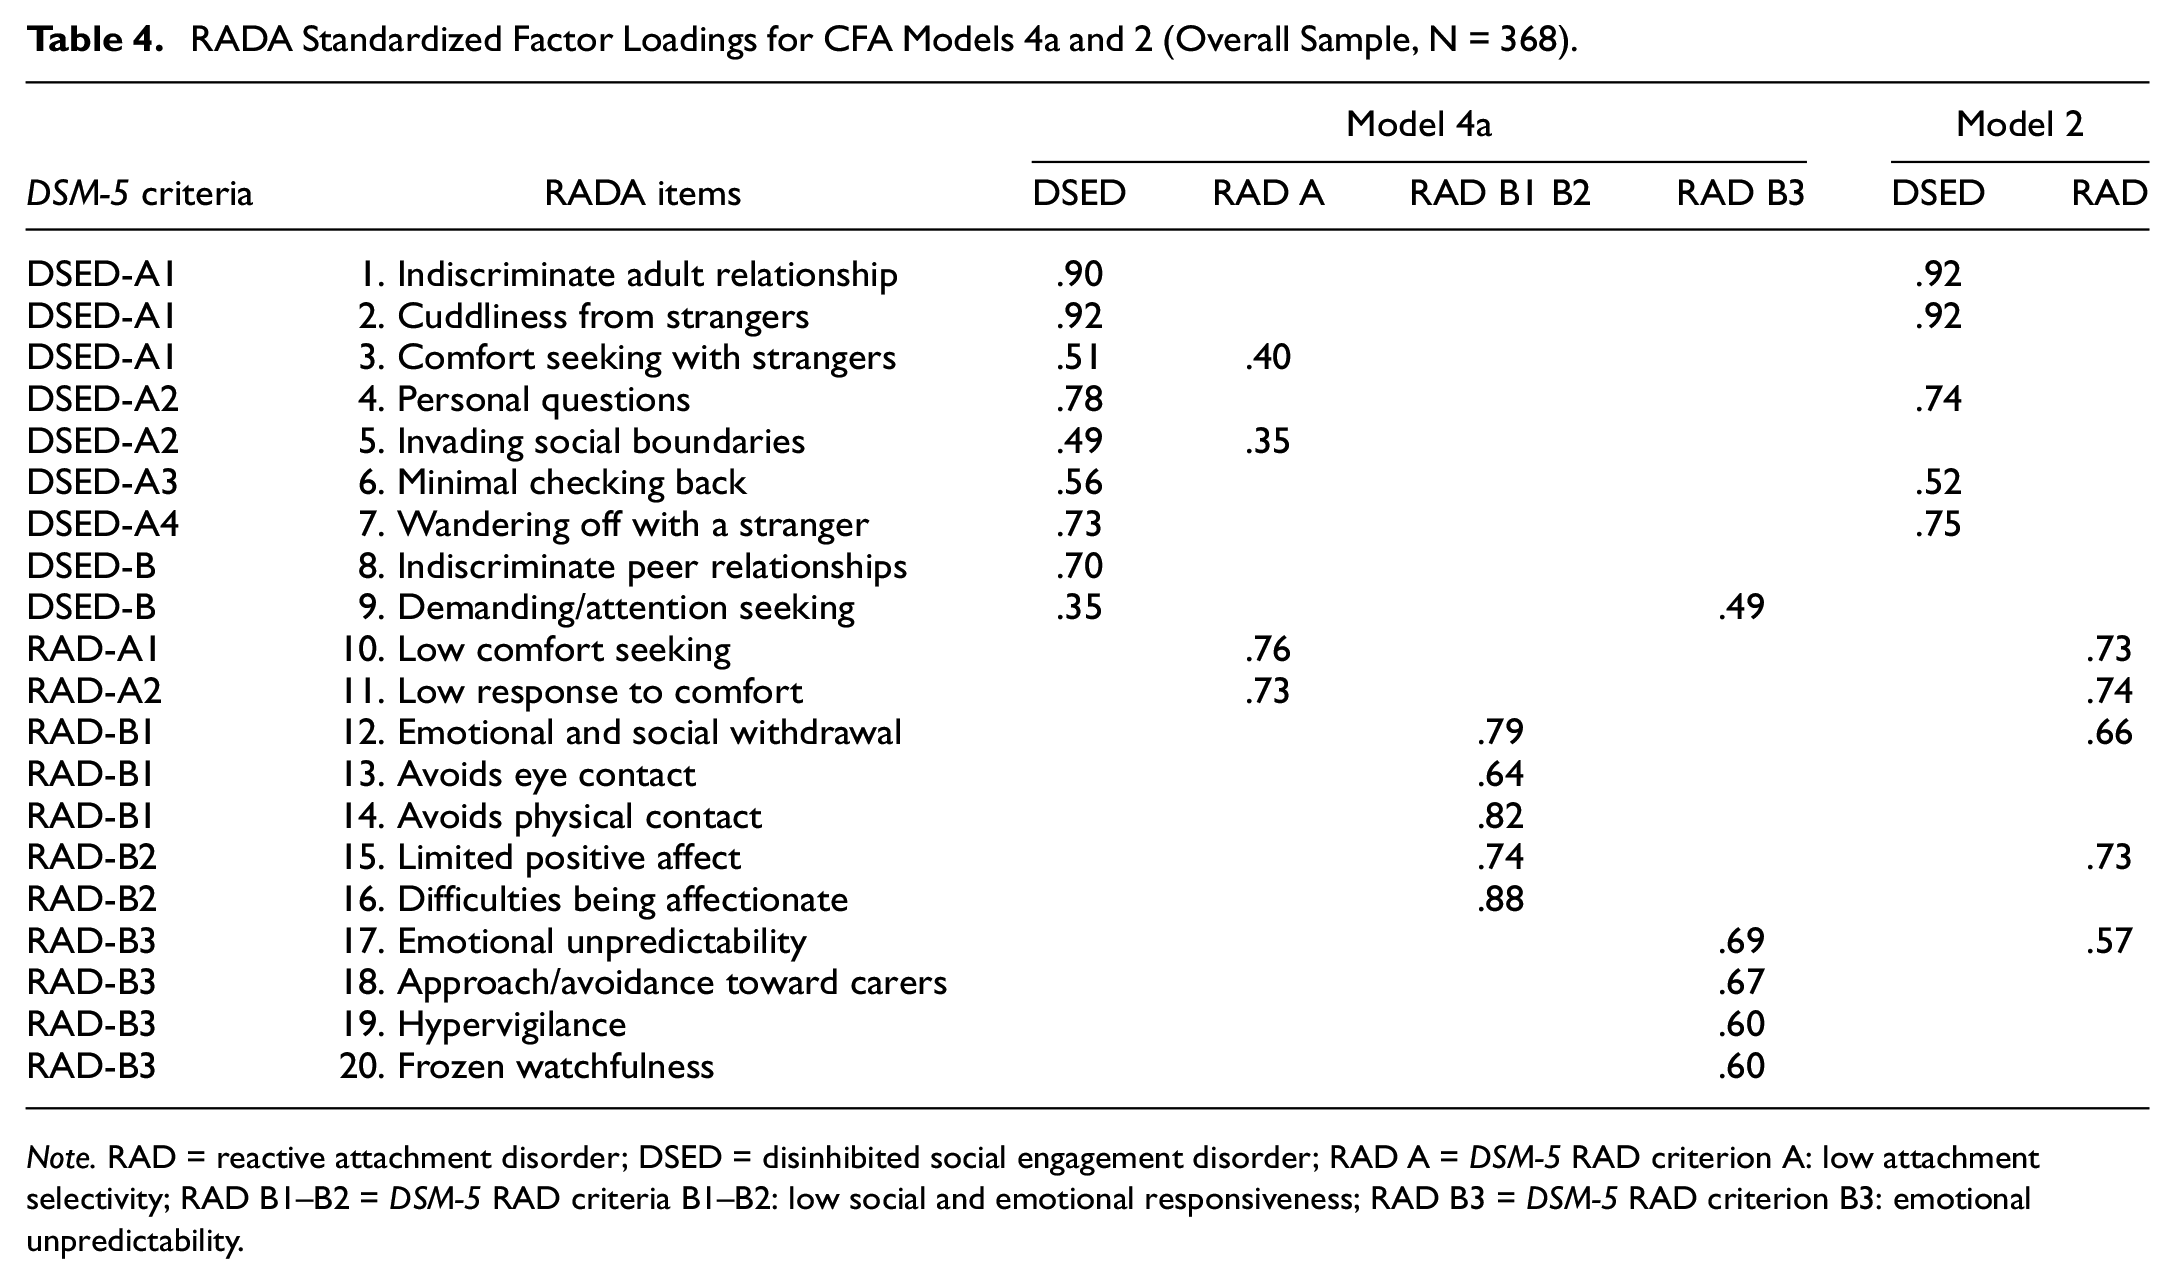
Note. RAD = reactive attachment disorder; DSED = disinhibited social engagement disorder; RAD A = DSM-5 RAD criterion A: low attachment selectivity; RAD B1–B2 = DSM-5 RAD criteria B1–B2: low social and emotional responsiveness; RAD B3 = DSM-5 RAD criterion B3: emotional unpredictability.
For the 10-item RADA, Model 2 obtained the best fit indices, χ2(34) = 70.731, RMSEA = .054, CFI = .981, TLI = .975, and SRMR = .068. When the models were compared in terms of the difference in χ2 for nested models, Model 2 proved superior for the overall sample and yielded two factors: (a) RAD and (b) DSED. Finally, the correlation between RAD and DSED factors proved low but significant (r = .20, p < .001). Factor loadings are presented in Table 4 and Figure 2.
MIMIC Modeling
The goodness-of-fit values of the initial MIMIC model for the 20-item RADA (model 4a) with a direct path from the group variable to the four factors (and with all direct paths from the group variable to each RADA item fixed to zero) were χ2 (df = 177) = 327.411, p < .001; RMSEA = .048 (90% CI = .040-.056); CFI = .944; TLI = .933, and SRMR = .088. No direct group effect on any specific RADA item was added because none had an MI > 4. The goodness-of-fit values of the initial MIMIC model for the 10-item RADA (model 2) with a direct path from the group variable to the two factors (and with all direct paths from the group variable to each RADA item fixed to zero) were χ2 (df = 42) = 78.403, p < .001; RMSEA = .049 (90% CI = .031-.065); CFI = .978; TLI = .971, and SRMR = .068. No direct group effect on any specific RADA item was added because none had an MI > 4.
Reliability (Internal Consistency) and Interrater Agreement
Given the strong correlation between the three RAD factors of Model 4 (RAD A, RAD B1–B2, and RAD B3) for the 20-item version, the items were combined to form a RAD scale. Both the RAD scale and the DSED scale for the 20- and the 10-item versions showed good internal consistency, McDonald omega = .77 and .81 for the former and .71 and .81 for the latter (see Table 5). Our data also showed good to excellent interrater agreement for the 30 double-coded cases. The weighted kappa for each item of the RADA was excellent: 12 items >.74; 7 items from .60 to .74; 1 item within .40 to .59, mean weighted kappa = .77. The intraclass correlation for the RAD scale and the DSED scale (sum of the items of the scale) was excellent for both the 10- and the 20-item versions: ICC between .96 and .97 (see Supplemental Table 2).
Reliability and Validity Indices for RADA Scales
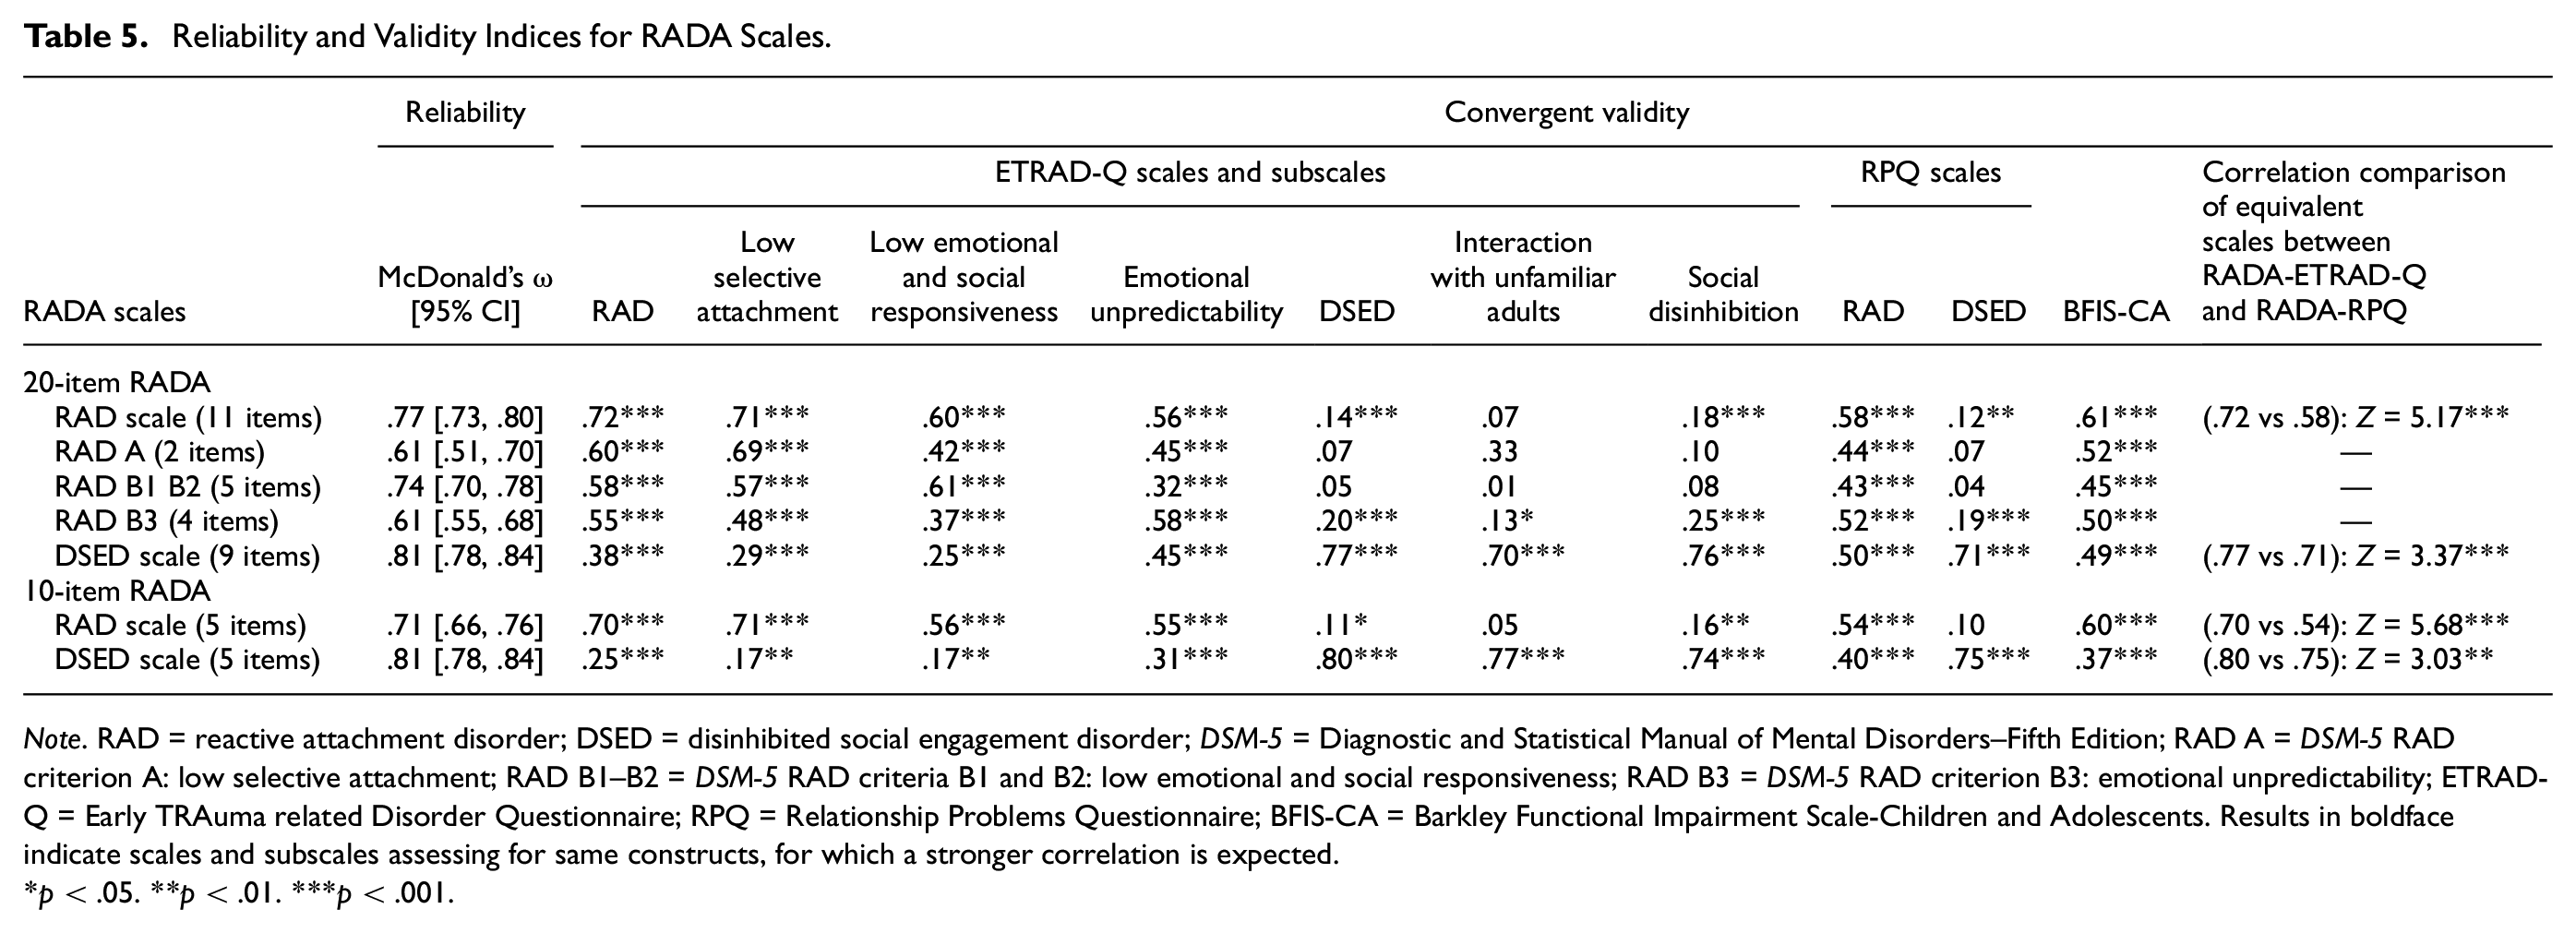
Note. RAD = reactive attachment disorder; DSED = disinhibited social engagement disorder; DSM-5 = Diagnostic and Statistical Manual of Mental Disorders–Fifth Edition; RAD A = DSM-5 RAD criterion A: low selective attachment; RAD B1–B2 = DSM-5 RAD criteria B1 and B2: low emotional and social responsiveness; RAD B3 = DSM-5 RAD criterion B3: emotional unpredictability; ETRAD-Q = Early TRAuma related Disorder Questionnaire; RPQ = Relationship Problems Questionnaire; BFIS-CA = Barkley Functional Impairment Scale-Children and Adolescents. Results in boldface indicate scales and subscales assessing for same constructs, for which a stronger correlation is expected.
p < .05. **p < .01. ***p < .001.
Convergent Validity
To assess the convergent validity of the RADA, we examined the correlations between the RADA scales (RAD and DSED) and those of the ETRAD-Q and the RPQ. For the 20-item version of the RADA, the RAD (11 items) and DSED (9 items) scales correlated with their RPQ counterparts, r = .58, p < .001 and r = .71, p < .001, and ETRAD-Q counterparts, r = .72, p < .001 and r = .77, p < .001. Also, all the RADA subscales (RAD A, RAD B1-B2, and RAD B3) correlated with the ETRAD-Q subscales (Low Selective Attachment, Low Emotional and Social Responsiveness, and Emotional Unpredictability). Correlations were strongest between subscales measuring the same symptom cluster or subdimension. Comparing correlations using the procedure proposed by Meng et al. (1992) for dependent samples showed that the RADA RAD scale correlated more strongly with its ETRAD-Q counterpart than with its RPQ counterpart, r = .72 vs .58, Z = 5.17, p < .001. The same was true for the DSED scale, r = .77 vs. .71, Z = 3.37, p < .001.
For the 10-item RADA, the RAD scale (5 items) and the DSED scale (5 items) correlated with their RPQ counterparts, r = .54, p < .001 and r = .75, p < .001, and ETRAD-Q counterparts, r = .70, p < .001 and r = .80, p < .001. Again, comparison of correlations showed that the RADA RAD scale correlated more strongly with its counterpart of the ETRAD-Q than with that of the RPQ, r = .70 vs .54, Z = 5.68, p < .001. The same was true for the DSED scale, r = .80 vs .75, Z = 3.03, p < .001.
Finally, all of the RADA scales (20- and 10-item versions) and subscales (RAD A, RAD B1-B2, RAD B3, and DSED) were positively correlated with the BFIS-CA global score measuring functional impairment (r from .37 to .61), meaning that higher RAD and DSED symptom scores were associated with greater functional impairment in everyday life. Comparing correlations showed, also, that the RADA RAD scale correlated more strongly with the BFIS-CA functional impairment scale than did the DSED scale for the 20-item version, r = .61 vs .49, Z = 2.54, p < .01. The same was true for the 10-item version, r = .60 vs .37, Z = 4.22, p < .001). All convergent validity results are shown in Table 5.
Known-Group Validity
The RADA’s known-group validity was investigated by comparing children from the community, foster care, and residential care groups. Nonparametric tests were used owing to the non-normal distribution (positive skewness) of the data in the community and residential care groups. Specifically, we used the Kruskal–Wallis and the Mann–Whitney tests (see Table 6) to compare the three groups of children (community, foster care, and residential care).
Descriptive Statistics and ANOVAs for the Three Subgroups on RAD DSED Scales and Subscales
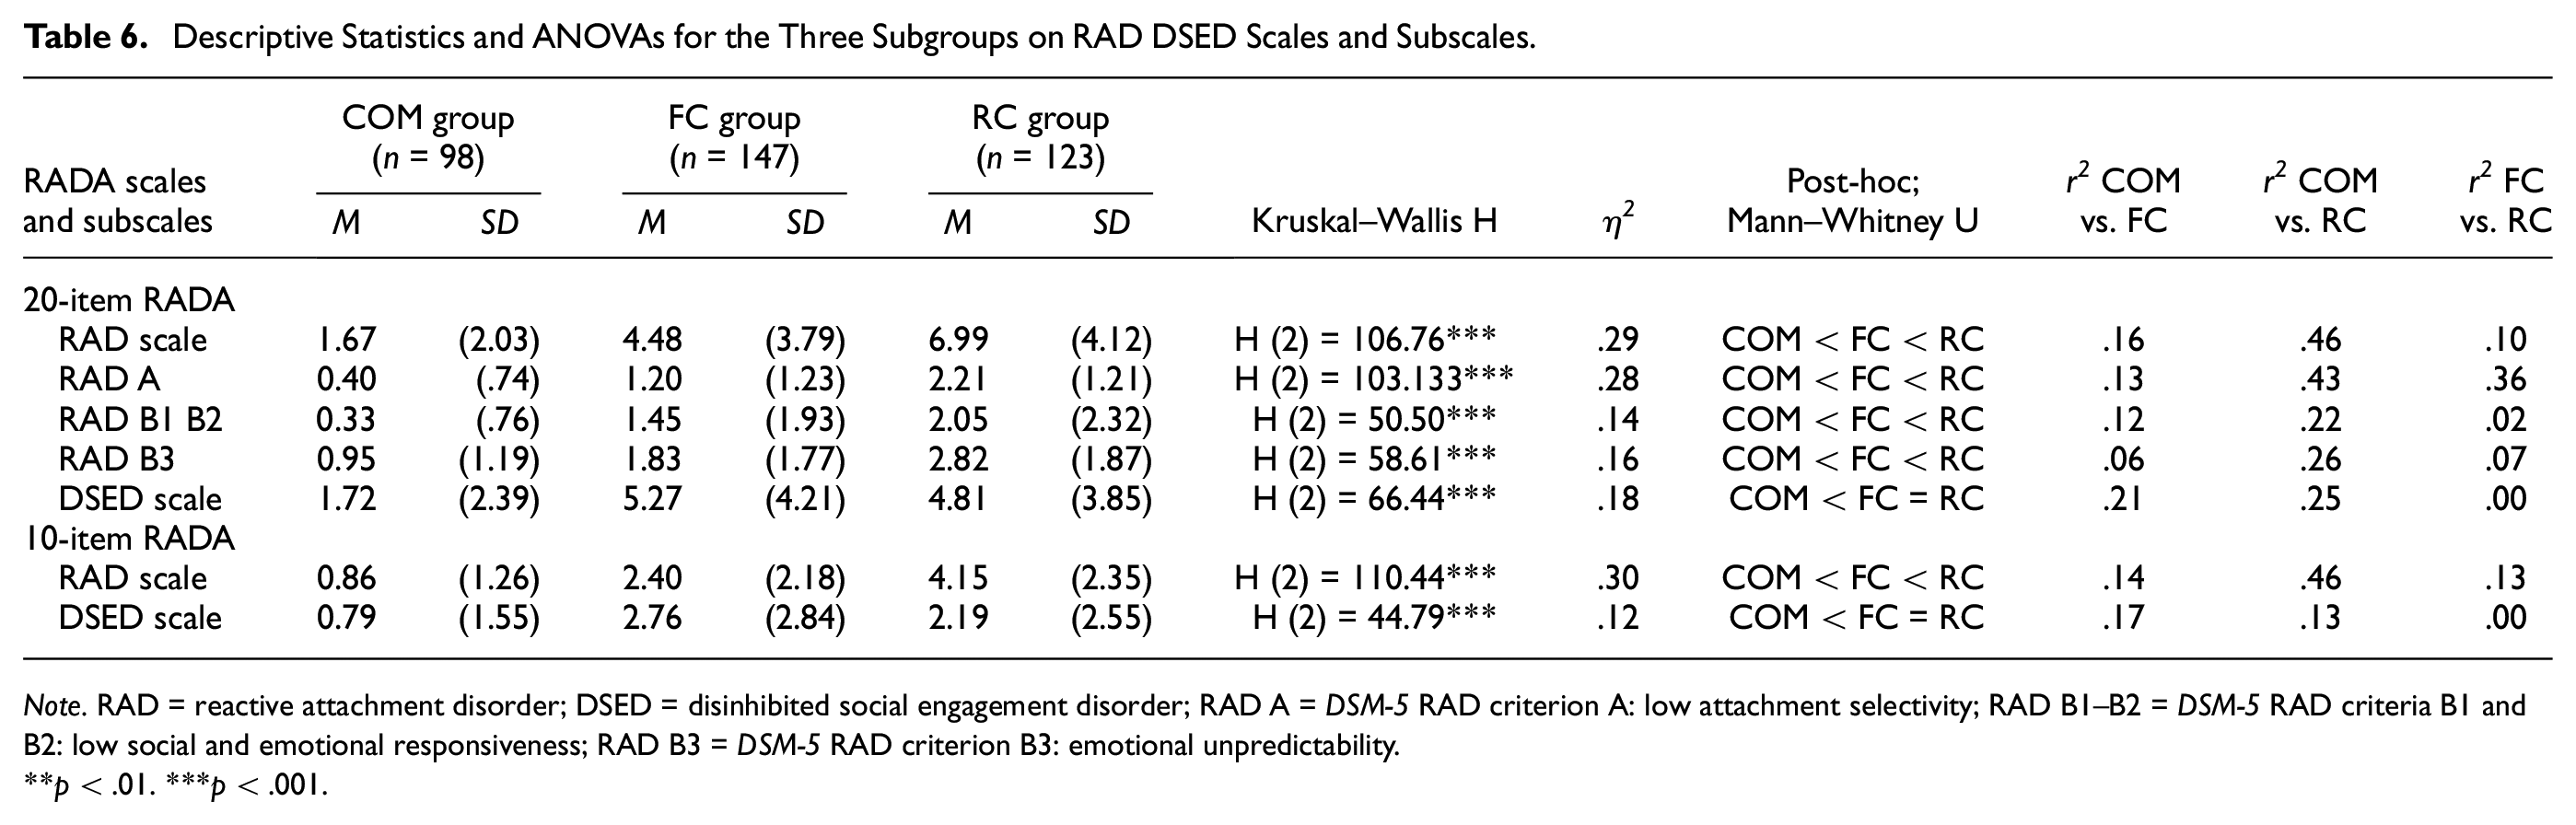
Note. RAD = reactive attachment disorder; DSED = disinhibited social engagement disorder; RAD A = DSM-5 RAD criterion A: low attachment selectivity; RAD B1–B2 = DSM-5 RAD criteria B1 and B2: low social and emotional responsiveness; RAD B3 = DSM-5 RAD criterion B3: emotional unpredictability.
p < .01. ***p < .001.
For the 20-item RADA, the Kruskal–Wallis test revealed a significant group difference on the RAD scale, H (2) = 106.76, p < .001. Post hoc group comparisons showed that community children, M = 1.67, SD = 2.03, presented fewer RAD symptoms than foster care children did, M = 4.48, SD = 3.79, Mann–Whitney U = 3,806.00, p < .001, and that foster care children, presented fewer RAD symptoms than residential care children did, M = 6.99, SD = 4.12, Mann–Whitney U = 5,723.50, p < .001. Similar results were found for the RADA RAD subscales (RAD A, RAD B1-B2, and RAD B3). The Kruskal–Wallis test revealed a significant group difference on the DSED scale, H (2) = 66.44, p < .001. Post hoc group comparisons showed that community children, M = 1.72, SD = 2.39, presented fewer DSED symptoms than foster care children did, M = 5.27, SD = 4.21, Mann–Whitney U = 3,352.50, p < .001, but that foster care children and residential care children, M = 4.81, SD = 3.85, did not differ significantly on DSED symptoms, Mann–Whitney U = 8,755.5, p = .654.
For the 10-item RADA, the Kruskal–Wallis test revealed a significant group difference on the RAD scale, H (2) = 110.44, p < .001. Post hoc group comparisons showed that community children, M = 0.86, SD = 1.26, presented fewer RAD symptoms than foster care children did, M = 2.40, SD = 2.18, Mann–Whitney U = 4,098.50, p < .001, and that foster care children, presented fewer RAD symptoms than residential care children did, M = 4.15, SD = 2.35, Mann–Whitney U = 5,253.00, p < .001. The Kruskal–Wallis test revealed a significant group difference on the DSED scale, H (2) = 44.79, p < .001. Post hoc group comparisons showed that community children, M = .79, SD = 1.55, presented fewer DSED symptoms than foster care children did, M = 2.76, SD = 2.84, Mann–Whitney U = 4,098.50, p < .001, whereas foster care children and residential care children, M = 2.19, SD = 2.55, did not differ significantly in this regard, Mann–Whitney U = 8,068.0, p = .14.
Rates
Rates of RAD and DSED were computed using a classification algorithm based on DSM-5 behavioral diagnostic criteria (criteria A and B) described in the Method section. Results (see Table 7) showed that none of the community children fell into the RAD classification and that 1% (1/98, [1 female]) fell into the DSED classification. For foster care children, less than 1% (1/147, [1 female]) fell into the RAD classification and 18% (26/147) into the DSED classification. Of the 26 foster care children classified as DSED, there were 15 females and 11 males. DSED proportions did not vary by child sex, χ2 (1) = 1.27, p = .26. For residential care children, 7% (8/123) fell into the RAD classifications and 10% (12/123) into the DSED classifications. Of the eight children classified as RAD, there were five females and three males. RAD proportions did not vary by child sex, χ2 (1) = .02, p = .97. Of the 12 children classified as DSED, there were eight females (17%) and four males (5%). These DSED proportions varied by child sex, showing significantly more females than males with DSED in residential care, χ2 (1) = 4.56, p = .03. Furthermore, two children in the residential care group fell into both classifications. RAD was significantly more frequent in the residential care group than in the foster care group, 7% versus 0.7%, χ2(1) = 7.05, p < .001, and DSED was more frequent in the foster care group (18%) than in the residential care group (10%), χ2(1) = 3.48, p < .062, though the difference was only marginally significant.
Number and Percentage of Children Meeting the Dx Criteria (Behavioral Symptoms Only) of the RAD and DSED (Based on the RADA Interview) by Subsample
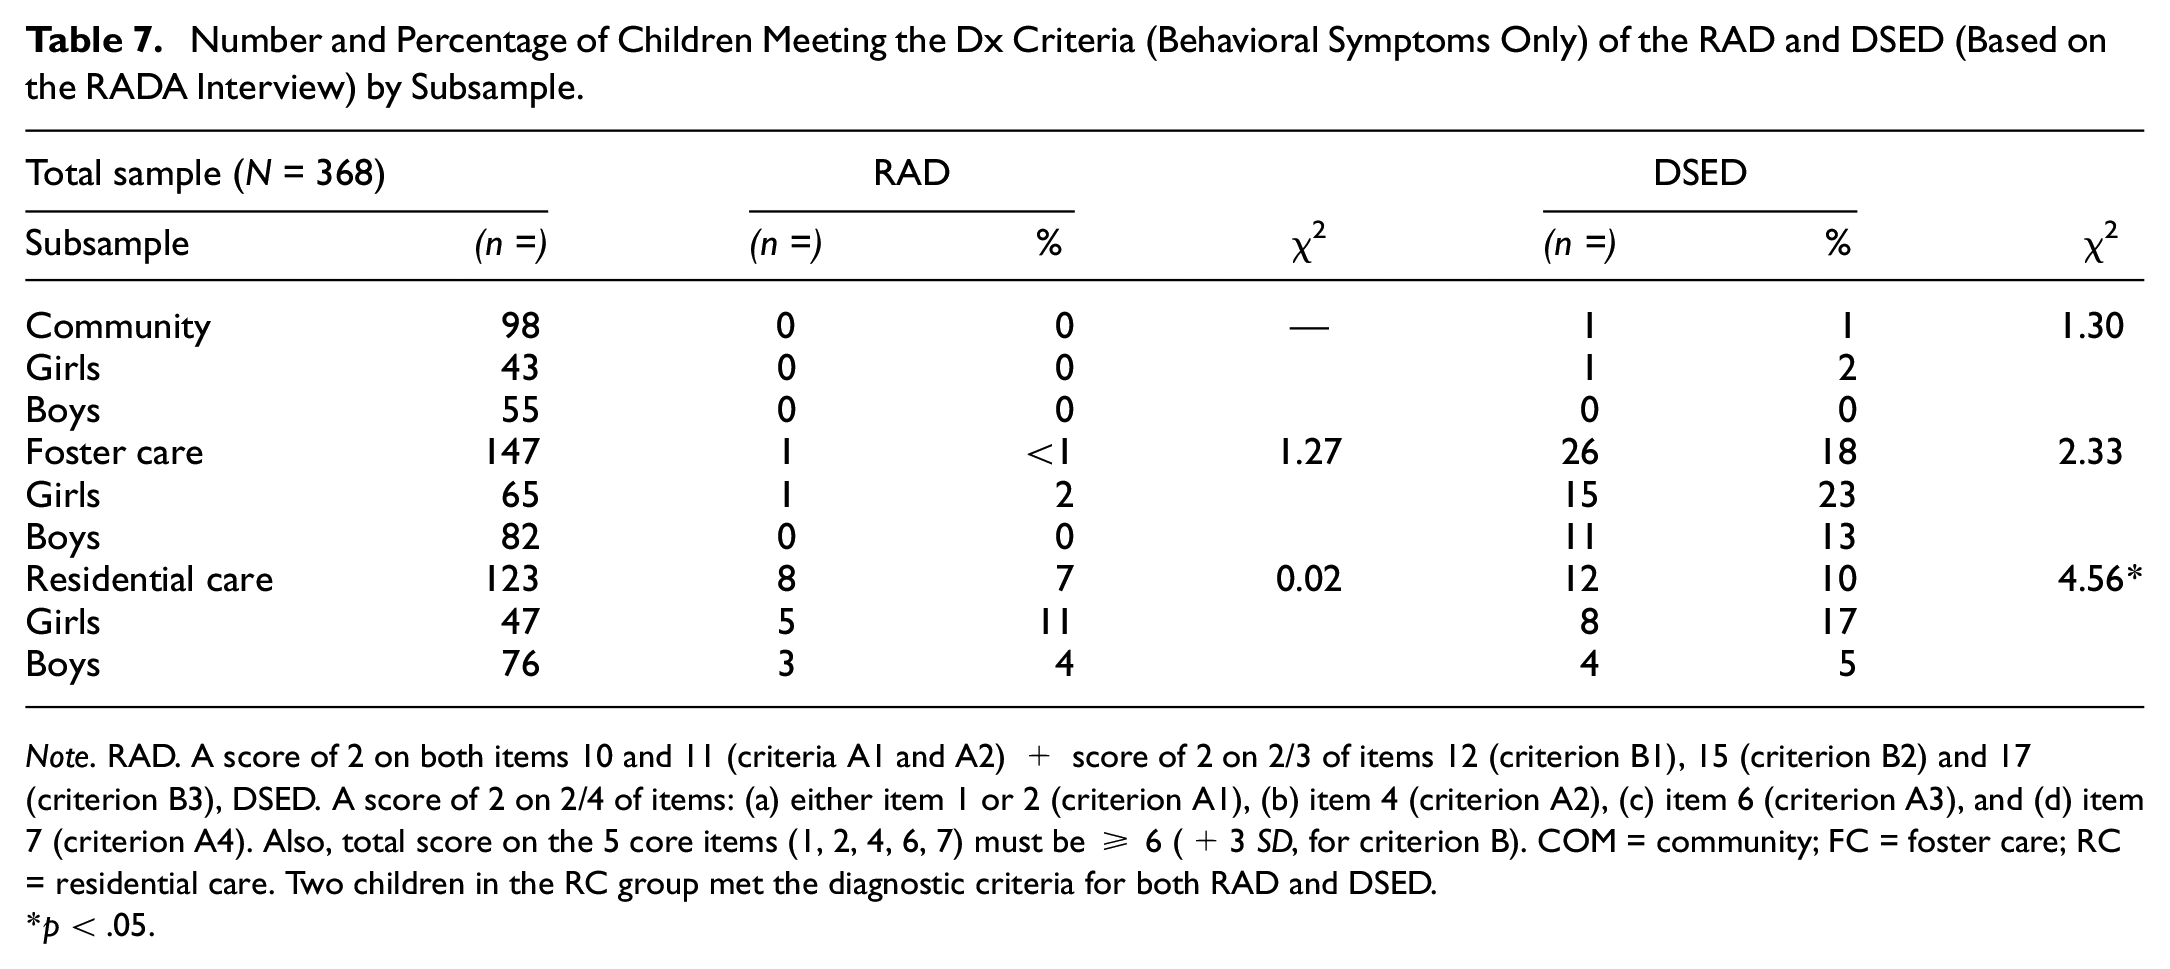
Note. RAD. A score of 2 on both items 10 and 11 (criteria A1 and A2) + score of 2 on 2/3 of items 12 (criterion B1), 15 (criterion B2) and 17 (criterion B3), DSED. A score of 2 on 2/4 of items: (a) either item 1 or 2 (criterion A1), (b) item 4 (criterion A2), (c) item 6 (criterion A3), and (d) item 7 (criterion A4). Also, total score on the 5 core items (1, 2, 4, 6, 7) must be ≥ 6 (+3 SD, for criterion B). COM = community; FC = foster care; RC = residential care. Two children in the RC group met the diagnostic criteria for both RAD and DSED.
p < .05.
Discussion
The RADA semistructured interview (Lehmann et al., 2020; Minnis et al., 2018) serves to assess RAD and DSED by covering all of the behavioral diagnostic criteria of the DSM-5. The aim of our study was to examine the psychometric properties of the RADA on three groups of Canadian children 5 to 12 years of age, including a community group and two high-risk groups with children placed in foster care or residential care. Moreover, this study sought to estimate the frequency of children with sufficiently high symptom levels to be classified as RAD and/or DSED based on the RADA. We examined the psychometric properties of two versions of the RADA, namely, the 20 “core item” version (Lehmann et al., 2020) and a short 10-item version composed exclusively of items associated with the DSM-5.
Factor Validity
The first series of CFA conducted on the 20-item RADA showed that the best-fitting model comprised four factors (Model 4): Low Attachment Selectivity (RAD A), Low Social and Emotional Responsiveness (RAD B1-B2), Emotional Unpredictability (RAD B3), and DSED. This factor structure is very close to the DSM-5 symptom clusters for RAD and DSED, except for RAD cluster B (the Low social and emotional responsiveness (B1), Low positive affect (B2) and Emotional unpredictability (B3), which broke down into two factors in our study, namely, the items regarding low social and emotional responsiveness/low positive affect (B1, B2) and the items regarding emotional unpredictability (B3). This same result was obtained in the ETRAD-Q validation study (Monette et al., 2022). Further research is required to determine whether the RAD cluster B symptoms should be conceptualized as two distinct clusters, that is, one related with emotional and social under-activation (B1, B2) and another related with emotional over-activation (B3).
In model 4a, three items (3, 5, 9) were allowed to cross-load. This greatly improved fit indices that were nevertheless already acceptable in model 4. It is worth mentioning that the loading of Demanding/attention seeking item (item 9) on the RAD cluster B3 (emotional unpredictability) factor seems accurate, as this item captures both the more “active” behaviors of children with DSED and the notable higher dysfunctions in children with RAD relative to children with DSED (Monette et al., 2022). Children who seek attention can be demanding for caregivers, as the unpredictability of their behavior likely requires constant adult supervision and assistance with behavior regulation.
Comfort seeking with strangers item (item 3) was by far the rarest behavior in our sample (see Table S1). Comfort seeking with strangers (note that this item measures comfort seeking with strangers when a child’s caregiver is present and available) is not an official diagnostic criterion of the DSM-5. Surprisingly, practically no study, to our knowledge, has verified whether this behavior is associated with the RAD or DSED phenotypes. DSED is currently viewed as a social behavior disorder rather than a disorder of the attachment system per se, as children with DSED typically have selected an attachment caregiver to whom they can be securely attached (or not), which does not appear to be the case for most of children with RAD (Zeanah & Gleason, 2015). If comfort seeking behaviors with strangers/unfamiliar adults (when a caregiver is present and available) are observed among children with DSED, it would prompt a reconsideration of the notion that DSED is not a disorder of the attachment system, suggesting that their attachment behaviors are indiscriminate, that is, directed at both caregivers and unfamiliar adults in a non differentiated manner. Since the DSM-5, it is social behaviors, rather than attachment behaviors, that are considered indiscriminate in children with DSED. Under the DSM-5, this aspect of indiscriminate or nonselective attachment is described as part of RAD — not DSED. The fact that this type of behavior might be observed in both children with RAD and children with DSED is intriguing. It is an issue that should be systematically investigated in future studies of RAD and DSED. Given that this item measures both disinhibited social behavior and a distinctly disordered attachment behavior, it is reasonable to allow for cross-loading on the DSED factor and the RAD cluster A (Low attachment selectivity) factor.
As for Invading social boundaries item (item 5), it mostly aligns with the absence of boundaries concerning objects (personal effects) and places (e.g., bedroom), rather than the absence of boundaries regarding physical people. This behavior is observed in both children with DSED and those with RAD, but it might be for different underlying reasons. In children with DSED, it may be indicative of their broader lack of social boundaries, whereas in children with RAD, it may stem from a more pronounced general dysfunction (e.g., resource seeking/theft in survival-mode functioning, wandering away, difficulty or general inability complying with rules/prohibitions). Further research is needed to support these hypotheses.
The second series of CFA was conducted on the short version of the RADA, comprising the 10 items strictly associated with the DSM-5. Results showed that the best-fitting model was composed of two factors, namely, a RAD factor and a DSED factor. These were weakly correlated (r = .20), which supports the idea that they correspond to two distinct diagnoses, as proposed by the DSM-5, rather than a single diagnosis with two subtypes, as was the case under the DSM-IV (Gleason et al., 2011; Jonkman et al., 2014; Zeanah & Gleason, 2015). The 20-item version of the RADA semistructured interview takes into account the diagnostic criteria for RAD-DSED under various nosological systems, namely, the DSM-IV, the ICD-10, and the DSM-5. The short 10-item version comprises only items based on the diagnostic criteria of the DSM-5. This might explain the better fit indices obtained within this model.
Known-Group Validity
Our study results indicate that children drawn from the community, compared with those placed in foster and residential care, display significantly fewer DSED and RAD symptoms. In addition, our results show that children in residential care, compared with those in foster care, show significantly more RAD symptoms, but a similar level of DSED symptoms. A descriptive analysis of the items (see Supplemental Table 1) for the community children revealed that score frequencies are very low on the majority of the items (<5% for all but three items), which suggest that the RADA’s scoring criteria are adequate. For children in foster or residential care, the high frequency of behaviors related to items 5 (invading social boundaries) and 9 (demanding/attention seeking) suggests that many children in placement exhibit these behaviors and that these behaviors do not discriminate between these two groups of children. Another interesting observation is that item 3 (comfort seeking with strangers) refers to a particularly rare behavior across all three groups (community: 1%; foster care: 0%; residential group: 2%). This suggests that the indiscriminate behaviors of children with DSED are more limited to social behaviors than to attachment behaviors, as some researchers have already proposed (Zeanah & Gleason, 2015). Finally, specifically among children in residential care, three items measuring RAD were very frequent, namely, items 10 (cluster A1: Low comfort seeking, 29%), 11 (cluster A2: Low response to comfort, 35%), and 17 (cluster B3: emotional unpredictability, 43%). Items 10 and 11 refer to attachment behaviors toward caregivers and it is well documented that children who have been maltreated are at higher risk of developing insecure or disorganized attachment behaviors (Cyr et al., 2010). In sum, our results indicate that many children in residential care have difficulty seeking and receiving comfort, but most of them do not necessarily meet all of the RAD diagnostic criteria.
Reliability and Convergent Validity
The two versions of the RADA semistructured interview (i.e., 20-item and 10-item) demonstrate excellent reliability in terms of both the internal consistency of the items and interrater agreement. Regarding the latter (see Supplemental Table 2), agreement was obtained not only on the RAD and DSED scales (that is, intraclass correlation on the sum of the items) but also on each individual item (weighted kappa), demonstrating the robustness of the RADA interview.
Results regarding the convergent validity show that the RADA scales are strongly correlated with their ETRAD-Q and RPQ counterparts. They also indicate that the RADA scales are more strongly correlated with those of the ETRAD-Q than with those of the RPQ and this seems more marked for the RAD scales. One reason that might explain the differences between the RAD correlations is that the RADA and the ETRAD-Q are DSM-5 based whereas the RPQ is ICD-10/DSM-IV based. Also, the RAD criteria are those that changed the most from the DSM-IV to the DSM-5, which could explain the weakest correlations between the RADA and the RPQ on RAD-related scales.
Rates
Data collected with the RADA semistructured interview allowed an estimation of the frequency of RAD and DSED in high-risk children based on two samples of children placed in foster and residential care. In addition, information was gathered from caregivers of children in the community. However, due to enrollment issues, such as the lack of compensation for community caregivers, the rates for this specific sample may not be fully representative, as some more vulnerable caregivers may not have participated in the study. Therefore, the following rates for children from the community should be interpreted with caution, as they could be underestimated. Despite this potential selection bias, it is worth noting that our community sample does include a proportion of vulnerable families, in terms of maternal education level, that is similar to the general population (in the province of Quebec), thereby increasing its representativeness.
Rates of RAD
First, our results for the foster care group indicate that only one child presented sufficient symptoms to fall into the RAD classification based on the RADA interview. This low rate (1/147, less than 1%) is close to those reported in other studies conducted on children in foster care in Germany (5%; Kliewer-Neumann et al., 2018), the Netherlands (3%; Jonkman et al., 2014), and the United Kingdom (2%; Bruce et al., 2019). These data suggest that RAD is rather rare among children in foster care. For children in residential care, our results revealed that eight children were classified as RAD based on the RADA interview (8/123, 7%). This rate cannot be compared against any other reported rates, as our study is the first to report such data on school-age children in residential care. However, one study examined the rate of RAD among adolescents in residential care and found a rate (9%) very similar to ours (Seim et al., 2021). Our results suggest that children in residential care are more at risk (nearly 10 times as much) of presenting RAD than those in foster care. RAD is a disorder associated with major social (Guyon-Harris et al., 2019; Moran et al., 2017) and emotional (Gleason et al., 2011; Sonuga-Barke et al., 2017) functioning impairments. School-age children with RAD possibly require more intensive and prolonged treatment and care than what foster families can offer. This may render such children more at risk of being placed in residential care, as it is the only setting with the resources to meet their needs. Another possible explanation for the low rate of RAD in our foster care group is that these children had the opportunity to benefit from a stable relationship with a parental figure that may have led to a reduction in RAD symptoms (Turner et al., 2022; Zeanah & Gleason, 2015). In this regard, in our sample, the children in the foster care group had been in care longer (nearly 4 years) than those in the residential care group (1.5 years).
Rates of DSED
Results of the current study regarding DSED indicate that 26 children in foster care fell into the DSED classification based on the RADA (18%). This is relatively close to the 12% and 30% reported, respectively, by Jonkman et al. (2014) and Kliewer-Neumann et al. (2018) in comparable samples of children in foster care. For residential care, only 12 (10%) children were classified as DSED based on the RADA. These results suggest that, contrary to RAD, DSED is nearly twice as frequent in foster care children as in residential care children. Two hypotheses might explain why there would be more children with DSED in foster care than in residential care. Our results show that RAD children show higher level of functional impairment (on the BFIS-CA) in comparison to DSED children. DSED children being relatively more functional in general could explain why they are more often placed in foster care than in residential care. Also, it could be that the RADA measure underestimates the rate of DSED among children in residential care. In such highly structured settings, child care workers rarely see children interact with strangers because they seldom accompany the children outside the residential center and very few strangers are allowed in. Moreover, a fair proportion of these children do their schooling at the residential center. Unless children interact with new or substitute child care workers, who are unfamiliar adults, it might be more difficult to observe DSED symptoms in residential care. Conducting an observational study of these children interacting with strangers could provide a more definite answer to this question. Furthermore, females in residential care are more likely to be classified DSED than males. Such sex differences were not found for this study’s foster care (23% vs 13%) and community sample (2% vs 0%). It is possible that females are more at risk of developing DSED than males, just as it could also be that caregivers worry more about females showing social disinhibition (e.g., wandering off with an adult strangers) than males, increasing female likelihood of being placed in residential care rather than in foster care. To our knowledge, this is the first study to observe significant sex differences in rates of DSED. This finding needs replication.
Based on the caregiver-reported diagnoses of RAD/DSED (unspecified RAD and/or DSED), 23% of the children in the foster care group and 37% of those in the residential care group had been formally diagnosed with RAD/DSED or “attachment disorder.” When we combined RAD and DSED classifications as based on the RADA interview, we find that only 18% of the foster care children and 17% of the residential care children have RAD or DSED. There may be an overdiagnosis of RAD-DSED made by community practitioners in residential care children. Again, even though the community sample was stratified according to parents’ level of education, it could be, due to our recruitment procedure (lack of compensation for community caregivers and uncertain [lottery] compensation for foster caregivers) that the most vulnerable and at-risk caregivers did not participate in the research project and that RAD and DSED rates might have been underestimated in our study.
Limitations
Our study is not without limitations. First, RAD and DSED classifications were solely based on the RADA items, and these items only assess DSM-5 behavioral diagnostic criteria (criteria A and B). A more comprehensive diagnostic classification taking account of children’s history of maltreatment and age of exposure to maltreatment (criteria C and D) might yield somewhat different rates. Given that data on the history of maltreatment are not always available or reliable, even from child protective services records, particularly the age of onset of maltreatment, we advocate for implementing standardized and comprehensive assessment protocols to ensure accurate and detailed documentation of maltreatment histories. Second, children with an autism spectrum disorder diagnosis were excluded from the study (RAD criterion E). However, it is possible that some undiagnosed children with autism spectrum disorders were included in the study, as we did not assess autism ourselves. A third limitation is the absence of observational data. Such data would have provided independent information and classification would also be based on a multi-informant perspective. However, video recording, needed standardized observations and interrater reliability, is very difficult to implement in studies with child protective services. Moreover, whereas a few structured observation tools have been developed to assess DSED symptoms (see Lehmann et al., 2020), only one such instrument, reported in one study, exists for RAD in school-age children (Coding of Attachment Disorder Behavior in Children, CADBC; Zimmermann & Iwanski, 2018). Finally, as discussed previously, a limitation of this study is the representativeness of the sample. The different financial compensations for community parents, foster parents, and residential caregivers may have affected their motivation to participate in this study and mislead either upward (residential care group) or downward (community group, foster care group) the rates that were found.
The RADA Interview: A Research Tool With Clinical Applications
In conclusion, the RADA is a semistructured interview that serves to assess RAD and DSED. It is the only semistructured interview that has been designed to cover all the RAD and DSED behavioral diagnostic criteria of the DSM-5 and that has been subjected to a complete validation process. Results of this study indicate that the RADA interview possesses excellent psychometric properties in terms of internal consistency, factor validity, convergent validity, and known-group validity. To increase its reliable use, we also developed scoring criteria for each item to ensure uniform coding across coders. Excellent interrater agreements for both the scale scores and the individual items were obtained. We also demonstrated that the core item version (20 items) and the short version (10 items) possess excellent psychometric properties. Researchers and clinicians can choose the version that best suits their needs. The original version can serve to explore the DSM-5 symptoms and related-symptoms that were included in the ICD-10 and the DSM-IV, while the short version is useful to classify children more rapidly in clinical settings. In sum, the RADA interview appears to be a valid instrument to be used as part of a complete and rigorous diagnostic procedure. This might include first screening with the ETRAD-Q, then carrying out a diagnostic procedure with an interview like the RADA, and possibly a structured observation session using existing observation tools.
Supplemental Material
sj-docx-1-asm-10.1177_10731911241276625 – Supplemental material for Validation of the Reactive Attachment Disorder and Disinhibited Social Engagement Disorder Assessment (RADA): A DSM-5 Semistructured Interview
Supplemental material, sj-docx-1-asm-10.1177_10731911241276625 for Validation of the Reactive Attachment Disorder and Disinhibited Social Engagement Disorder Assessment (RADA): A DSM-5 Semistructured Interview by Maude Archambault, Chantal Cyr, Helen Minnis, Stine Lehmann and Sebastien Monette in Assessment
Footnotes
Acknowledgements
The authors thank all the foster parents, child care workers and biological parents who participated in this study.
Declaration of Conflicting Interests
The author(s) declared no potential conflicts of interest with respect to the research, authorship, and/or publication of this article.
Funding
The author(s) disclosed receipt of the following financial support for the research, authorship, and/or publication of this article: This project was funded in part by the Institut universitaire Jeunes en difficulté (IUJD) of the CIUSSS Center-Sud-de-l’île-de-Montréal and the Social Sciences and Humanities Research Council (SSHRC) of Canada (grant no: 430-2018-00756).
Supplemental Material
Supplemental material for this article is available online.