
Abstract
The Dissociative Symptoms Scale (DSS) was developed to assess moderately severe types of dissociation (depersonalization, derealization, gaps in awareness and memory, and dissociative reexperiencing) that would be relevant to a range of clinical populations, including those experiencing trauma-related dissociation. The current study used data from 10 ethnically and racially diverse clinical and community samples (N = 3,879) to develop a brief version of the DSS (DSS-B). Item information curves were examined to identify items with the most precision in measuring above average levels of the latent trait within each subscale. Analyses revealed that the DSS-B preserved the factor structure and content domains of the full scale, and its scores had strong reliability and validity that were comparable to those of scores on the full measure. DSS-B scores showed high levels of measurement invariance across ethnoracial groups. Results indicate that DSS-B scores are reliable and valid in the populations studied.
Keywords
Dissociation is multifaceted and encompasses a range of phenomena that vary in severity and impact on functioning. It has been proposed that clinically relevant dissociative experiences include distortions in perception of self (depersonalization) or the environment (derealization), gaps in awareness, memory, or identity, and disruptions in subjective experience accompanied by involuntary and unwanted intrusions (Cardeña & Carlson, 2011). Moreover, the Diagnostic and Statistical Manual of Mental Disorders (5th ed.; DSM-5; American Psychiatric Association [APA], 2013) defined dissociation as the “disruption of and/or discontinuity in the normal integration of consciousness, memory, identity, emotion, perception, body representation, motor control, and behavior.” These symptoms are associated with significant distress, impairment, and poor treatment response (Kleindienst et al., 2016; Lanius et al., 2012) and may be experienced by individuals with a variety of psychiatric disorders (Lyssenko et al., 2018). Dissociative symptoms are most prevalent and severe in patients with dissociative disorders, such as dissociative identity disorder, and are also very common and elevated in those with posttraumatic stress disorder (PTSD; Carlson et al., 2012; Waelde et al., 2009) and acute stress disorder (Cardeña & Carlson, 2011). High levels of dissociation have also been associated with disordered attachment experiences (Dutra et al., 2009; Maniglio, 2009), exposure to traumatic stress (Carlson et al., 2012), complex PTSD (Hyland et al., 2020), and borderline personality disorder (Scalabrini et al., 2017). The relevance of dissociation to traumatic stress is further underscored by the recent addition of a dissociative subtype to the DSM diagnostic criteria for PTSD (APA, 2013), and by findings of dissociative symptoms being more strongly associated with the severity of PTSD than depression and general psychological distress (Eidhof et al., 2019). Research also indicates that dissociation is essentially unrelated to some psychological issues, such as alcohol use (e.g., Chana et al., 2021). This may be explained by dissociation and alcohol consumption serving similar emotion regulatory functions for responding to intense emotions and stressors (Cardeña & Carlson, 2011; Centanni et al., 2019). The relevance and complexity of dissociation’s relationships with psychological problems support the need for a brief measure of dissociation for use in research and clinical care.
The Dissociative Symptoms Scale (DSS) is a 20-item self-report measure that was developed to assess moderately severe types of dissociation (depersonalization, derealization, gaps in awareness and memory, and dissociative reexperiencing) that would be relevant to a range of clinical populations, including those experiencing trauma-related dissociation (Carlson et al., 2018). It does not include types of dissociation that are commonly observed in non-clinical populations or relatively rare and experienced mostly by people with dissociative disorders. The DSS assesses the frequency of dissociative symptoms in the past week. The phenomena assessed are neither “in the moment” measures of states nor expected to be stable over long periods of time (i.e., months or years). However, the total frequency of dissociative symptoms is expected to be fairly stable from week to week. Data from four clinical and five community samples were used to select items for the DSS, and initial psychometric analyses demonstrated the reliability and validity of DSS scores to measure dissociation in similar populations (Carlson et al., 2018). The DSS has been used to measure dissociative experiences in other clinical (Hyland et al., 2018) and non-clinical samples (Chiu et al., 2017), in adults with PTSD (Műllerová et al., 2016), and to evaluate the validity of scores on other measures of dissociation (Eidhof et al., 2019). In addition, scores on DSS items have shown excellent correspondence with dissociative symptoms measured in real time in daily life (Carlson et al., 2016).
The DSS was developed to address the limitations of other measures of dissociation. For example, the Dissociative Experiences Scale (DES; Bernstein & Putnam, 1986) contains many items that assess mild forms of dissociation that are frequently endorsed in non-clinical samples and some items that assess severe dissociative experiences that are rarely endorsed and primarily relevant to those with dissociative disorders (Carlson & Putnam, 1993). Results of item response theory (IRT) analyses comparing the information provided by DES and DSS items have demonstrated that DSS items assess symptoms with latent trait severity levels that fall between mild and severe DES items (Carlson et al., 2018). Another advantage of the DSS is that it assesses a range of clinically relevant dissociative experiences rather than focusing on a specific type (e.g., depersonalization), which is important given the diversity and complexity of dissociative symptoms. Armour and colleagues (2014) found that depersonalization and derealization were no more or less related to PTSD symptom clusters than other types of dissociative experiences studied. Although DSS scores do seem to provide a valid and reliable assessment of dissociation in populations studied, a briefer measure may be valuable for use in many research and clinical contexts when time for assessment is limited or the number of scale items needs to be minimized, such as studies assessing a large number of variables or measuring dissociation repeatedly over time (e.g., daily diary, longitudinal, or treatment studies).
The objectives of this study were to develop a brief version of the DSS (DSS-B) that (a) included items that were the most precise in measuring clinically relevant levels of the types of dissociation assessed, (b) preserved coverage of the content domains (subscales) and four-factor structure of the DSS, (c) produced scores that demonstrate reliability and validity comparable to the full measure, and (d) measured the same construct across racial/ethnic groups. This research involved secondary analyses on data drawn from nine clinically and ethnically diverse samples in which the full DSS was administered, including trauma-exposed adults, patients with trauma-related disorders, and student and community samples, as well as a tenth sample in which only DSS-B items were assessed.
To select items for the DSS-B, we conducted IRT analyses to identify items with the greatest precision in measuring above average levels of the latent trait. Structural analyses were used to evaluate whether the factor structure and content domains of the full measure were preserved. We also examined the internal consistency and temporal stability of DSS-B scores. The total frequency of dissociative symptoms was expected to be fairly stable from week to week with correlations in the range of .5 to .7, similar to the full DSS (Carlson et al., 2018). The validity of DSS-B scores was investigated by testing for elevations in clinical compared to non-clinical samples, among individuals with probable PTSD versus without probable PTSD, and in adults who were admitted to a trauma center as a result of injury from interpersonal or intentional violence as opposed to a vehicle collision, fall, or other accident. Convergent and discriminant validity were assessed using correlations of DSS-B scores with other measures. Scores on the DSS-B were expected to correlate most strongly with scores on measures of dissociation and PTSD symptoms, moderately with scores on measures of depression, perceived stress, and trauma exposure, and least strongly or essentially uncorrelated with scores on measures of alcohol use. To evaluate whether the validity of DSS-B scores was comparable to that of scores on the full measure, we tested for differences in the correlations of DSS-B and DSS scores with other measures. Measurement invariance analyses were performed to examine whether DSS-B scores measured the same construct across four ethnoracial groups.
Method
Data Sources
The current study utilized a combined dataset of 3,401 individuals from nine samples in which the full DSS was administered and a 10th sample of 478 individuals who completed the brief version (DSS-B). Demographic characteristics are shown in Tables 1 and 2 for the first nine and 10th samples, respectively. Informed consent was obtained in all samples. Seven of the samples were used to develop the full DSS, which included veterans in a Veterans Affairs (VA) residential PTSD program (Residential Veterans; n = 240), adults with PTSD in a medication study (PTSD Diagnosis; n = 33), adults assessed one to 14 days after a traumatic injury to self or a loved one that resulted in hospitalization (Trauma Center; n = 149), veterans in a VA residential homeless program (Homeless Veterans; n = 115), students at a Midwestern university (Midwest Students; n = 210), students at a Western state university (Western Students; n = 406), and adults in university, college, and shopping areas (Community Adults; n = 447). Additional information about these samples and relevant study methods is elsewhere (Carlson et al., 2018).
Demographic Characteristics and DSS-B Total Score Descriptive Statistics by Sample and Split of Data in the Nine Samples That Completed the Full DSS.
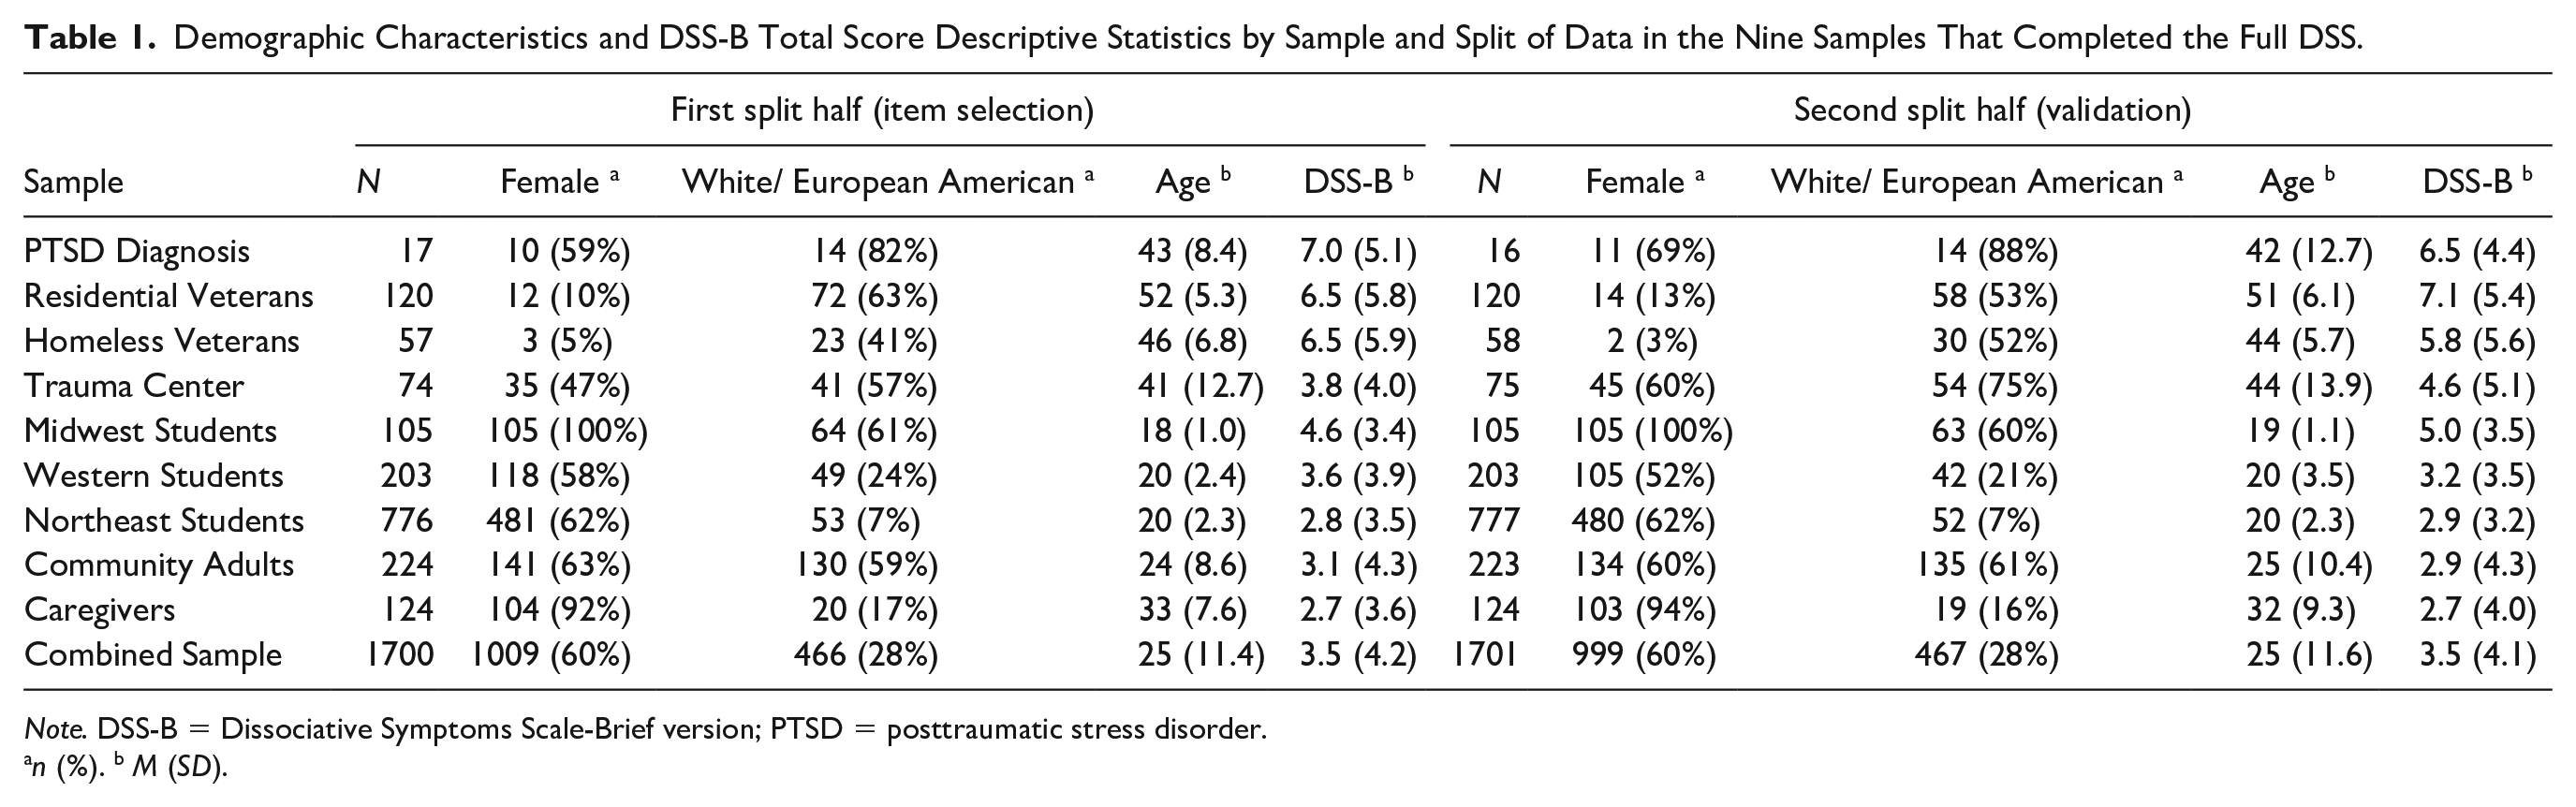
Note. DSS-B = Dissociative Symptoms Scale-Brief version; PTSD = posttraumatic stress disorder.
n (%). b M (SD).
Sample Characteristics and Descriptive Statistics for DSS-B Total Scores in the COTI DSS-B Sample (N = 478).
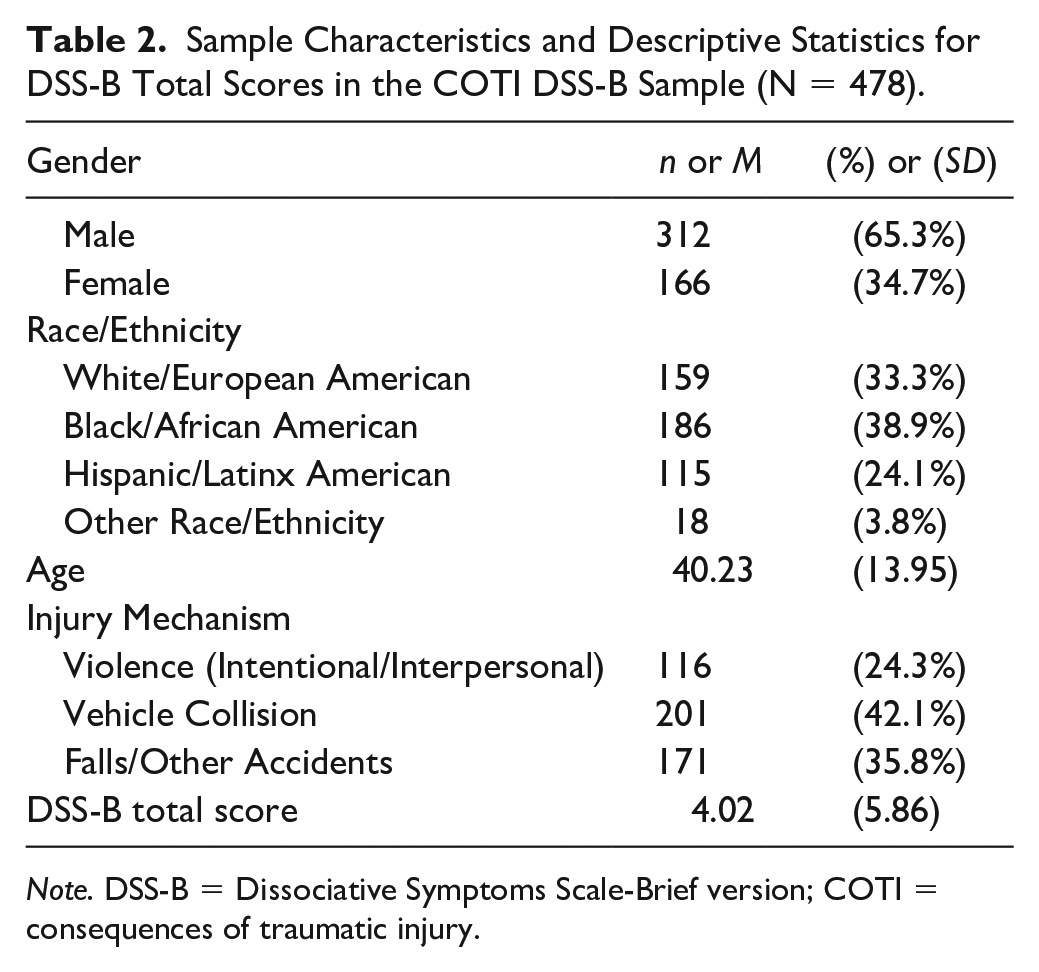
Note. DSS-B = Dissociative Symptoms Scale-Brief version; COTI = consequences of traumatic injury.
The eighth sample included primary caregivers of young children (ages 2–6) brought to a university-affiliated clinical research program at an urban public hospital between 2003 and 2011 (Caregivers; n = 248; Hagan et al., 2017). Caregivers were seeking outpatient mental health services for their children due to interpersonal trauma exposure (e.g., community violence, domestic violence, caregiver death). Most were the child’s biological mother (81%), and the rest were the biological father (9%) or another adult caregiver (10%). Exclusion criteria included severe intellectual disability, suicidal/homicidal ideation, severe psychosis, and active substance abuse. Baseline assessments were administered in participants’ native language (English or Spanish) by mental health providers using interview or paper format.
The ninth sample consisted of undergraduate students from a large urban public university system in the Northeastern U.S. (Northeast Students; n = 1,553; Anglin et al., 2014). Northeast Students were recruited through a participant recruitment website from 2011 to 2016 and were eligible for the study if they were between the ages of 18-29 years and self-identified as Black/African American/African descent or as a first- or second-generation immigrant. Participants completed self-report questionnaires on a computer in a research lab and were given course credit for participation.
The 10th sample included adults who were hospitalized due to a serious injury and completed the DSS-B 3 months later as part of a longitudinal study on consequences of traumatic injury (COTI DSS-B; n = 478). The sample was recruited from two large trauma centers in the Midwest and the Southern U.S. between 2017 and 2020. Adults aged 18–65 years without a cognitive impairment were eligible for the study if they suffered a physical injury that was not related to a preexisting condition or intentional self-harm, were admitted to the hospital for at least 24 hours, and were not in police custody. Assessments were conducted in English or Spanish and administered either in person or by phone. Measures were translated into Spanish by a bilingual translator, then reviewed by two other bilingual translators, and the three translators reviewed and reconciled any discrepancies. The present analyses focus on data from the 3-month follow-up; although information on the type of injury mechanism and demographic characteristics were collected at baseline.
Measures
The full DSS was administered to participants in all samples except for the COTI DSS-B sample, in which case the brief version of the DSS (DSS-B) was administered instead. All other measures were administered in a subset of the samples, as indicated below. Internal consistency of scores for measures in the current data are reported below in terms of coefficient alpha with 95% confidence intervals (CIs), which was estimated using the latent variable approach with 5000 bootstrap draws (Raykov & Marcoulides, 2015). Descriptive statistics for all measures are in the Supplemental Materials (Tables S1–S3).
The DSS is a 20-item self-report measure that assesses the frequency of dissociative symptoms in the past week (Carlson et al., 2018). The instructions at the top read: “For each statement below, check a box to show how much each thing has happened to you in the past week.” Response options for each item range from 0 = “not at all” to 4 = “more than once a day.” The DSS includes four subscales that cover the domains of depersonalization and derealization (e.g., “Things around me seemed strange or unreal”), sensory misperceptions (e.g., “I heard something that I know really wasn’t there”), gaps in awareness and memory (e.g., “I suddenly realized that I hadn’t been paying attention to what was going on around me”), and cognitive-behavioral reexperiencing (e.g., “I reacted to people or situations as if I were back in an upsetting time in my past”). Total scores are calculated as the sum of item responses. DSS scores have shown strong internal consistency, temporal stability, and validity in four clinical and five non-clinical samples (Carlson et al., 2018). In the nine samples that completed the full DSS, internal consistency of DSS scores was strong (
The DES (Bernstein & Putnam, 1986; Carlson & Putnam, 1993) was administered in the Residential Veterans and Western Student samples (
The PTSD Checklist-Civilian (PCL-C) and Military (PCL-M) versions (Weathers et al., 1993) were used to assess PTSD symptoms in the Midwest Students, Residential Veterans, and Homeless Veterans samples (
The PTSD Checklist for DSM-5 (PCL-5; Weathers et al., 2013) was used to assess PTSD symptoms following traumatic injury in the COTI DSS-B sample (
The Screen for Posttraumatic Stress Symptoms (SPTSS; Carlson, 2001) was used to assess PTSD symptoms in the Trauma Center and Community Adults samples (
The Davidson Trauma Scale (DTS; Davidson et al., 1997) was used to assess PTSD symptoms in the Caregivers sample (
The Clinician Administered PTSD Scale (CAPS; Weathers et al., 2001) was used to assess PTSD symptoms in the PTSD Diagnosis and Residential Veterans samples (
The Trauma History Screen (THS; Carlson et al., 2011) was used to measure trauma exposure in the Trauma Center, Homeless Veterans, Midwest Students, and Community Adults samples. The THS measures exposure to high magnitude stressor (HMS) events. Respondents indicate whether they have experienced each of 15 types of HMS events and how many times an event of that type has happened to them. Total HMS scores are the sum of frequencies for all HMS events. Total HMS scores from the THS have demonstrated good retest reliability and convergent validity in clinical and nonclinical samples (Carlson et al., 2011).
The Life Events Checklist (LEC; Gray et al., 2004) was used to measure trauma exposure in the Northeast Students sample. The LEC screens for exposure to 17 types of potentially traumatic events. Respondents indicate whether each type of event happened to them personally, whether they witnessed it happen to someone else, and whether they learned about it happening to someone close to them. Total scores were calculated as the number of items for which “it happened to you personally” was endorsed. LEC exposure reports have shown adequate temporal stability over one week and convergent validity with another trauma exposure measure in samples of college students and combat veterans (Gray et al., 2004).
The Beck Depression Inventory (BDI; Beck et al., 1961; Beck & Steer, 1993) is a 21-item measure that assesses attitudes and symptoms of depression on a 4-point scale. The BDI short-form (BDI-SF) comprises 13 BDI items that assess cognitive-affective symptoms of depression. The BDI was administered in the Caregivers sample (
The Center for Epidemiologic Studies Depression Scale Revised (CESD-R-10; Kohout et al., 1993) was used to measure depression symptoms in the Northeast Students sample (
The Patient Health Questionnaire (PHQ-8; Kroenke et al., 2009) was used to assess depression symptoms in the COTI DSS-B sample (
The Perceived Stress Scale (PSS; Cohen et al., 1983) is a measure that assesses perceived life stress in the past month on a 5-point scale that ranges from 0 = “never” to 4 = “very often.” The original PSS included 14 items (PSS-14), and a shortened, 10-item version (PSS-10) has also been created based on a factor analysis of PSS-14 scores in a large U.S. probability sample (Cohen & Williamson, 1988). The PSS-14 was administered in the Northeast Students sample (
The Alcohol Use Disorders Identification Test (AUDIT; Babor, 2000) is a 10-item measure that was used to assess problematic alcohol use in the Trauma Center sample (
Alcohol use was assessed in the COTI DSS-B sample using two items from the 2015 National Survey on Drug Use and Health (NSDUH; Center for Behavioral Health Statistics and Quality, 2016). The first item assessed the frequency of alcohol consumption in the past month with the question: “During the past 30 days, on how many days did you drink one or more drinks of an alcoholic beverage?” The typical quantity of alcohol consumed on drinking days in the past month was assessed with the question: “During the past 30 days, on the day/days that you drank, how many drinks did you usually have each day?”
Results
Item Selection
Each of the nine samples that completed the full DSS was randomly split in half, and the first half of these samples (Item Selection sample; n = 1,700) was used to select items for the DSS-B. The R package mirt (Chalmers, 2012) was used to conduct IRT analyses using the graded response model (GRM), which treats items as ordinal. Due to low endorsement of the highest response option (4 = “more than once a day”; 0.6% to 5.4% across DSS items), the top two options of each item were combined for the IRT analysis. To preserve coverage of the content domains and the four-factor structure of the DSS, two items were retained from each DSS subscale, and IRT analyses were performed for each subscale separately so that the selection of items within each subscale was not influenced by items from other subscales (Smith et al., 2000).
The local independence assumption was evaluated for each GRM model using the likelihood ratio (G2) statistic with Bonferroni correction (Chen & Thissen, 1997). The Bonferroni correction was chosen because it is recommended when the primary focus is on evaluating the universal null hypothesis (e.g., all tests of local dependence for item pairs are not significant; Perneger, 1998). Results of these tests revealed that each of the fitted GRMs contained at least one pair of items with a significant residual association. These residual associations were primarily between pairs of items with similar wording or structure, suggesting that they may be explained by method factors as opposed to conceptual similarities that were not adequately captured by the latent trait. Person fit was examined using Drasgow’s Zh (Drasgow et al., 1985) to determine whether there were improbable participant response patterns that could impact results. The absolute value of Zh exceeded 3.5 for fewer than 0.5% of individuals, suggesting that overall, the latent trait was an appropriate measure of severity given participant response patterns and item estimates. Due to the small proportion of improbable response patterns, all participants were retained in the analysis; however, results did not change if these participants were excluded.
GRM parameter estimates were used to derive item information curves (IICs) so that each item’s precision in measuring the latent trait (item information) could be examined across the latent trait continuum (Baker, 2001). Because the latent trait has a mean of 0 and SD of 1, values along the continuum describe the severity of the latent trait relative to the mean in units of standard deviation (i.e., z-score). Items with the greatest precision in measuring above average levels of the latent trait were selected for the DSS-B by estimating the area under each item’s information curve (AUIIC) between the latent trait (θ) values of zero (the mean) and four (4 SD above the mean) using adaptive quadrature. This range of the latent trait was assumed to reflect clinically relevant levels of the content domains assessed by the DSS given the mix of clinical, student, and community samples in the data. Item information results from the IRT analyses are summarized in Table 3. The first column of numerical values shows each item’s AUIIC between the latent trait mean and 4 SD above the mean. Plots depicting these AUIICs for each item are included in the Supplemental Materials (Figures S1 and S2). Peak information indicates an item’s highest information value, which reflects its maximum level of precision in measuring the latent trait. These values can be compared among items measuring the same latent trait, with higher values reflecting greater measurement precision. The next column reports the latent trait severity that corresponds to the peak information value (i.e., severity of the latent trait that the item is most precise in measuring). The last three columns describe the range of latent trait severities where item information is greater than one (e.g., maintains at least a moderate level of measurement precision). These latent trait values represent locations (i.e., severity levels) on the latent trait continuum in units of SD from the mean and can be interpreted as z-scores. The two items with the largest AUIIC values from each subscale (in boldface) were selected for the DSS-B. These items also had the highest peak information values within each subscale and demonstrated moderate to high levels of precision in measuring severities of the latent trait between -0.835 and 3.287 SD from the mean. The R code for this analysis is provided in the Supplemental Materials. A copy of the DSS-B measure is provided in the appendix.
Summary of Item Response Theory (IRT) Analysis Item Information Results From the First Half of the Nine Samples That Completed the Full DSS.
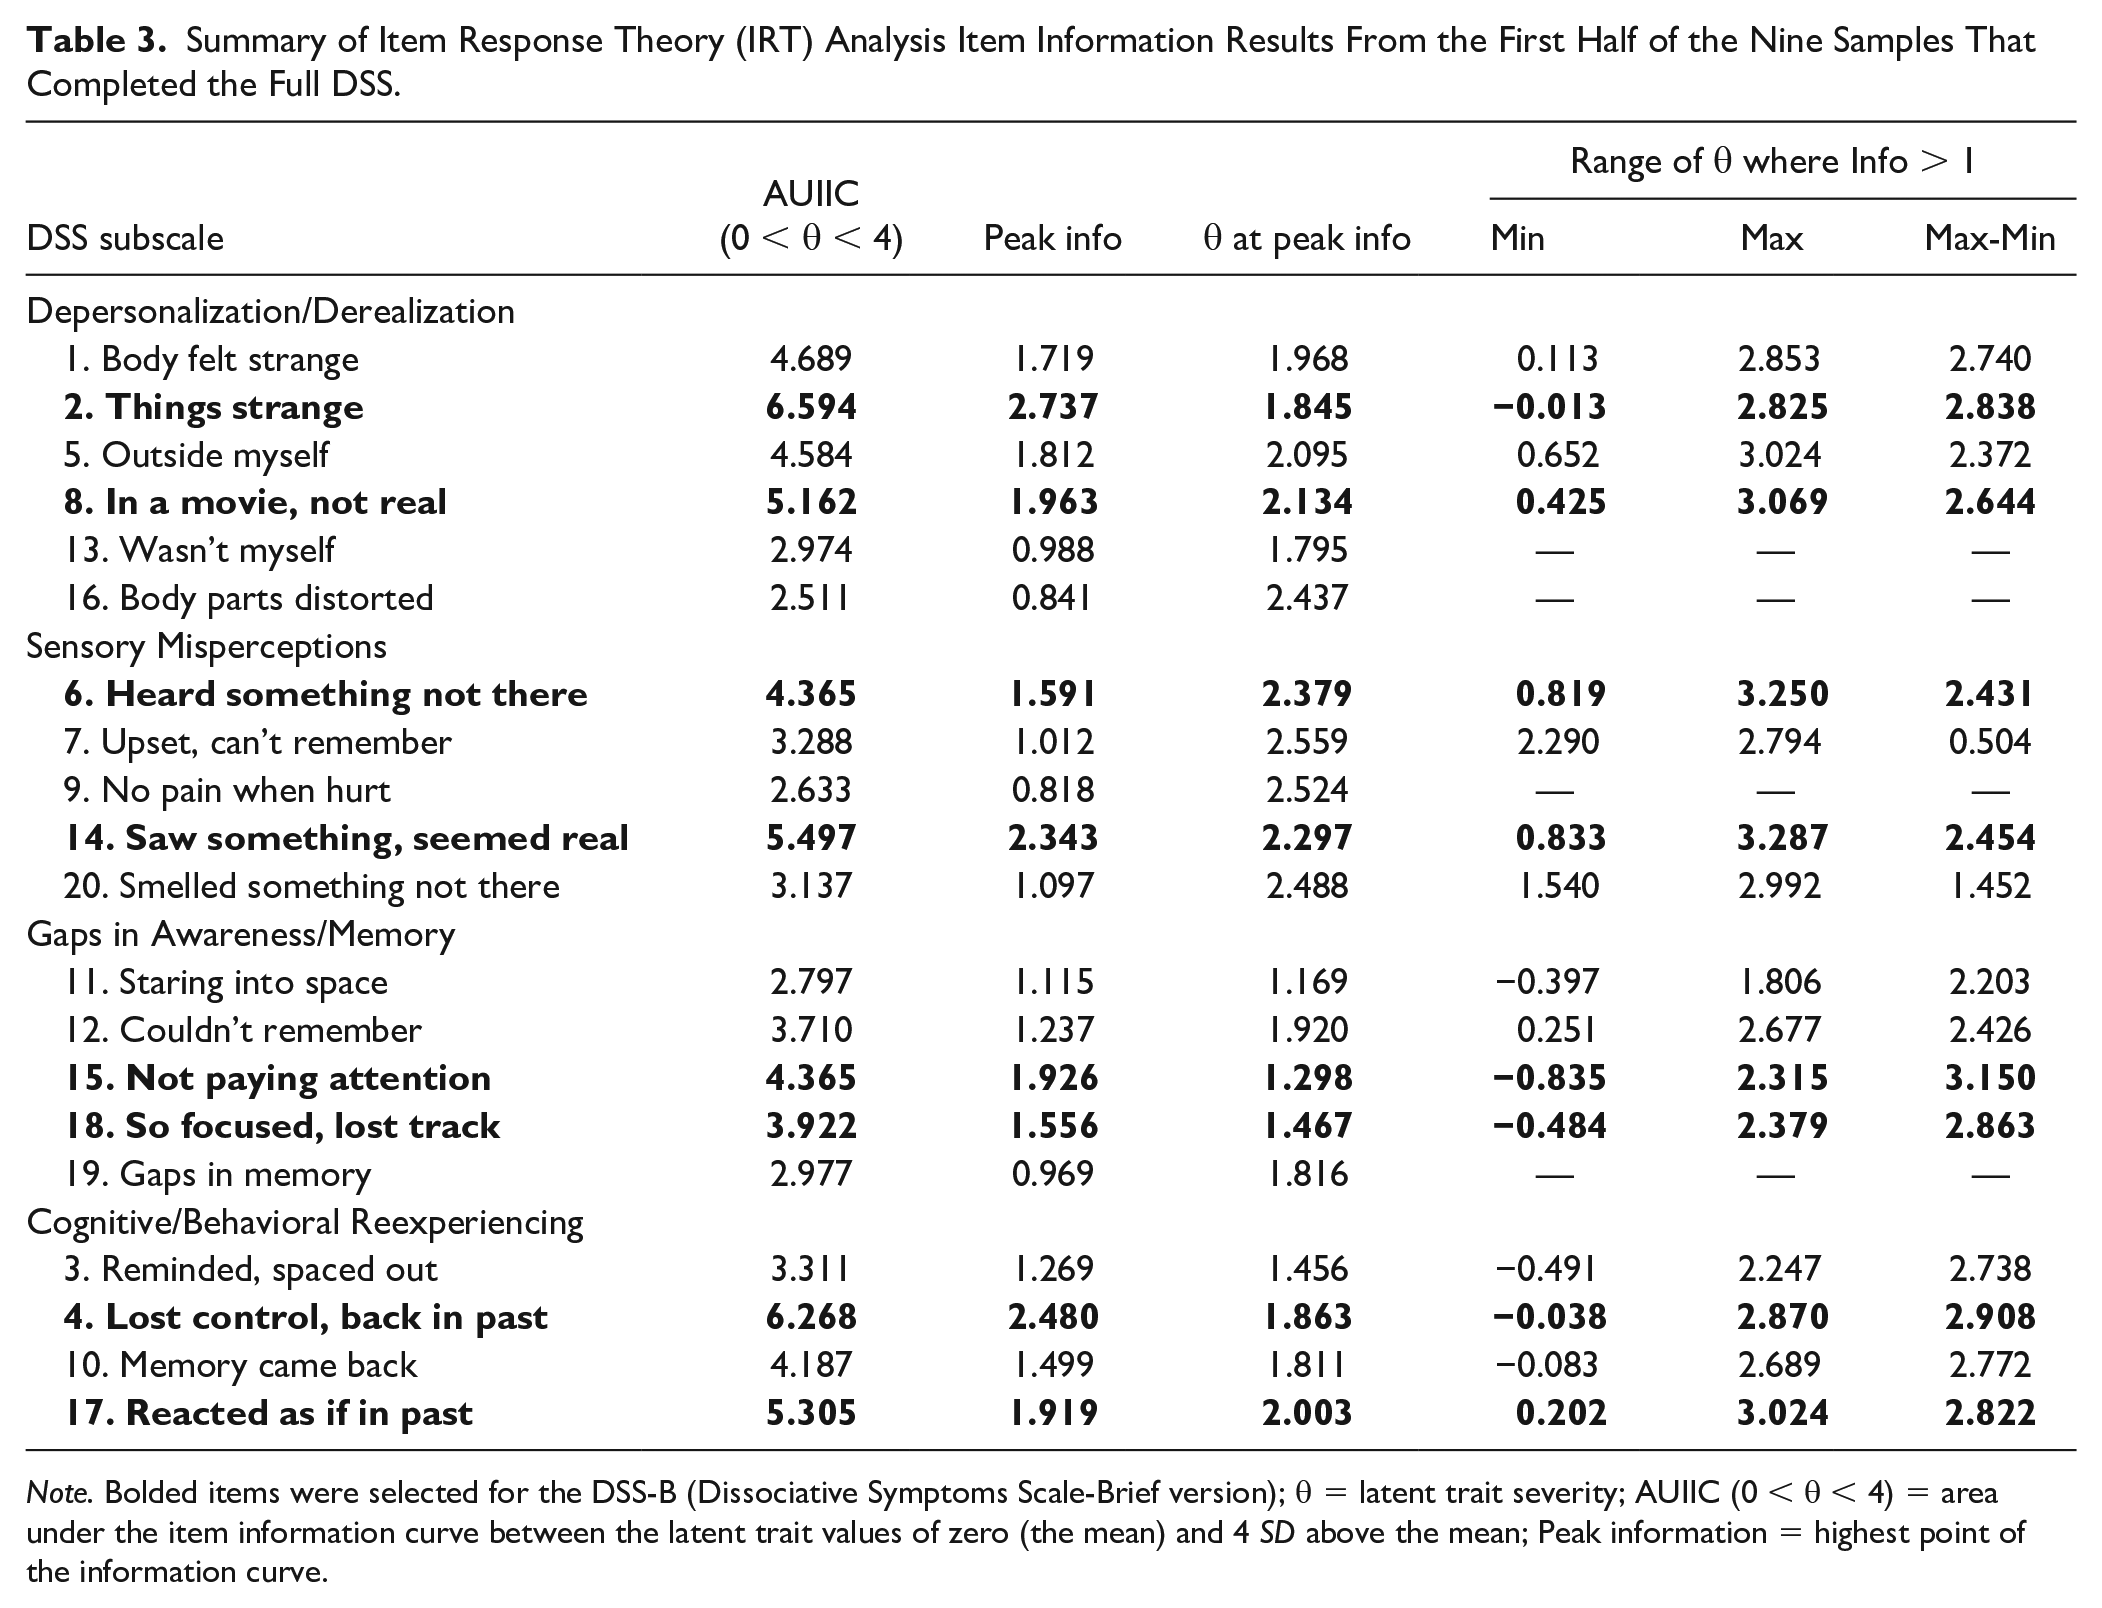
Note. Bolded items were selected for the DSS-B (Dissociative Symptoms Scale-Brief version); θ = latent trait severity; AUIIC (0 < θ < 4) = area under the item information curve between the latent trait values of zero (the mean) and 4 SD above the mean; Peak information = highest point of the information curve.
Factor Structure
Psychometric properties of the 8-item DSS-B were then examined using the second half of the nine samples that completed the full DSS (Validation sample; n = 1,701) and the 10th sample that completed the DSS-B (COTI DSS-B sample; n = 478). Confirmatory factor analysis (CFA) was used to examine whether the DSS-B preserved the factor structure and content domains of the DSS. A correlated four-factor CFA model was fitted to DSS-B items using the WLSMV estimator for ordinal indicators in Mplus version 8.4 (Muthén & Muthén, 2019). The factor structure was assessed by examining model fit and standardized estimates for factor loadings and correlations. Model fit was evaluated using the chi-square statistic, which provided a test of the null hypothesis of an exact fit between the specified model and the data. Approximate fit indices and item residual correlations were also used to evaluate model fit. Higher comparative fit index (CFI) values, and lower root mean square error of approximation (RMSEA) and standardized root mean square residual (SRMR) values were interpreted as better fit.
In the Validation sample, the chi-square test was significant, χ2 (14) = 56.485, p < .001, suggesting that the correlated four-factor CFA model deviated from exact fit to the data. However, in the COTI DSS-B sample, the chi-square test was not significant, χ2 (14) = 21.486, p = .090, suggesting the model adequately represented relationships among DSS-B items in the data. In both cases, approximate fit indices suggested excellent fit (Validation sample: RMSEA = 0.042, 90% CI = [0.031, 0.054]; CFI = 0.994; SRMR = 0.016; COTI DSS-B sample: RMSEA = 0.033, 90% CI = [0.000, 0.060]; CFI = 0.998; SRMR = 0.014), and the absolute values of item residual correlations were all below 0.06. Thus, overall, model fit results suggested that the four-factor model adequately fit the structure of DSS-B item-level data. In the Validation and COTI DSS-B samples, respectively, average standardized loading estimates were .839 (range: .789 to .896) and .892 (range: .834 to .941), and average inter-factor correlations were .707 (range: .646 to .816) and .816 (range: .685 to .921). Path diagrams of the CFA model with standardized parameter estimates are in the Supplemental Materials (Figure S3).
Reliability Analyses
To assess composite reliability, categorical omega was estimated using the R package MBESS (Kelley & Pornprasertmanit, 2016), and coefficient alpha was estimated using the latent variable approach in Mplus (Raykov & Marcoulides, 2015). CIs were obtained using 5000 bootstrap samples. According to categorical omega, internal consistency of DSS-B scores was strong (Validation sample:
Validity Analyses
Descriptive statistics for DSS-B total scores are provided in Table 1 for each of the nine samples that completed the full DSS and in Table 2 for the COTI DSS-B sample. In the Validation sample (second half of the nine samples that completed the full DSS), DSS-B scores for individuals in clinical (n = 269; 16%) and non-clinical (n = 1,432; 84%) samples and for individuals with (n = 262; 36%) and without (n = 460; 61%) probable PTSD were compared using Welch’s independent samples t-tests. As expected, DSS-B total scores were higher in clinical samples compared to non-clinical samples, t(314.41) = 8.910, p < .001, d = 0.432, 95% CI = (0.336, 0.528), and higher among individuals with probable PTSD relative to those without probable PTSD, t(349.67) = 11.577, p < .001, d = 0.862, 95% CI = (0.709, 1.014). DSS-B scores were also compared for individuals with (n = 156; 33%) and without (n = 322; 67%) probable PTSD in the COTI DSS-B sample. Similar to the Validation sample, DSS-B total scores in the COTI DSS-B sample were higher among individuals with probable PTSD relative to those without probable PTSD, t(181.08) = 12.213, p < .001, d = 1.117, 95% CI = (0.924, 1.310). Item-level analyses indicated that in both samples, individuals with probable PTSD endorsed significantly higher levels of dissociation on all DSS-B items compared to those without probable PTSD (all ps < .001). Finally, in the COTI DSS-B sample, DSS-B scores were higher among individuals who were injured as a result of interpersonal or intentional violence (n = 116; 24%) compared to those who were injured due to a vehicle collision, fall, or other accident (n = 362; 76%), t(154.84) = 4.140, p < .001, d = 0.379, 95% CI = (0.198, 0.559).
Convergent and discriminant validity of DSS-B scores were evaluated by calculating Spearman correlations for the relationships of DSS-B and DSS scores with scores for other measures of the same, similar, and dissimilar constructs. CIs and Holm-adjusted p-values were obtained for correlations (Holm, 1979). Holm’s method was used because it is less conservative than the Bonferroni correction and more appropriate when conducting multiple tests of pre-planned hypotheses (Wright, 1992). Zou’s (2007) CI method for comparing two overlapping dependent correlations was used to compare the correlations of DSS-B and DSS scores with scores on other measures using the R package cocor (Diedenhofen & Musch, 2015). Correlations of DSS-B and DSS total scores with scores for other measures administered in the Validation samples are shown in Table 4, and correlations of DSS-B scores with scores for other measures administered in the COTI DSS-B sample are in Table 5. In Table 4, a weighted (by sample size) average correlation was calculated for each construct that was assessed with multiple measures (e.g., PTSD). Overall, DSS-B scores tended to be more strongly correlated with scores on measures of dissociation, PTSD, and depression than with scores on measures of perceived stress and trauma exposure, and there was essentially no correlation between scores on the DSS-B and measures of alcohol use. Correlations with other measures tended to be slightly lower when DSS-B scores were used instead of scores for the full DSS (see Table 4). However, Zou’s (2007) CI method indicated that most differences between correlations of DSS-B and DSS scores with other measures were not statistically significant (only 4 of 13 differences were significant; 31%). The maximum difference between DSS-B and DSS correlations (rdiff) was .07, indicating a very small effect size for the difference between correlations with other measures.
Correlations of DSS-B and DSS Scores With Other Measures in the Second Half of the Samples That Completed the Full DSS.
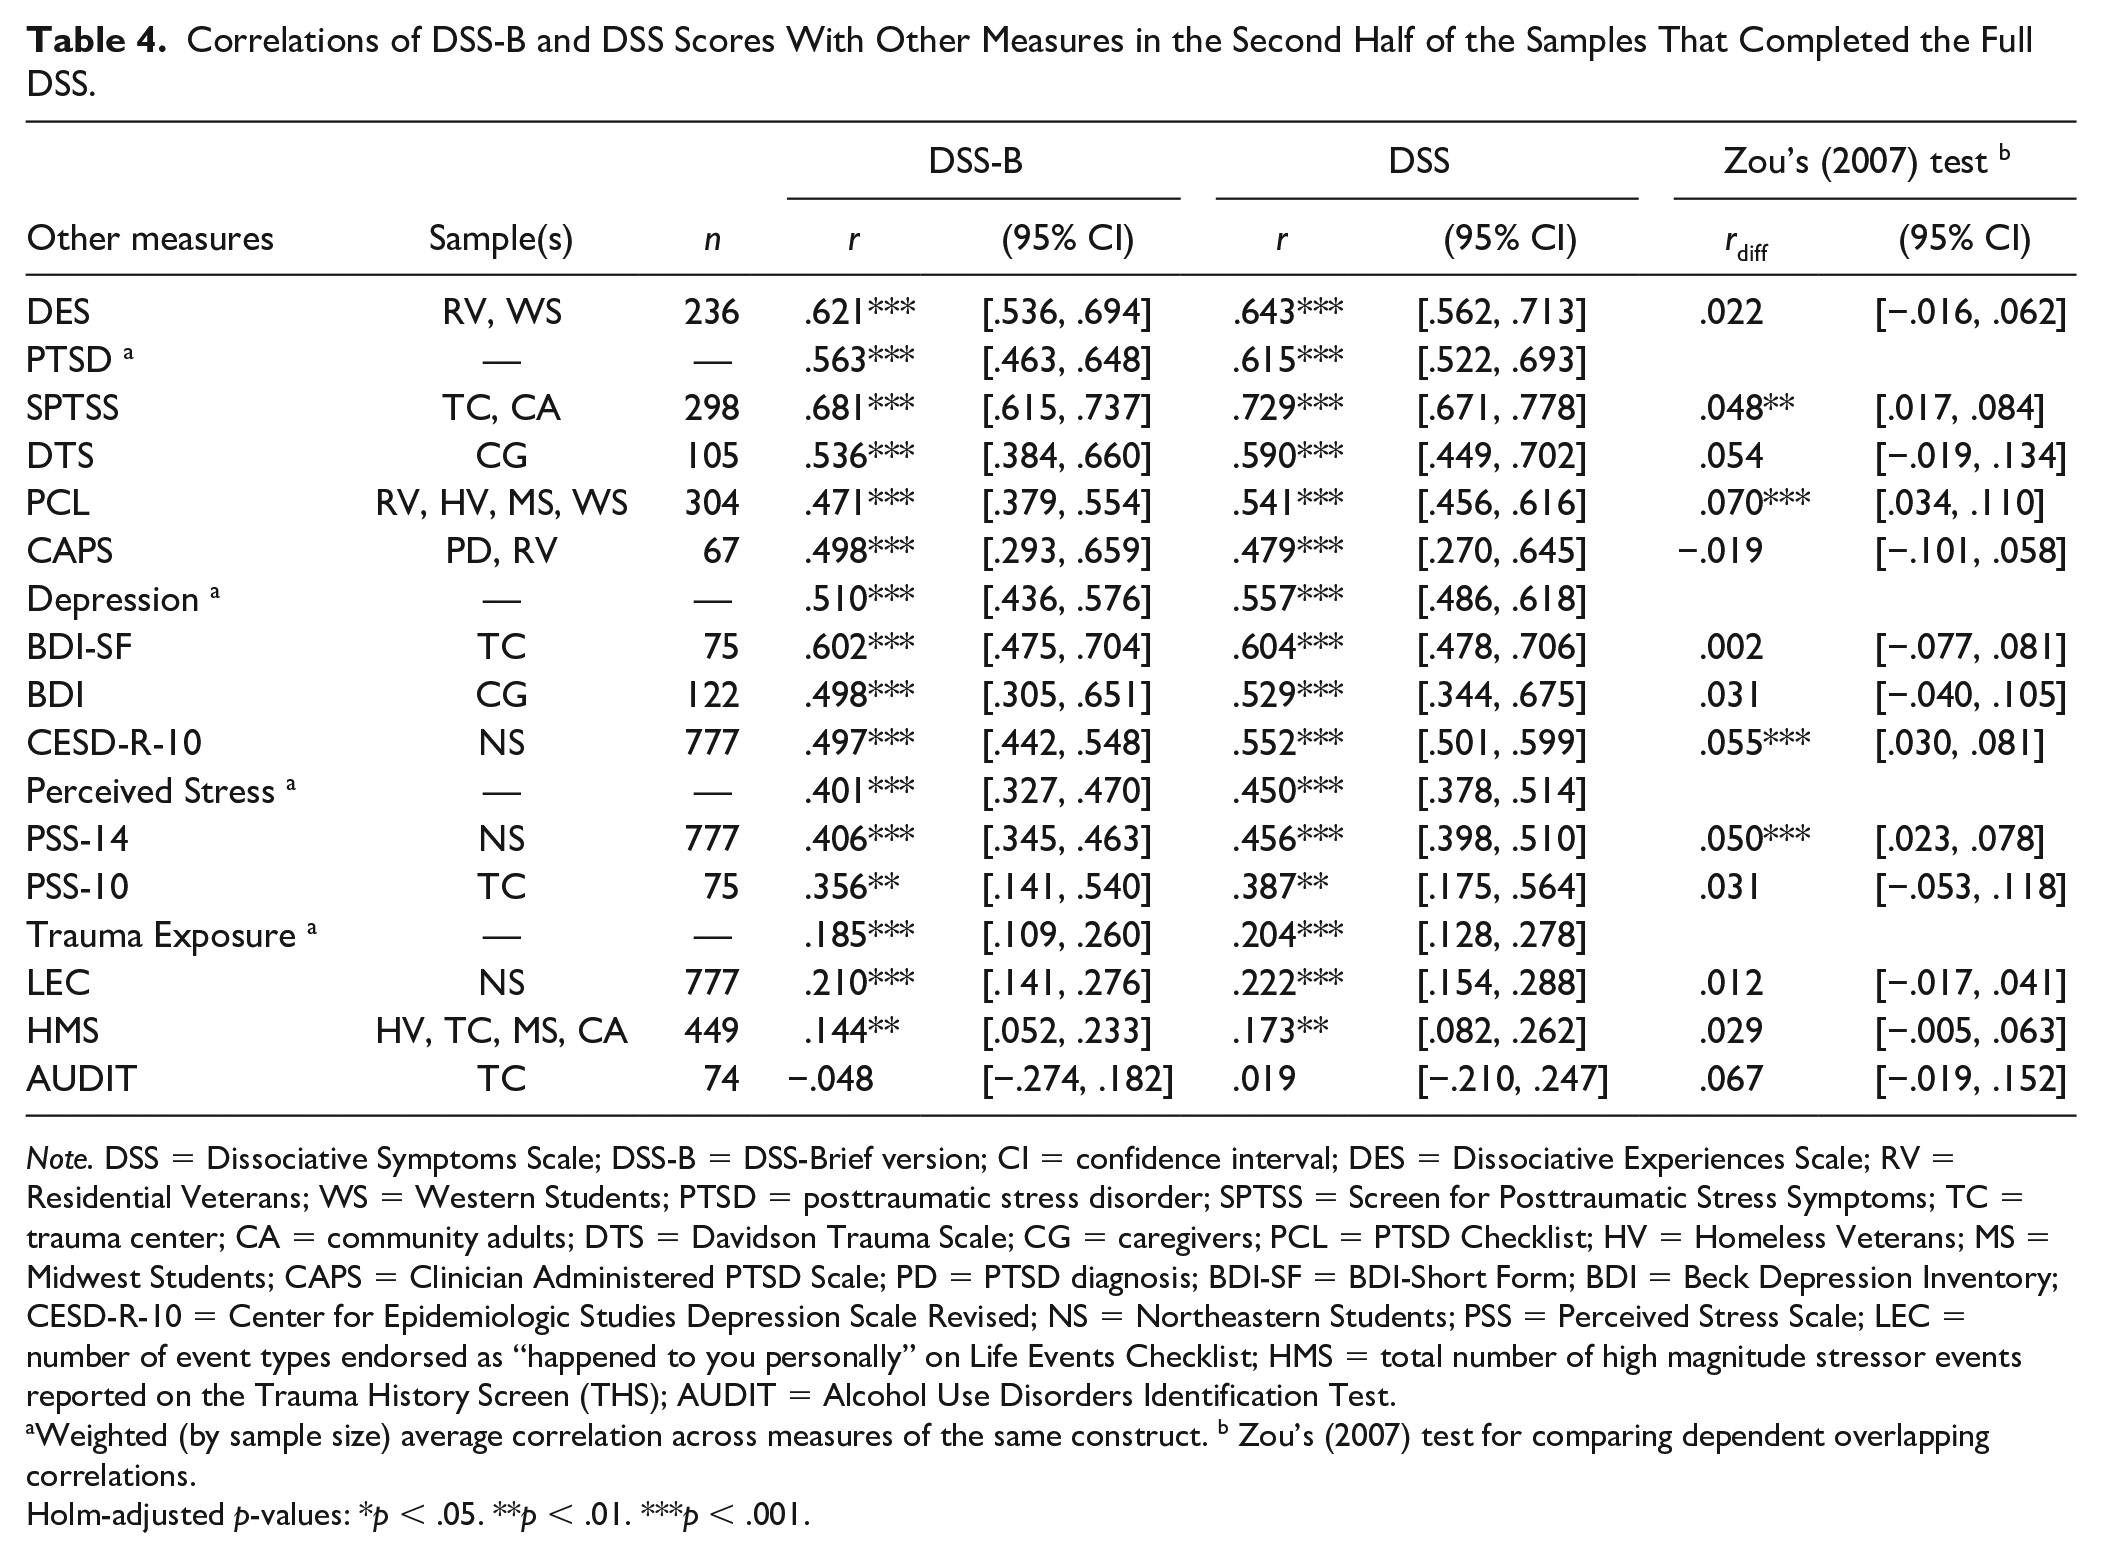
Note. DSS = Dissociative Symptoms Scale; DSS-B = DSS-Brief version; CI = confidence interval; DES = Dissociative Experiences Scale; RV = Residential Veterans; WS = Western Students; PTSD = posttraumatic stress disorder; SPTSS = Screen for Posttraumatic Stress Symptoms; TC = trauma center; CA = community adults; DTS = Davidson Trauma Scale; CG = caregivers; PCL = PTSD Checklist; HV = Homeless Veterans; MS = Midwest Students; CAPS = Clinician Administered PTSD Scale; PD = PTSD diagnosis; BDI-SF = BDI-Short Form; BDI = Beck Depression Inventory; CESD-R-10 = Center for Epidemiologic Studies Depression Scale Revised; NS = Northeastern Students; PSS = Perceived Stress Scale; LEC = number of event types endorsed as “happened to you personally” on Life Events Checklist; HMS = total number of high magnitude stressor events reported on the Trauma History Screen (THS); AUDIT = Alcohol Use Disorders Identification Test.
Weighted (by sample size) average correlation across measures of the same construct. b Zou’s (2007) test for comparing dependent overlapping correlations.
Holm-adjusted p-values: *p < .05. **p < .01. ***p < .001.
Correlations of DSS-B Scores With Other Measures in the COTI DSS-B Sample.
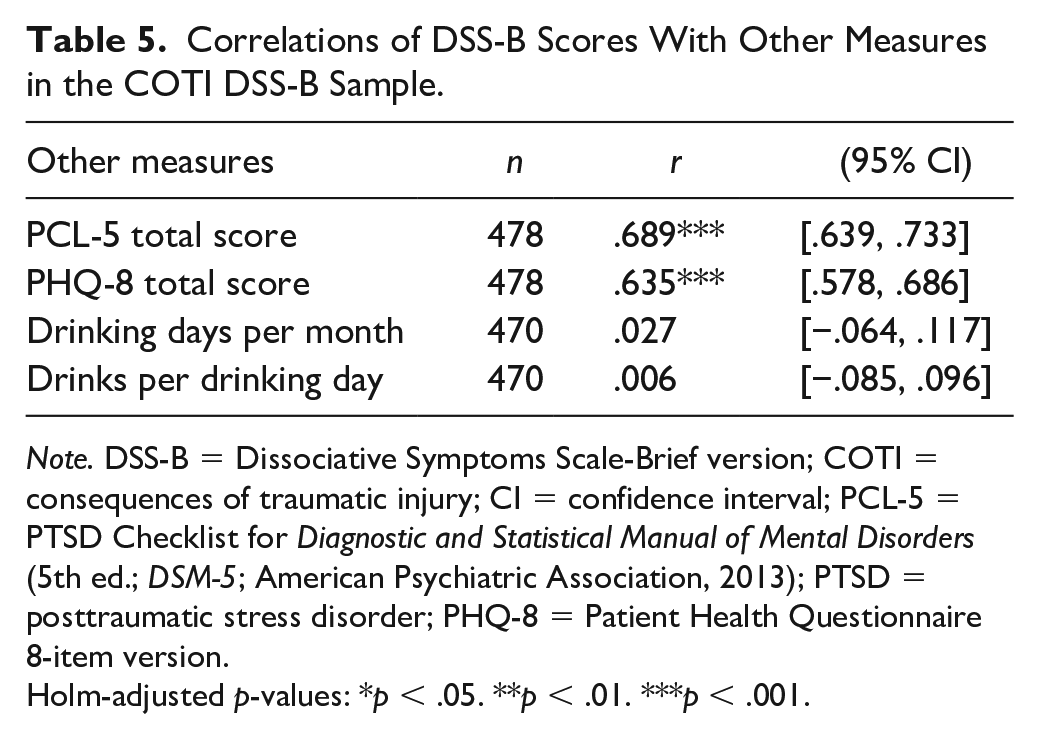
Note. DSS-B = Dissociative Symptoms Scale-Brief version; COTI = consequences of traumatic injury; CI = confidence interval; PCL-5 = PTSD Checklist for Diagnostic and Statistical Manual of Mental Disorders (5th ed.; DSM-5; American Psychiatric Association, 2013); PTSD = posttraumatic stress disorder; PHQ-8 = Patient Health Questionnaire 8-item version.
Holm-adjusted p-values: *p < .05. **p < .01. ***p < .001.
Measurement Invariance
Measurement invariance was examined across four ethnoracial groups, including White/European American (n = 933), Black/African American (n = 625), Hispanic/Latinx American (n = 794), and Asian American (n = 786). These data were drawn from the total combined data set of the nine samples that completed the full DSS to maximize group sizes. Individuals in the combined data set were excluded from the analysis if they were missing race/ethnicity data, identified a group other than the groups listed above, or reported multiple identities (n = 263; 8%). Due to low endorsement of higher response options (0% to 17%), DSS-B items were dichotomized as 0 = “not at all” and 1 = all other responses. Measurement invariance analyses were conducted using the chi-square DIFF TEST procedure in Mplus.
The baseline model of configural invariance fit the data well, χ2 (56) = 60.96, p = .302; RMSEA = 0.011, 95% CI = [0.000, 0.025]; CFI = 0.999; SRMR = 0.025. Constraining factor loadings to be equal (while allowing group-specific factor variances) did not significantly worsen model fit, χ2diff (12) = 14.70, p = .258, which supported metric invariance across all four groups. However, when item thresholds were also constrained to be equal across groups (while allowing group-specific factor means), model fit significantly worsened, χ2diff (12) = 43.04, p < .001. An investigation into the source of scalar non-invariance revealed two threshold equality constraints that were problematic. Freely estimating the threshold for DSS item 17 (DSS-B item 7) in the Asian American group and DSS item 18 (DSS-B item 8) in the White/European American group (while retaining all other threshold equality constraints) produced a model that did not fit significantly worse than the metric invariance model, χ2diff (10) = 16.45, p = .088, supporting partial scalar invariance for White/European American and Asian American individuals.
Given that none of the equality constraints between the Black/African American and Hispanic/Latinx American groups were found to be problematic, we then tested strict factorial invariance between these groups specifically. A baseline model of scalar invariance for the two groups fit the data well, χ2 (36) = 41.53, p = .242; RMSEA = 0.015, 95% CI = [0.000, 0.032]; CFI = 0.999; SRMR = 0.032, supporting the presence of full scalar invariance. Model fit did not worsen if item residual variances were constrained equal across groups rather than freely estimated, χ2diff (8) = 9.17, p = .328, supporting the presence of strict factorial (measurement) invariance between the Black/African American and Hispanic/Latinx American groups.
We also conducted analyses to assess invariance of results (e.g., factor structure, internal consistency, convergent and discriminant validity) across administration methods (e.g., in person vs. phone). A description of these analyses and results are in the Supplemental Materials.
Discussion
The purpose of this study was to develop a brief measure of multiple domains of clinically relevant dissociation symptoms that provides reliable and valid scores in clinical and community samples. The DSS-B items were selected by identifying the two items from each DSS subscale that were most precise in measuring above average levels of the latent trait of dissociation among individuals from a variety of clinical and non-clinical samples. The finding that items selected for the DSS-B also had the highest peak information values within each subscale, and these peak information values were between 1.30 and 2.38 SD above the mean of the latent trait, provided further evidence that these items were most precise in measuring above average severities of dissociation within the samples studied. In addition, the selected items had at least an adequate level of precision in measuring a large range of clinically relevant levels of dissociation, as indicated by item information being greater than 1.0 for ranges of severity on the latent trait that spanned 2.43 SDs or more, which included minimums near the mean (-0.84 to 0.83) and maximums that were 2 to 3 SDs above the mean (2.32 to 3.29) on the latent trait.
Psychometric analyses conducted using separate samples of respondents, including an independent sample in which only DSS-B items were administered, revealed that the factor structure and content domains (subscales) of the DSS-B were adequately preserved and invariant across modes of administration (e.g., in person vs. phone), and that DSS-B scores reliably and validly assessed clinically significant dissociation in the clinical and community samples studied. The CFA fit results indicated that the four-factor structure of the DSS (Carlson et al., 2018) adequately represented the relationships among DSS-B items, especially when only DSS-B items were administered rather than the full DSS. The CFA model estimates for standardized loadings and inter-factor correlations suggest that DSS-B items measure four highly related content domains. It should be noted that although we aimed to create a brief version of the DSS that preserved coverage of all four content domains of the full scale, the DSS-B is only intended to provide a total score for dissociation. When the goal is to assess the individual content domains (subscales), the full DSS should be used instead.
DSS-B scores were shown to have strong internal consistency, with higher estimates observed in the sample in which only DSS-B items were administered and when internal consistency was examined using categorical omega rather than coefficient alpha. Although coefficient alpha is the more commonly reported estimate of scale reliability, it assumes that scale items are continuously distributed, which may not be appropriate when items are measured with a limited number of ordered response categories (Green & Yang, 2009). Thus, categorical omega may provide a more accurate estimate of composite reliability for DSS-B scores than alpha. However, we also report alpha to facilitate comparison with past research. DSS-B scores were also found to be fairly stable over a 1-week period, as indicated by test–retest correlations of .57 and .66, which were consistent with expectations. The lower stability of DSS-B scores in the Trauma Center sample may be explained by the recency of trauma exposure, as more rapid changes in symptoms are likely to be experienced in the early aftermath of trauma. Furthermore, internal consistency and temporal stability of DSS-B scores were only slightly lower than the estimates for the full DSS (Carlson et al., 2018), suggesting good preservation of scale reliability.
The validity of DSS-B scores was supported by the findings that DSS-B scores were higher for participants in clinical samples than in non-clinical samples, higher in participants with probable PTSD than those without probable PTSD, and higher in participants injured by interpersonal or intentional violence as opposed to a vehicle collision, fall, or other accident. The validity of DSS-B scores was further demonstrated by correlations with other measures that were generally consistent with expectations, comparable to the correlations for the full DSS, and invariant across mode of administration. These results are consistent with the results of other studies of the relationships between dissociation, PTSD, and trauma exposure (Carlson et al., 2012) and between dissociation and alcohol use (Chana et al., 2021). The correlations with measures of depression were somewhat higher than expected; however, this finding may have been related to the samples in which depression was measured. For example, the correlations of DSS-B scores with measures of PTSD and depression in the Caregivers sample are consistent with results of previous research on women exposed to interpersonal trauma (Taft et al., 2009). In the Trauma Center and COTI DSS-B samples, the higher than expected correlations between dissociation and depression symptoms may have been due to the recency of trauma exposure, as there is considerable variability in symptoms and mood in the early aftermath of trauma (Carlson et al., 2016), which can produce stronger associations among variables. The fact that correlations with scores on measures of the same and similar constructs were slightly lower for DSS-B scores than for the full measure was expected given the impact that removing items has on reducing reliability and content coverage of a scale (Smith et al., 2000). Despite variation in the strength of correlations across measures of the same construct, all weighted average correlations were weaker than the correlation with another measure of dissociation, and the strongest weighted average correlation was for the most similar construct (PTSD), consistent with expectations.
Measurement invariance analyses provided strong support for DSS-B items measuring the same construct across Black/African American and Hispanic/Latinx American individuals. This suggests that differences in DSS-B scores across these groups could be meaningfully interpreted as true differences in dissociation as opposed to differences in how items were interpreted. In addition, results of the measurement invariance analyses supported the presence of partial scalar invariance across all four ethnoracial groups. Only two items were identified as scalar non-invariant: one item from the Gaps in Awareness and Memory scale, which was likely explained by White/European American individuals endorsing the symptom more frequently than other groups, and one item from the Cognitive-Behavioral Reexperiencing scale that was non-invariant for Asian American individuals but was not explained by group differences in endorsement. It is relevant to note that there were very few Asian American participants in clinical samples (n = 34; 4%), which may have contributed to difficulties establishing full measurement invariance. Moreover, the present findings for measurement invariance are based only on data collected from administering the full DSS, not the DSS-B, which may have impacted the results. Future studies should further examine the measurement invariance of the DSS-B across racial/ethnic groups, particularly in samples in which the DSS-B was administered. Nonetheless, these initial results are promising in that they suggest that DSS-B scores may largely be interpreted as measuring the same construct across ethnoracial groups in the U.S.
There are many benefits to developing a brief measure that assesses multiple domains of clinically relevant dissociation symptoms. Brief measures are less time-consuming and can be administered in a variety of settings to efficiently assess and monitor dissociation with a reduced burden on patients, providers, and researchers. In addition, the development of the DSS-B is timely given the addition of the dissociative subtype to the PTSD diagnostic criteria (APA, 2013), which has increased interest in assessing dissociation among individuals with PTSD. One potential use of the DSS-B is to screen for dissociation, which may be important in clinical contexts given that individuals with PTSD who also experience dissociation may require specialized clinical treatment (Cloitre et al., 2012). In addition, use of the DSS-B may be desirable in medical settings where assessments need to be conducted quickly and efficiently. A brief measure is also beneficial for assessing symptoms over time. The DSS-B may facilitate collection of longitudinal or intensive data on dissociation symptoms, which could be important given that such symptoms have been found to vary across time (Carlson et al., 2016) and predict improvements in PTSD during treatment (Kleindienst et al., 2016). Finally, development of a brief measure of dissociation is important because dissociation is often measured in conjunction with other symptoms, and using brief measures can enable assessment of a greater number of constructs or help to improve study response rates, representativeness of samples, and generalizability of results while minimizing burden on participants. Thus, the availability of the DSS-B may facilitate the measurement of dissociation, which could increase knowledge about multiple domains of dissociation in the context of PTSD and other disorders.
Strengths of this study include the large number of individuals studied and the diversity of samples. For example, nearly three quarters of participants did not identify as White/European American. Several limitations of this research should be noted. Almost half of the data used in this study were used to develop the full DSS (Carlson et al., 2018). However, the present study used a different split of these data for the analyses and three new samples that had not been used to develop the full DSS (Caregivers, Northeast Students, and COTI DSS-B), including an independent sample in which only the DSS-B was administered. It should be noted that the DSS-B was only administered to participants in the COTI DSS-B sample. DSS-B scores for participants in all other samples were computed based on responses to the full DSS, and in these samples, it is possible that DSS items not included in the DSS-B affected responses to DSS-B items. Thus, results for the COTI DSS-B sample may be a more accurate representation of the structure, reliability, and validity of DSS-B scores than the results from the other samples. Moreover, because the measurement invariance analyses were not conducted with data from the COTI DSS-B sample, these findings should be interpreted with caution and verified by future studies in which the DSS-B is administered rather than the full measure. Another limitation was that some of the samples were convenience or clinical samples and information about diagnostic status other than PTSD was not available. These characteristics of the samples may have impacted the findings and generalizability of results, and future studies should examine the psychometric properties of the DSS-B in other diagnostic groups that experience dissociation.
In sum, this study provides substantial support that DSS-B scores measure clinically relevant levels of dissociation and have strong psychometric properties in the populations studied. Analyses revealed that the reduction in items had minimal impact on coverage of the content domains and factor structure. The reliability and validity of DSS-B scores were comparable to scores on the full measure, and DSS-B items had a high level of measurement invariance across ethnoracial groups. Thus, the DSS-B could be an important tool for quickly and efficiently assessing a range of clinically relevant dissociative symptoms in a variety of contexts.
Supplemental Material
sj-pdf-1-asm-10.1177_10731911221133317 – Supplemental material for Development of a Brief Version of the Dissociative Symptoms Scale and the Reliability and Validity of DSS-B Scores in Diverse Clinical and Community Samples
Supplemental material, sj-pdf-1-asm-10.1177_10731911221133317 for Development of a Brief Version of the Dissociative Symptoms Scale and the Reliability and Validity of DSS-B Scores in Diverse Clinical and Community Samples by Kathryn S. Macia, Eve B. Carlson, Patrick A. Palmieri, Steven R. Smith, Deidre M. Anglin, Chandra Ghosh Ippen, Alicia F. Lieberman, Eunice C. Wong, Terry L. Schell and Lynn C. Waelde in Assessment
Footnotes
Appendix
Authors’ Note
Preparation of this article was supported with resources of the Department of Veterans Affairs’ Office of Academic Affiliations Advanced Fellowship Program in Mental Illness Research and Treatment, the Department of Veterans Affairs’ National Center for PTSD, and the Veterans Affairs Palo Alto Health Care System. The views expressed in this article are those of the authors and do not necessarily represent the views of the Department of Veterans Affairs or the United States Government. This article is not subject to US copyright law and is in the public domain.
Declaration of Conflicting Interests
The author(s) declared no potential conflicts of interest with respect to the research, authorship, and/or publication of this article.
Funding
The author(s) disclosed receipt of the following financial support for the research, authorship, and/or publication of this article: A portion of this research was supported by grant funding from the National Institute on Minority Health and Health Disparities (NIMHD) under Award Number: R01 MD010372.
Supplemental Material
Supplemental material for this article is available online.