
Abstract
Objective:
This article investigates the accuracy of individual and combined indicators based on different strategies for detecting noncredible performance as part of a new test for the continuous assessment of short-term memory.
Method:
In two independent studies, we assessed three groups of simulators, cognitively impaired patients, and nonimpaired community members with four tasks separated by a distractor.
Results:
Pairwise comparisons between receiver operating characteristic (ROC) curves revealed significant differences between two clusters of indicators: mean recognition, inconsistent responses in recognition, and false positives (area under the ROC curves > .800) proved more accurate than delayed recall and false negatives (area under the ROC curves < .800) in discriminating simulators from patients. Likewise, both studies revealed that adding the false positives indicator based on cued recall to mean recognition incrementally improved classification accuracy (including sensitivity, positive predictive value, and negative predictive value ) compared with the recognition indicator alone.
Conclusions:
Our results support the association of two distinct indicators for the assessment of noncredible performance, of which one should be a forced-choice indicator.
Keywords
There is an ongoing need for the development of assessments that detect cognitive malingering in neuropsychological evaluations. Memory is one of the cognitive processes most targeted by litigants or offenders who fabricate or exaggerate their symptoms to obtain external benefits (van Oorsouw & Merckelbach, 2010). Researchers have evaluated suboptimal effort by varying the methodological characteristics or the paradigms (e.g., recall or recognition) used by memory tests (Bigler, 2014; Leighton et al., 2014). However, practitioners and researchers have raised concerns regarding the ability of such assessment to differentiate between malingering and memory impairment (Bigler, 2014; Larrabee, 2012). In current practice, administering multiple performance validity tests (PVTs) is necessary (Boone, 2009; Chafetz et al., 2015; Erdodi et al., 2014). The scope of the present paper is to evaluate the ability of individual and combined validity indicators to classify performances on memory tests by using different detection strategies. Additionally, since most studies are conducted in the United States or Western European countries, there is a gap in how culturally diverse participants perform on validity indicators, despite a growing interest in expanding the applicability of PVTs to culturally diverse populations (Howieson, 2019).
The current norms in neuropsychological practice require PVTs to provide specificity rates of 90% (Boone, 2007; Larrabee, 2012), often obtained at the cost of reduced sensitivities (Chafetz et al., 2015). Furthermore, robust validity indicators should prove resistant to the effects of genuine impairment, age, gender, language, and education (Lippa, 2017). Likewise, frequently cited studies have stressed the necessity to include at least two stand-alone PVTs (Boone, 2007; Larrabee, 2003; Victor et al., 2009) as indicators of noncredible performances.
Types of Validity Indicators
Of the numerous freestanding measures developed over the years, PVTs based on recognition memory have been classically considered best for the detection of noncredible performance (Bashem et al., 2014; Bigler, 2014; Inman & Berry, 2002; Strauss et al., 2002). Recent research on indicators derived from strategies other than recognition has shown that most failed to attain the classification rates of traditional forced-choice indices (Donders & Hayden, 2020; Messa et al., 2020), despite optimistic theoretical premises and robustness to genuine severe impairment. A recent meta-analysis on detection strategies confirmed such findings. Results highlighted forced-choice instruments as most effective in classifying noncredible performance in experimental and nonexperimental studies (Crişan et al., 2021). Still the applicability of standard PVTs is limited by the increased time and effort in administration, vulnerability to coaching, online information (Rüsseler et al., 2008; Strauss et al., 2002), or test failures due to cultural differences (Howieson, 2019). Hence, there is need for cross-culturally validated instruments that are not easily identified as validity indicators.
Nevertheless, judging an examinee’s performance as valid or invalid based only on cutoff scores may result in misclassifications (Bigler, 2014). An alternative to pass/fail evaluations is looking for inconsistent response patterns. Several indices of inconsistency across recognition trials of the Test of Memory Malingering have been developed based on feigners’ difficulty in keeping track of their error making (see Buddin et al., 2014; Gunner et al., 2012). The Albany Consistency Index (ACI) demonstrated incremental sensitivity compared with standard forced-choice scoring (Gunner et al., 2012; Schroeder et al., 2013). Similarly, by identifying a “learning pattern,” the Frequency of Invalid Forgetting Index showed robustness to genuine cognitive impairment (Buddin et al., 2014). Other detection strategies were investigated in the 1990s and 2000s but have since received less empirical attention. Such strategies include the following: the magnitude of error (feigners’ lack of attention to committed errors—Bender & Rogers, 2004; Rogers et al., 1993), process dissociation (differences between including and excluding information—Hilsabeck et al., 2001), and delayed recall (failure to recall previously memorized material after a latency period—Suhr & Gunstad, 2000). Delayed recall relies on the learning effect expected after multiple learning trials (Leighton et al., 2014); poor performance in recalling material repeated several times before would indicate the suppression of this effect and, consequently, noncredible performance. Since such strategies were developed and tested on North-American samples, our article reintroduces them alongside forced-choice testing to investigate their applicability to culturally diverse contexts.
Combinations of Indicators
Extensive investigation into PVT variability has shown that evaluating performance with indicators of heterogeneous types provides more rigorous testing for performance validity, increasing confidence in the accuracy of response classification (Boone, 2007; Erdodi, 2017; Larrabee, 2012; Schroeder et al., 2013).
The work of Erdodi et al. on multimodalities testing reflects the effectiveness of aggregating multiple indicators stemming from different PVTs into an effort index (Erdodi, 2017; Erdodi & Abeare, 2020; Erdodi et al., 2014). Such a composite indicator measured cognitive effort on various constructs and continuous performance testing by overcoming the pass/fail dichotomy in classification. Various other combinations have proven effective in nonexperimental (Larrabee, 2003; Meyers & Volbrecht, 2003; Victor et al., 2009) and experimental studies (Bashem et al., 2014; Hilsabeck et al., 2001; Hilsabeck & Gouvier, 2005), with indicators originating from different instruments or incorporated in the same battery.
The present study investigated the ability of individual and combined indicators to detect noncredible performance in the continuous assessment of short-term memory for approximately 20 to 30 minutes. We addressed the following objectives:
To compare the individual classification accuracies of each validity indicator (i.e., forced-choice, process dissociation, delayed recall, inconsistency, and the magnitude of error); we hypothesized that forced-choice indicators would be superior to other indicators in discriminating noncredible from impaired protocols;
To investigate which indicators other than recognition would contribute incrementally to the classification of simulated versus impaired performances.
Addressing the first objective might contribute to establishing cross-culturally valid indicators in a non-Western context. Answering the second research question might reveal indicators that contribute to more rigorous assessment procedures when added to forced-choice indices. We designed two experimental studies to test these objectives.
Study 1
Methods
Participants
We used a general sample of 190 participants whose self-reported race was Caucasian.
The experimental group consisted of 90 psychology undergraduates of a Romanian university (27 males and 63 females), randomized into three groups of simulators and one full-effort group. The present study analyzed the data from the combined simulator sample (N = 67). Data on individual simulation conditions are available as an online supplemental material. All participants volunteered to take part in the study and received course credits for their involvement.
The control group comprised 30 community volunteers (15 males and 15 females) recruited from the first author’s social networks and the 23 undergraduates from the experimental full-effort group. No participant reported any history of mental illness or cognitive dysfunction or any involvement in lawsuits.
Clinical participants were 70 neurological outpatients (38 males and 32 females). Patients were considered eligible for the study if their perceptual functions and reading–writing abilities were intact. Two female patients with a history of cerebrovascular accidents had to be excluded because of severe dysgraphia, leaving 23 patients in this group. All clinical participants received ongoing pharmacological and physical treatment at an outpatient clinic treating cognitive and motor impairment of various aetiologies. They were tested as part of a standard neuropsychological assessment, including the Romanian adaptation of the Mini-Mental State Examination (MMSE—Folstein et al., 1999). The minimum score for inclusion was 15. We chose this score since studies in large European samples of elderly adults with cognitive dysfunction revealed mean MMSE scores ranging between 15 and 18 when first diagnosed with dementia and related disorders (Pezzotti et al., 2008; Pradier et al., 2014). The descriptive characteristics of each clinical group are available as a online supplemental material.
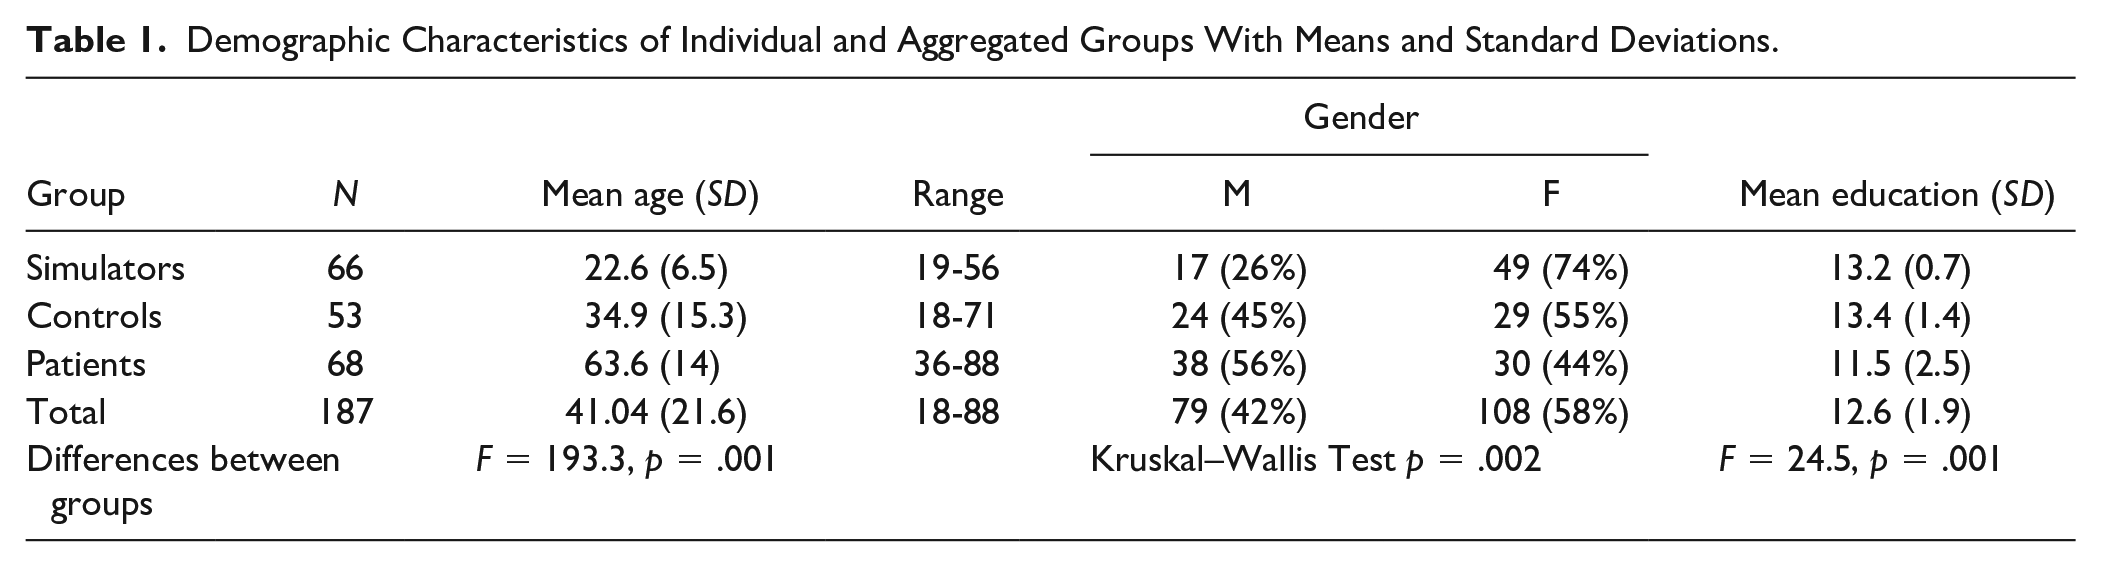
The three groups of experimental simulators, nonclinical controls, and clinical patients showed significant differences in age, gender, and education (see Table 1).
Demographic Characteristics of Individual and Aggregated Groups With Means and Standard Deviations.
Procedure
Experimental participants were recruited in the first academic semester, randomly distributed into groups, and instructed via email one week before testing. The assessment of all experimental groups took place simultaneously in four separate locations of a Romanian university. All simulators received a simulation scenario, adapted from previous studies (Rees et al., 1998; Rüsseler et al., 2008; see Table I of the online supplemental material). The participants assigned to the full-effort group were instructed to respond to assessment tasks the best and fastest way possible.
All experimental participants completed an informed consent form explaining the study and containing precise specifications about not disclosing experimental instructions. As an extra incentive, we told them that a monetary reward would be awarded to one participant from each group for the most credible simulated performance (i.e., closest to actual traumatic brain-injured patients) or best performance (for full-effort participants). After collecting the data, we randomly selected one participant from each group and rewarded them with the equivalent of $25.
Simulators were evaluated by licensed clinical psychologists with a Master’s degree, blind to the feigning conditions. After completing the test, all simulators were asked to cease feigning and given a posttest questionnaire containing manipulation checks and items referring to simulated performance and employed strategies. To check for compliance with experimental instructions, we asked simulators to describe the simulation scenario and specify the incentives they pursued (monetary, course credits, or both). One male participant had to be excluded from the study for lack of compliance with experimental instructions, leaving a total sample of 66 simulators.
Similar to the experimental sample, participants in the control condition had to fill in an informed consent form explaining the topic, purpose, benefits, and risks of the study and a brief questionnaire related to past or present cognitive impairment and mental dysfunctions. They were assessed by a licensed psychologist and were asked to put their best effort into their test performance. They were not monetarily rewarded.
Clinical patients were tested by a licensed clinical psychologist as part of their current evaluation of cognitive status only if they had prior given their consent to be tested for about half an hour. All patients were encouraged to perform their best. They were informed that their memory functions were being examined as part of a complex neuropsychological assessment, and they were debriefed about their test results at the end. Also, they were told that their test results would be used for further treatment planning in the clinic and would be included, in an anonymous form, in a scientific study on memory performance. At the time of the assessment, no patient expressed any interest regarding compensation or other forms of external benefits.
Assessment Measures
All participants were individually assessed with five memory tests, administered in the following order:
A 12-item recall task with two trials. Participants were asked to name and memorize 12 pictures of common objects: ear, pumpkin, broom, pencil, padlock, rose, rooster, fan, steering wheel, banana, microphone, and spoon. If the participant had difficulty identifying or naming an object, the evaluator would name it once and have the participant repeat the word. After being presented with all 12 objects, participants had to recall as many items as they could in any order. The procedure was then repeated for the second trial. A mean score for correctly recalled items across the two trials was computed as a validity indicator.
A 12-item forced-choice task with two trials. In both trials, participants had to choose the 12 previously memorized items from pairs (e.g., ear–eye, spoon–fork) presented as pictures and words. Indicators included the mean of the two trials and the sum of inconsistent responses across trials (i.e., different answers to the same item in pictorial vs. lexical form).
A process dissociation task (inspired by Hilsabeck et al., 2001), based on cued recall. Participants had to complete a list of 12 word-stems (first two letters) in two situations: first by recalling and including the 12 memorized items, then by excluding them (i.e., inserting different words). Indicators included the Total S score (the sum of correct inclusions and exclusions), false positives (intrusion errors), and false negatives.
The Benton Visual Retention Test (BVRT) set A. Ten drawings of geometric shapes were each shown for 10 seconds to participants who had to reproduce in drawing the memorized item. Two indexes were noted: the total correct score and the total error score. The BVRT was used as a distractor and timeframe for delaying the final recall of the original 12 stimuli. Individual scores were not considered for the analysis.
A delayed recall task. Participants were asked to verbally recall the 12 original items in any order as they remembered them. The total of correctly recalled items was taken as a validity indicator.
Measures for internal consistency were computed for each type of indicator: Cronbach’s α was .89 for immediate and delayed recall, .91 for recognition, and .89 for the process dissociation indicators.
Data analyses
Overall data were analyzed using SPSS for Windows. To examine differences between the three aggregated groups, we computed one-way analyses of covariance for six validity indicators while controlling for age, gender, and education (see online supplemental material). Next, receiver operating characteristic (ROC) curve analyses were used to identify the area under the ROC curve (AUC) values and the optimal cutoffs for individual indicators. We compared individual AUC values with determine which indicators were superior using Stata 2.2 for Windows. Next, hierarchical logistic regression analyses were conducted to check for an increment in prediction when including two indicators. Finally, the generated probabilities for each model were subjected to ROC curve analyses to obtain sensitivity and specificity values.
Results
Preliminary Data Analysis
Table 2 presents the means and standard deviations of test indicators and effect sizes for contrasts between the aggregated groups. The largest effect sizes between simulators and patients were observed for all forced-choice indicators and false positives. At the same time, these indicators generated negligible and small effects (e.g., false positives—d = 0.05; picture recognition—d = 0.2; Cohen, 1988) in contrasts between controls and patients, thus showing their resistance to genuine cognitive impairment. Note the performance at ceiling for both controls and patients on the recognition scores for pictures and words, despite the patients having two fewer years of education and being 30 years older.
Overall Results on Validity Indicators With Means and Standard Deviations.
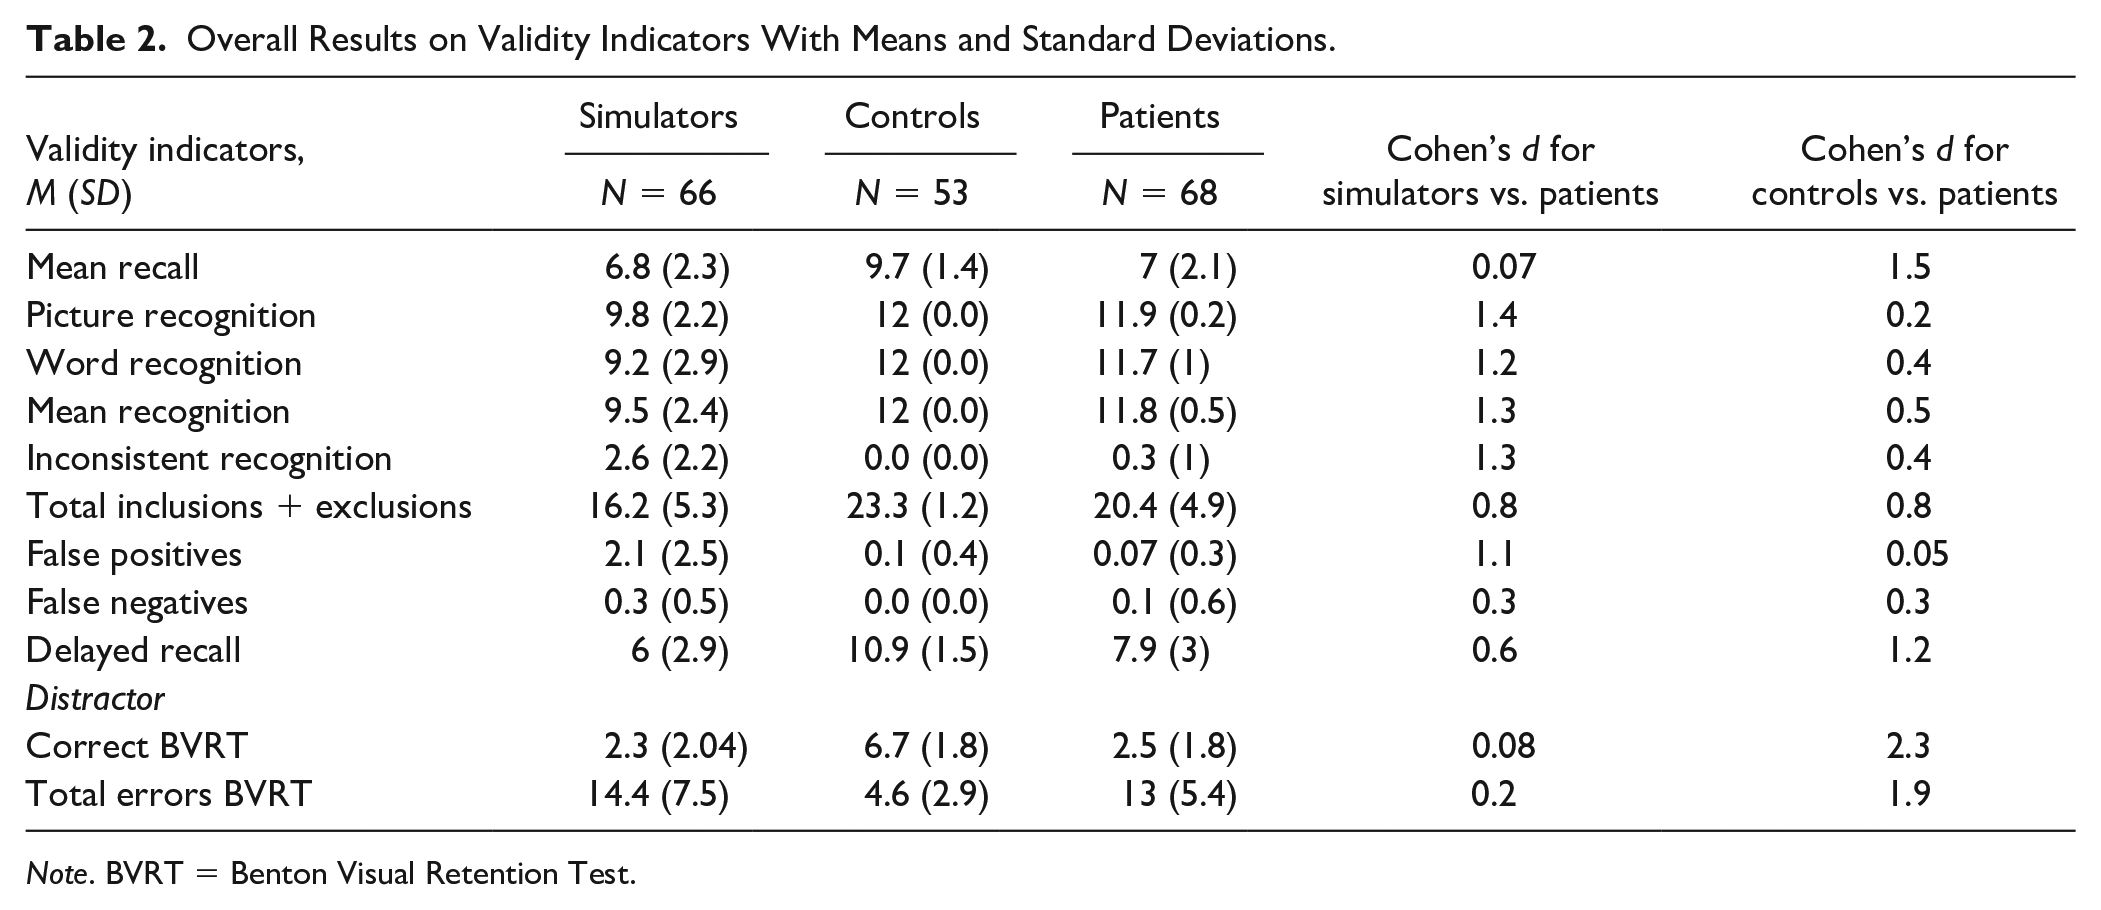
Note. BVRT = Benton Visual Retention Test.
Classification Accuracies of Single Indicators
Given the differences described above, we wanted to determine our indicators’ ability to discriminate between scores of simulators and patients. The indicators of mean recognition, process dissociation, delayed recall, inconsistency, false positives, and false negatives were subjected to ROC curve analysis. Effect sizes and classification parameters for indicators were calculated at ≥90% specificities, including the proportion of simulators and patients that failed the established cutoffs.
Three of the six indicators (i.e., mean recognition, inconsistent recognition, and false positives) demonstrated high AUC values, large effect sizes, and high positive predictive value (PPV) and negative predictive value (NPV) calculated at a base rate of 35% (the prevalence of simulators in our sample). False positives and mean recognition demonstrated sensitivities over 60% at cutoffs established at ≥90% specificities.
To determine which validity indicators were most accurate in detecting simulated cognitive impairment, we compared the AUC values of the six indicators and obtained a significant global difference, χ2(5) = 69.2, p = .00. Pairwise comparisons between individual indices revealed two distinct clusters of indicators: Cluster 1 consisted of the two forced-choice-based measures (mean recognition and inconsistency) and false positives that did not differ among each other in terms of AUC values (ps > .05). They had significantly higher AUC values (ps < .01) than Cluster 2 indicators (i.e., false negatives and delayed recall). The process dissociation indicator (correct inclusions plus exclusions) was situated in-between these clusters, having significantly higher AUC values than Cluster 2 indicators (ps < .05) and showing marginal differences from mean recognition in cluster 1 (p = .08).
Combined Classification of Two Indicators
As the indicators derived from the forced-choice paradigm (i.e., mean recognition and inconsistent recognition) and the false positives indicator showed high AUC values and stemmed from different tasks, we conducted hierarchical regression analyses to show whether false positives contributed incrementally to membership prediction beyond what was already predicted by the recognition indicators (see bottom rows of Table 3).
Classification Accuracies of Individual and Combined Indicators in the Simulator Versus Patient Contrast.
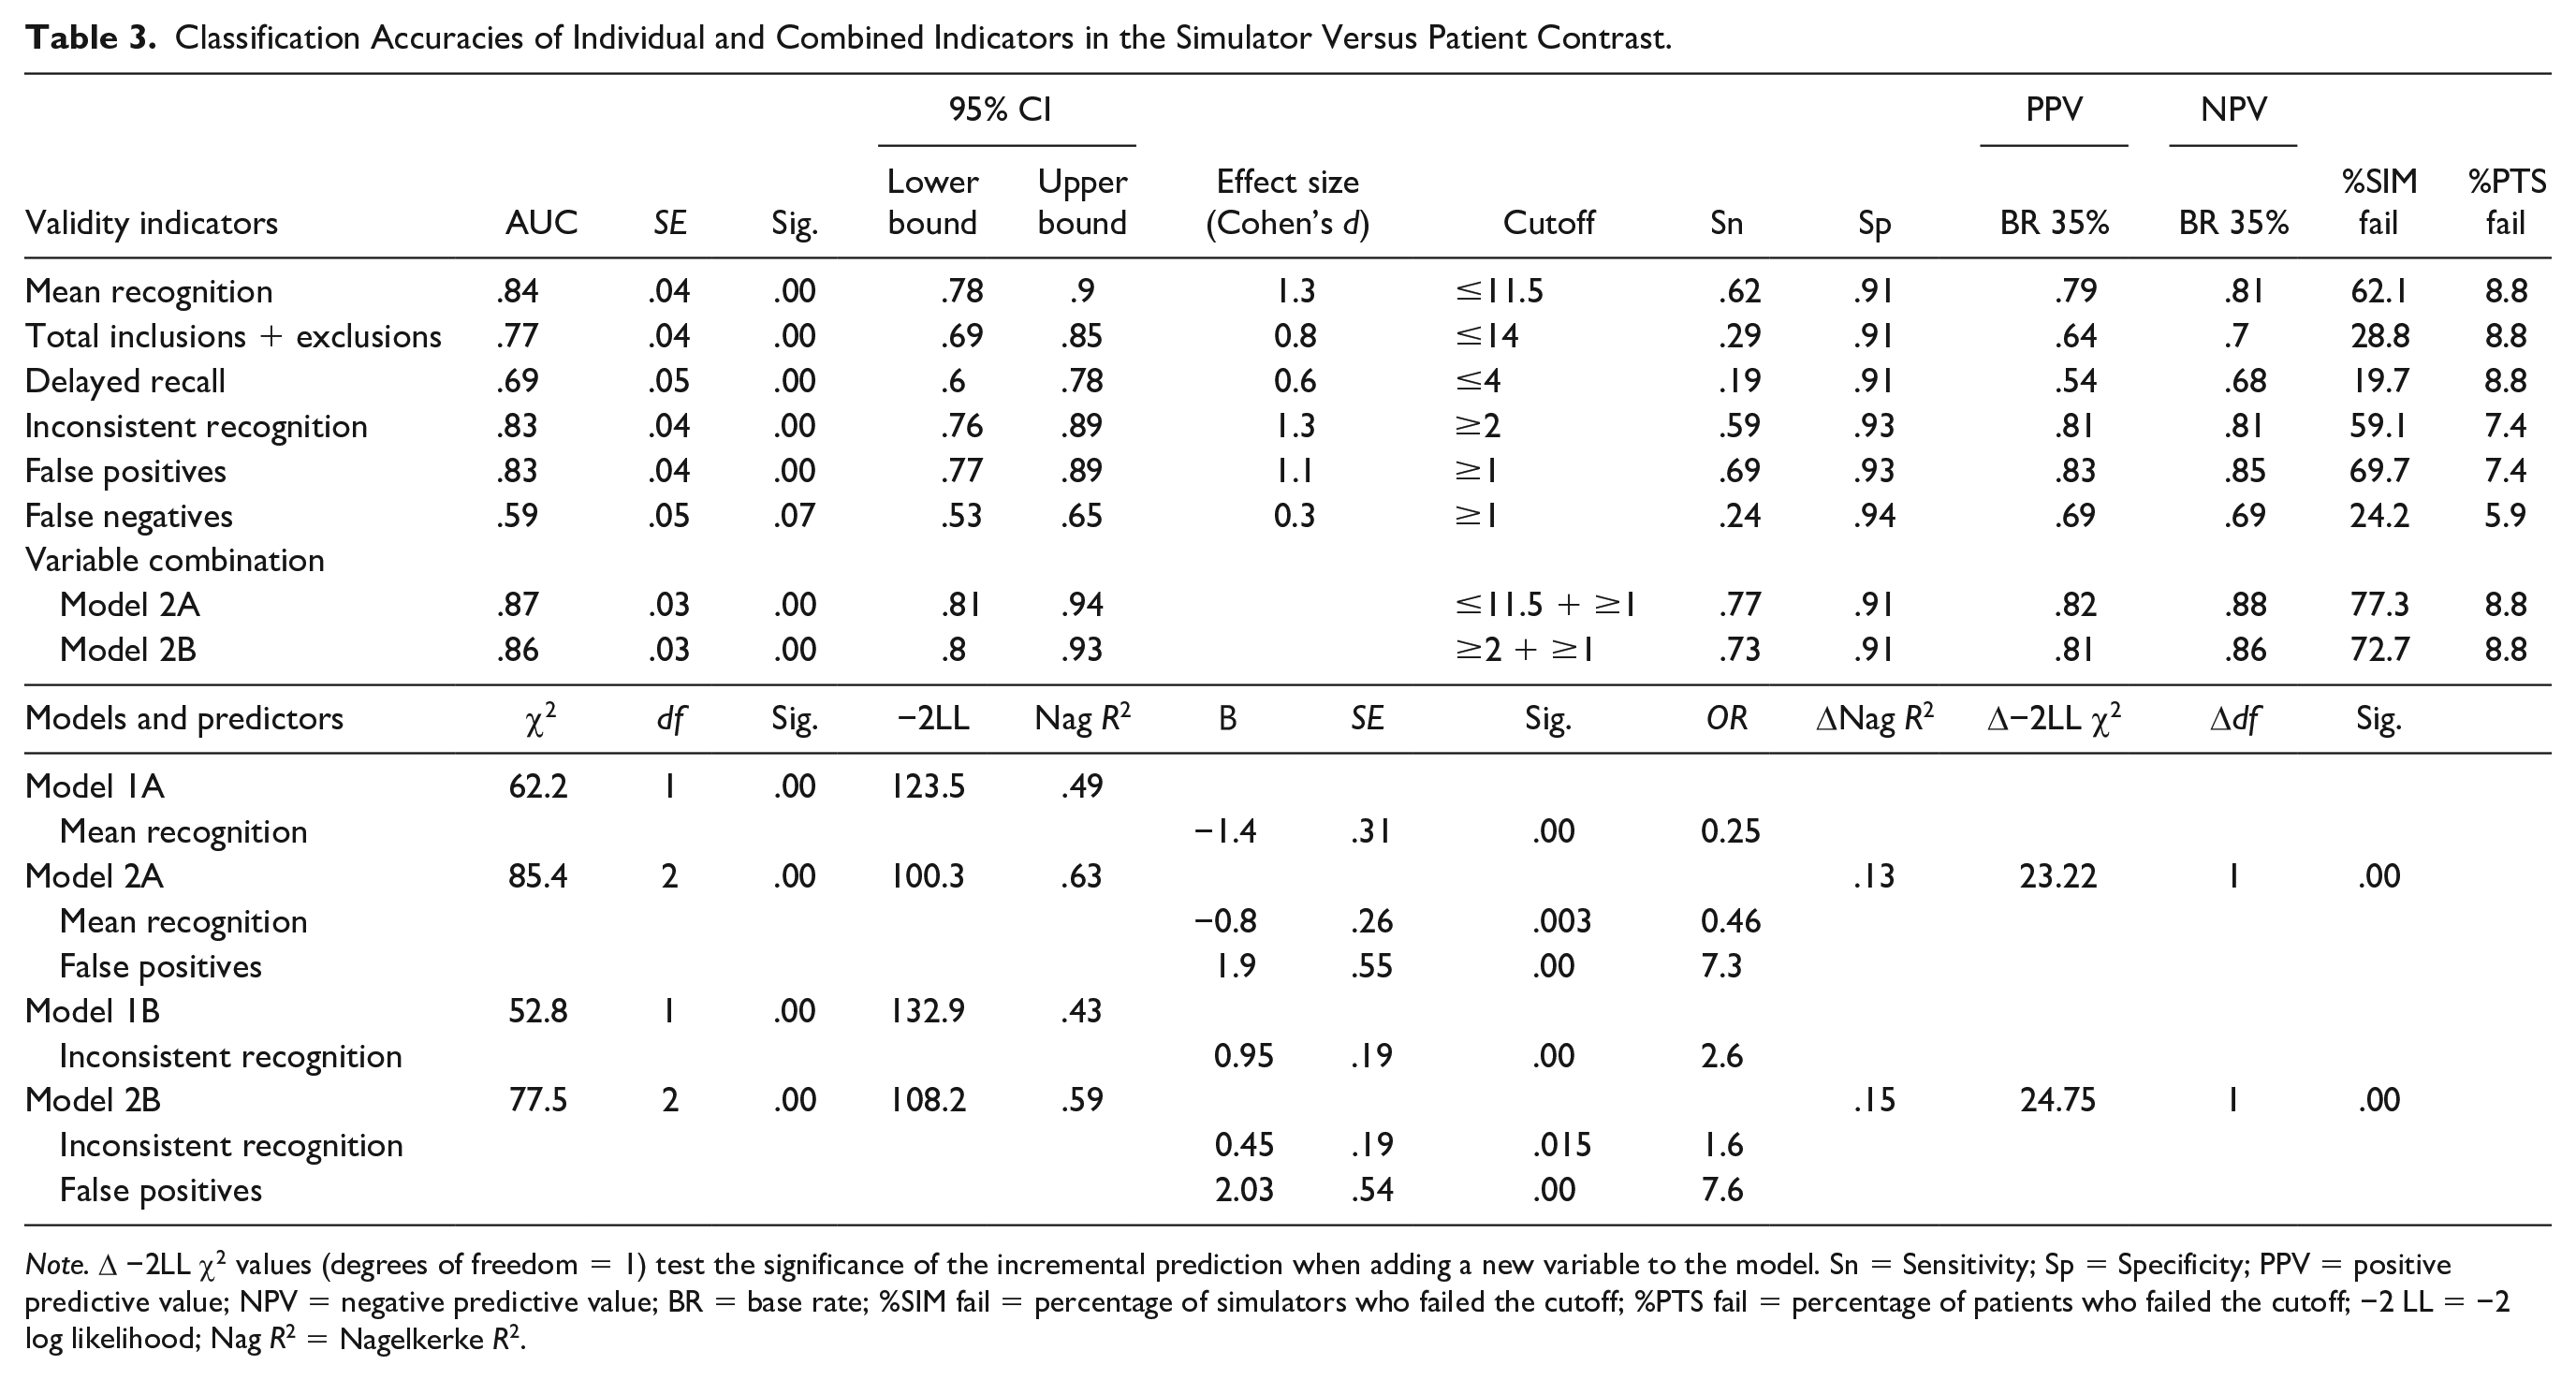
Note. Δ −2LL χ2 values (degrees of freedom = 1) test the significance of the incremental prediction when adding a new variable to the model. Sn = Sensitivity; Sp = Specificity; PPV = positive predictive value; NPV = negative predictive value; BR = base rate; %SIM fail = percentage of simulators who failed the cutoff; %PTS fail = percentage of patients who failed the cutoff; −2 LL = −2 log likelihood; Nag R2 = Nagelkerke R2.
In both tested models, adding false positives to either mean recognition or inconsistency contributed significantly to an increment in prediction (ps < .001) and increased sensitivity of discrimination compared with individual indicators (i.e., Chi-square = 43.2, p = .00 for mean recognition and false positives compared with mean recognition; Chi-square = 33.8, p = .00 for inconsistency and false positives compared with inconsistency alone). The false positives indicator explained up to 15% of the variance of the dependent variable. Among our participants, 4.5% of simulators and 2.9% of patients passed mean recognition but failed the false positive indicators; 10.6% of simulators and 8.8% of patients failed mean recognition but passed the other indicator.
Discussion
We found significant differences between performances of simulators, clinical patients, and controls on all indicators while controlling for demographic variables, which supports their resistance to age, gender, and education, therefore meeting the requirements for newly developed PVTs (Lippa, 2017). Our main findings highlighted three validity indicators that accurately discriminated between simulated and impaired performances. Two indicators were derived from forced-choice tasks (i.e., mean recognition and inconsistency). One indicator was based on cued recall and relied on the magnitude of error (i.e., false positives). False positives contributed incrementally to predicting group membership in the simulator versus patient contrast, alongside any recognition indicator. We designed a cross-validation study to verify our findings.
Study 2: Cross-validation
Methods
Participants
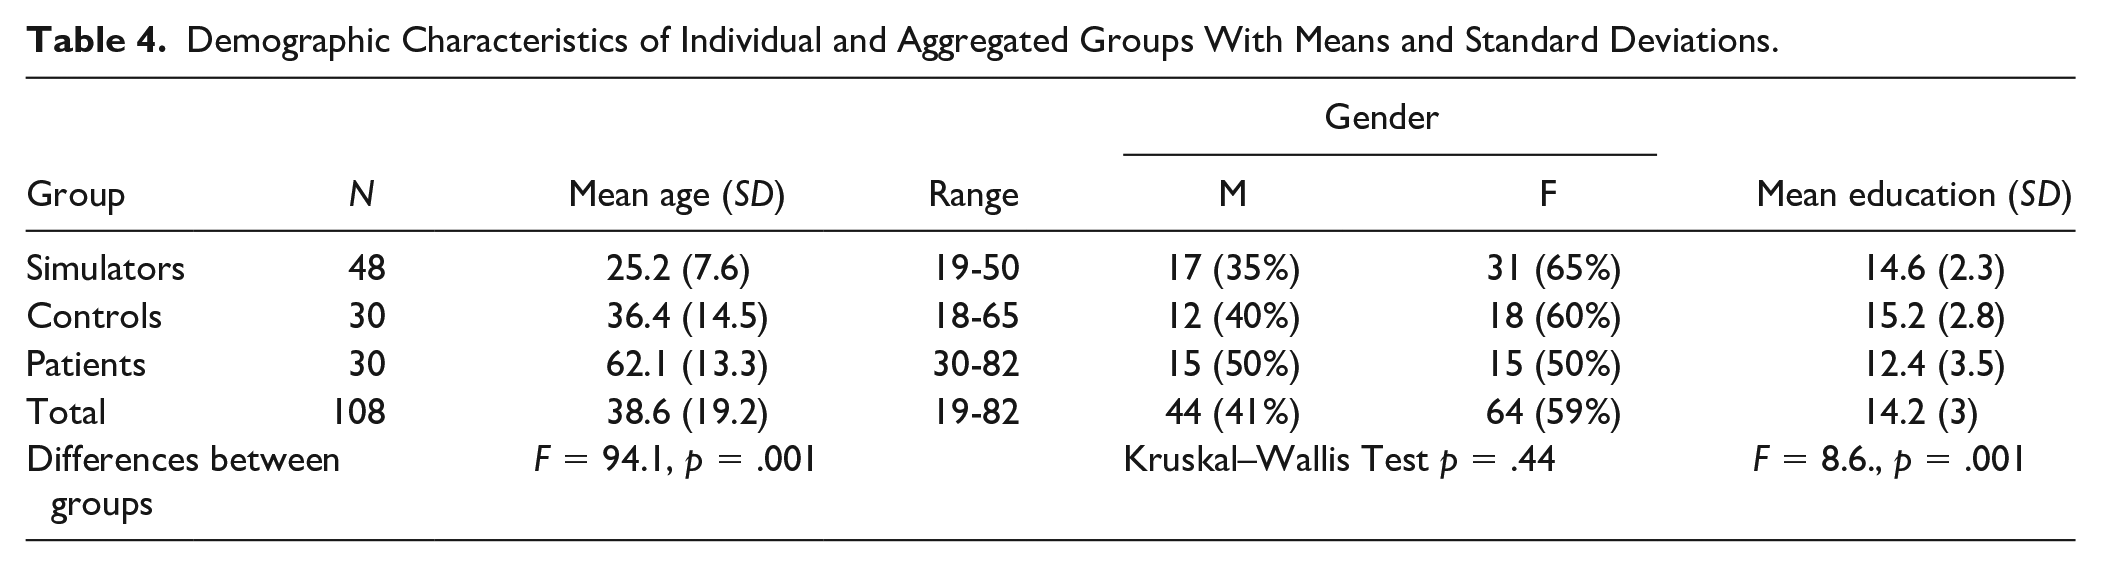
We used a general sample of 108 Caucasian participants for replication (see Table 4).
Demographic Characteristics of Individual and Aggregated Groups With Means and Standard Deviations.
The combined simulator sample included 48 psychology students (17 males and 31 females), randomly allocated to three coaching conditions (see online supplemental material).
Control participants were 10 undergraduates and 20 community volunteers (12 males and 18 females), with no reported history of mental conditions or cognitive impairment and no present involvement in any lawsuits.
The clinical comparison group consisted of 30 outpatients (15 males and 15 females) of heterogeneous diagnoses receiving treatment for cognitive impairment at a rehabilitation clinic. All patients had intact reading and writing abilities, and all were tested as part of standard neuropsychological assessment, which included the MMSE. The minimum score for inclusion was 15. The characteristics of the clinical sample are available as an online supplemental material.
The three groups showed differences in age and education, with simulators being younger and clinical patients having lower average years of education than the other groups.
Procedure
We employed the same protocol as in the first study, but due to the worldwide COVID-19 pandemic and the consequent restrictions imposed on social gatherings, we assessed all participants online, individually. Experimental participants were recruited in the second academic semester, randomly distributed into groups, and instructed one week before testing. They received the same scenario and instructions as in the first study. We allocated one day of testing for each experimental group assessed by a licensed clinical psychologist blind to the feigning conditions. All participants received course credits for their involvement, and we added the same extra incentive as in the first study to encourage credible feigning.
After completing the test, participants from the three feigning groups were given a posttest questionnaire, similar to the first study. All participants had complied with the instructions to simulate a head injury, so none were excluded from the study.
The first author assessed nonclinical controls and clinical patients with instructions to put their best effort into testing. They were not monetarily rewarded. No member of the control group declared having experienced any traumatic, cognitive, or mental problems, and none was taking any type of psychotropic medication at the time of the assessment. None of the controls or patients reported involvement in lawsuits or expressed interest regarding any type of external benefits (e.g., obtaining compensation or pension).
Assessment Measures
We used the same four tests as in the first study. Measures for internal consistency were again computed for each type of stand-alone indicator and found to match our first study: Cronbach’s α was .89 for the immediate and delayed recall tasks, .89 for recognition tasks, and .88 for the process dissociation indicators.
As a distractor, we chose two digit-recall and recognition tasks because they were more accessible to participants in an online assessment (i.e., two rows of digits needed to be heard, repeated, and orally recalled and recognized, not reproduced, as with the BVRT). Participants’ scores on these tasks were not included as validity indicators.
Results
Preliminary Analysis
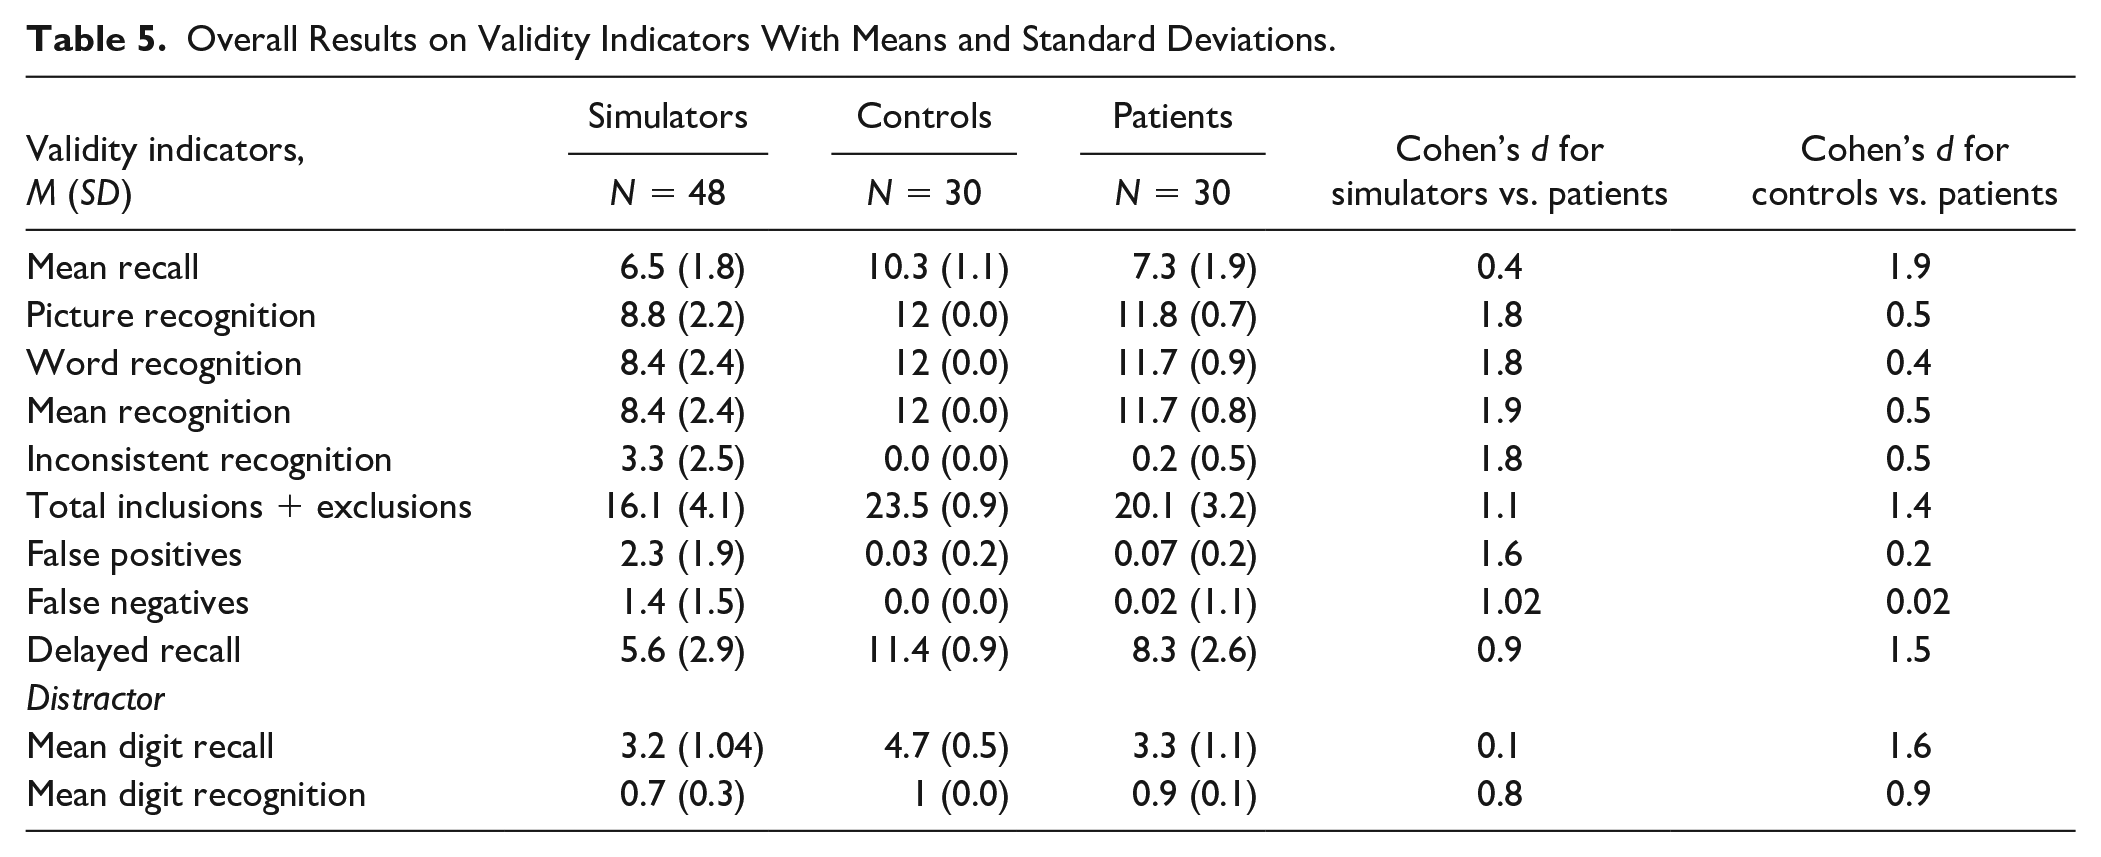
Table 5 displays the means and standard deviations of indicators and effect sizes for contrasts between aggregated groups. Similar to the first study, the recognition and false positives indicators yielded very high effects in simulators versus patients and moderate to very low effects in controls versus patients. One-way analyses of covariance computed for validity indicators while controlling for age, gender, and education showed significant differences between the three aggregated groups (see online supplemental material).
Overall Results on Validity Indicators With Means and Standard Deviations.
Classification Accuracies of Single Indicators
Like in the previous study, we performed ROC curve analysis for individual indicators to evaluate their accuracy in performance classification. Results are displayed below.
Using previously established cutoffs for our indicators generated overall higher sensitivities at specificities of ≥93%. Consistent with initial findings, mean recognition, inconsistent recognition, and false positives demonstrated the highest AUC values and effect sizes.
The process dissociation indicator, the delayed recall indicators, and false negatives produced AUC values and effects in the fair range. Using the same cutoffs demonstrated higher sensitivities than in the first study.
Like in the previous study, the global comparison of AUC values yielded a significant difference between indicators, χ2(5) = 15.8, p = .00. Pairwise comparisons allowed the differentiation of the same clusters as in the first study: Cluster 1 indicators (i.e., mean recognition, inconsistency, and false positives) showed significantly higher AUC values (ps < .05) than Cluster 2 indicators (i.e., delayed recall and false negatives), with no significant differences among indicators within clusters. Total S was again situated in-between these clusters, showing significant differences from mean recognition and inconsistency (ps < .05) and no significant differences from delayed recall, false negatives, and false positives (ps > .05)
Combined Classification of Indicators
Hierarchical regression models showed that adding false positives to mean recognition or inconsistency contributed marginally to an increment in prediction and discrimination ability (Δ −2LL χ2) compared with individual indicators (see bottom rows of Table 6). ROC analyses demonstrated a small increment in sensitivity, PPV, and NPV for recognition with false positives, compared with mean recognition alone (Chi-square = 1.9, p = .16). Hence, the results of our second study confirmed our initial findings. 16.6% of simulators and 10% of patients failed mean recognition but passed the false positives indicator.
Classification Accuracies of Individual and Combined Indicators in the Simulator Versus Patient Contrast.
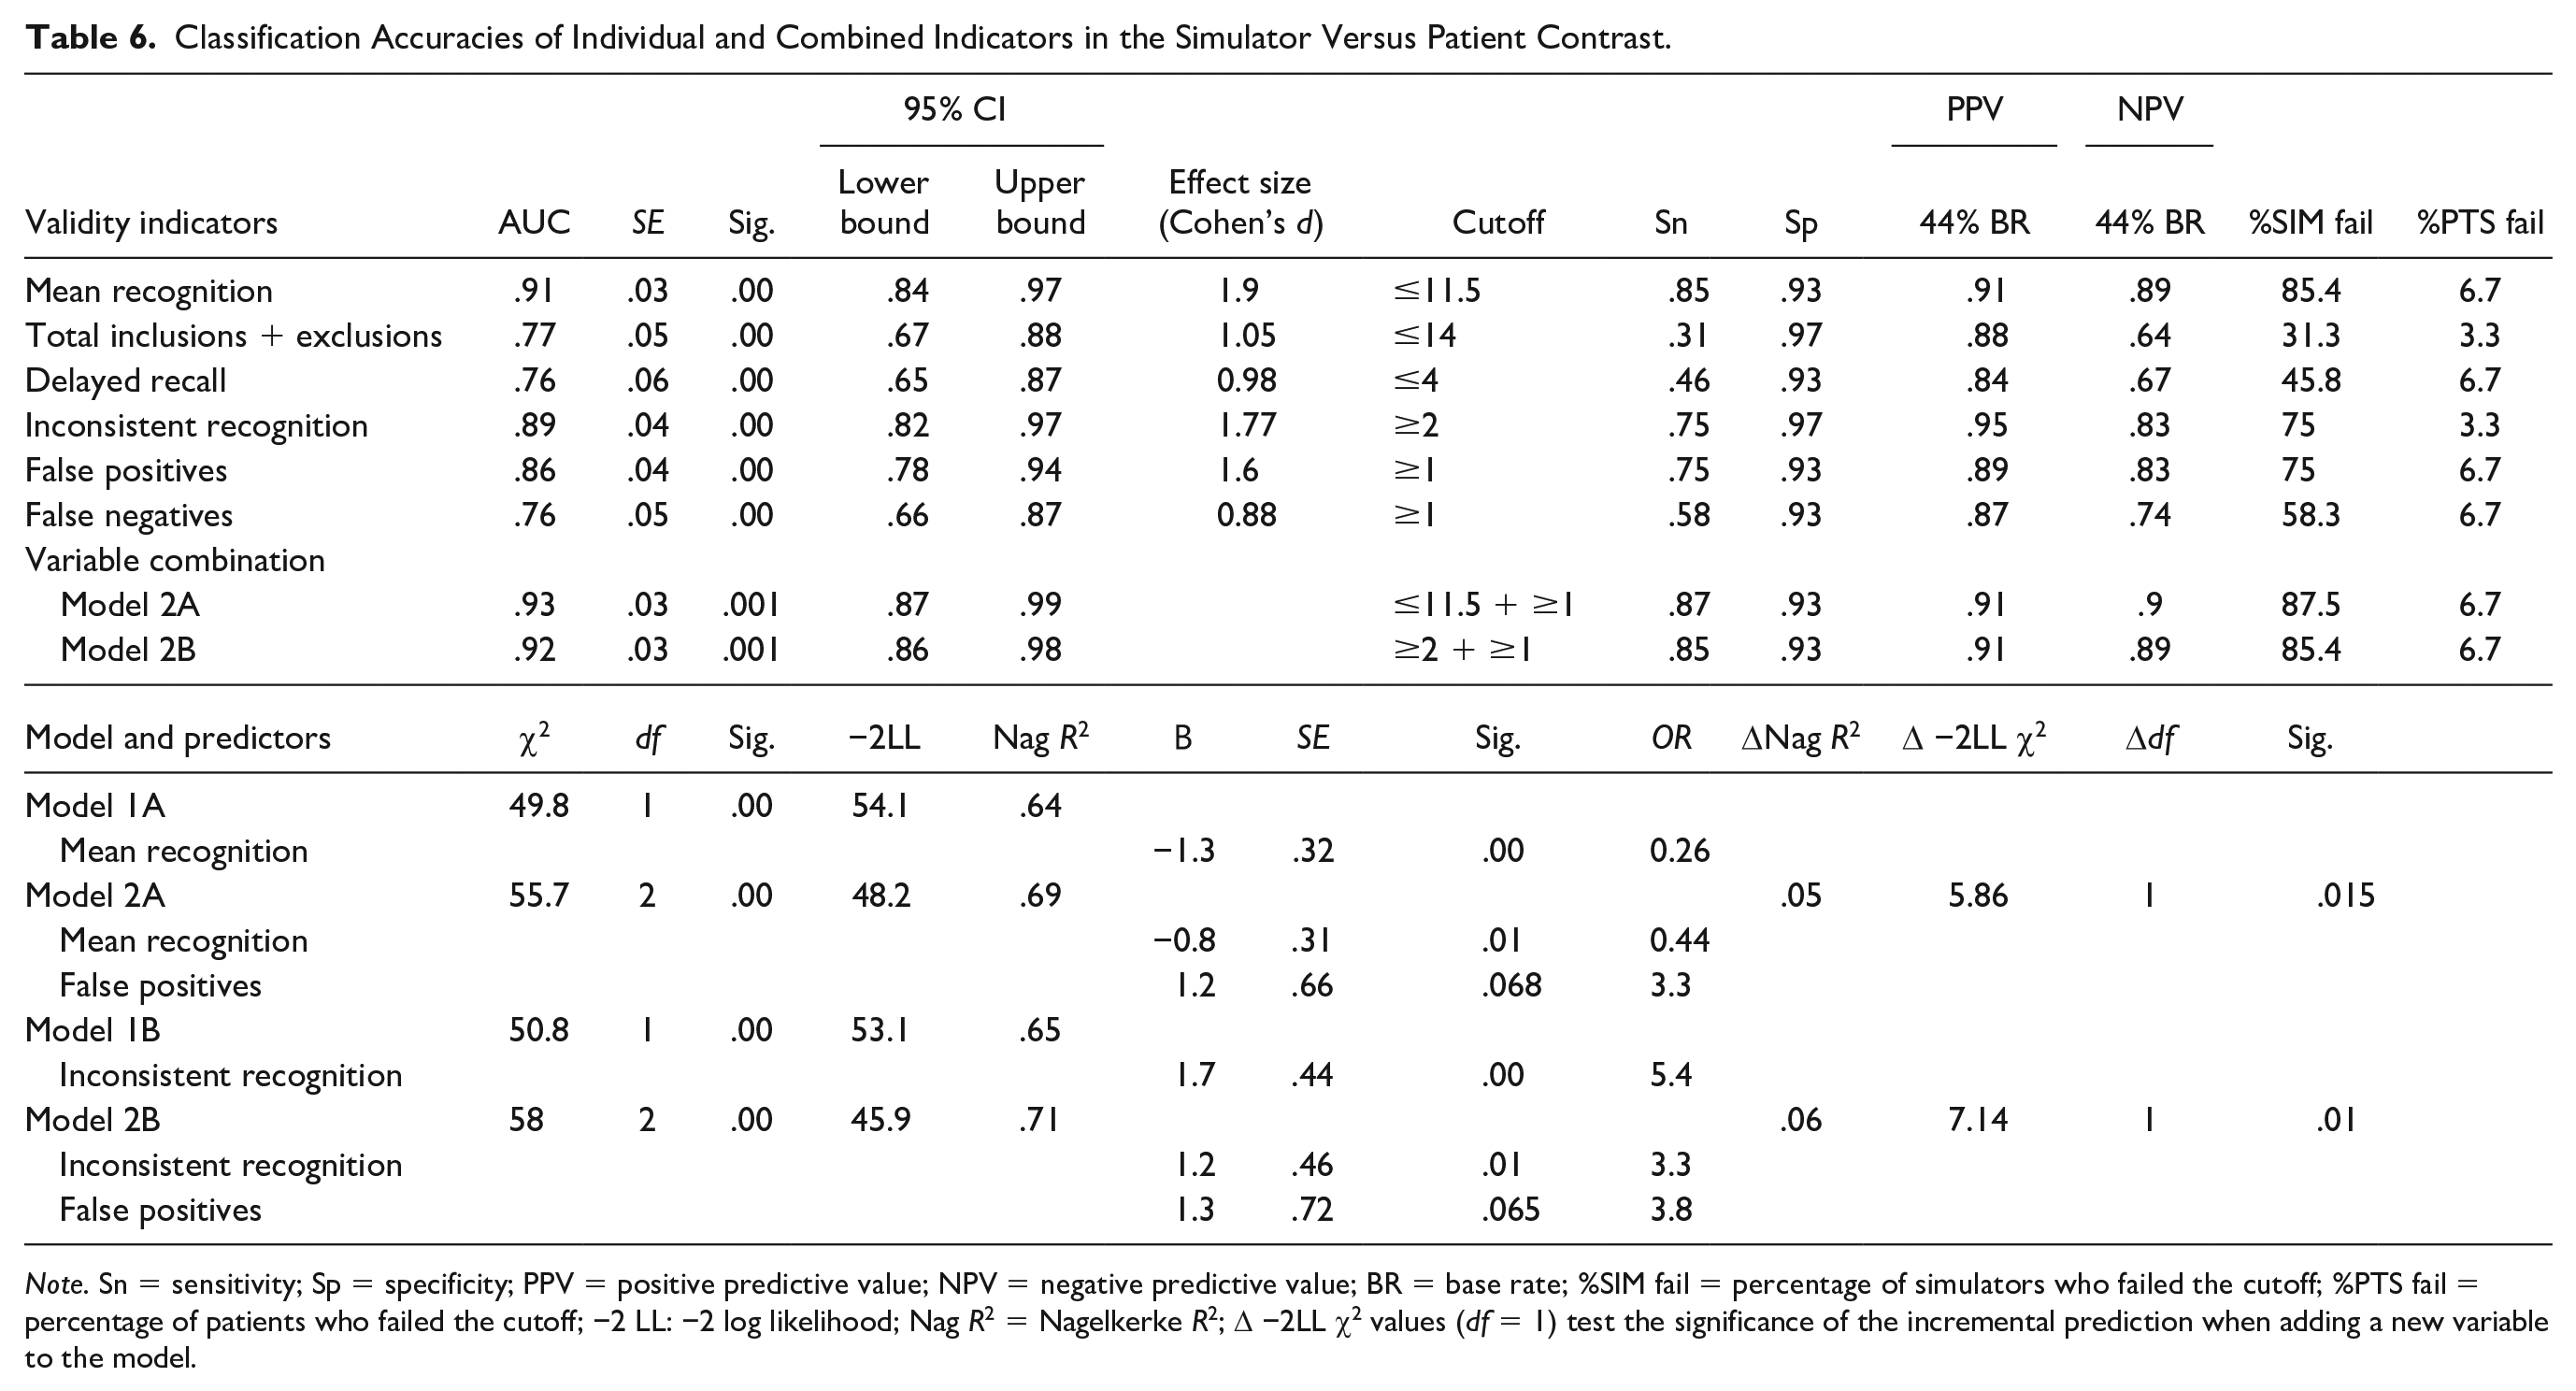
Note. Sn = sensitivity; Sp = specificity; PPV = positive predictive value; NPV = negative predictive value; BR = base rate; %SIM fail = percentage of simulators who failed the cutoff; %PTS fail = percentage of patients who failed the cutoff; −2 LL: −2 log likelihood; Nag R2 = Nagelkerke R2; Δ −2LL χ2 values (df = 1) test the significance of the incremental prediction when adding a new variable to the model.
General Discussion
The present studies compared the ability of single and combined indicators to discriminate simulated performances from genuine impairment. We used different memory paradigms (i.e., immediate recall, recognition, cued recall, and delayed recall) and assessed indicators relying on several detection strategies (i.e., recognition, response inconsistency, the magnitude of error, and process dissociation). Both studies showed that adding false positives to recognition indicators improved classification accuracy compared with single indicators at the base rates of simulation in our samples. These findings align with studies that reported a higher probability of invalid performance in pairwise failures than in failing a single indicator (Boone, 2007; Larrabee, 2003; Victor et al., 2009). In line with current research on parsimonious combinations of validity indices (Erdodi, 2017; Erdodi & Abeare, 2020; Erdodi et al., 2014), aggregating one forced-choice indicator with one error indicator demonstrated the potential to accurately detect invalid performance in clinical assessment.
Comparing individual accuracies of indicators revealed the superiority of a cluster consisting of mean recognition, inconsistency, and false positives in differentiating between simulators and patients. Both patients and nonclinical controls showed performances at ceiling on these indicators. In addition, we found no significant differences between these two groups, which suggests these indicators are robust to cognitive impairment (Shura et al., 2018). Mean recognition stood out as the most sensitive in the second study and the second most sensitive indicator in the first study, after false positives. Therefore, our results are in line with recommendations issued by Chafetz et al. (2015) and Crişan et al. (2021) to use different indicators in clinical assessment of which at least one should be a forced-choice task.
Evaluating inconsistencies across recognition trials as a marker for dishonest protocols proved an interesting option for an indicator due to its high classification accuracy and its small chance of being identified as a validity measure throughout assessment (Buddin et al., 2014; Gunner et al., 2012; Schroeder et al., 2013). As a novel finding, false positives constantly proved accurate in detecting simulated performance (Bender & Rogers, 2004; Inman & Berry, 2002). We attributed this indicator to the magnitude of error strategy due to clinical similarities between making intrusion errors (in our sample) and Ganser-like response patterns (Bender & Rogers, 2004; Rogers et al., 1993). In other words, simulators with such responses appeared disengaged in the task, disregarded instructions, or displayed a lack of comprehension, despite explicit indications. These responses were far less frequent in the clinical sample. Previous work showed that, when intrusion errors occur in clinical samples, they are often associated with elevated confabulatory tendencies found in some forms of dementia (Delis et al., 2005) but are rarely found in moderate to severe head injuries (Greiffenstein, 2008). Therefore, their evaluation in individuals with such diagnoses may be useful for detecting invalid responses because of such improbable occurrences.
Contrary to prior evidence (Rüsseler et al., 2008; Suhr & Gunstad, 2000), delayed recall and false negatives emerged as Cluster 2 indicators that were less sensitive to simulated performance. As the test’s most difficult trial, performances in delayed recall could have been affected by genuine impairment. Therefore, reliance on such indicators in assessment could result in reduced classification accuracies. Another indicator derived from the process dissociation task, the sum of inclusions and exclusions, was situated in between the two clusters. Yet, it failed to reach the “Larrabee limit” (≥50% sensitivity at ≥90% specificity). This result was not surprising since this indicator is highly dependable on the degree of false positives and negatives, which performed differently in terms of discrimination accuracy.
Since our findings indicate that recognition performances of Eastern-European clinical and nonclinical participants are similar to U.S. samples, they provide a proof of concept for the cross-cultural relevance of forced-choice indicators as markers of noncredible protocols. Due to the ease of administration, such formats might be applied to new validity indicators, regardless of linguistic and cultural boundaries (e.g., any common 12 objects could be used for the memory tasks).
Limitations
Several limitations can be attributed to our study. First, employed tests are experimental; hence more research would be needed to replicate results. Second, experimental findings need to be replicated in simulation studies with different populations and verified in criterion-groups studies before inferring any implications for clinical practice. Also, the small size and homogeneity of the simulator sample further restrict the generalizability of results to clinical populations. Moreover, the aggregated groups differed on age and education, and although education might not be related to some detection indices (Kanser et al., 2018), age might have influenced group outcomes.
A significant limitation is the absence of a criterion-PVT to confirm the genuineness of the clinical and nonclinical group’s performance. So, beyond explicit instructions to perform their best, we could not objectively state that all patients or community members were rendering valid performance. Hence, future experiments should (a) use a substantially different simulator group to verify the replicability of results and (b) test the validity of performance in the clinical and nonclinical full-effort groups via an independent PVT.
In addition, PPV and NPV were computed at the base rate of simulation in our samples, making the generalization of these findings to samples with different base rates difficult. Due to the occurrence of intrusion errors in some forms of dementia (Delis et al., 2005), we recommend caution when using such indicators in cases with severe impairment and comorbidities. In this vein, comparing criterion groups of patients could help establish differential cutoff scores that best discriminate invalid from dysfunctional performances. Furthermore, versatile detection strategies like recognition could be experimentally tested in tasks employing other types of stimuli (e.g., numbers, letters, or symbols).
Conclusion
We conducted two experimental studies to test and compare the ability of new validity indicators to discriminate simulated from genuinely impaired performances. We assessed participants with four short-term memory tasks, separated by a distractor, and used indicators corresponding to different strategies to evaluate performance validity.
Across both studies, ROC analyses and pairwise comparisons of individual AUC values revealed a cluster of indicators most sensitive to simulated impairment (i.e., mean forced-choice, inconsistency in recognition, and false positives). These proved distinct from less sensitive indicators (i.e., delayed recall and false negatives). Aggregating false positives with mean recognition produced an increment in classification as compared with individual accuracies. The fact that the cross-validation study supported our initial findings suggests the possibility of using our indicators in both face-to-face and online assessment, which is essential given the current epidemiological situation.
Relying on such indicators could prove helpful in choosing and designing instruments for detecting noncredible performance. Additionally, the reduced time of administration (20-30 minutes) compared with standard PVTs and the possibility of online testing support its use in clinical assessment.
Supplemental Material
sj-pdf-1-asm-10.1177_10731911211040105 – Supplemental material for Evaluation of Various Detection Strategies in the Assessment of Noncredible Memory Performance: Results of Two Experimental Studies
Supplemental material, sj-pdf-1-asm-10.1177_10731911211040105 for Evaluation of Various Detection Strategies in the Assessment of Noncredible Memory Performance: Results of Two Experimental Studies by Iulia Crişan, Florin Alin Sava, Laurenţiu Paul Maricuţoiu, Mugur Daniel Ciumăgeanu, Otilia Axinia, Lucian Gîrniceanu and Laura Ciotlăuş in Assessment
Footnotes
Acknowledgements
We thank Dr. Lisa M. Manderino of the Research and Editing Consulting Program (RECP) within the International Neuropsychological Society’s Global Engagement Committee for providing professional English editing services.
Availability of Data and Material
Data are available on request.
Consent to Participate
Informed consent was obtained from all individual participants included in the study.
Consent for Publication
Consent for publication was obtained from all authors.
Declaration of Conflicting Interests
The author(s) declared no potential conflicts of interest with respect to the research, authorship, and/or publication of this article.
Funding
The author(s) received no financial support for the research, authorship, and/or publication of this article.
Ethical Approval
All procedures performed in studies involving human participants were in accordance with the ethical standards of the institutional and/or national research committee and with the 1964 Helsinki declaration and its later amendments or comparable ethical standards.
Methodological Disclosure
We reported how we determined our sample size, all data exclusions, all manipulations, and all measures in the study.
Supplemental Material
Supplemental material for this article is available online.
References
Supplementary Material
Please find the following supplemental material available below.
For Open Access articles published under a Creative Commons License, all supplemental material carries the same license as the article it is associated with.
For non-Open Access articles published, all supplemental material carries a non-exclusive license, and permission requests for re-use of supplemental material or any part of supplemental material shall be sent directly to the copyright owner as specified in the copyright notice associated with the article.