
Abstract
Ambulatory assessment (AA) studies are becoming more and more popular. However, it can be challenging to motivate participants to comply with study protocols. The aim of the present study was to investigate possible predictors of compliance in AA studies with diverse samples and study designs. To do so, we extracted compliance information, study characteristics, and sample characteristics from 488 previously published studies. The average compliance across the studies was rather high. The total number of measurement occasions and the number of study days were negatively related to the compliance rate. Moreover, a higher percentage of healthy controls in clinical studies was associated with a higher compliance rate. By contrast, other study characteristics (e.g., the amount of financial compensation) and sample characteristics (clinical vs. healthy sample) were not related to compliance. The findings have implications for the design of future AA studies.
Keywords
Parallel to the technical development of mobile devices and smartphones, interest in conducting ambulatory assessment (AA) studies has grown rapidly in recent decades (e.g., Iida et al., 2012). The people who participate in these studies are usually asked to fill out short questionnaires multiple times a day. However, there are huge differences between such studies with respect to the characteristics of the study (e.g., study design, incentives) and the characteristics of the underlying sample (e.g., age, clinical vs. healthy participants). Participants’ compliance also differs to a large extent between AA studies. A low overall level of compliance, and hence a reduced sample size, can result in lower statistical power, estimation problems, and issues with the quality of the data (e.g., Button et al., 2013; Maxwell et al., 2008; Schönbrodt & Perugini, 2013). Knowing which study characteristic or sample characteristic are related to compliance might help increase compliance in future AA studies.
To date, only a few studies have investigated predictors of compliance in AA studies. Morren et al. (2009) systematically reviewed 62 studies on pain. The length of the diaries was negatively associated with the compliance, and the compliance was higher when the participants were older. Jones et al. (2018) presented a quantitative meta-analysis on predictors of compliance in AA studies. They included 126 studies on substance use and found that individuals with a substance use disorder showed lower compliance than individuals from community-based samples. In this meta-analysis, the frequency of prompting or the length of the AA period were unrelated to compliance. Vachon et al. (2019) conducted a meta-analysis including 79 studies with samples with severe mental disorders. Compliance was higher in studies with a fixed sampling scheme, fewer measurement occasions per day, and larger time intervals between two consecutive measurement occasions. Rintala et al. (2019) used data from 10 AA studies and found that compliance was higher in older participants, in female participants, and in healthy participants compared with participants with psychosis. They found no difference in the compliance between participants with depression and healthy participants. Stone et al. (2003) experimentally manipulated the sampling density (i.e., the number of prompts per day) in a sample of patients with chronic pain. They found high compliance rates that were not affected by the sampling density.
These results might serve as a basis for deriving recommendations about AA study designs, but the meta-analyses focused on rather special samples (Jones et al., 2018; Vachon et al., 2019), and other results relied on only one study (Stone et al., 2003) or on a small number of studies (e.g., Rintala et al., 2019). Because most of the analyzed studies had rather homogeneous designs, Rintala et al. (2019) recommended that the predictors of compliance should be investigated further in AA studies with more variability in design characteristics. To date, only a little research has incorporated a large number of published studies and investigated predictors of compliance between studies. There are three meta-analyses or systematic reviews that have focused on specific populations (i.e., substance users, Jones et al., 2018; individuals with pain, Morren et al., 2009; individuals with severe mental disorders, Vachon et al., 2019). The present study was aimed at identifying relevant predictors of compliance in AA studies with diverse designs and diverse (clinical and healthy) populations. To do so, we reviewed published AA studies and extracted the compliance and a variety of study and sample characteristics.
Possible Predictors of Compliance
Incentives
When planning AA studies, researchers must find an optimal design that will allow them to assess the constructs of interest with high validity and reliability. At the same time, researchers want to ensure that participants are motivated to comply with the AA protocol. In practice, researchers apply different strategies to increase participants’ compliance. One strategy is to provide incentives such as financial compensation, course credit, prize rewards, or tailored feedback. Incentives can be interpreted as a symbol of appreciation, which in turn increases the probability of cooperative study participation because participants want to return the appreciation (Pforr, 2015). Therefore, we expected that the amount of incentives would be positively related to compliance in AA studies. Moreover, incentives are often contingent on a certain degree of compliance. Therefore, we conducted an exploratory investigation of whether the mode of incentive was related to compliance.
To date, only a few studies have investigated whether incentives are effective in increasing compliance. In their meta-analysis, Vachon et al. (2019) found that the amount of incentives was positively related to compliance. Harari et al. (2017) compared three studies with student samples and varied the kind of incentive. Compliance was lower in the study with course credit and feedback, and it was higher in studies with compensation and feedback or with prize rewards and feedback. Newcomb et al. (2018) investigated whether weekly tailored feedback would increase compliance in a study with young men who have sex with men. Unexpectedly, they found no effect on compliance. We conducted an exploratory investigation of whether the kind of incentive was related to compliance.
Contact With Participants
Another strategy that should help maintain participants’ motivation to continue with the study is to contact them during the study (e.g., Ansell et al., 2015; Gloster et al., 2017). This should reduce the anonymity of the researchers and, thus, should enhance participants’ personal commitment. Moreover, technical issues or other problems can be resolved, which might improve participants’ motivation to continue to participate. Hence, we hypothesized that participants’ compliance would be higher in studies in which the researchers contacted the participants during the study.
Participant Burden
Besides numerous advantages of AA studies (e.g., real-time assessment to circumvent recall biases, investigation of within-person processes, real-life assessment to enhance generalizability; e.g., Ebner-Priemer & Trull, 2009), participant burden due to the repeated assessments might reduce the quality of the data and compliance (e.g., Morren et al., 2009; Rintala et al., 2019; Stone et al., 2003). There are several study characteristics that might increase participant burden and, hence, reduce compliance: (a) the length of the AA period, (b) the length of the repeated questionnaires, and (c) the number of daily questionnaires.
The length of AA studies depends on the research question that should be answered. For example, changes that occur over a longer period (e.g., a reduction in depression during therapy) require AA studies that are longer than changes that occur over a shorter period (e.g., fluctuations in momentary mood). The length can range from 1 day (e.g., Krkovic et al., 2018) to 1 year (e.g., Burg et al., 2017). Compliance typically decreases over the course of an AA study (Comulada et al., 2015; Fuller-Tyszkiewicz et al., 2013). We therefore expected that compliance would be lower for longer AA periods.
The longer the repeated questionnaires are, and thus, the more time participants must spend with the questionnaires, the higher the participant burden should be. In a systematic review of diary studies investigating pain, Morren et al. (2009) found that the shorter the questionnaires were, the higher compliance was. By contrast, Rintala et al. (2019) found no association between the number of questions and compliance. However, the authors mentioned that the low level of variability in the lengths of the questionnaires included in the study might explain this lack of association. Thus, a study with more diverse questionnaire lengths is needed. We hypothesized that compliance would be lower when single repeated assessments took longer to complete.
AA studies differ greatly in the number of questionnaires that must be completed each day (i.e., the number of prompts per day). Wen et al. (2017) reviewed AA studies with minors and reported that in some studies, participants were prompted more than 25 times each day. Characteristics that have high change rates (e.g., mood) should be assessed more often than characteristics that change more slowly (e.g., attitude toward one’s employer) or that occur only at a specific time of day (e.g., sleep quality). A study by Burke et al. (2017) revealed that the participants were not accepting of more than five measurement occasions per day. We expected that compliance would be lower for larger numbers of measurement occasions per day.
Intervention Studies
Participants can benefit from AA intervention studies more than from AA studies that focus on only the assessment of everyday characteristics. The intrinsic motivation to be compliant with the study protocol might be higher because participants can use their study participation to increase desirable outcomes or to decrease undesirable outcomes. Hence, we hypothesized that compliance would be higher in intervention studies than in studies without any intervention.
Clinical Populations
Conducting AA studies with clinical patients can be challenging. Ramsey et al. (2016) stated that “common mental health problems such as depression or anxiety disorders may diminish motivation and reduce confidence in using technology” (p. 211). There are only a few empirical results on this question. Participants with psychosis were less compliant than healthy participants (Rintala et al., 2019; Vachon et al., 2019). However, there was no difference in the compliance between participants with depression and healthy participants (Rintala et al., 2019). A study by Gershon et al. (2019) revealed that youth with bipolar disorder showed lower compliance than healthy controls. We therefore expected that compliance would be lower in clinical populations than in healthy control populations.
Overview of the Present Research
The aim of the present study was to identify relevant predictors of compliance in AA studies. We reviewed published AA studies and extracted compliance and a variety of study and sample characteristics. This approach enabled us to study predictors of compliance with sufficient variability. We did not investigate individual differences as most psychological studies do; rather, we investigated differences between studies.
Regarding compliance, we investigated two different indicators: the compliance rate (i.e., the percentage of beeps that were answered) and the percentage of nondropouts (i.e., the percentage of individuals who completed the study). We hypothesized that the amount of incentives would be positively related to compliance and that the length of the AA period, the length of the single repeated assessments, and the number of measurement occasions per day would be negatively related to compliance. Moreover, we hypothesized that compliance would be higher in studies with contact between the researchers and the participants and in intervention studies. Compliance was hypothesized to be lower in clinical populations than in healthy control populations. These hypotheses were preregistered at the OSF (https://doi.org/10.17605/OSF.IO/DT49F). Furthermore, we explored whether additional characteristics (individual feedback, age, sex, and mode of incentive) were associated with compliance. We report how we determined our sample size, all data exclusions, and all measures in the study.
Method
Study Selection
When we computed the necessary sample size, we could not find any comparable research that had investigated similar hypotheses or used a similar design. We expected low to medium effect sizes. To be conservative, our anticipated sample size comprised 400 studies to achieve a power of .90 for detecting a correlation of .16. To select studies that reported results from AA studies, we used the quarterly literature screenings from the Society for Ambulatory Assessment (http://www.saa2009.org/?page_id=62). 1 We started with the most recent quarter (the first quarter of 2018) and went backward until we collected data from 481 studies (until the third quarter of 2014). 2
Because of the wide range of AA topics, we focused on studies that addressed the topics of affect and well-being. 3 This is a broad research topic and covers research interests from different fields (Diener et al., 2018). Articles that were not considered included topics like physical diseases, physical activity, or substance use (without any connection to affect and well-being). Figure 1 presents the entire process by which studies were excluded. Next, we removed articles that were listed multiple times. We additionally checked for whether the reported analyses were based on the same study. In this case, we included only the article with the largest sample size in our analyses. Some articles were not available through an online search. In this case, we tried to contact the corresponding author. However, a small number of articles could not be procured. Some studies did not include AA data (e.g., meta-analyses, reviews, or theoretical articles) and were therefore excluded. Finally, we excluded studies that reported no information about the compliance rate. In some cases, this was because the listed AA studies had been solely event-based, which means that there was no planned maximum number of measurement times, and in turn, there was no way to measure the compliance rate. Because of this, all of the studies that we included in the analyses refer to signal- and/or interval-based AAs.
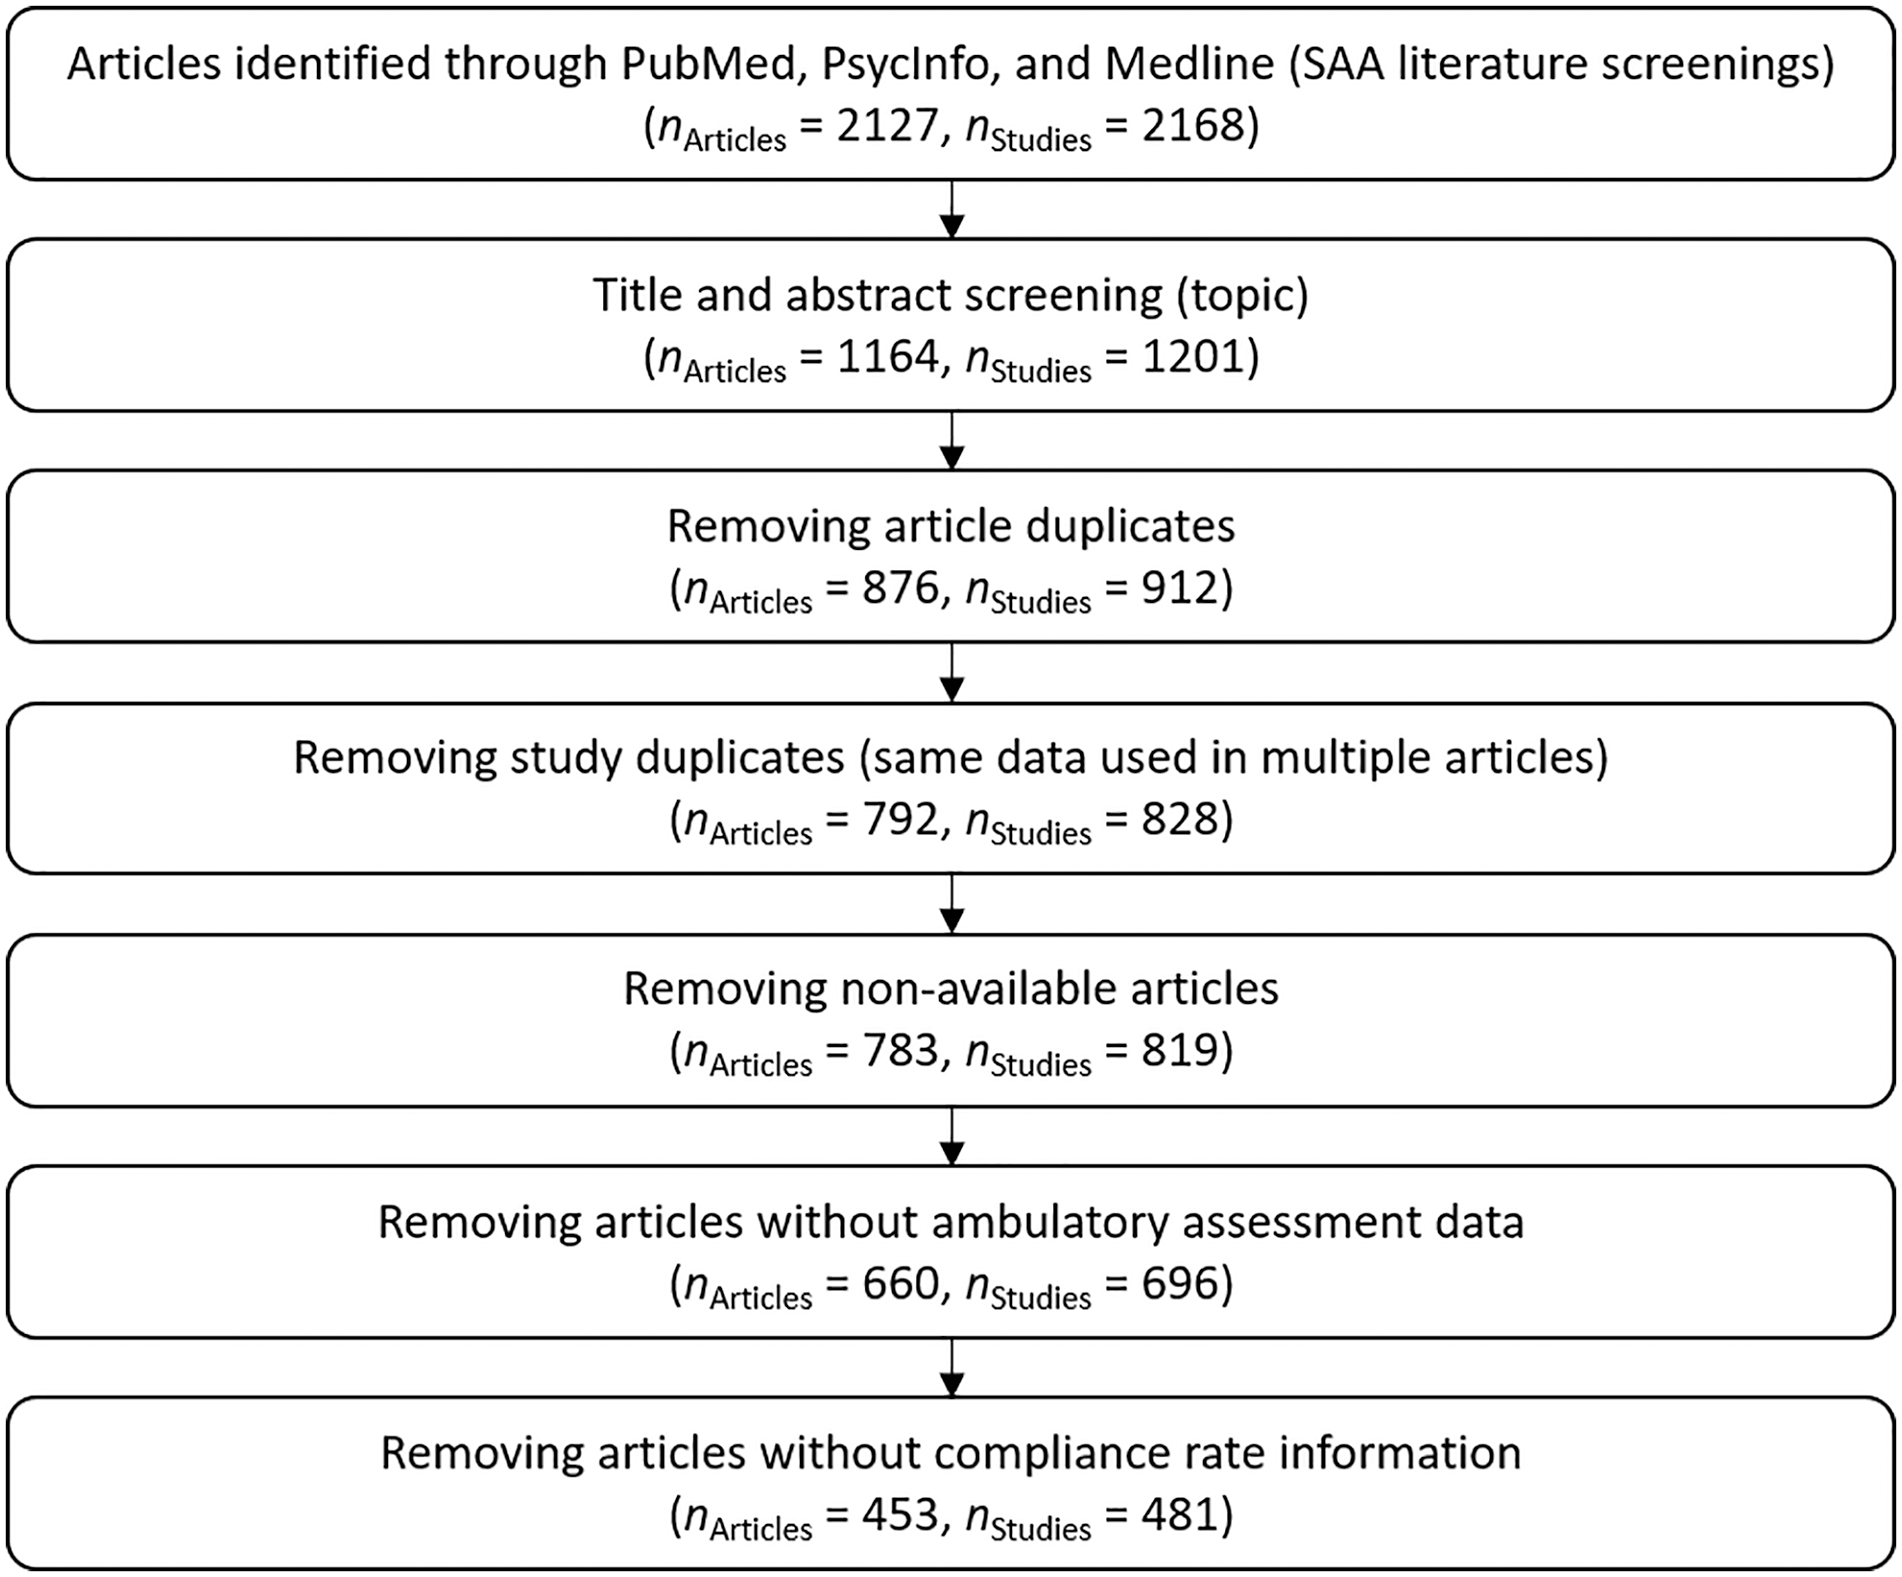
Flow chart of the studies included in the analyses.
Study Description
A total of 99.8% of the 481 studies we analyzed were first published between 2014 and 2018. 4 The average sample size was 121.85 (SD = 217.56, Mdn = 81, Min = 5, Max = 3,867). A total of 436 studies reported the mean age of the underlying sample (studies that reported only an age range were not included in the calculation of the average age). The mean age was 31.78 years (SD = 13.07, Min = 9.53, Max = 81.18). A total of 461 studies reported information about the sex distribution. On average, 63% were female (Min = 0%, Max = 100%). A total of 265 studies provided information about the professional status of the participants. The average percentage of students was 68% (n = 223, SD = 42%, Mdn = 100%, Min = 0%, Max = 100%), the average percentage of employed participants was 33% (n = 235, SD = 41%, Mdn = 0%, Min = 0%, Max = 100%), and the average percentage of unemployed participants was 6% (n = 224, SD = 15%, Mdn = 0%, Min = 0%, Max = 82%).
A total of 468 out of 481 studies reported information about the data collection medium (402 studies used one data collection medium, 54 studies used two data collection media, 12 studies used three or more data collection media): 185 used an electronic device (e.g., a handheld device), 138 used smartphones (95 used smartphones that the study lent to the participants, 33 used the participants’ own smartphones, 20 gave no information about the smartphone owner), 59 used email/online questionnaires, 30 collected data with paper-and-pencil questionnaires. A total of 69 studies reported that they used another data collection method in addition to the questionnaires: 16 studies used accelerometers, 11 studies used actigraph devices, 10 studies used saliva samples, 7 used GPS information, and 35 studies used other methods that were not identified any further.
Extraction and Coding
Compliance Rate
We defined the compliance rate as the percentage of completed measurement occasions for participants who did not drop out across the entire survey period. This value was reported in different ways across different studies (e.g., the number of completed measurement occasions, percentage of completed measurement occasions, average number of completed measurement occasions per person or per day), and some studies reported contradictory values. To decide which of the reported values to use in our analyses, we applied the following rules: If the number of planned and completed measurement occasions was reported, we calculated the exact compliance rate. If one of these values was not available, we used the reported percentage. If none of these values were available, we used any other reported value (e.g., the average number of measurement occasions completed per person or per day) and calculated the compliance rate out of this information (combined with the sample size or the number of days in the study).
Nondropout
As another compliance measure, we used the percentage of participants who completed the study (who did not drop out during the study). Thus, a high percentage of nondropouts indicates a high compliance.
Incentives
The compensation for participating in AA studies was categorized into four categories (money, voucher, course credit, or material gift). Moreover, we documented the maximum possible amount of the financial compensation (in US$) if it was given in the article. If the currency was other than US$, we converted it to US$ (we used the exchange rates from December 19, 2018; that was the time of data preparation).
Contact
This indicated whether the research staff had contact with the participants, if they called them to ask about any technical problems, or if the participants visited the research staff during the study period. If nothing was reported about contact, it was interpreted as no contact.
Length of AA Period
The length of the AA period was recorded in two ways: (a) the total number of scheduled measurement occasions and (b) the number of study days on which the repeated measurement occasions took place. Days without scheduled measurement occasions within the study period were not included.
Duration of Measurement Occasions
Some studies reported the average amount of time participants needed to finish one measurement occasion (in seconds). For the studies that reported no time but instead reported the number of items, we converted the number of items into a measure of time by assuming that participants took 5 seconds to answer each item. The conversion factor of 5 seconds was chosen because of previous research. In three different AA studies, Arndt et al. (2018) found that the average time participants needed to respond to simple emotion intensity items was 1.37 to 4.17 seconds. Because these previous items were rather short, we rounded up to 5 seconds per item.
Number of Measurement Occasions Per Day
This measure included the number of scheduled signal- and interval-based measurement occasions per day. If the number of measurement occasions differed between days, the average number of measurement occasions was taken. Studies that reported only a range of daily measurement occasions were not included in the analyses.
Intervention Study
Intervention studies were studies that described any intervention that occurred within the AA survey period. If there was no mention of an intervention, we assumed that there had been no intervention.
Population
We categorized whether the sample was a clinical sample or not. As clinical studies often include healthy control participants, we additionally included the relative percentage of healthy controls in our analyses.
Additional Characteristics
We extracted additional study and sample characteristics that were not part of the presented analyses (e.g., topic of the study, kind of device, ethnic background). The entire data set can be retrieved from https://doi.org/10.17605/OSF.IO/DT49F.
Data Analytic Models
Relations between metric variables were analyzed with correlations. Mean comparisons were computed with t tests for independent samples (in case of variance heterogeneity, the Welch correction of the degrees of freedom was applied). All hypotheses were tested separately with both of the dependent variables that were used to measure compliance (compliance rate, percentage of nondropouts). All data were analyzed with R (R Core Team, 2018). The data and R script can be retrieved from the OSF (https://doi.org/10.17605/OSF.IO/DT49F). The number of studies that were used for the different analyses differed because some characteristics were not included in every study. 5
Results
Descriptive Results
Descriptive statistics and correlations between metric variables can be found in Table 1. Overall, the compliance rate (n = 481, M = 77%, SD = 14%, Mdn = 79%, Min = 18%, Max = 100%) and the percentage of nondropouts (n = 254, M = 89%, SD = 11%, Mdn = 93%, Min = 28%, Max = 100%) were rather high.
Descriptive Statistics and Bivariate Correlations for Metric Variables.
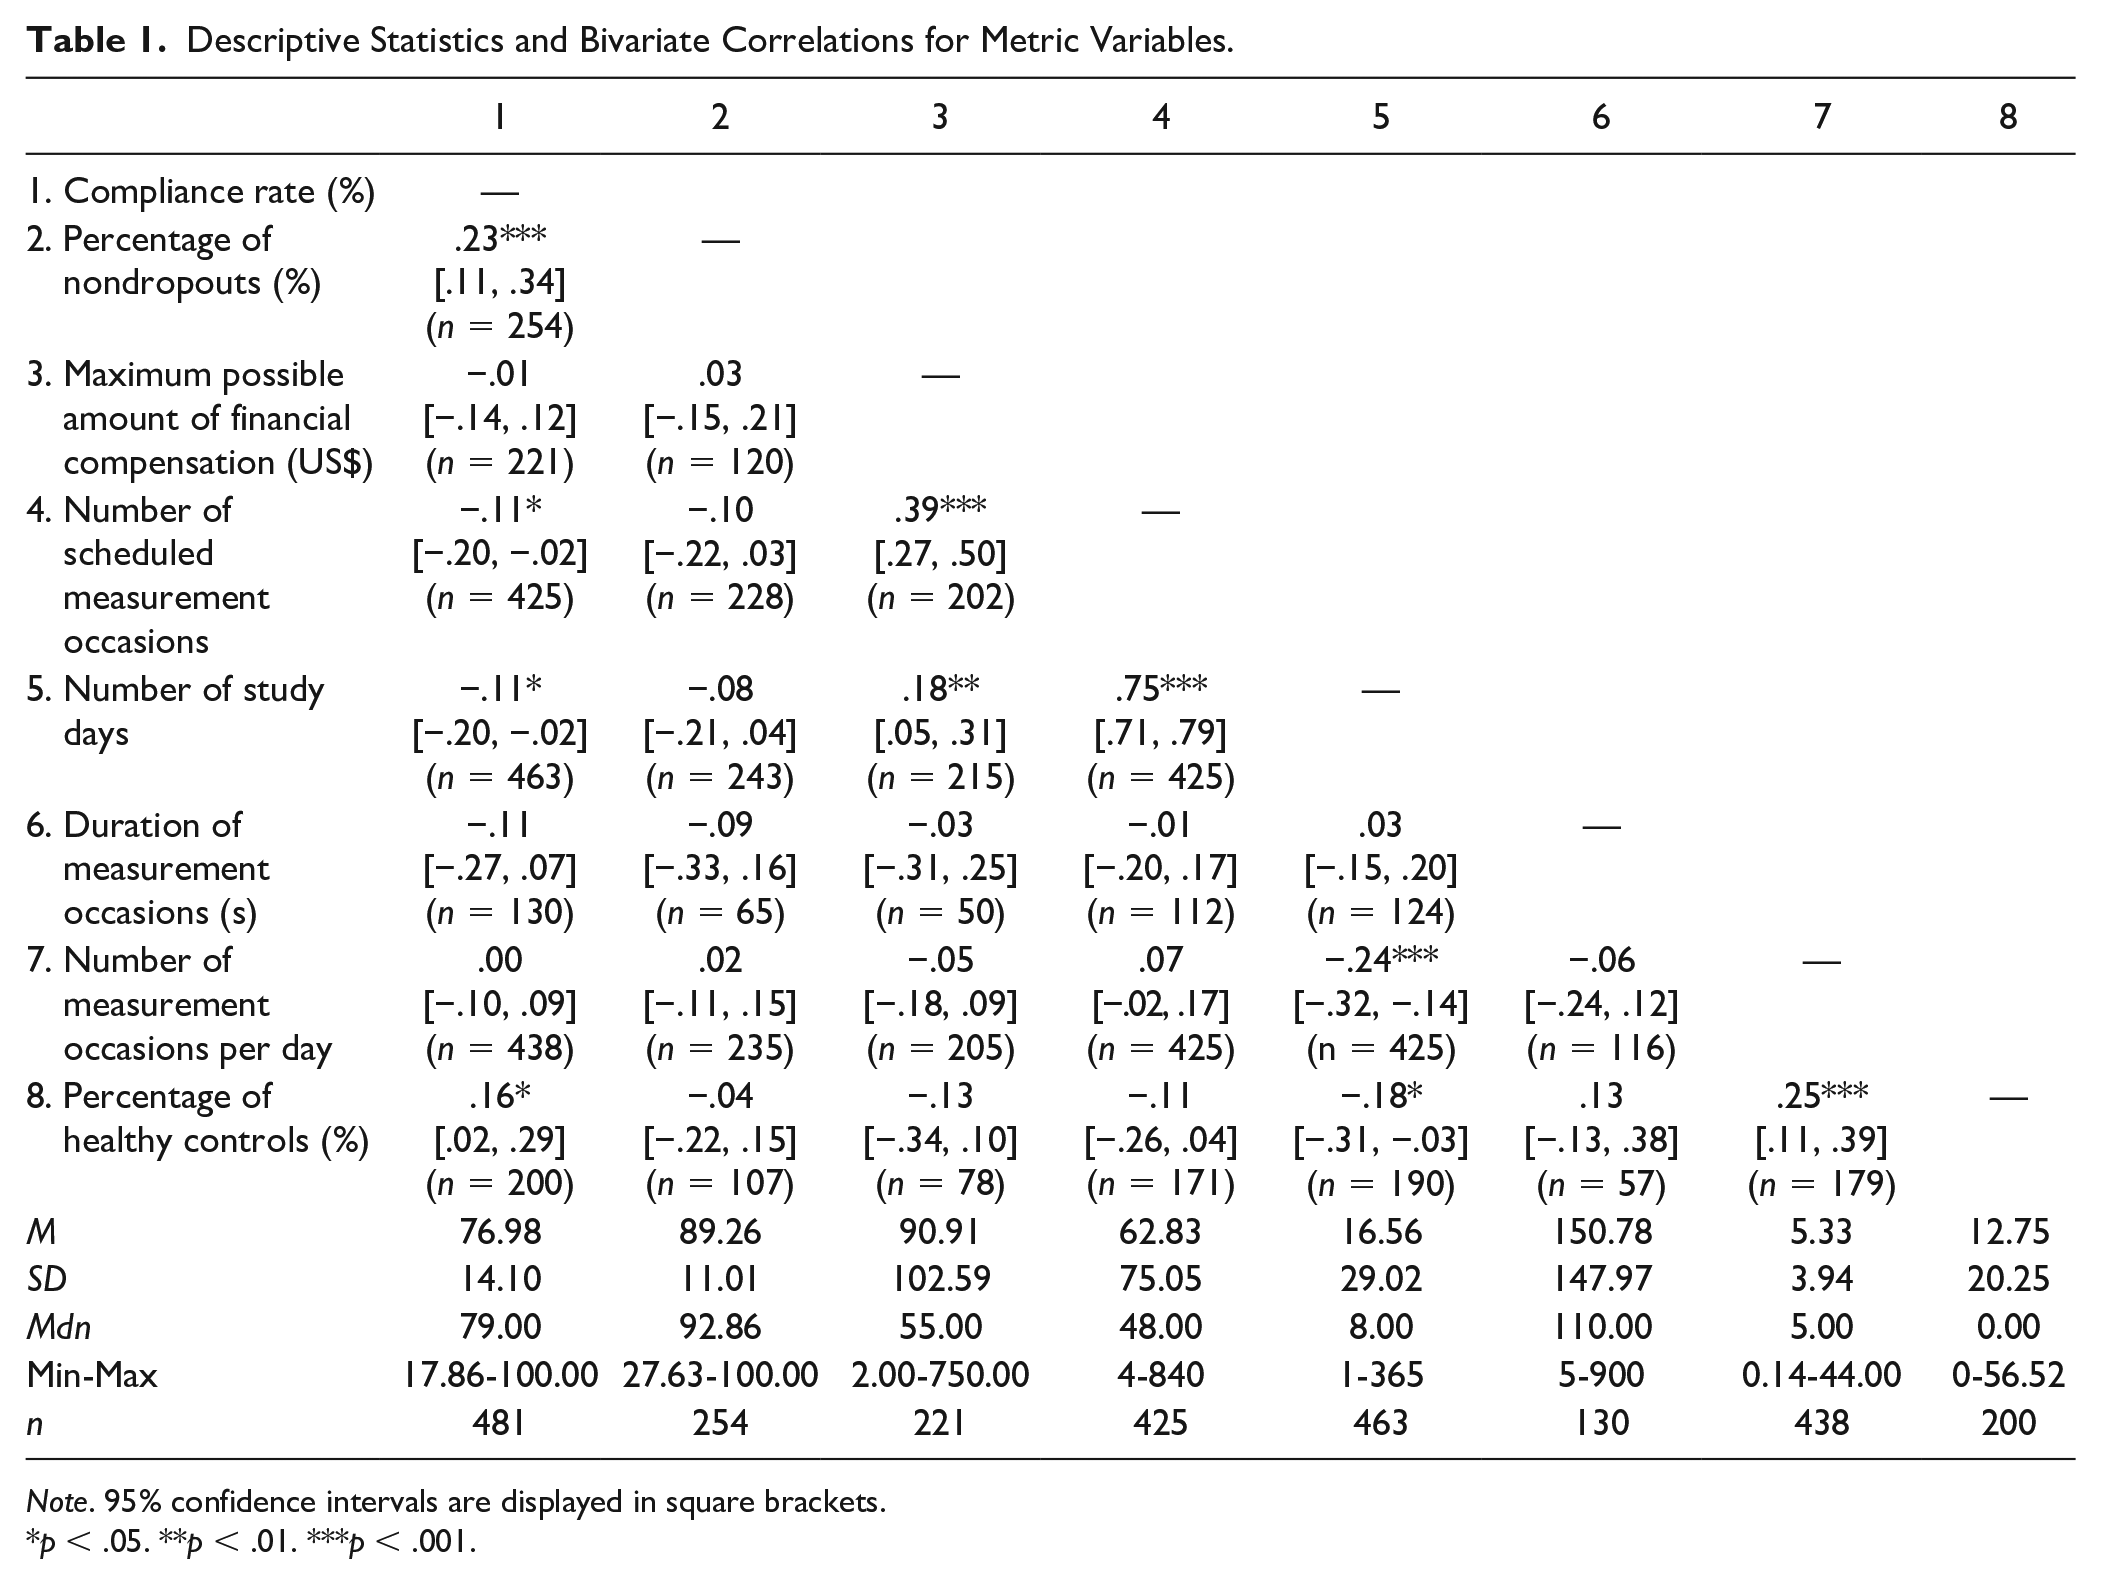
Note. 95% confidence intervals are displayed in square brackets.
p < .05. **p < .01. ***p < .001.
Preregistered Hypotheses
Incentives
We first hypothesized that the amount of incentives would be positively related to compliance. A total of 274 (57%) of the 481 studies reported that they provided incentives for study participation. The maximum possible amount of compensation was unrelated to the compliance rate and was also unrelated to the percentage of nondropouts (see Table 1). Controlling for the length of the AA period (number of study days and number of scheduled measurement occasions) did not change these results.
A total of 271 studies provided information about the kind of incentive. Only 11 studies provided material gifts. Thus, we refrained from analyzing the compliance of those studies separately. Most studies (65%) provided money as the only incentive. Figure 2 shows the compliance rates of studies with different incentive structures. The highest compliance rate was achieved when money and course credit were given, followed by studies that gave money only. We did not analyze whether mean differences were significantly different from zero due to some small group sizes. A total of 147 studies provided information about the percentage of nondropouts and about the kind of incentive. The highest percentage of nondropouts (i.e., the highest compliance) was achieved in studies that used course credit, followed by studies that used course credit and money and studies that used course credit and vouchers (Figure 3).
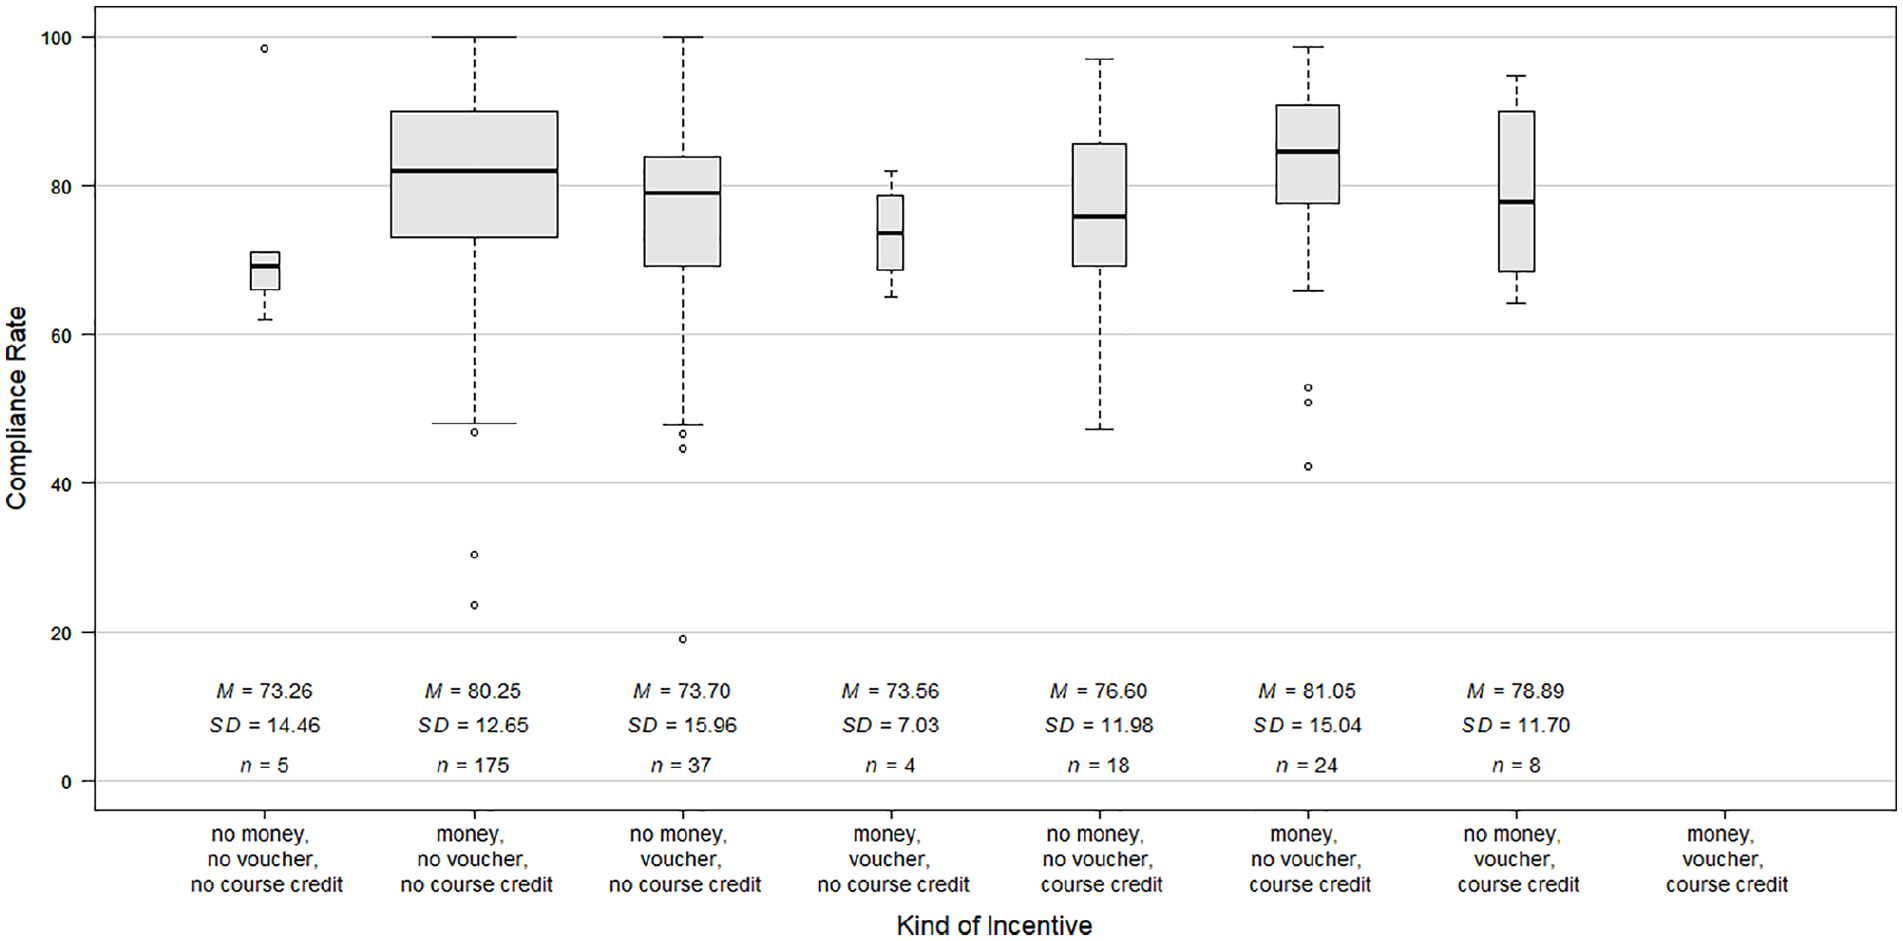
Separate illustration of the compliance rate depending on the incentive structure.
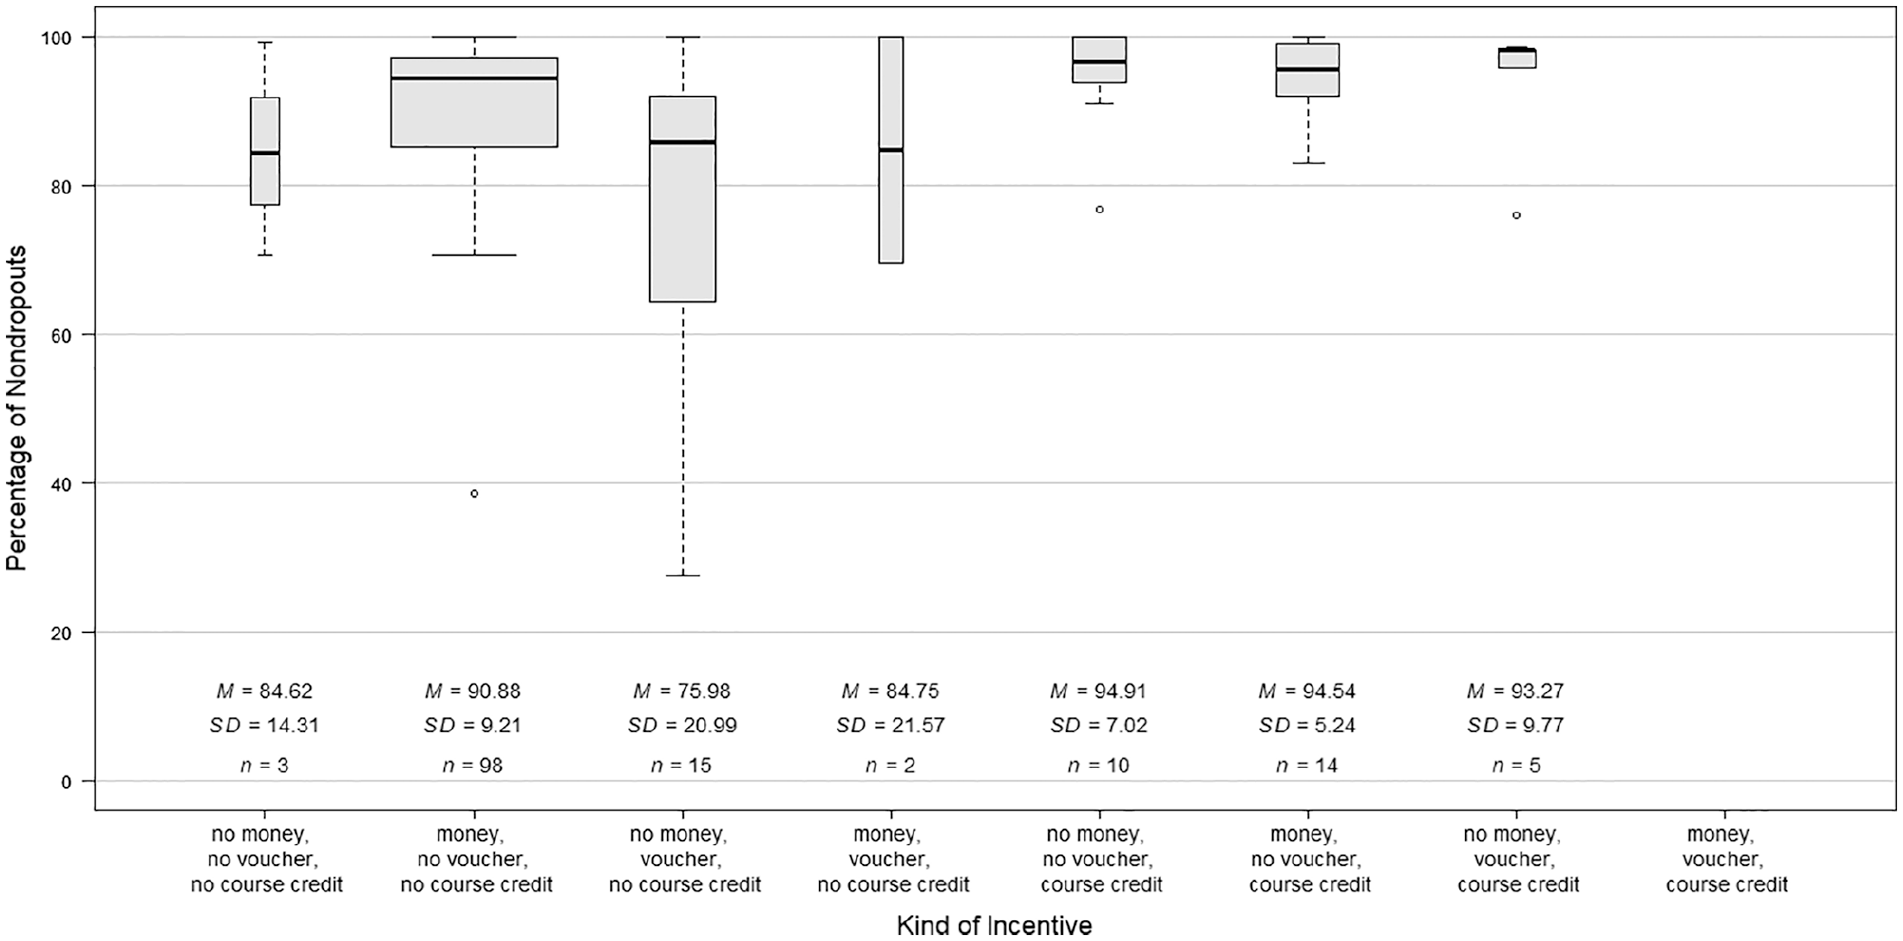
Separate illustration of the percentage of nondropouts depending on the incentive structure.
Contact
To investigate the second hypothesis, we compared studies that explicitly reported that they had contact with the participants during the study with studies that reported nothing about contact. In 80 studies, the researchers stayed in contact with the participants during the study, but the compliance rate did not differ between studies with contact versus those without contact, t(479) = 0.59, p = .554, 95% CI [−2.37, 4.42], d = 0.07. Moreover, the percentage of nondropouts did not differ between studies with contact versus without contact, t(252) = 0.07, p = .942, 95% CI [−3.47, 3.74], d = 0.01.
Length of AA Period
For the third hypothesis, we tested whether (a) the number of scheduled measurement occasions and (b) the number of study days was related to compliance. The number of measurement occasions was negatively related to the compliance rate, but it was unrelated to the percentage of nondropouts (see Table 1). Similarly, the number of study days was also negatively related to the compliance rate, but it was unrelated to the percentage of nondropouts (see Table 1). However, the effect sizes of the associations between the two indicators of the length of the AA period and the compliance indicators were similar (the r ranged from −.08 to −.11).
Duration of Measurement Occasions
Fourth, we hypothesized that the longer the single repeated assessment lasted, the lower the compliance would be. Contrary to this hypothesis, the average amount of time the participants needed to fill out a single assessment was not related to the compliance rate or to the percentage of nondropouts (see Table 1).
Number of Measurement Occasions Per Day
The fifth hypothesis stated that the higher the number of measurement occasions per day, the lower the compliance would be. The results showed that the number of daily measurement occasions was not related to the compliance rate or to the percentage of nondropouts (see Table 1).
Intervention Study
In the sixth hypothesis, we assumed that compliance would be higher in intervention studies than in studies without any intervention. In contrast to our hypothesis, the compliance rate was higher in studies without an intervention (n = 428, M = 77%, SD = 14%) than in intervention studies (n = 54, M = 73%, SD = 15%), t(479) = 2.29, p = .022, 95% CI [0.67, 8.71], d = 0.33. Similarly, the percentage of nondropouts was higher in studies without an intervention (n = 227, M = 90%, SD = 11%) than in intervention studies (n = 27, M = 84%, SD = 13%), t(252) = 2.89, p = .004, 95% CI [2.02, 10.73], d = 0.59.
Clinical Versus Healthy Population
Last, we investigated the hypothesis that compliance would be lower in clinical populations than in healthy populations. To do so, we compared studies that included only healthy participants with clinical studies. We did not find any difference between these samples in the compliance rate, t(470.16) = 0.51, p = .613, 95% CI [−1.85, 3.12], d = 0.05, or in the percentage of nondropouts, t(251) = 0.06, p = .951, 95% CI [−2.68, 2.85], d = 0.01. The clinical samples often included not only individuals with a mental disorder but also healthy control participants. We, therefore, additionally tested for whether the relative percentage of healthy controls in clinical studies was related to compliance (see Table 1). The results showed that the percentage of healthy controls was positively related to the compliance rate. By contrast, it was unrelated to the percentage of nondropouts.
Exploratory Analyses
Feedback
A total of 63 studies (13%) reported that they promised individual feedback to the participants. We explored whether compliance was higher in studies in which participants could receive individual feedback. The comparison revealed no difference in the compliance rate between studies with feedback compared with studies without feedback, t(479) = 0.64, p = .523, 95% CI [−2.53, 4.97], d = 0.09. The percentage of nondropouts also did not differ between these study groups, t(252) = −0.85, p = .397, 95% CI [−5.59, 2.22], d = 0.15.
Age
Age was not related to the compliance rate (r = .04, p = .387) or to the percentage of nondropouts (r = −.10, p = .121).
Sex
The percentage of female participants was not related to the compliance rate (r = .04, p = .410) or to the percentage of nondropouts (r = .00, p = .958).
Mode of Incentive
In some studies, the incentives (e.g., money, vouchers, course credit) were given irrespective of the level of compliance, whereas in other studies, a certain level of compliance must have been achieved for the incentive to be given. There was no difference regarding the compliance rate between those studies, t(112.05) = −1.37, p = .174, 95% CI [−7.05, 1.29], d = 0.23. In contrast, the percentage of nondropouts was higher when the incentive was linked to a certain degree of compliance, t(32.51) = −2.30, p = .028, 95% CI [−15.97, −0.97], d = 0.60. We therefore checked whether the mode of incentive moderated the group differences between studies that promised a certain incentive versus studies that did not promise this incentive. There was no interaction between the mode of incentive and the kind of incentive or the amount of financial compensation in predicting the percentage of nondropouts (all |t|s ≤ 1.62, all ps ≥ .110).
Discussion
The aim of the present study was to investigate possible predictors of compliance in AA studies with diverse samples and study designs. The average level of compliance was rather high and similar to previous meta-analyses and systematic reviews (de Vries et al., 2020; Jones et al., 2018; Morren et al., 2009; Vachon et al., 2019). Some of the preregistered hypotheses were supported: The total number of measurement occasions and the number of study days were negatively related to the compliance rate. Moreover, clinical studies with higher percentages of healthy controls had higher compliance rates. All other hypotheses (regarding the amount of financial compensation, contact between researchers and participants during the study, length of the repeated assessments, number of measurement occasions per day, intervention study vs. nonintervention study, and clinical vs. healthy sample) were not supported by the results. One comparison even went in the opposite direction: The compliance rate and the percentage of nondropouts (i.e., the compliance) were lower in intervention studies compared with studies without any intervention.
Initially, we assumed that participants in intervention studies would be more motivated to comply with the study protocol because they benefitted from their participation. This effect (if present) may have been covered up by other characteristics that differed between the intervention studies and the “pure assessment studies.” Participating in an intervention study might come along with increased time expenditure and a personally demanding engagement with oneself. This might have increased the participant burden and in turn reduced the compliance.
Previous studies have shown that a higher participant burden due to a longer AA period was associated with diminished compliance (Comulada et al., 2015; de Vries et al., 2020; Fuller-Tyszkiewicz et al., 2013). Our findings were in line with those results: We found that a larger total number of scheduled measurement occasions and a larger number of study days were associated with a reduction in the compliance rate. The size of those associations was rather small. However, the length of the AA period should be carefully determined to optimize the compliance, especially when it is anticipated that the compliance level would be low due to other factors. The other indicators of participant burden (duration of measurement occasions, number of measurement occasions per day) were not associated with the compliance. Consistent with those results, experimental AA studies (Eisele et al., 2020; Hasselhorn et al., 2021) have shown that the sampling frequency (i.e., the number of measurement occasions per day) had no effect on the compliance. Regarding the length of the AA questionnaires, previous results were mixed (Eisele et al., 2020; Hasselhorn et al., 2021), suggesting that the processes under which possible effects occur, should be further investigated in future research. It might be that participants of AA studies cope differently with the diverse design characteristics that should enhance or reduce participant burden (Hasselhorn et al., 2021). Hence, future studies should carefully determine the length of the AA period that is needed to answer the research questions. To ensure high compliance, the burden from participating in a study should not exceed a critical level. Moreover, a high participant burden might be associated with other undesirable outcomes, such as reactivity or careless responding (Eisele et al., 2020; Hasselhorn et al., 2021). Thus, it remains a challenging task to find an optimal balance between the necessary amount of data and a low participant burden.
In our study, a higher percentage of healthy controls was associated with a higher compliance rate in clinical studies. Even if this association was small, it points out that a higher effort is needed to ensure a sufficient compliance in clinical samples. Our finding is consistent with previous findings on differences in compliance between healthy participants and participants with a mental disorder (Gershon et al., 2019; Rintala et al., 2019; Vachon et al., 2019). However, this difference did not occur when comparing participants suffering from depression with healthy controls (Rintala et al., 2019). Moreover, Schiepek et al. (2016) found lower compliance rates in participants diagnosed with personality disorders compared with affective disorders and neurotic, stress-related, and somatoform disorders. Hence, the difference in complying with the study protocol seems to depend on the kind of mental disorder. More research is required to investigate the compliance-relevant differences between these disorders. This could help researchers who are interested in specific mental disorders find solutions to optimally motivate their clinical participants and, thus, to reach the best possible level of compliance.
We conducted an exploratory test of whether age and sex were associated with compliance. Age was unrelated to compliance. This finding is in line with the meta-analysis by Vachon et al. (2019), but there are also studies that found higher compliance in older participants (Morren et al., 2009; Rintala et al., 2019). Vachon et al. (2019) assumed that these different findings might be due to differences in the inclusion criteria (e.g., specific sample, specific presentation form of AA questionnaires). Sex was also unrelated to compliance in the present study. This is inconsistent with previous findings that female participants were more compliant than male participants (Rintala et al., 2019; Vachon et al., 2019). However, there are also findings from single studies that showed no difference in compliance between female and male participants (e.g., Courvoisier et al., 2012; Hartley et al., 2014). It seems that whether there is a sex difference in compliance or not depends on other study or sample characteristics. More research is needed to identify the conditions under which sex differences occur.
We expected that a larger amount of incentives and contact between researchers and participants would be two motivation strategies that could help improve compliance. However, our results did not support these assumptions. Contacting participants during the study might have other positive effects, such as resolving technical issues, but it does not seem to increase compliance. The amount of financial compensation was also unrelated to compliance. This is in line with the findings from de Vries et al. (2020) who found no difference in the compliance levels between studies with or without incentives. However, exploratory analyses have shown that the common strategy of linking the incentive to a certain degree of compliance helps increase the percentage of nondropouts (but not the compliance rate). Furthermore, it might be the case that some study characteristics that are known before starting the study (e.g., the amount of incentives) unfold their positive effect before the study rather than during study participation. Thus, the positive effect might not emerge in a higher compliance but in a greater willingness to participate in the first place (e.g., Sharp et al., 2006).
Strengths and Limitations
The present analyses included up to 481 studies. This enabled us to compare a wide range of different study characteristics and sample characteristics. Thus, we followed the demand for an investigation of predictors of compliance in AA studies with more variability in design characteristics (Rintala et al., 2019).
Before we began collecting the data (i.e., the study selection and information coding), we computed the required sample size to achieve a sufficient level of statistical power. However, most analyses were based on a subsample of studies because of missing information. Thus, the statistical power was in fact somewhat lower for some analyses. These analyses should be interpreted with caution. Regarding the missing information, several studies did not report any information about the number of measurement occasions. Hence, they had to be excluded from the analyses because no compliance rate could be computed (see Figure 1). Stone and Shiffman (2002) already highlighted the importance of reporting compliance information. We want to emphasize this point and recommend that researchers report compliance whenever they report the results of an AA study.
The present study focused on studies on the topics of affect and well-being. Hence, the generalizability of the current results to other topics is unknown. However, it seems implausible that the results were strongly affected by the topics of the studies. Nevertheless, this assumption should be investigated in future studies.
A lot of studies reported a percentage of nondropouts of (nearly) hundred. This led to a negatively skewed distribution that might have reduced the associations with other variables. Hence, the true associations between the independent variables and the percentage of nondropouts were likely underestimated.
Our study design allowed only correlational conclusions. Thus, it is not possible to interpret the associations between study and sample characteristics and compliance in a causal manner. There might be confounding variables that were not considered (e.g., educational or socioeconomic background of study participants). This limits the explanatory power of some results, for example, the findings regarding the kind of incentive because some incentives are used only in studies with students. A valuable supplement might be experimental studies that vary certain design characteristics (e.g., the number of daily measurement occasions or the length of the repeated questionnaires) and then compare the compliance levels of these groups. Such studies could circumvent another drawback of our study: The information that was entered into our analyses was aggregated in nature (e.g., the mean compliance across participants and across time). In experimental studies, intraindividual change in compliance can be modeled (including time-of-day effects or day-of-the-week effects; Rintala et al., 2019) and can be predicted by the experimental factor or by individual characteristics.
Conclusion
Most of the preregistered hypotheses were not supported by the results. Thus, it seems that compliance is not that prone to some researchers’ decisions regarding study characteristics or sample characteristics that have been made in the hope that data quantity and quality will be high. Nevertheless, the results suggest that the length of the AA period (number of scheduled measurement occasions and number of study days) should be chosen carefully to optimize compliance. Moreover, money as an incentive seems to work better than course credit or vouchers in optimizing compliance. Another practical recommendation is that linking the incentives to a certain degree of compliance might reduce the dropout during the AA period. However, such recommendations are based on correlational data and should be complemented by experimental studies.
The present research focused solely on predicting the compliance of study participants. It would be interesting for future studies to complement these results by predicting individuals’ reasons for participating in an AA study. This might also be affected by study characteristics (e.g., amount of incentives, length of AA period) and sample characteristics (e.g., clinical vs. healthy sample, age, sex).
Footnotes
Declaration of Conflicting Interests
The author(s) declared no potential conflicts of interest with respect to the research, authorship, and/or publication of this article.
Funding
The author(s) received no financial support for the research, authorship, and/or publication of this article.