
Abstract
Continuous norming is an increasingly popular approach to establish norms when the performance on a test is dependent on age. However, current continuous norming methods rely on a number of assumptions that are quite restrictive and may introduce bias. In this study, quantile regression was introduced as more flexible alternative. Bias and precision of quantile regression-based norming were investigated with (age-)group as covariate, varying sample sizes and score distributions, and compared with bias and precision of two other norming methods: traditional norming and mean regression-based norming. Simulations showed the norms obtained using quantile regression to be most precise in almost all conditions. Norms were nevertheless biased when the score distributions reflected a ceiling effect. Quantile regression-based norming can thus be considered a promising alternative to traditional norming and mean regression-based norming, but only if the shape of the score distribution can be expected to be close to normal.
Both in psychology and education, norms are essential for understanding test performance from a substantive point of view. Without normative information, both professionals and the test takers themselves cannot obtain a meaningful picture of how well the test taker scores on the measured attribute (see, e.g., Downing & Haladyna, 2006; Linn, 2000). Test norms can be either criterion-based or reference-based. Criterion-based norms are based on predefined performance levels. A criterion-referenced norm might, for instance, be that 60% of the items has to be answered correctly to pass the test. A person’s performance is thus evaluated independent of the performance of other persons. In reference-based norming, the person’s performance is evaluated relative to others. For example, using relative norms, we may conclude that a person’s score is among the 5% highest scores in the population. Therefore, reference-based norms are based on the distribution of scores in the population or norm group (Downing & Haladyna, 2006). Reference-based norms are very common, with examples including percentile ranks and normal curve equivalents (Oosterhuis, Van der Ark, & Sijtsma, 2015; Seo, Little, Shogren, & Lang, 2015; Van der Elst et al., 2013).
A prerequisite for using relative norms is a well-defined reference population. Norm groups can be defined from broad to very specific. For instance, a broad norm population may include all possible testees. In other cases, however, one may want to compare a person with a well-defined subpopulation with similar background characteristics, for example, only males or females, or only persons with a certain psychological disorder. These are examples in which the population is divided in a few subgroups and norms can be derived per subgroup. However, the desired norm groups may also depend on a continuous background variable, most often age or a proxy of age, such as grade level. For example, when interpreting the performance on a vocabulary test, it is only meaningful to compare children with other children of the same age. Whether test norms should be differentiated with respect to certain background characteristics such as gender or age should be determined by taking theoretical, practical, and statistical arguments into consideration.
This article focusses on the construction of age-specific norms. Different methods for the development of age-specific norms were proposed in the literature (e.g., Angoff & Robertson, 1987; Seo et al., 2015; Tellegen & Laros, 1993; Van der Elst et al., 2013; Zachary & Gorsuch, 1985; Zhu & Chen, 2011). Most of these methods rely on quite restrictive assumptions and their application is therefore not entirely risk-free. An urgent need thus exists for research on the practicality and effectiveness of current continuous norming methods. Moreover, new norming methods are needed which are more robust and can flexibly be used in different applications. In the present study, we introduce quantile regression as an innovative continuous norming method and compare its performance with two popular alternatives: traditional norming and mean (linear) regression-based norming. The article is organized as follows. First, we explain the traditional approach and regression approach. Second, we introduce quantile regression and argue why it is more flexible than current methods. Third, we present the results of a simulation study, and we end with a discussion.
Background
For the development of test norms, one needs information about the conditional distribution of the test scores given the chosen set of covariates. Traditionally, the continuous covariate of interest (age) is first split into a limited number of discrete groups. Data are then collected in samples from each group and the norms are subsequently determined for each group separately. The traditional norming method thus amounts to a discretization of the continuous background variable. This approach has two important drawbacks (Bechger, Hemker, & Maris, 2009; Oosterhuis et al., 2015; Van Breukelen & Vlaeyen, 2005; Zhu & Chen, 2011). First, it may result in undesirable differences in normed scores between individuals. For example, two persons with the same raw test score but with a minimal age difference may be assigned to different age groups and thus receive different normed scores. This phenomenon is known as the edge of cohort effect. Second, many observations are required to obtain norms that are sufficiently precise for each (age) group. Exactly how many observations are needed depends on the “stakes” or purpose of the test, but in general a total of 300 observations or more are required per group to obtain norms that are sufficiently precise (see, e.g., Charter, 1999; Evers, Lucassen, Meijer, & Sijtsma, 2009). Moreover, a reciprocal relationship exists between the edge of cohort problem and the required number of observations. Merging groups to decrease the required total number of observations may increase the edge of cohort problem, and vice versa, increasing the number of age cohorts to alleviate the edge of cohort problem results in larger sample-size requirements.
In light of these two drawbacks, Zachary and Gorsuch (1985) first introduced a regression-based norming approach as an alternative, also known as continuous norming, which has been further developed by other researchers (Angoff & Robertson, 1987; Seo et al., 2015; Tellegen & Laros, 1993; Van der Elst et al., 2013; Zhu & Chen, 2011). In regression-based continuous norming, a regression model is used to derive norms as a function of continuous covariates such as age. However, the methods differ at the level at which they apply regression analysis. Zachary and Gorsuch (1985; see also Zhu & Chen, 2011), first create groups, then compute the mean and other moments (standard deviation, skewness, and kurtosis) per group, and finally regress these moments on age midpoints to obtain the norming functions. Van der Elst et al. (2013; see also Oosterhuis et al., 2015) first regress the tests sores on the covariate to obtain the conditional mean, then compute the residuals and use the residuals to determine the conditional standard deviation and the norms. The estimated moments of the group-specific score distributions can then be converted into normed scores such as percentiles or normal curve equivalents.
Continuous norming potentially solves the edge of cohort problem and produces more precise norms than the traditional norming method. First, continuous norms are based on models that assume a smooth monotone continuous relationship between the test scores and the covariate. This avoids sudden jumps between the norms for different groups and alleviates the edge of cohort problem, as long as the grouping results in meaningful groups to accurately represent the relationship between test performance and covariate. Second, continuous norming uses the observations of all persons in the sample to derive the norms for a subgroup. As a consequence, continuous norming uses the observations more efficiently than traditional norming, which generally results in more precise norms (e.g., Bechger et al., 2009; Oosterhuis et al., 2015). Alternatively, the same precision can be realized with smaller sample sizes and lower costs.
We want to point out that even though the covariate age is theoretically a continuous variable, and could be modeled as such, in practice age is measured discretely (days, months, and years) and some form of grouping is almost always desired for practical test use and substantive reasons. For example, student monitoring systems (SMS’s) may use grade-based age windows (i.e., students who are at the same grade) when interpreting test scores. We propose to apply the continuous norming methods using measurements of age that align with the intended test use. For example, if norms are required for each age year and age is measured in days, persons with different birth dates but the same age in years are grouped together, and these age groups are then used in the regression. Therefore, we will assume that there is some form of grouping.
Although continuous norming can effectively deal with the drawbacks of the traditional method of norming, the application of a continuous norming method is not entirely risk-free. That is, the efficiency in continuous norming is obtained through assumptions and it is uncertain whether these assumptions hold. It is generally assumed, for instance, that test scores have a normal distribution within each covariate group, and that for all covariate groups the test scores have the same within-group variance (i.e., homoscedasticity). In practice, the assumptions of normality and homoscedasticity are violated quite regularly, for instance in tests with floor or ceiling effects at the extremes of the test score distribution (Lenhard, Lenhard, Suggate, & Segerer, 2016; Marsman, Maris, & Bechger, 2012). In addition, it is often assumed that the means and standard deviations for the different covariate groups can be estimated equally accurate. This is not true, however, if the number of observations varies with covariate group. In light of these potential causes of bias in the norms, we sought an approach that solves the problems of traditional norming, but better accounts for (a) nonnormal shapes of the score distribution and (b) different numbers of observations among covariate groups. A specific form of regression analyses, in the literature also known as quantile regression (Koenker, 2015), provides opportunities.
If quantile regression is used as continuous norming method, the required (theoretical) percentile ranks are directly estimated as function of (age) group, rather than approximate the mean, standard deviation, and sometimes higher order moments of the score distribution by a polynomial to obtain the percentile ranks in a second step. This approach offers a number of advantages as compared to the common ways of continuous norming. First, the analysis automatically accounts for unequal sample sizes within each covariate group. Second, quantile regression results are less prone to outliers and deviations from the normal distribution. Finally, in quantile regression, we directly attempt to deduce the information we are most interested in. In SMS’s, for instance, test developers and teachers want to know in which quintile or decile a student performs. In selection tests, cut scores are sometimes expressed in terms of a percentile rank. Such information can directly be obtained by using quantile regression without the necessity of making specific assumptions about the shape of the score distribution and/or the trend in means and standard deviations. The application of quantile regression is thus promising when it comes to the development of age norms, but to date, it has not yet been used in the context of test norming. The practicality and effectiveness of quantile regression-based norming is not tested yet, and it is not clear if, and if so in which applications, quantile regression outperforms other (continuous) norming methods that have been described in the literature. These characteristics were studied using simulations. In the present study, we used quantile regression as method to develop age norms and evaluated its performance in relation to two common alternatives: traditional norming and mean (linear) regression-based norming. By conducting a series of simulations, we examined the bias and precision (see, e.g., Lindgren, 1993) of the three norming methods in different conditions.
Simulation Study
Norming Methods
In general, to develop norms for different groups of persons, one needs information about the distribution of the test scores for all relevant subgroups based on the
Traditional Approach
According to the traditional norming method, groups are first defined based on the covariate of interest. Data are then collected for samples from each covariate group, which provides the estimates of
Mean Regression
The mean regression-based norming method creates norms by regressing the test scores on

where parameters

in which

One may choose to linearly transform the standardized residuals to a scale with mean µ and standard deviation σ, or instead, the percentile values from the distribution of the observed residuals can be used as norming.
Quantile Regression
For the quantile regression method, a regression model is determined for each percentile of interest. Let

where * indicates that the regression coefficients are different from those obtained with mean regression. Estimates of the regression parameters in Equation 4 are obtained by minimizing the weighted absolute residuals, that is,

where

The predicted values for the percentiles given the covariate values provide normative data to which persons can be compared. For example, given a particular person, one can determine whether his or her score is within a particular percentile range (e.g., between the 10th and 25th percentile).
Data Generation
The simulations were designed within the context of the Dutch Cito SMS for elementary education. In that system, students are routinely monitored from grade 1 (6- to 7-year-olds) through Grade 6 (11- to 12-year-olds) on several cognitive domains such as mathematics and reading comprehension. For each domain, item response theory calibrated item banks are available to evaluate the progress of individual students from year to year in relation to the progress of other students. For the simulations, we used SMS in mathematics as an example and considered the situation that separate norms are needed for six increasing grade levels.
In the SMS, students receive a well-chosen selection of items from an item bank of 300 items according to their grade level. Based on their performance on the selected items, they receive a score on the entire item bank as if they completed all items. Our simulations were based on the entire mathematics item bank, as if the students actually completed all items in the bank, in order to minimize the confounding influence of item selection on bias and precision. The mathematics item bank consists of 300 items which are calibrated by the one parameter logistic model (OPLM; Verhelst & Glas, 1995). We used this model for data generation as well. The OPLM is a Rasch model with varying item discrimination values which are predefined by the user and therefore treated as known. Let
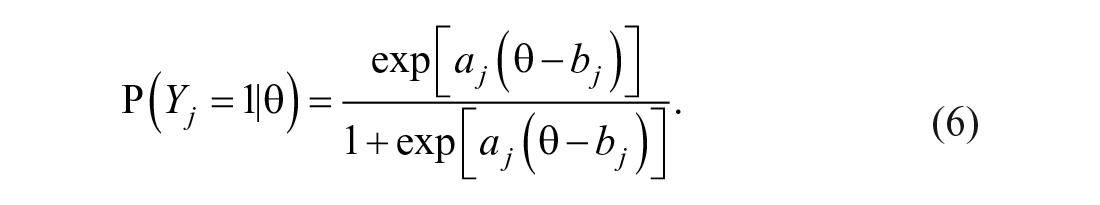
Because the item discrimination parameters are treated as known, the weighted sum score is a sufficient statistic for the ability parameter θ in this model.
Test scores were generated as follows. For all conditions in the simulation setup described below, true scores were first drawn from the conditional test-score distribution and converted to latent abilities θ (see for details about the conversion, Verhelst & Engelen, 1999). These latent abilities were then used to generate responses for the 300 mathematics items using the OPLM (Equation 6). In particular, for each θ and item j, a random number
Design Factors
Data were simulated under different conditions of sample size, and conditional true-score distributions, in the following way:
Sample size. In general, 50 observations per covariate group is considered an absolute minimum for continuous norming (e.g., Bridges & Holler, 2007; Zhu & Chen, 2011). For traditional norming, 400 observations per group are advised to obtain reliable norms (Charter, 1999; Evers et al., 2009). Therefore, group-level sample sizes n were set at 50, 100, 200, 400, and 600 for all groups. For all norming methods, precision was expected to increase with sample size (see also Oosterhuis et al., 2015) and bias was expected to be unrelated to sample size.
Conditional true-score distributions. A total of 2 × 2 = 4 score distribution conditions were considered. The true score distributions either had equal standard deviations across covariate groups or a decreasing standard deviation with increasing grade. A decreasing standard deviation, also known as scale shrinkage, regularly occurs in education (e.g., Dadey & Briggs, 2012) and can be a consequence of a ceiling effect for higher grades (Aunio, Hautamäki, Heiskari, & Van Luit, 2006). The standard deviation of the highest grade was two thirds of the standard deviation of the lowest grade and the decline was linear. The true scores conditional on the covariate were further modeled using either a normal distribution or a gamma distribution. The gamma distribution was chosen to create a negatively skewed distribution for the higher grades, whereas the distributions of the lower grades were relatively symmetric. This trend reflects a ceiling effect for higher grades (Streiner, Norman, & Cairney, 2015). The different score distribution conditions are illustrated in Figure 1. The traditional norming method was expected to provide unbiased norms for all hypothesized score distributions. Whereas the mean-regression method was expected to only be unbiased for conditions with normal score distributions and equal variances in each covariate group, the newly tested quantile regression-based method was expected to outperform both the traditional norming method and the mean-regression method in terms of precision.
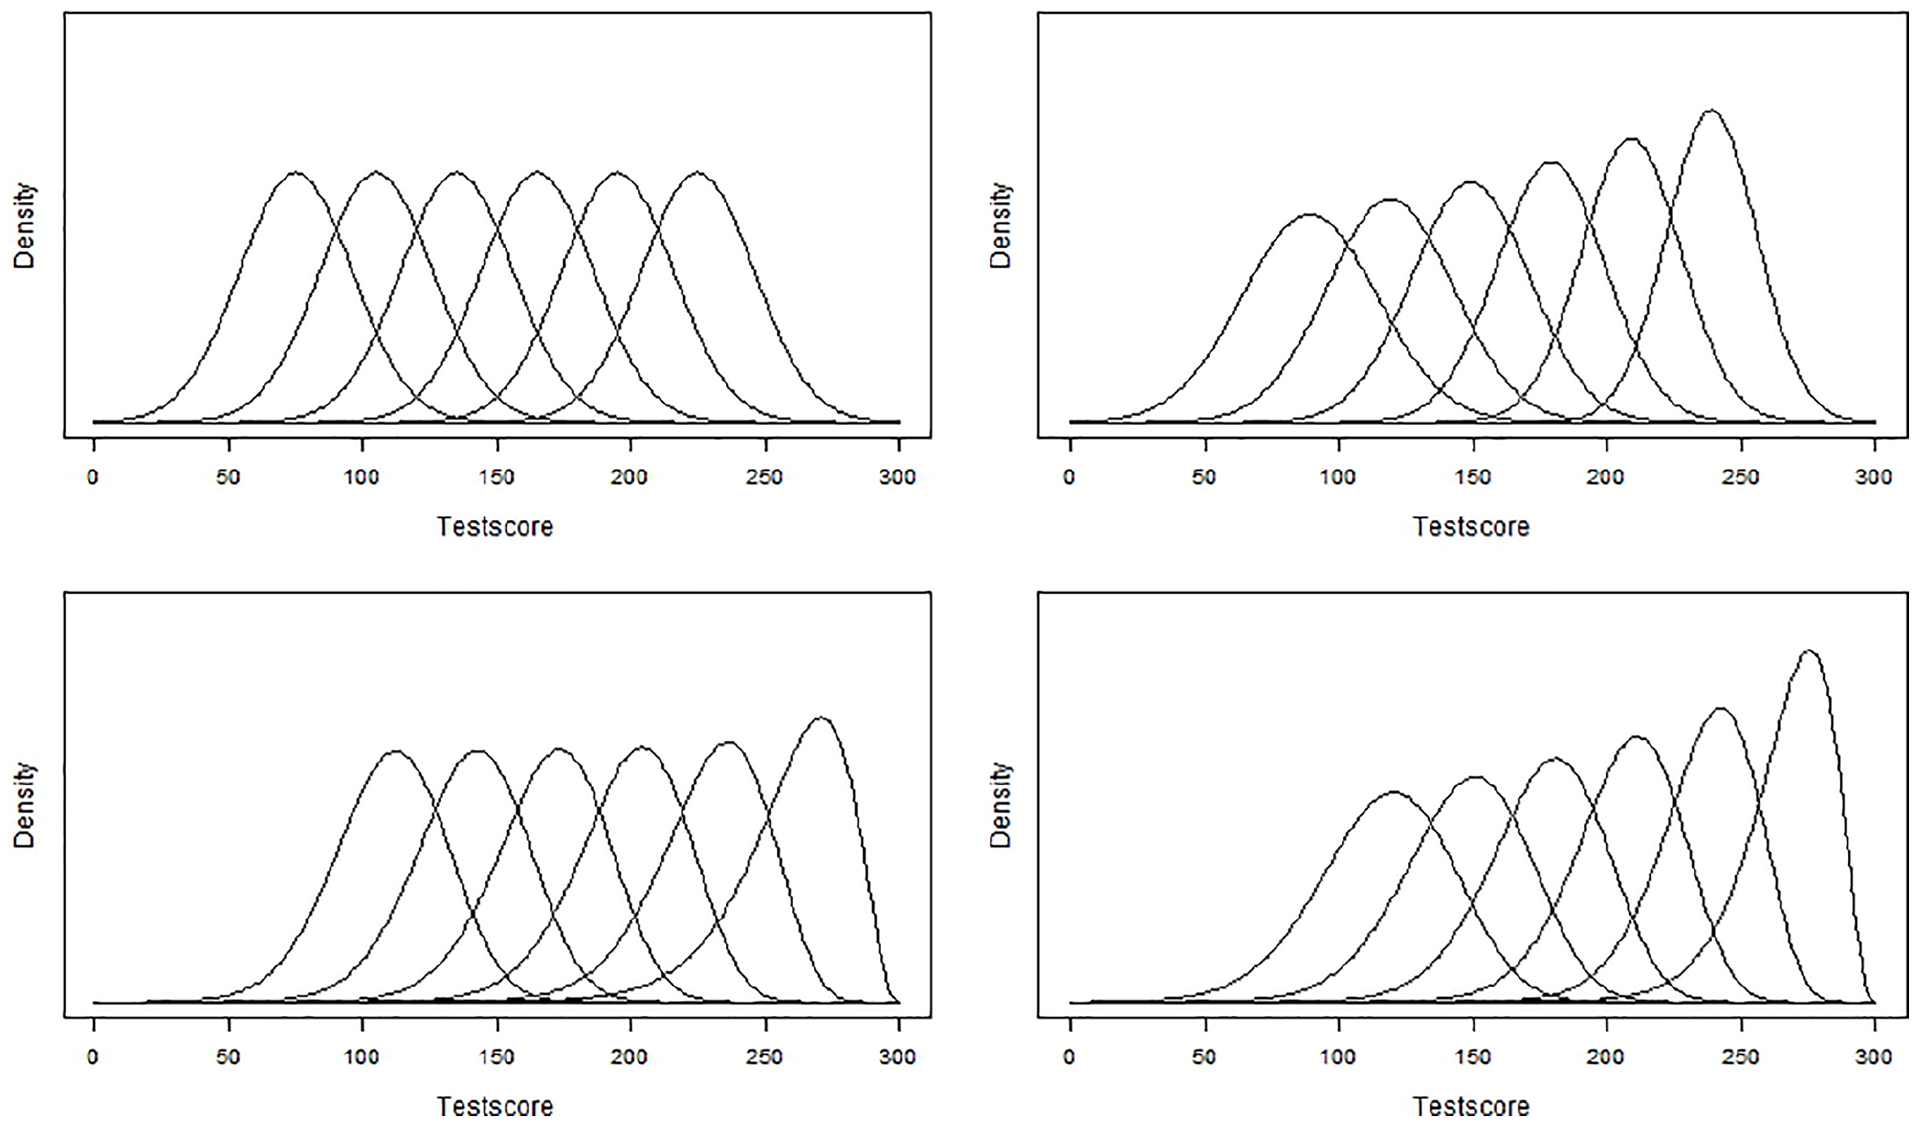
True score distributions with separate lines for the covariate groups.
A total of 5 (sample size) × 4 (score distribution) = 20 conditions were thus distinguished. In all simulations, it was assumed that test scores increased with 30 units per group/grade. That is, each group/grade was assumed to score on average 30 units higher than the previous group/grade. All input, R-code, and output of the simulation can be found in the supplementary material (available online).
Evaluation Criteria
The simulations were used to examine the bias and precision of norms resulting from traditional norming, mean regression-based norming and quantile regression-based norming in 20 different conditions. Bias was defined as the deviation between the mean of the percentile estimates over M replications and the population percentile (i.e.,

To also be able to draw conclusions on practical importance of the bias, the outcome was standardized in the following manner:
Precision was defined as standard deviation of estimated percentiles over the
Smaller values indicate higher precision. As for the bias, outcomes were rescaled to the unit standard deviation of the score distribution of the population in order to be able to interpret the precision in absolute terms:
Results
Bias
Figure 2 illustratively shows bias as a function of sample size for the 95th percentile for Group 3. As expected, sample size did not influence bias. These results are representative for all percentiles and all groups. Sample size should only affect the amount of variation around the systematic deviation and not the magnitude of the systematic deviation itself, which is exactly what is observed. For this reason, the results for bias are here only displayed for the largest sample size (i.e., n = 600 per group). This result and the other bias results can be viewed in interactive figures at https://ecrshiny.shinyapps.io/NormBias/. Another result consistent across conditions is that the traditional norming method was unbiased. This result was consistently found across all sample sizes and score distribution conditions, and naturally makes the use of the traditional norming method favorable in terms of systematic deviation.
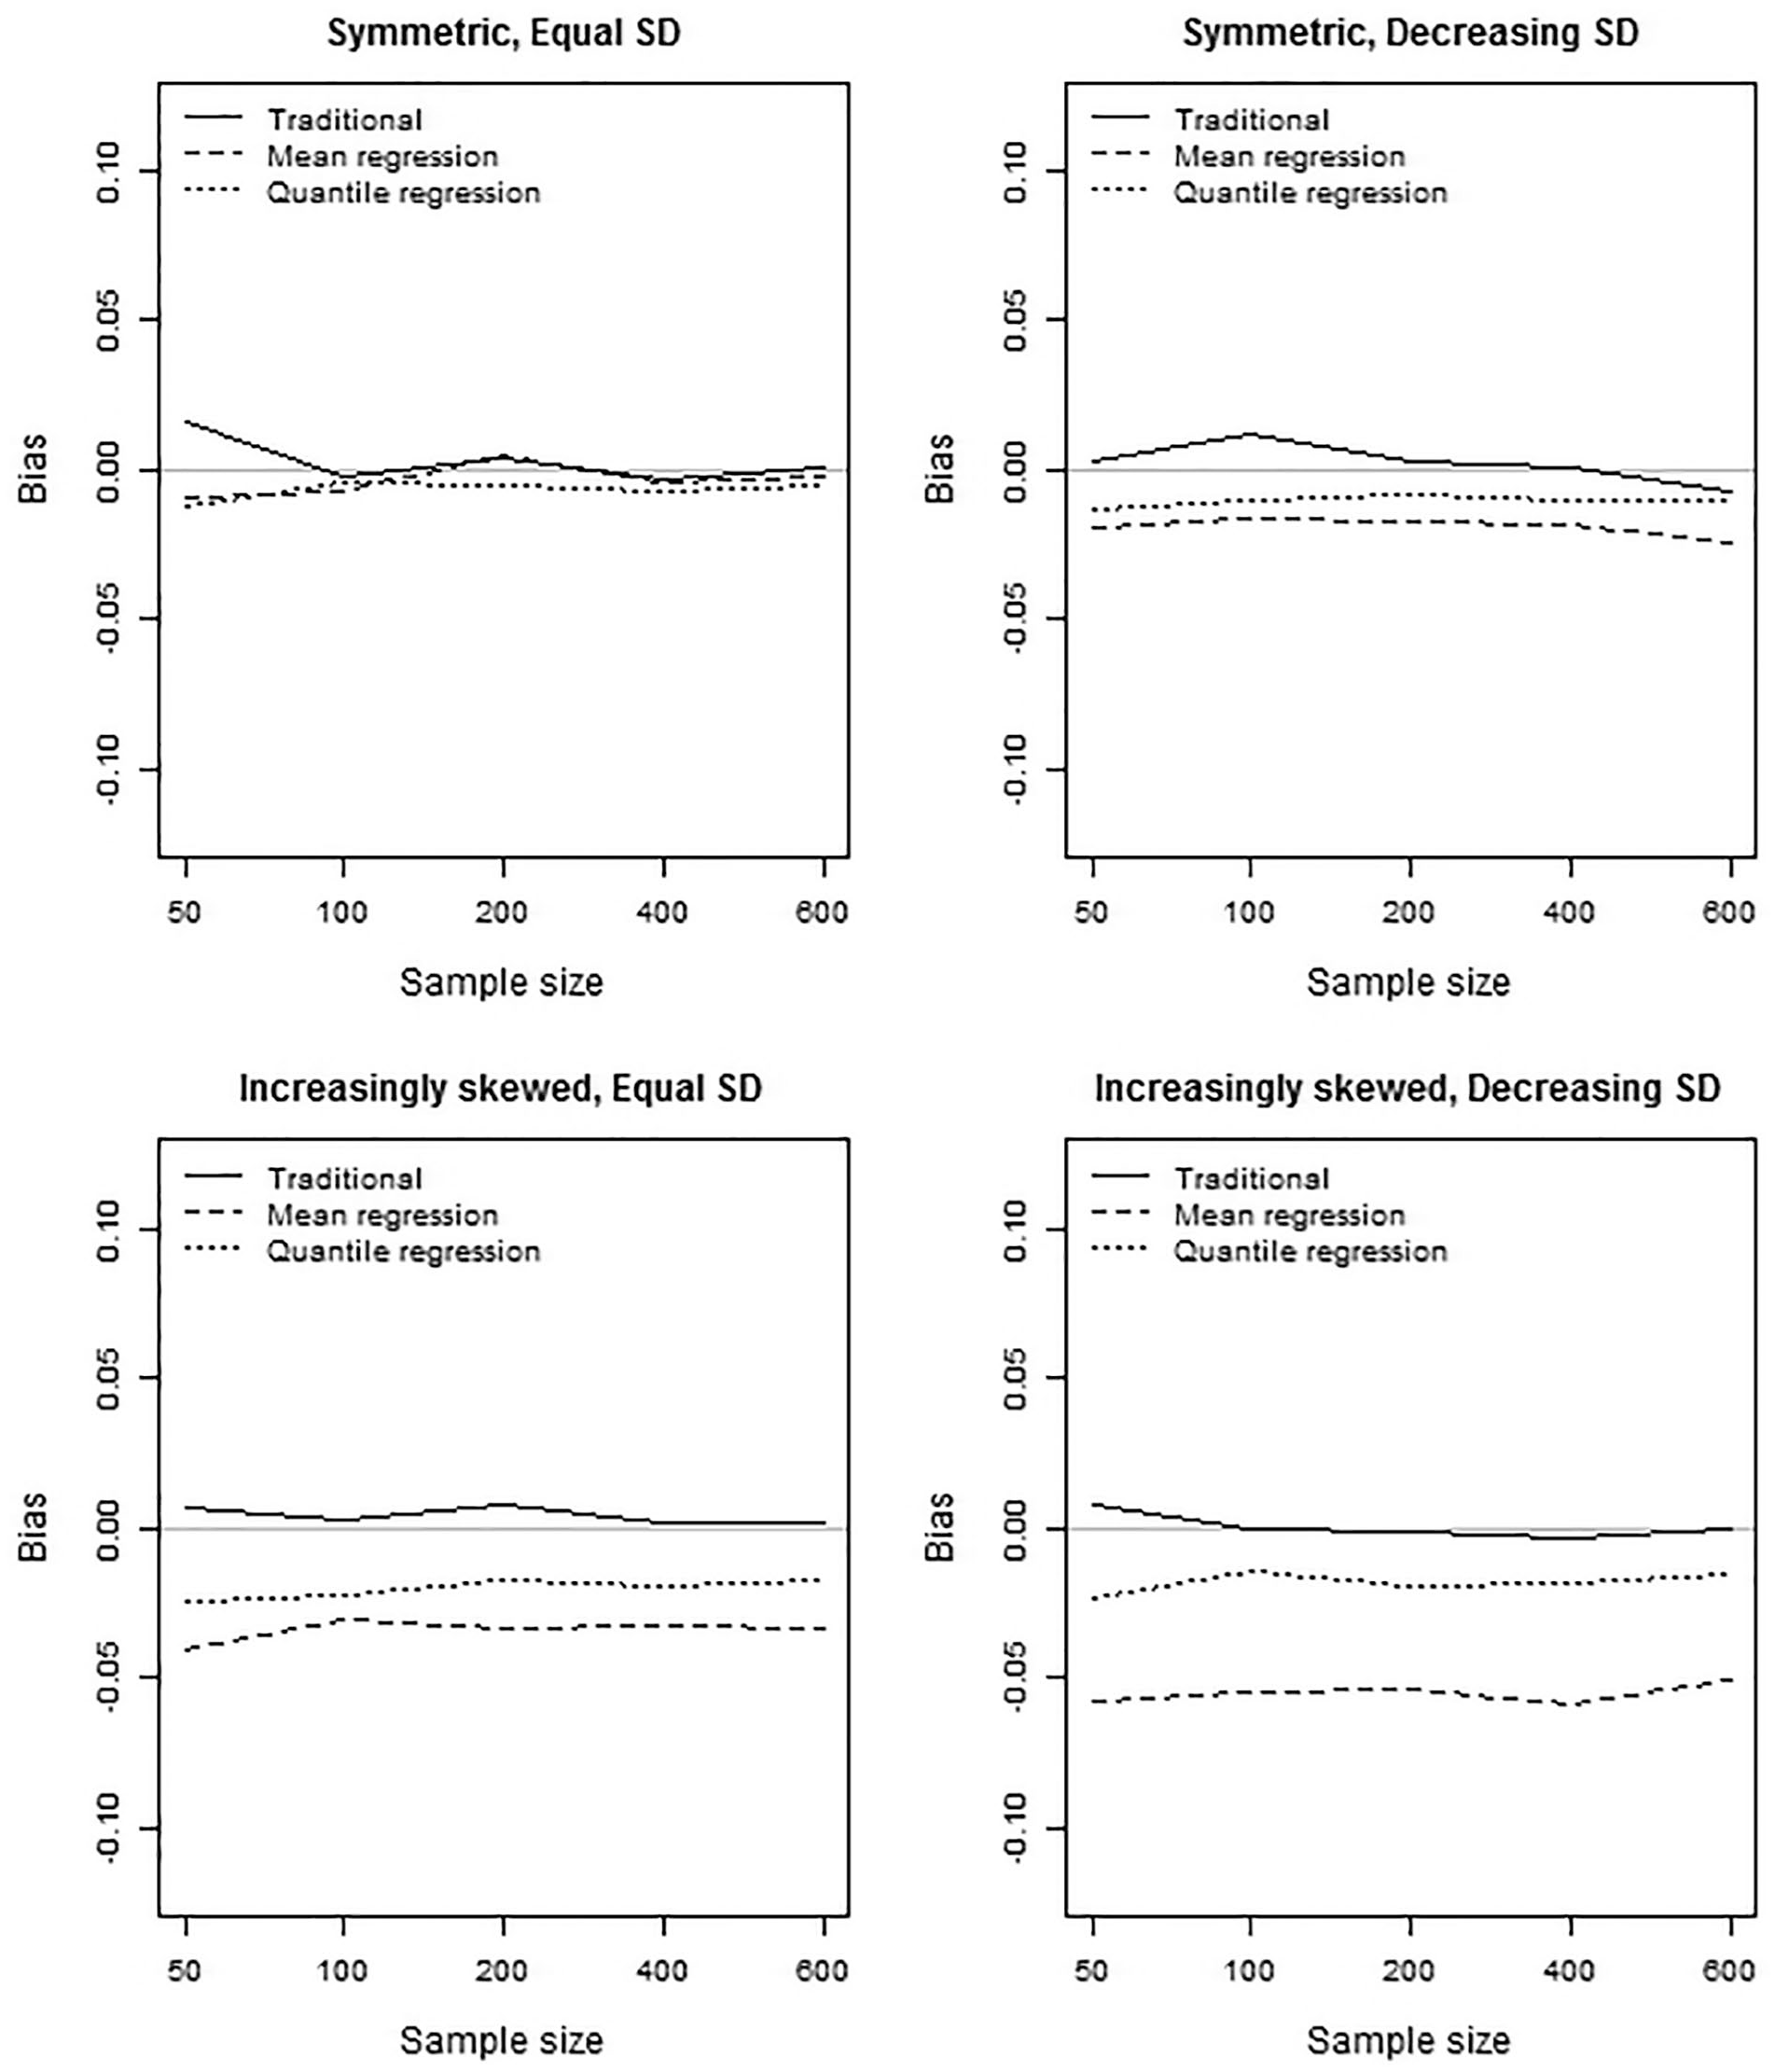
Bias of the three norming methods for four group distributions.
Although the traditional norming method was unaffected by the group-specific theta distribution, the mean regression method and the quantile regression method were affected. For the symmetric distributions, equal standard deviations across groups resulted in no bias for all three methods, whereas a decreasing standard deviation resulted in small bias (
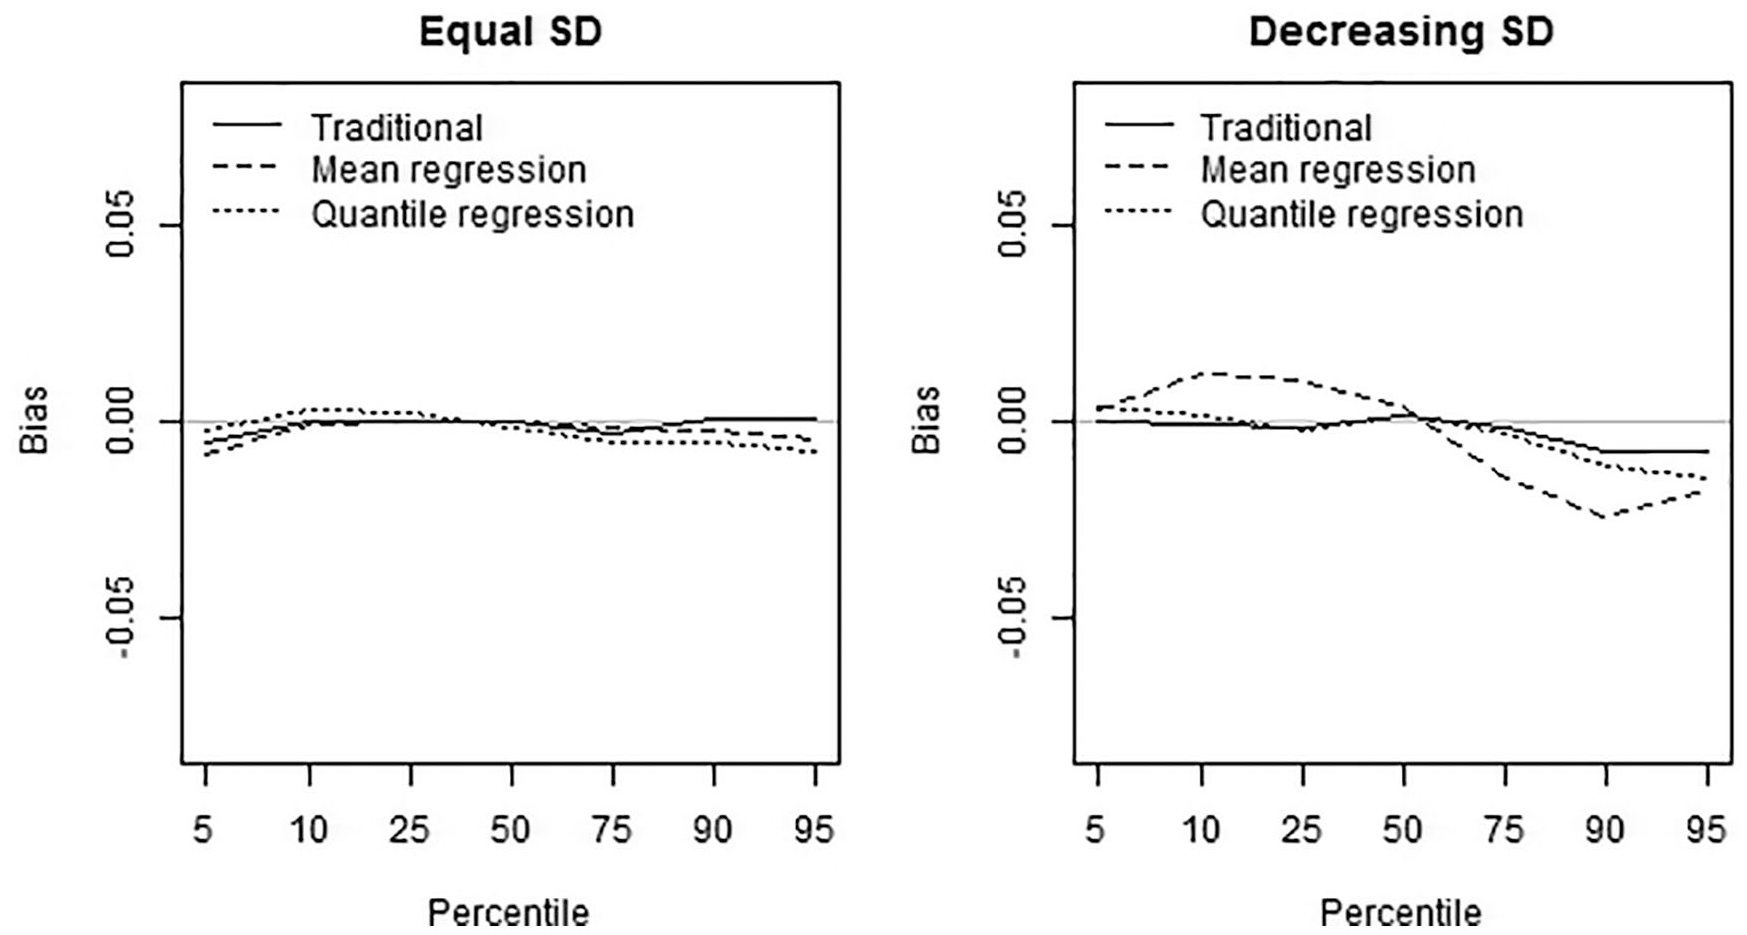
Bias of the three norming methods for 7 percentiles.
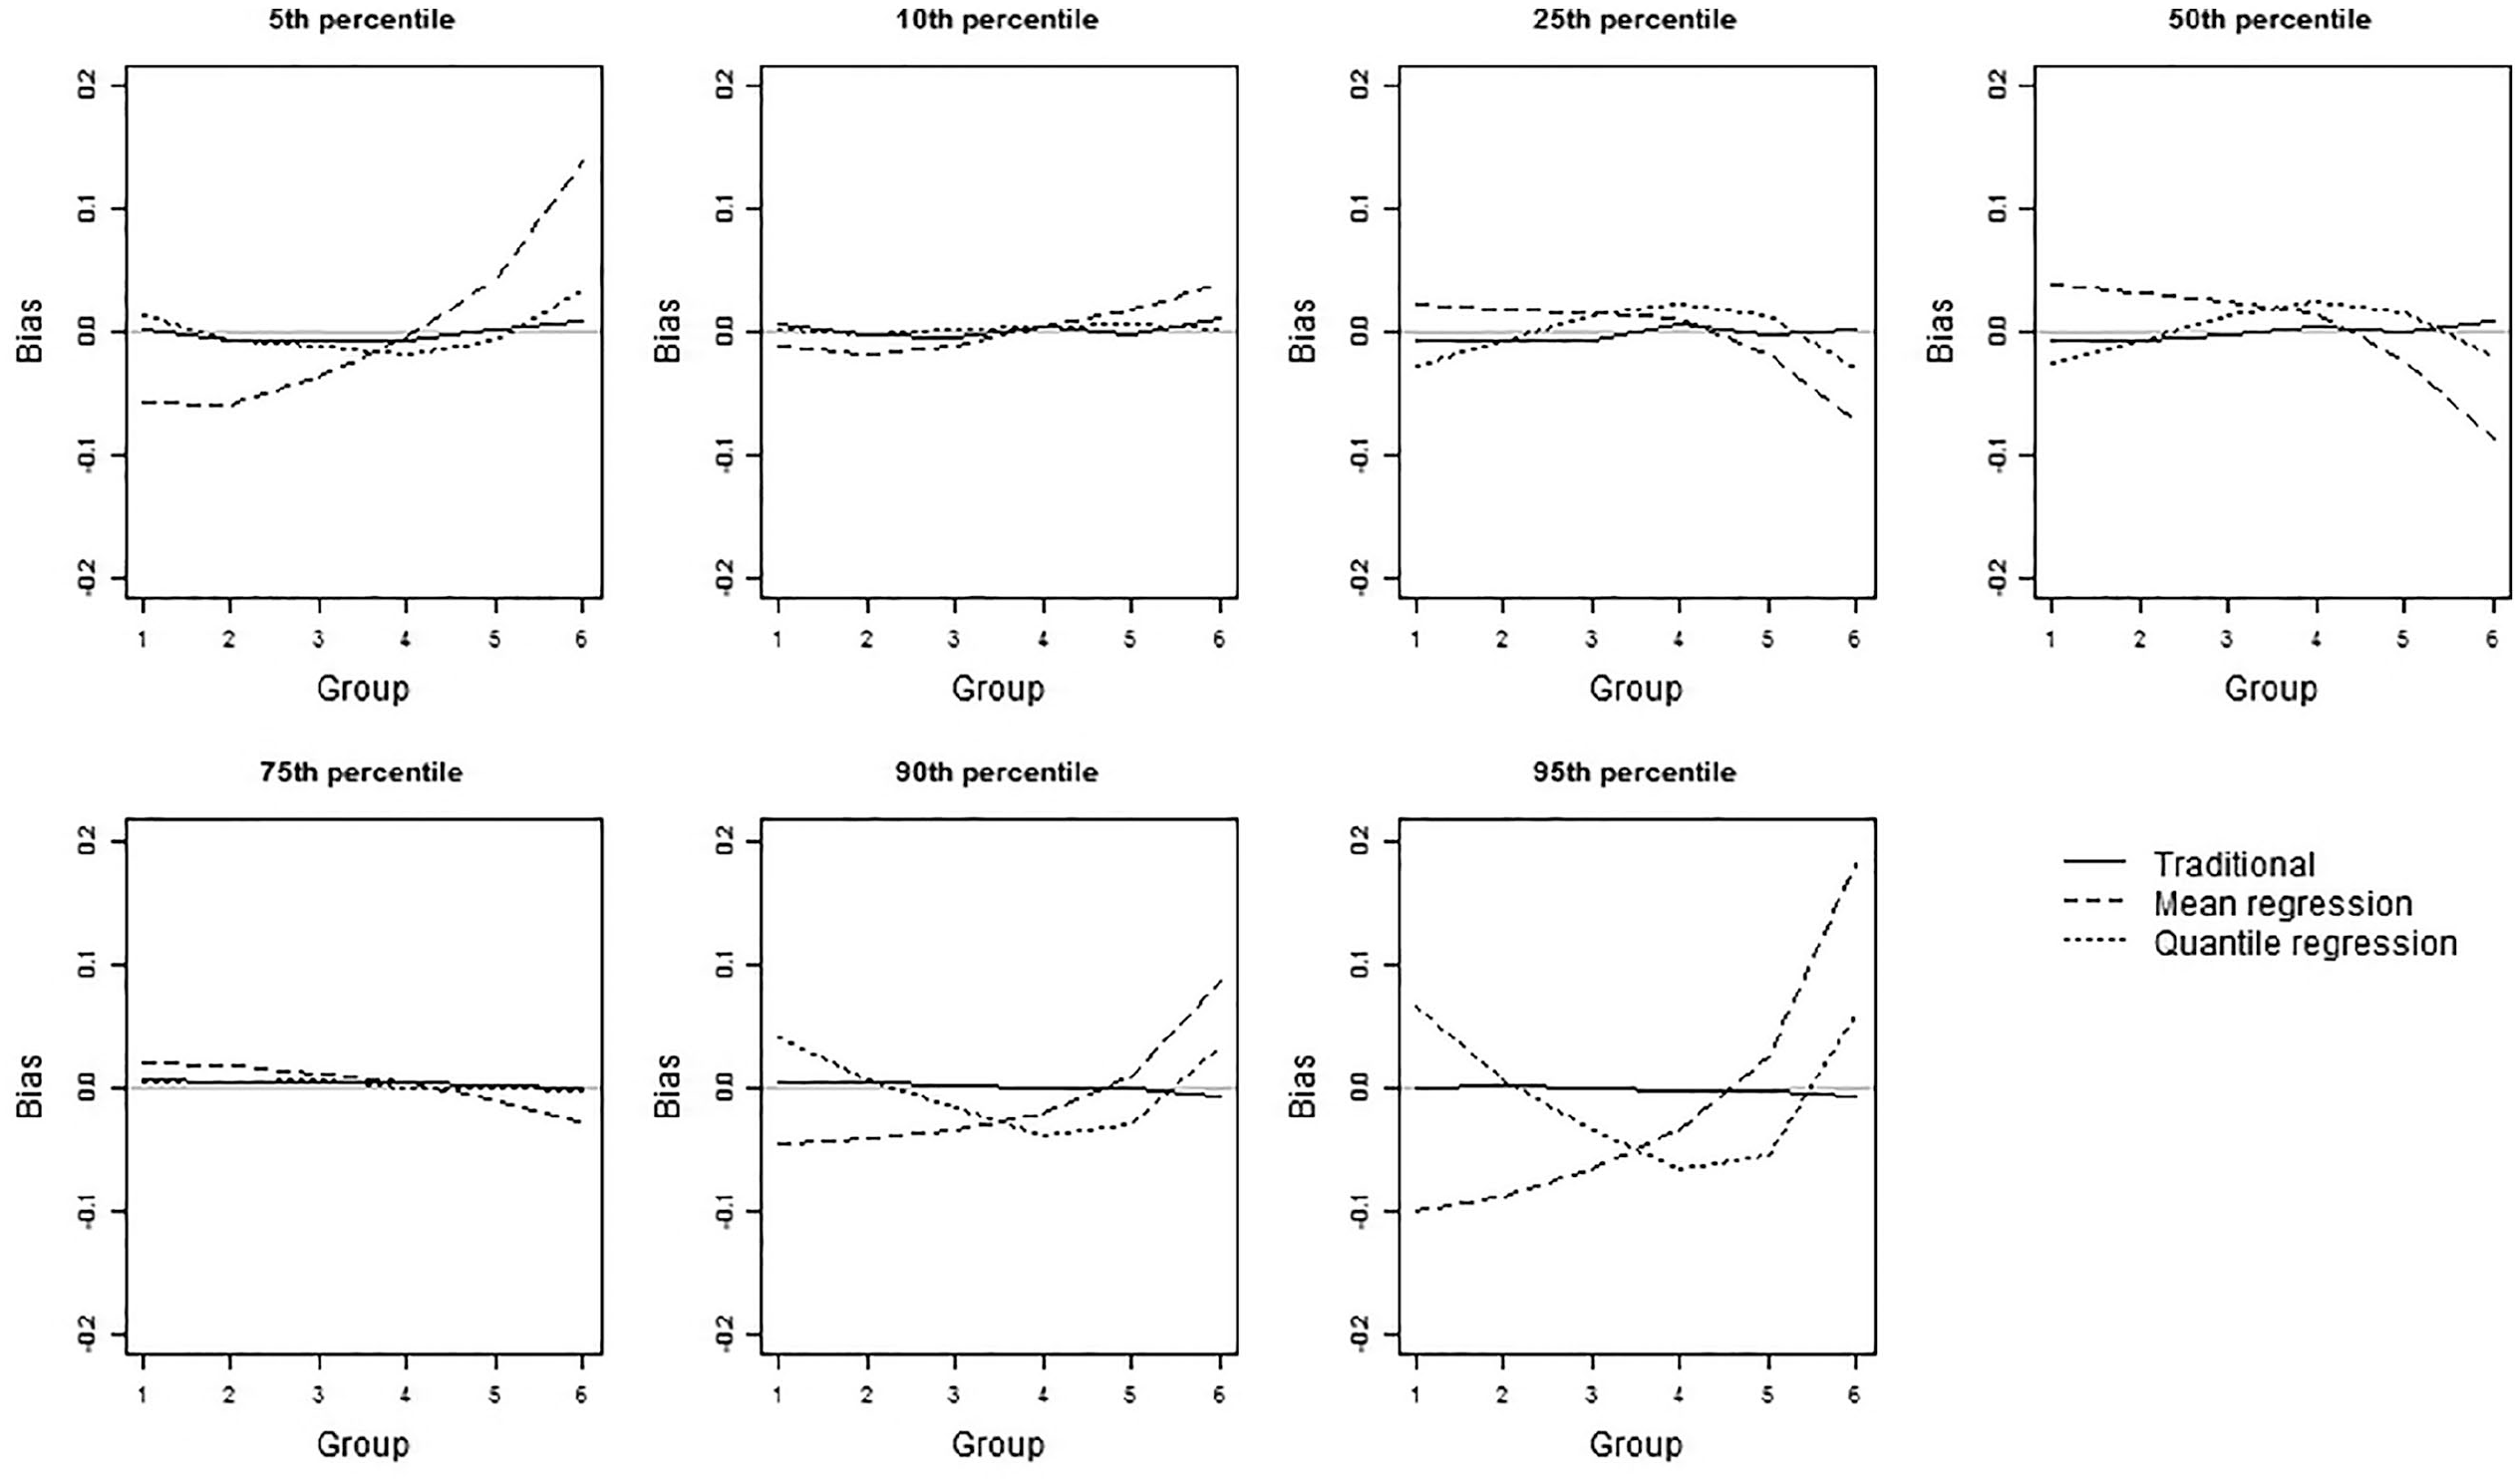
Bias of the three norming methods for 7 percentiles for increasingly skewed group distributions with equal SD.
Precision
The precision for 50 and 600 observations per group is presented in Figure 5 for several group distribution conditions and in Figure 6 for several percentiles. In general, the standard error of the traditional norming method was largest (i.e., traditional norming was least precise), followed by the standard error of the mean regression-based norming method. The quantile regression-based norming method had the lowest standard error (i.e., was most precise), but there were a few exceptions, see, e.g., Figure 7 subplot “Skew, Equal SD” with 600 observations for Group 1. In addition, precision was higher when more data surrounded the percentile due to larger sample size, as hypothesized, but also due to the shape of the score distribution. Hence, precision was highest around the median for symmetric distributions (see Figure 6) and at somewhat higher percentiles for (negatively) skewed distributions (see Figure 8). For increasingly skewed distributions, this trend also resulted in lower precision in the upper groups/grades compared with lower groups/grades for low percentiles and vice versa for the upper percentiles, because the higher groups/grades had fewer observations in the lower tail and more observations in the upper tail. Last, the absolute differences in precision between the three norming methods and the effect of the distribution on these differences turned out to be smaller with increasing sample size (see Figure 5). However, comparison of the relative precision (i.e., the precision proportional to the traditional norming method) showed that the effects of the norming methods and differences in the distributions did not interact with sample size (see Figure 7).
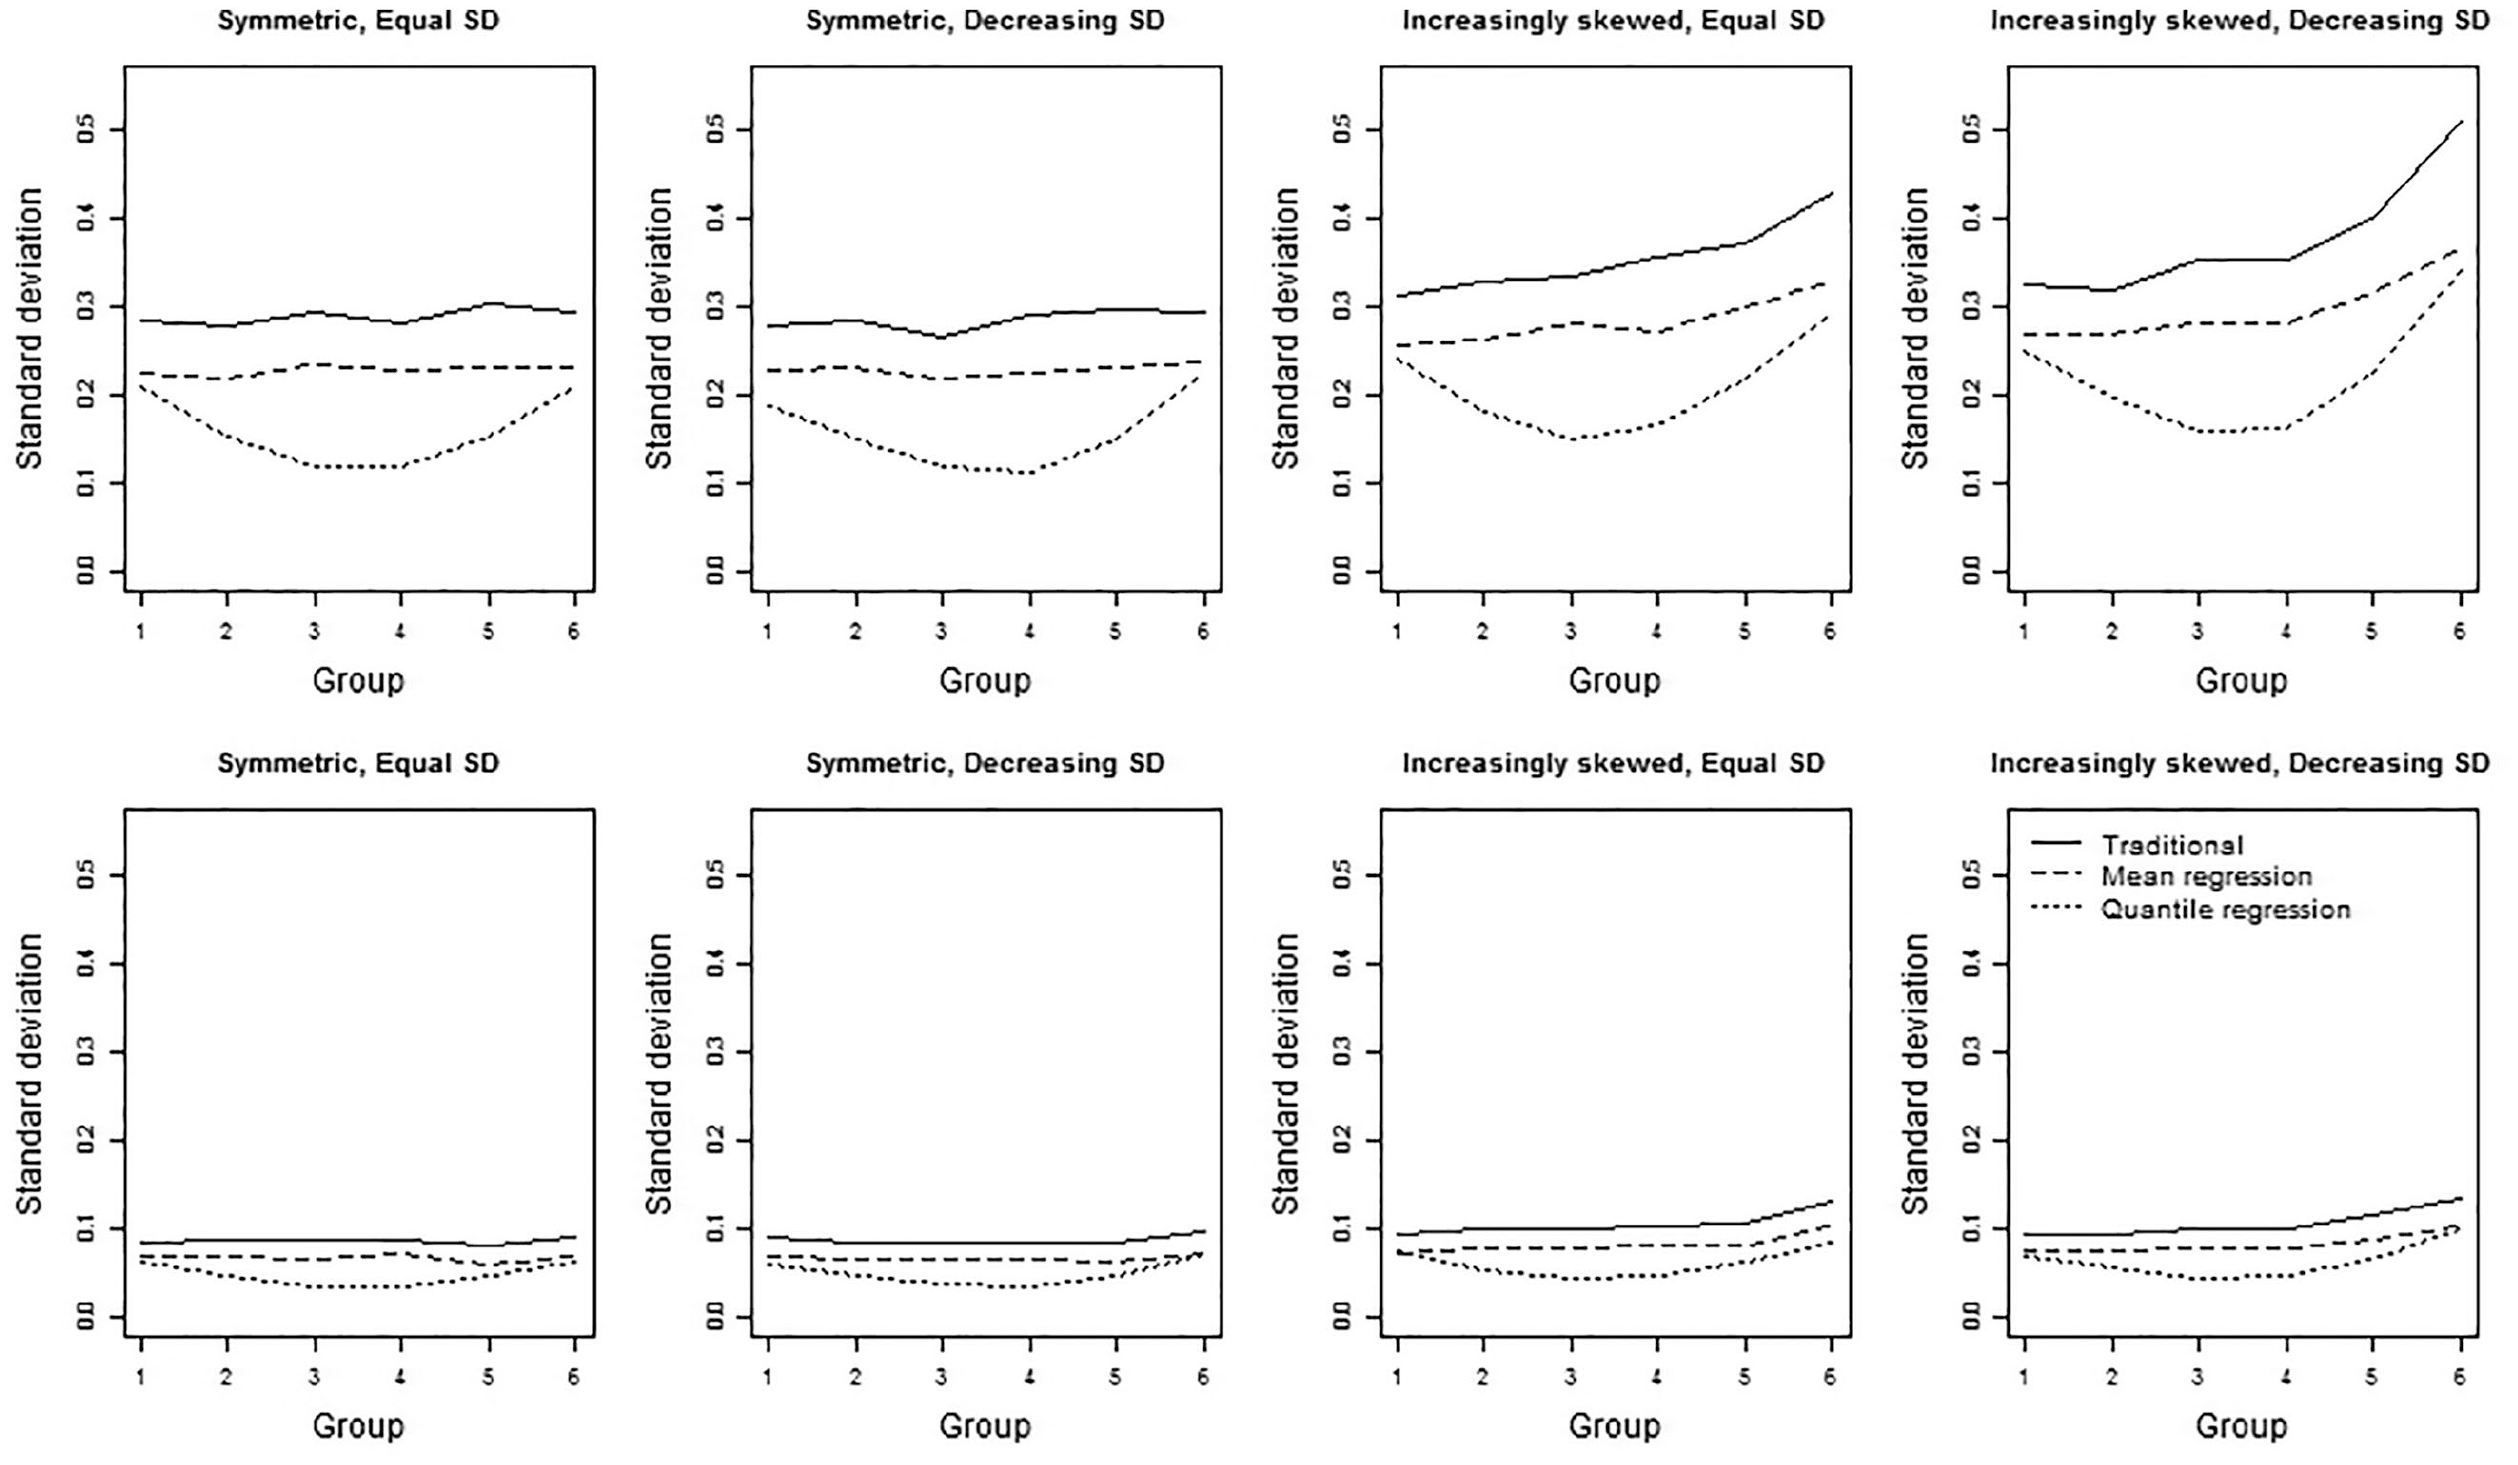
Precision of the three norming methods for four group distributions based on 50 (first row) and 600 (second row) observations per group.
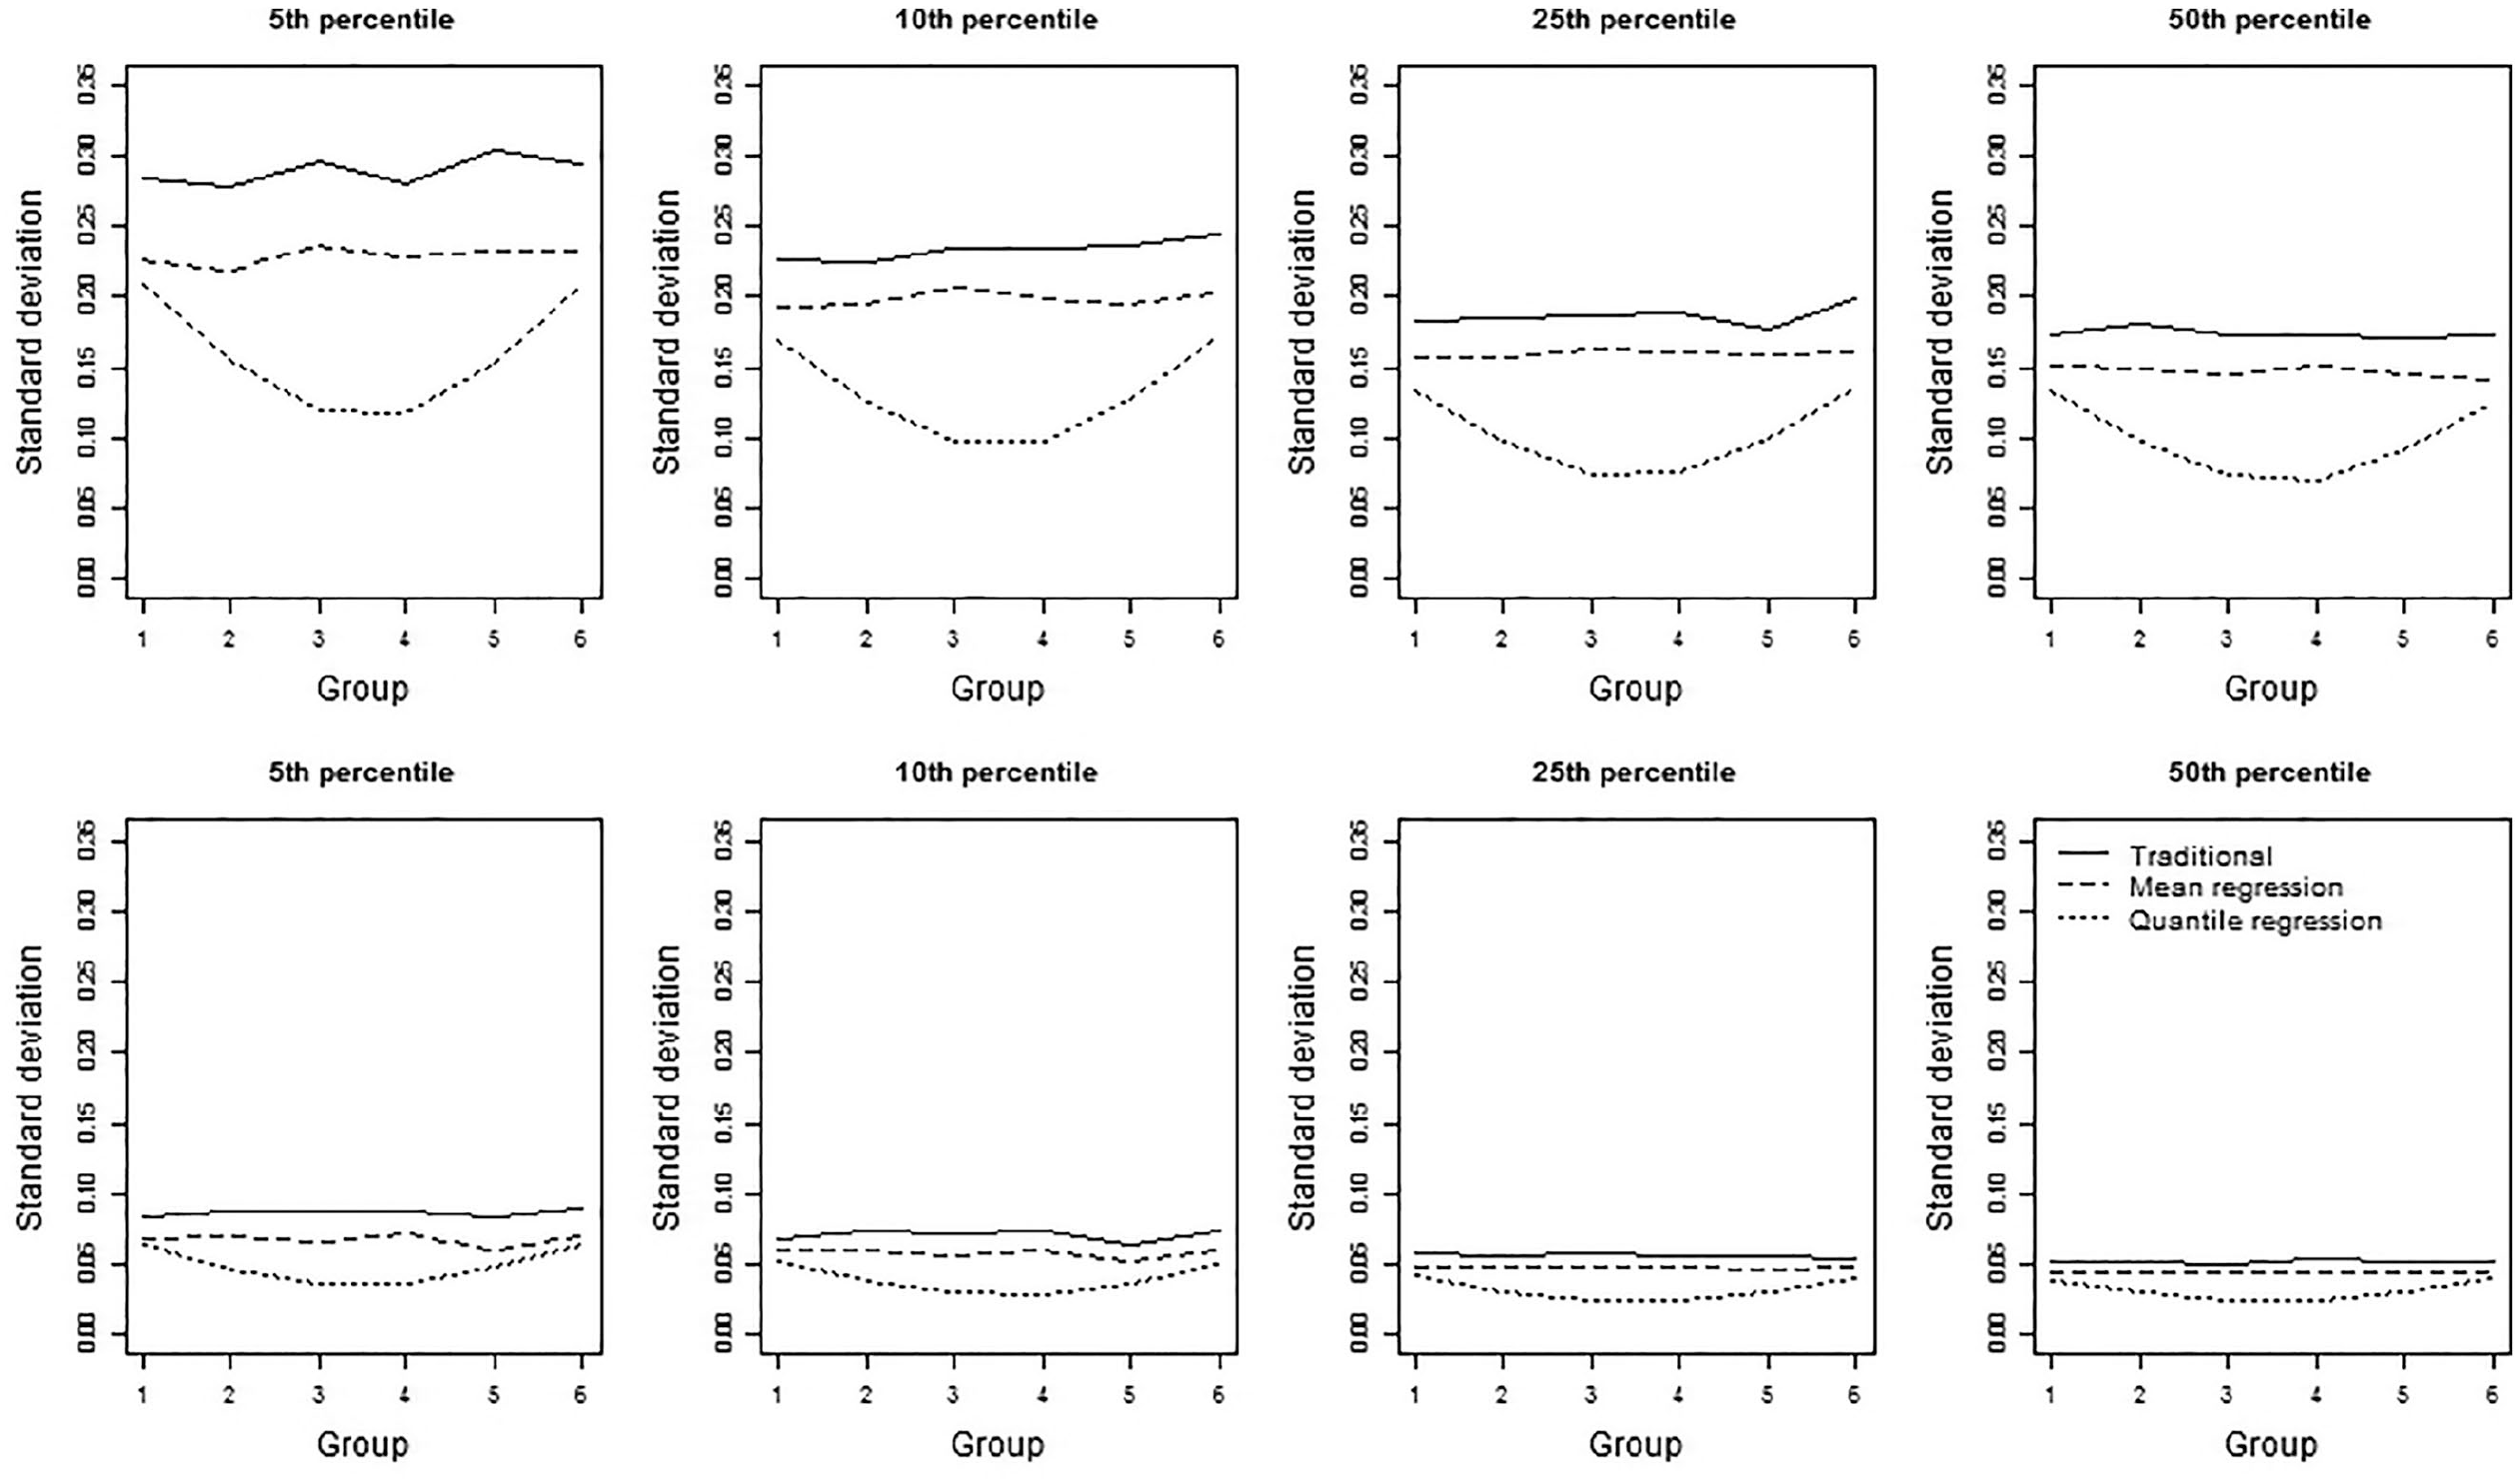
Precision of the three norming methods for 4 percentiles for symmetric group distributions with equal standard deviation based on 50 (first row) and 600 (second row) observations per group.
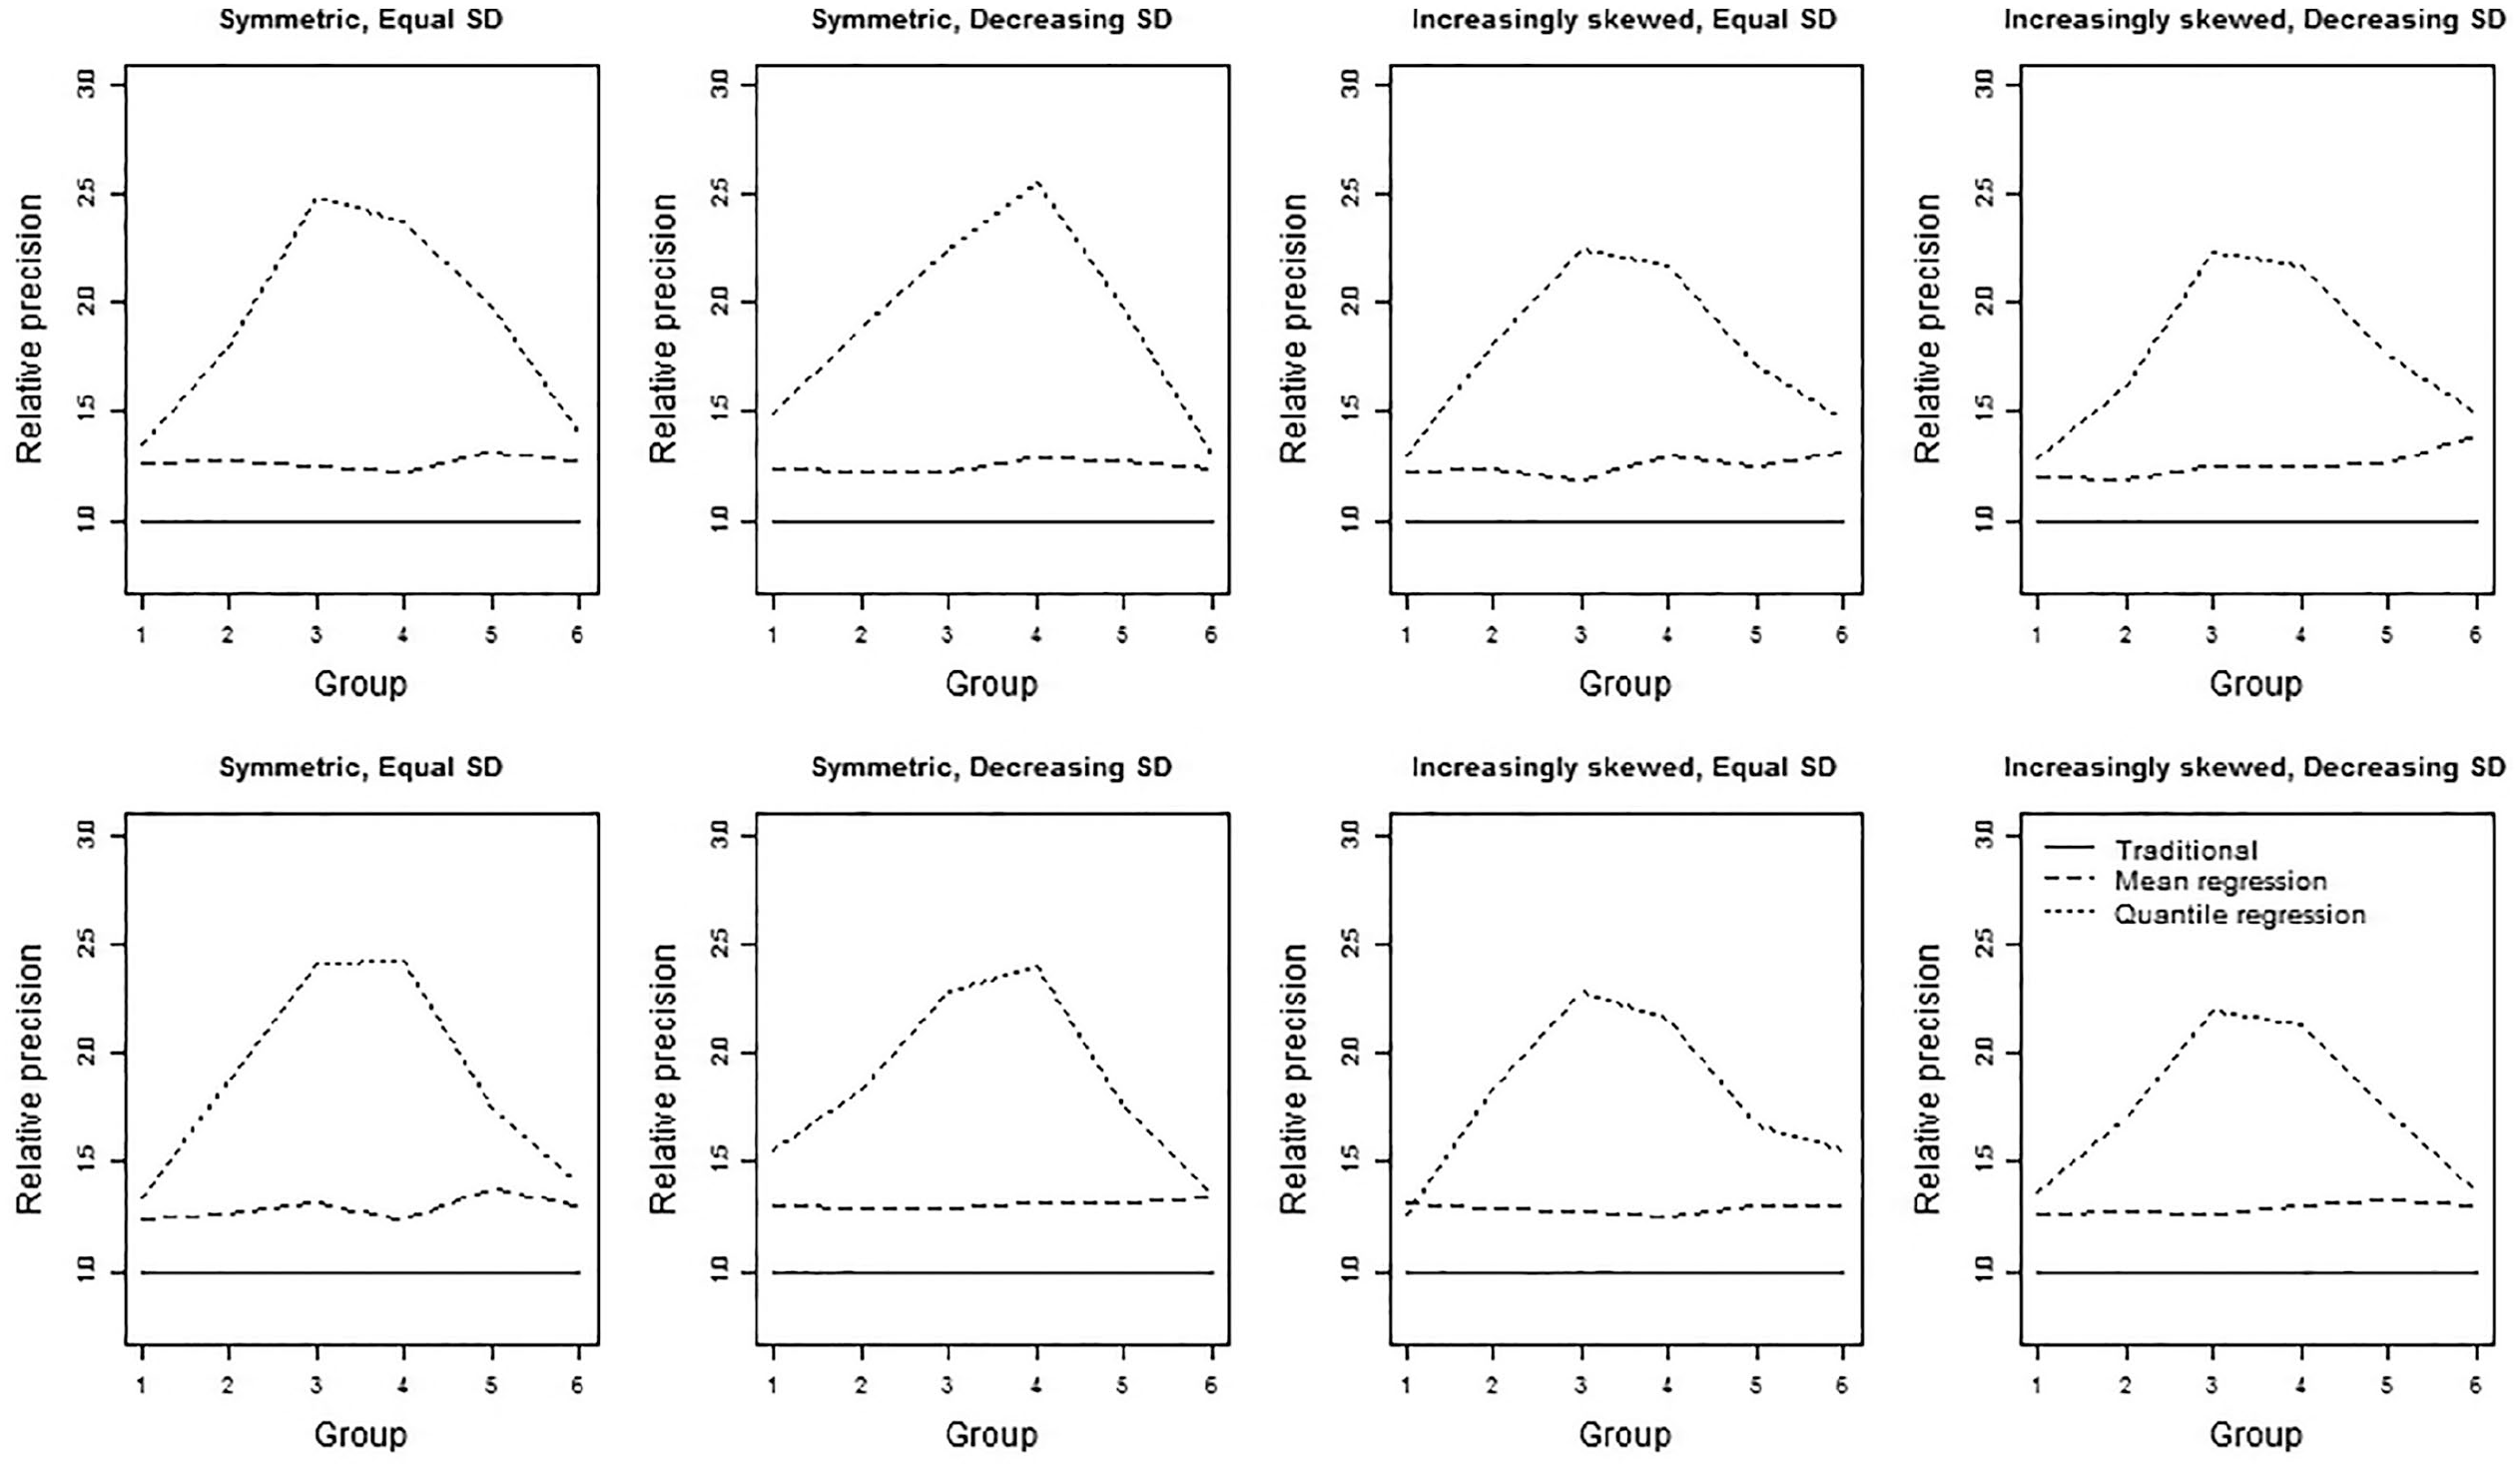
Relative precision of the three norming methods for four group distributions based on 50 (first row) and 600 (second row) observations per group.
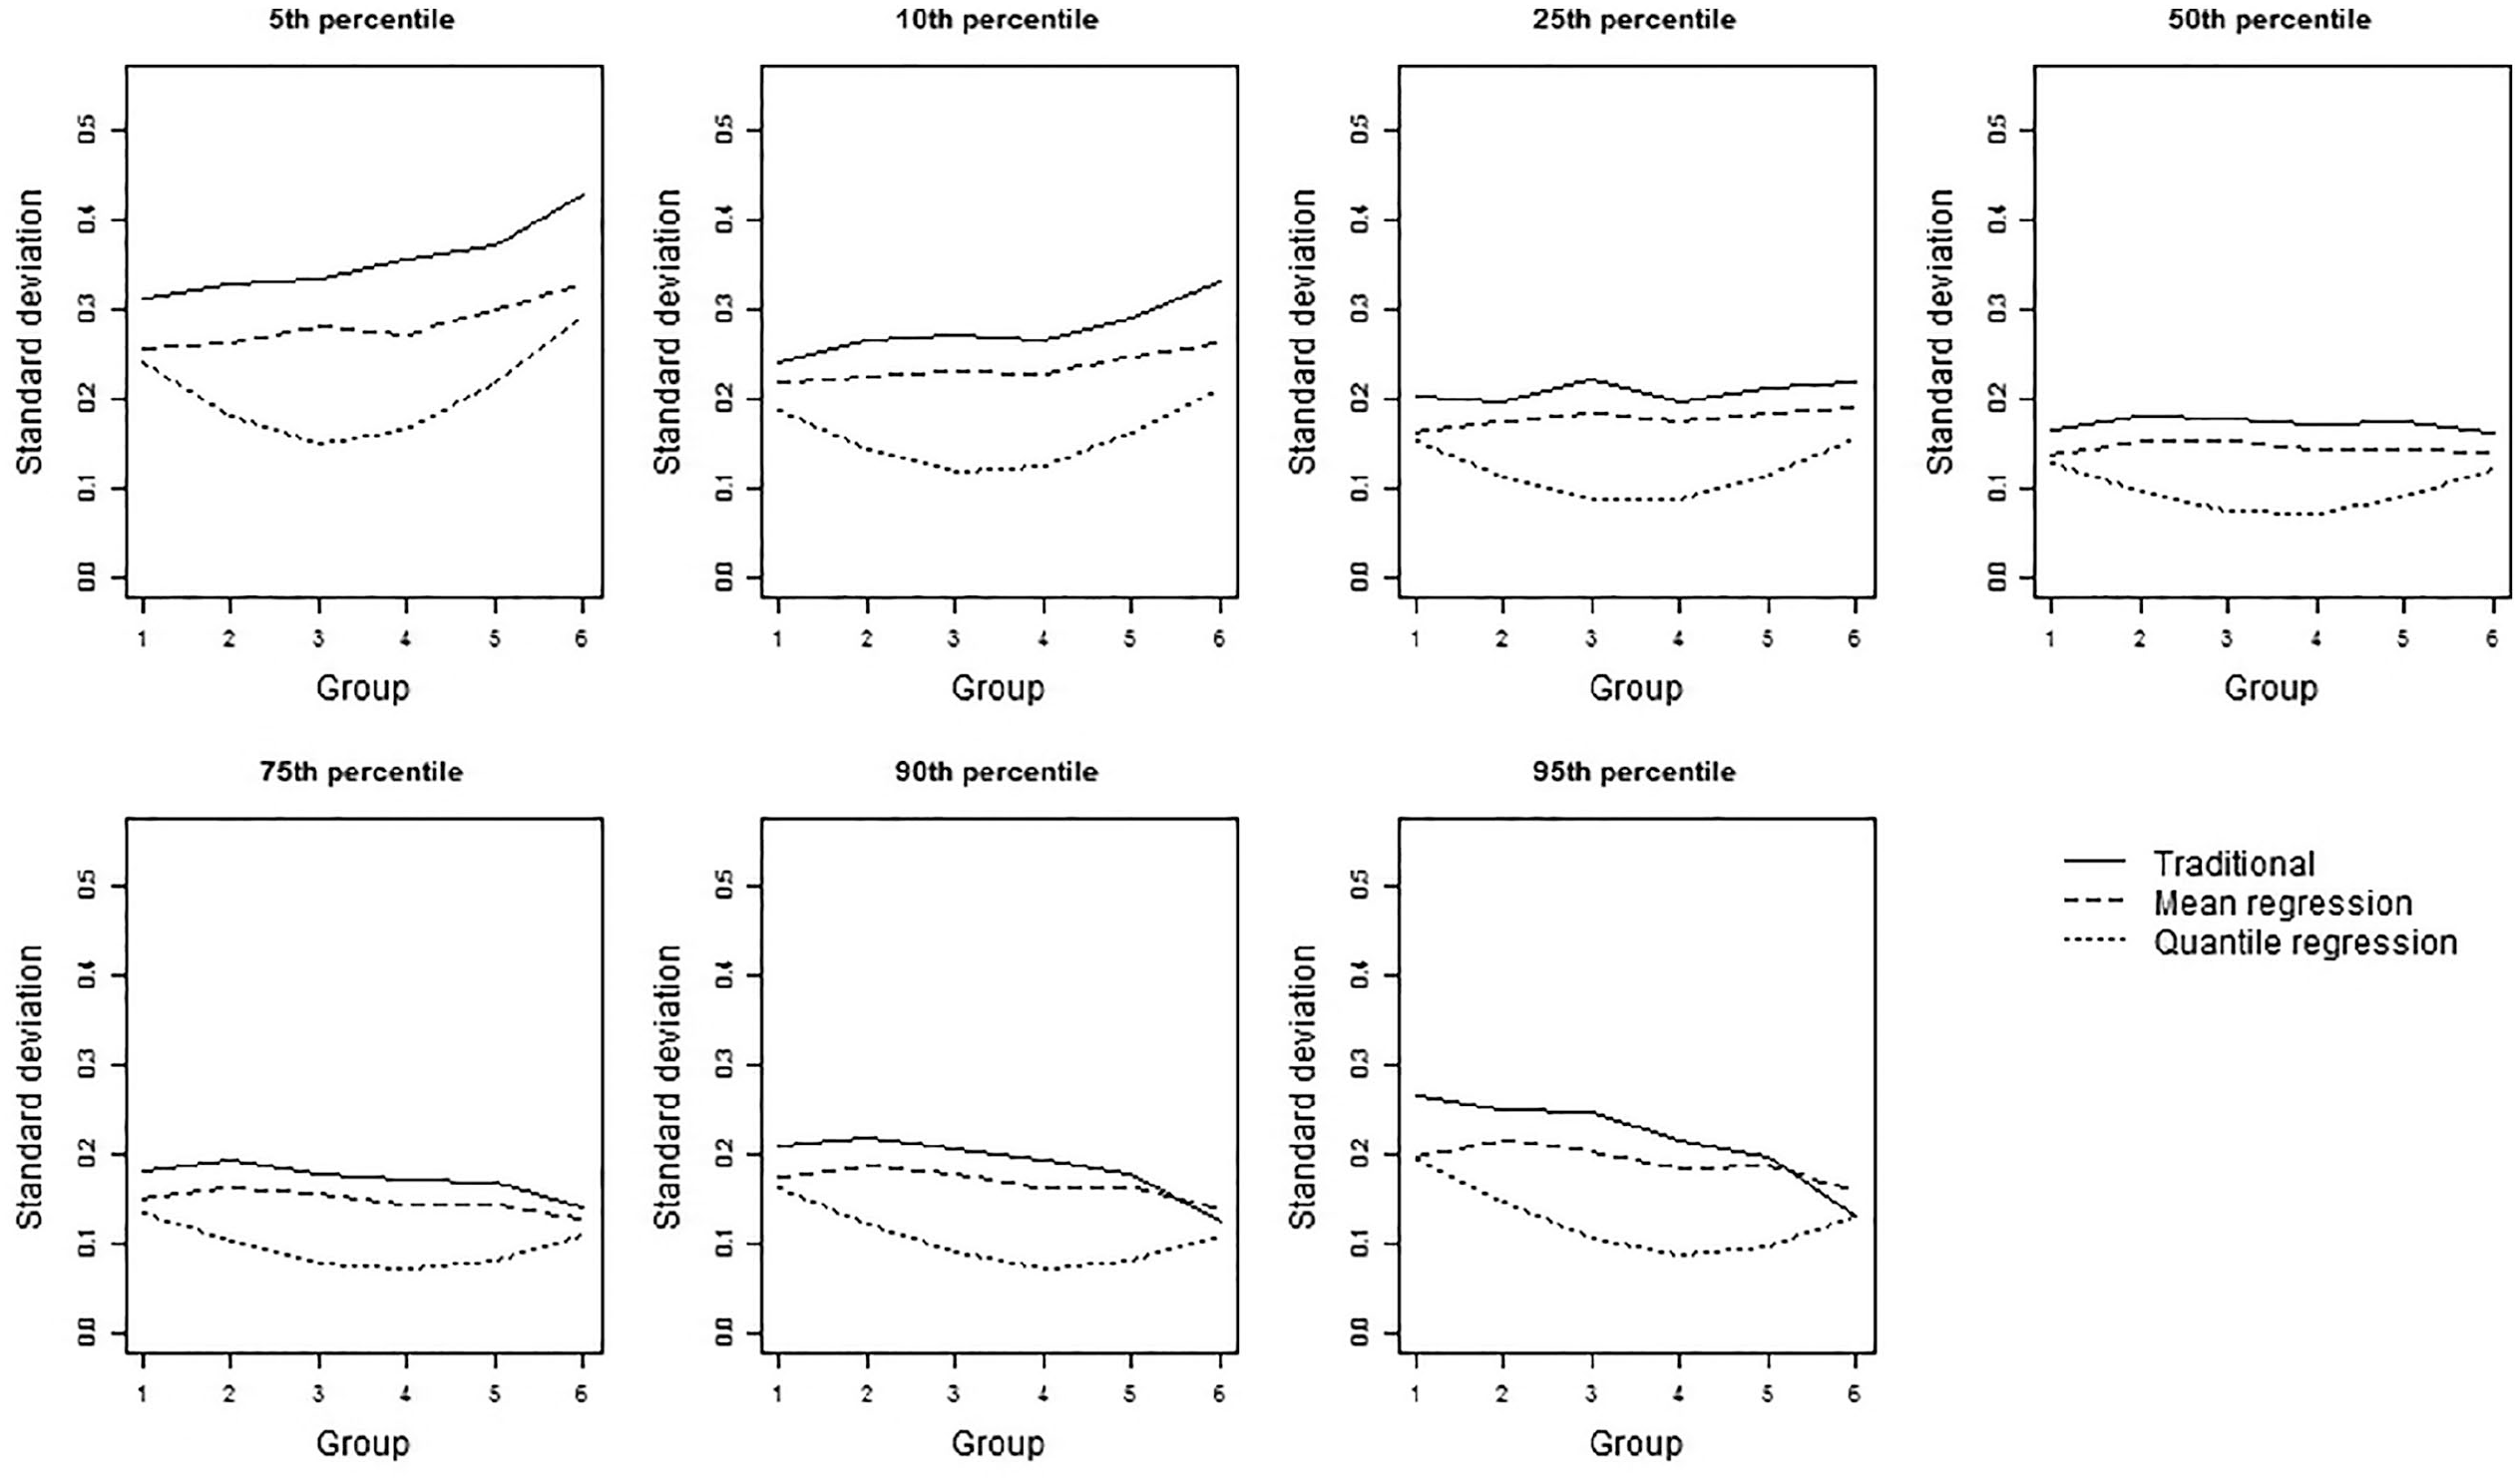
Precision of the three norming methods for 7 percentiles for increasingly skewed group distributions with equal standard deviation.
With respect to the different conditional true-score distributions, several trends were observed. For symmetric distributions, the precision of both the traditional norming method and the mean regression-based norming method were stable across all groups. The precision of the quantile regression method, on the other hand, was higher for the middle groups/grades than for outer groups/grades (see Figures 6 and 7). Differences in the precision of the quantile regression-based norming method across groups can be explained by variation in the regression coefficient as this variance influences the percentiles for the outer groups the most. These results were found in both standard deviation conditions, with quantile regression-based norming being at least 1.19 times more precise than traditional norming. For increasingly skewed distributions, precision differed between the two standard deviation conditions, although differences were small. In the decreasing standard deviation condition, the group trend in precision was tilted slightly more upward (or less downward) than in the equal standard deviation condition (see Figure 5 for the 5th percentile). All results with regard to precision can be viewed in interactive figures at https://ecrshiny.shinyapps.io/NormPrecision/.
Discussion
In this study, a new innovative quantile regression-based continuous norming method was introduced that is more realistic as it is less restrictive with respect to assumptions about score distributions than other continuous norming methods. Its performance was compared with the traditional way of norming and mean regression-based norming. In this manner, it was possible to interpret the performance of quantile regression-based norming to what is familiar, a comparison that is also required in common systems for the evaluation of the quality of tests (see, e.g., Evers et al., 2009). The norming methods were studied in light of one continuous covariate (age/grade level), but all three methods can also facilitate multiple covariates, including categorical covariates.
The performance of the norming methods under study was evaluated in perspective of bias and precision. In this way, it was possible to weight bias and precision separately depending on the situation at hand, something that is not possible when bias and precision would be discussed together in terms of efficiency. For symmetric distributions, all norming methods proved unbiased, with the exception of some percentiles that were slightly biased if they were derived by applying mean regression in conditions where the standard deviations were smaller for higher groups (or grade levels). For increasingly skewed distributions, the unbiased traditional norming method clearly outperformed the two continuous norming methods, which both seemed to fit a different wrong line. As a result, bias in the continuous norming methods depended on the subgroup and percentile combination investigated, ranging from no bias to substantial bias in either direction (positive or negative). If bias was present, it was mostly for the highest and lowest groups/grades and for extreme percentiles. In general, precision was higher when more data were observed around the percentile. For example, if ceiling effects occurred, low percentiles were estimated less precisely, while high percentiles were estimated more precisely. Among the methods studied here, quantile regression-based norming proved the best method in terms of precision, followed by the mean regression-based norming method and the traditional norming method, respectively.
As stated before, the traditional norming method was unbiased in all conditions. This observation is in agreement with our expectations and does make sense as the traditional way of norming does not involve any assumptions about the data. The mean regression-based norming method and the quantile regression-based norming method were biased for increasingly skewed distributions, which was caused by fitting a wrong line. In these conditions, the percentiles did not increase linearly with age, which is an explicit assumption in both methods. The models could therefore not capture the relationship between age and tests cores well and that clearly affected the accuracy of the norms. Model fit could probably have been improved by adding a quadratic term or by adding the standard deviation of the group into the regression equation, but it is unknown how that affects bias and precision. For instance, precision might be negatively affected due to the larger number of parameters to be estimated, and because additional restrictions might be required to identify more complex models, one should be very careful with such alterations. More complex models were already sparsely applied. These models involved, for example, regression of normalized scores on a higher order polynomial of raw scores and covariates (Tellegen & Laros, 1993), regression of raw scores on a higher order polynomial of normed scores and covariates (Lenhard et al., 2016), norming a theoretical distribution that is obtained by regression of the mean, standard deviation, and sometimes higher order moments on the covariates (Van der Elst et al., 2013; Zhu & Chen, 2011), generalized additive models for location, scale and shape (Voncken et al., 2017, 2019), or structural equation modeling with latent variables (Seo et al., 2015). The practicality and effectiveness of such norming methods has not yet been thoroughly studied, however, and that is needed first before these models can safely be applied in real-life testing applications.
Quantile regression-based norming proved the best method if the underlying group distributions were symmetric. While all three methods were unbiased in this condition, the quantile regression-based norming method clearly resulted in the highest precision. Alternatively, quantile regression could also be used to obtain the same precision as the other methods but with a smaller sample. Even with samples which are 1.19 times smaller than the sample that would be used in traditional norming, the norms for the middle groups (or grade levels) are more accurate. Quantile regression-based norming should therefore be the method of choice if the underlying group distributions are expected to be symmetric. When the underlying group distributions are expected to be increasingly (or decreasingly) skewed, for example, when ceiling (or floor) effects occur, it is much less straightforward to choose a method. While the mean regression-based norming method should not be preferred in these circumstances due to the combination of a large bias and only medium precision, the results are contradictory when it comes to traditional norming or quantile regression. Traditional norming is unbiased but not very precise, while on the other hand, quantile regression is very precise but biased.
The norming methods used in the present study can be applied to all tests with a single test score in both educational and psychological measurement. A range of realistic scenarios using varying conditional score distributions that are typical for many tests (e.g., including floor or ceiling effects) was studied, and the simulation study was based on a real item bank. Therefore, it can be expected that our findings can easily be generalized to other tests. Of course, every simulation study does have its limitations because it is impossible to investigate all factors. It is still unclear, for instance, whether our results also generalize to tests with multiple outcomes such as number correct, number of errors, and time to complete. The performance of these norming methods for those types of tests is a topic for future research.
In practice, a well-considered choice for a norming method must be made, both when designing a norming a study as well as in deriving the norms from the actual data. Test developers should base their choice on (a) the intended use of the test, (b) information from previous experiences with similar tests measuring the same attribute, (c) theory and literature about the construct to be measured and tests to measure the attribute, (d) available resources for the norming procedure, and (e) the level (group or individual) and importance of the decisions that can be made based on the test results. For example, if a test developer wants to make an arithmetic test for an SMS in primary education, knows that the conditional score distributions of the attribute show ceiling effects from previous versions of the SMS, and has limited resources for the norming procedure of the test, quantile regression may be the norming method of preference. Another test developer may require norms for a working memory test that is used for important individual decisions in clinical psychology, has no information about the score distribution of most of the targeted populations, and has sufficient resources to obtain 400 observations per group, may want to use traditional norming. As described before, mean regression-based norming may not provide percentile norms as precise as quantile regression-based norming. However, we should note that mean regression-based norming may be very effective if one is interested in means and standard deviations rather than percentiles (e.g., with intelligence scores), as this is the primary output of this method, given that the assumption of normal score distributions is not violated.
End-users of tests should be able to rely on the norms of the test as they are presented, irrespective of the norming method that was used. However, we recommend that test users should only rely on the norms if a solid foundation for the norming method used is also provided with the norms. For test developers, this means that they should not only make a well-informed decision on which norming method to use, but also give a solid argumentation for the chosen method. This is important because adequate norms are a vital part of valid decision making, and test results may have high impact on individuals both in education and psychology. If adequate argumentation of the norming method is lacking, this might be a reason for end-users to give less weight to the results of the test in making a clinical or educational decision, because the norms might not be as accurate as desired.
In conclusion, quantile regression-based norming can be considered a promising method to take continuous background variables into account when percentiles are the norms of interest. However, when the underlying distributions conditional on the background variable(s) are increasingly or decreasingly skewed, for example, due to ceiling or floor effects, the method shows systematic bias. Of course, the underlying group distributions are never known in reality, but as stated before, it might be possible to make an educated guess. It is strongly discouraged to simply choose one method over the other. Perhaps continuous norming could be the new standard in the future as soon as the relationship between model specification and accuracy measures like bias and precision are thoroughly mapped. Until then, the main options are unbiased traditional norming, favoring bias due to sampling fluctuations over systematic bias, or precise quantile regression-based norming, favoring systematic bias over bias due to sampling fluctuations.
Supplemental Material
Supplementary_Material – Supplemental material for Bias and Precision of Continuous Norms Obtained Using Quantile Regression
Supplemental material, Supplementary_Material for Bias and Precision of Continuous Norms Obtained Using Quantile Regression by Elise A. V. Crompvoets, Jos Keuning and Wilco H. M. Emons in Assessment
Footnotes
Declaration of Conflicting Interests
The author(s) declared no potential conflicts of interest with respect to the research, authorship, and/or publication of this article.
Funding
The author(s) received no financial support for the research, authorship, and/or publication of this article.
Supplemental Material
Supplemental material for this article is available online.
References
Supplementary Material
Please find the following supplemental material available below.
For Open Access articles published under a Creative Commons License, all supplemental material carries the same license as the article it is associated with.
For non-Open Access articles published, all supplemental material carries a non-exclusive license, and permission requests for re-use of supplemental material or any part of supplemental material shall be sent directly to the copyright owner as specified in the copyright notice associated with the article.