
Abstract
Socially desirable responding may affect the factor structure of personality questionnaires and may be one of the reasons for the common variance among personality traits. In this study, we test this hypothesis by investigating the influence of the motivational test-taking context (development vs. selection) and the opportunity to distort responses (forced-choice vs. Likert response format) on personality questionnaire scores. Data from real selection and assessment candidates (total N = 3,980) matched on gender, age, and educational level were used. Mean score differences were found between the selection and development groups, with smaller differences for the FC version. Yet, exploratory structural equation models showed that the overall factor structures as well as the general factor were highly similar across the four groups. Thus, although socially desirable responding may affect mean scores on personality traits, it does not appear to affect factor structures. This study further suggests that the common variance in personality questionnaires is consistent and appears to be little influenced by motivational pressures for response distortion.
Keywords
Organizations increasingly use personality questionnaires as part of their selection procedures (König, Klehe, Berchtold, & Kleinmann, 2010), because such measures can help them improve the selection of employees. Research has shown that personality test scores moderately but consistently predict job performance and organizational citizenship behavior, even on top of cognitive abilities (Cook, 2016; Schmidt & Hunter, 1998). Yet, the increased use of personality questionnaires by practitioners has also raised concerns about potential response distortion by applicants completing a personality questionnaire. Response distortion in order to maximize the chances of obtaining a desired job, rather than to answer honestly, is referred to as socially desirable responding (SDR) or faking (Mesmer-Magnus & Viswesvaran, 2006; Ones, Viswesvaran, & Reiss, 1996). A vast body of literature has been devoted to the investigation of the prevalence and magnitude of faking (Birkeland, Manson, Kisamore, Brannick, & Smith, 2006; Viswesvaran & Ones, 1999), its antecedents (e.g., Ellingson & McFarland, 2011; McFarland & Ryan, 2000, 2006; Roulin, Krings, & Binggeli, 2016), and its effect on the predictive validities of personality questionnaires (e.g., Cook, 2016; Morgeson et al., 2007; Rosse, Stecher, Miller, & Levin, 1998).
In the present study, we focus on the effect of SDR on the construct validity of personality questionnaires, an area that has also received considerable attention in the faking literature (Ellingson, Sackett, & Hough, 1999; Ellingson, Smith, & Sackett, 2001; Joubert, Inceoglu, Bartram, Dowdeswell, & Lin, 2015; Marshall, De Fruyt, Rolland, & Bagby, 2005; Schmit & Ryan, 1993; Smith & Ellingson, 2002). It is important for personality questionnaires to preserve their construct validity when used in motivated settings (such as selection procedures), because construct and criterion validity are interrelated (Cronbach & Meehl, 1955). One way of assessing the construct validity of a questionnaire is by investigating its factor structure. In the current study, we add to the literature on social desirability by inspecting the influence of test-taking context and the item format on the factor structure of a personality inventory.
Scholars have argued and shown that SDR in selection contexts can negatively affect the construct validity of the adopted personality questionnaire. In a classic study, Schmit and Ryan (1993) showed that the standard factor structure of the NEO-FFI (Costa & McCrae, 1989) completely disappeared when administered in an applicant sample. More specifically, inflated factor intercorrelations were found in an applicant sample but not in a nonmotivated sample. These authors argued that individual differences in the tendency to respond with an ideal employee in mind (i.e., SDR) uniformly added variance to allegedly independent traits, hereby increasing their overlap and hence their observed intercorrelations. Consequently, their best fitting model included a general factor, which they labeled the “ideal-employee-factor,” to account for this additional common variance. This finding, that is, inflated correlations between personality factors or scales due to a larger portion of shared variance (i.e., the emergence of a general factor) under motivated settings, has been reported a number of times (e.g., Ellingson et al., 1999; Klehe et al., 2012).
In contrast, however, other studies have shown that although the mean scores on personality traits may indeed shift, the factor structures of personality questionnaires are invariant across motivated and nonmotivated groups (Ellingson et al., 2001; Marshall et al., 2005; Smith & Ellingson, 2002; Smith, Hanges, & Dickson, 2001). These latter findings suggest that, although people may lower or increase their scores somewhat depending on the context, the rank order between individuals seems to remain rather similar. Consequently, it has been argued that social desirability introduces little if any systematic error to the measured personality characteristics (Ellingson et al., 2001; Smith & Ellingson, 2002). In sum, to date, the effect of the selection context on the construct validity of personality questionnaires remains unclear.
Interestingly, the two contrasting views outlined above are reflected in two relatively recent streams of research. The first relates to whether social desirability scales—traditionally developed to detect “liars” or “fakers”—measure social desirability as a response set (i.e., error or method artefact) or whether these scales might actually capture substantive trait variance (Lönnqvist, Paunonen, Tuulio-Henriksson, Lönnqvist, & Verkasalo, 2007). Uziel (2010) reviewed the literature on social desirability scales and concluded that they should mainly be reinterpreted as measures of interpersonally oriented self-control. Recent meta-analytic results have confirmed this idea, showing that social desirability scales appear to largely measure trait-like tendencies, rather than only response styles (Connelly & Chang, 2016). These findings naturally lead to the question whether social desirability in itself should be reconsidered as a trait-like construct. Indeed, Klehe et al. (2012) showed how Schmit and Ryans’ general ideal-employee-factor was related to job-related performance, a relation which could be explained by the ability to identify the criteria in the selection procedure, abbreviated as ATIC (Kleinmann et al., 2011), an ability akin to social skills and social effectiveness. If social desirability is really related to genuine social skills and abilities, then this might also explain why controlling for social desirability appears to have little (or even a negative) influence on the criterion validity of personality measures (e.g., Ingold, Kleinmann, König, & Melchers, 2015; Schmitt & Oswald, 2006).
The second stream of research is focusing on the so-called general factor of personality (GFP; Figueredo, Vásquez, Brumbach, Schneider, 2004; Musek, 2007). The GFP reflects the shared variance of lower order traits and its nature is nearly identical to the ideal-employee factor as described above. Specifically, in terms of the Big Five model, high GFP individuals would, on average, be relatively open-minded, diligent, sociable, friendly, and emotionally stable. Studies have consistently shown that a general factor is present in personality measures, even under nonmotivated circumstances, that is, settings in which we can assume respondents to answer in a truthful way (Van der Linden, Te Nijenhuis, & Bakker, 2010). Several scholars consider the GFP to reflect a substantive and meaningful construct. In this tradition, the leading current interpretation is that the GFP reflects a general social effectiveness factor (Van der Linden, Dunkel, & Petrides, 2016), which is supported by its large overlap with emotional intelligence (Van der Linden et al., 2017), part of which appears to be genetic (Van der Linden et al., 2018). In further support of this interpretation, the GFP has been found to be related to a wide range of outcomes from different life domains, such as popularity and likeability (Van der Linden, Scholte, Cillessen, Te Nijenhuis, & Segers, 2010), leadership (Pelt, Van der Linden, Dunkel, & Born, 2017), reduced delinquent behavior (Van der Linden, Dunkel, Beaver, & Louwen, 2015), and job performance (Pelt et al., 2017).
Mirroring the debate on social desirability as described in previous paragraphs, however, there is a similar dispute around the GFP with several scholars suggesting that the GFP is not substantive, but rather an artefact arising from the way personality traits are measured (e.g., Ashton, Lee, Goldberg, & De Vries, 2009; Chang, Connelly, & Geeza, 2012). One important explanation for the GFP is in fact the tendency to respond in socially desirable ways (Irwing, 2013): that is, the evaluative content (i.e., social desirability level) of personality items may trigger the motivation to self-enhance in some people more than in others (Bäckström, Björklund, & Larsson, 2009). In this way, because people respond both to the personality content and evaluativeness of items (Biderman, McAbee, Job Chen, & Hendy, 2018), scales tend to become more correlated, leading to the emergence of a general factor. Related to this, Dunkel, Van der Linden, Brown, and Mathes (2016) tested the various sources of variance in the GFP, and concluded that although the general factor partly reflects measurement error such as social desirability bias, the lion share of the variance could be attributed to genuine social effectiveness.
Van der Linden, Bakker, and Serlie (2011) also directly tested this social desirability explanation for the GFP by comparing the general factors extracted from a selection and an assessment sample. Naturally, the level of self-enhancement motivation was expected to be higher in the selection sample compared with the assessment sample, because there was a job at stake. If the GFP was entirely due to SDR induced by the level of self-enhancement motivation, then the authors expected the GFP to be markedly different—or even disappear—in the assessment sample compared to the selection sample. However, the study showed that although participants in the selection setting indeed scored higher on all personality dimensions, suggesting a general tendency to present oneself in a more favorable way, the factor structure remained the same in both settings. Thus, the GFPs were highly similar across the two groups, which led them to the conclusion that it is unlikely that the GFP merely is the product of SDR.
Some recent studies lead to somewhat different conclusions. In line with Van der Linden et al. (2011), Anglim, Morse, De Vries, MacCann, and Marty (2017) showed that most statistical properties of the HEXACO questionnaire—including factor loadings and the size or importance of the general factor—were equal in applicant and nonapplicant samples. They did show, however, that the general factor was likely to represent a faking factor as indicated by (a) significantly higher mean levels on the general factor in the applicant sample than in the nonapplicant sample, with this mean difference being larger than for any of the HEXACO dimensions and (b) strong relations between item loadings on the general factor on the one hand and indicators of item social desirability (e.g., standardized item mean differences between honest-applicant conditions from a separate instructed faking study) on the other. Yet, the authors acknowledged that this study “does not resolve the ongoing debate about whether it reflects substance or bias” (Anglim et al., 2017. p. 679); the fact that scores on a social desirability factor can be increased in selection contexts does not automatically mean that such a factor cannot have predictive value or be substantiated by other-reports (Chen, Watson, Biderman, & Ghorbani, 2016). In addition, recently a number of studies (MacCann, Pearce, & Jiang, 2017; Schermer, Holden, & Krammer, 2019; Schermer, Krammer, & Goffin, 2019) using an experimental laboratory design in which participants are instructed to fake have shown that the general factor did become more prominent under such instructions. The contrasting findings between these experimental studies and Van der Linden et al. (2011) might be ascribable to the instructed nature of the former and the use of student samples; such studies have often been criticized for a lack of ecological validity (Smith & Ellingson, 2002). The influence of social desirability in the selection context on construct validity and the general factor in personality tests—also for recommendations to practitioners using the tests in the field—is thus best studied in real-life, naturally occurring situations.
The Forced-Choice Method
Although the effect of social desirability in the selection context on the construct validity of personality questionnaires is not clear empirically, it has mostly been viewed as a nuisance factor. As such, several attempts have been made to reduce its influence, one of them being presenting personality items in a different format. In the previous discussion, all personality questionnaires referred to were traditional Likert-type format questionnaires in which respondents were asked to indicate the extent to which they disagree/agree with a statement on a certain (mostly 5-point or 7-point) scale. With this format, especially in combination with the transparency of personality items (Kuncel & Tellegen, 2009), it may be relatively easy to deduce what the desirable response is in a selection context. In other words, Likert-type items provide a relatively large opportunity to “fake.”
To reduce this opportunity, the so-called multidimensional forced-choice (FC) format was developed (Waters, 1965), where respondents are presented with two or more statements loading on different traits paired in their levels of social desirability, and forced to choose to indicate which is “most like them” (and sometimes also which is “least like them”). When responding to FC questionnaires, it is impossible to exclusively endorse socially desirable items, preventing one from leaving a favorable image across all traits. In addition, the FC format can reduce response biases related to personality measurement such as acquiescence (Cheung & Chan, 2002) and halo effects (Bartram, 2007).
Although these properties appear to be favorable compared with the Likert format, they come at a cost. That is, when FC questionnaires are scored with traditional methods based on classical test theory (Brown & Maydeu-Olivares, 2011), they yield ipsative scores (Hicks, 1970; Meade, 2004) and consequently measurement difficulties arise. For example, by being forced to choose dependencies in the data arise, resulting in negative correlations between traits even though, in reality, they may be unrelated or even positively related. In addition, FC questionnaires yield relative rather than absolute trait standings (Baron, 1996) influencing the obtained score profiles of the respondent; as noted, it precludes scoring high (or low) on all measured traits simultaneously. From an applied perspective, this makes comparing trait standings across individuals, for example, in selection situations, problematic.
While these concerns are theoretically valid, empirically it has been shown that traditional sum scores based on FC questionnaires are relatively good approximations of trait scores (Lee, Lee, & Stark, 2018), especially when specific precautions are taken (e.g., Salgado, Anderson, & Tauriz, 2015). Using traditional sum scores, previous studies have shown how the FC format reduces the possibility of response distortion. For example, mean score differences between honest participants and participants instructed to fake tend to be smaller, yet not vanish, with the FC compared with the Likert format, and relations with criteria in motivated conditions appear to be less attenuated with the FC (vs. Likert) format (Christiansen, Burns, & Montgomery, 2005; Jackson, Wroblewski, & Ashton, 2000; Vasilopoulos, Cucina, Dyomina, Morewitz, & Reilly, 2006).
In terms of construct validity of FC questionnaires, however, much less is known (Salgado et al., 2015); only a few studies have directly compared factor structures across Likert and FC versions of the same instrument. This is presumably due to the aforementioned difficulties associated with scoring FC measures, leading to biases in factor loadings in factor analysis (Brown & Maydeu-Olivares, 2011). However, the recently developed Thurstonian IRT model (Brown & Maydeu-Olivares, 2011, 2012) allows the extraction of normative (vs. ipsative) scores form FC inventories. Several studies have used this model to score FC questionnaires and showed that indeed normative scores (i.e., normally distributed, and allowing for score profiles with exclusively high or low scores) and good results in terms of validity can be obtained (Anguiano-Carrasco, MacCann, Geiger, Seybert, & Roberts, 2015; Guenole, Brown, & Cooper, 2016; Joubert et al., 2015; Lee, Joo, & Lee, 2019; Morillo et al., 2016; see also Dueber, Love, Toland, & Turner, 2019, for remarks on limitations of the model).
Two studies adopted this model to directly test the influence of the item format on construct validity of personality inventories. Joubert et al. (2015) showed that the covariance matrices of the Likert and FC version of Occupational Personality Questionnaire (SHL, 2013) were largely equivalent. Although they compared groups assumed to have differed in their motivation to leave a good impression on the personality questionnaires (i.e., a training sample and selection samples), they excluded a group that completed the Likert version in a selection context. Also, they did not explicitly investigate the role of the general factor in the different groups. Irwing (2013) did explicitly investigate whether the GFP in the OPQ Likert and FC version where comparable, and showed this to be largely the case. In that study, however, samples were used from low-stakes settings. As such, it is unclear whether the general factor found in Likert and FC versions of the same instrument still converge when motivational pressures are present.
The Present Study
Until now, studies have predominantly focused on either the influence of context (nonmotivated vs. motivated test setting) on the factor structures of personality tests, or the influence of item format (Likert vs. FC), but have rarely combined both approaches simultaneously. While the context has shown to influence the motivation to distort responses, the item format defines the opportunity to do so. Thus, by leaving out an applicant group completing a Likert-type questionnaire, Joubert et al. (2015) omitted a test against the “worst case scenario” in which people are motivated to fake and had ample chance to do so. Consequently, it is possible that the factor structure of a FC questionnaire can be replicated with a Likert questionnaire in low-stakes settings, but the question remains whether this is true when the Likert questionnaire is administered in high-stakes settings.
In addition, if there are fundamental differences in the factor structure across Likert and FC-based instruments then differences between instruments with different item formats might be found even in the absence of motivational pressures. Thus, we first need to establish the equivalence of the construct validity between the instrument types under low-stakes settings—acting as a baseline—before we can make statements about the equivalence under motivated settings.
In summary, to fully understand whether factor structures overall—and the general factor more specifically—are affected by SDR, the effects of item format and test-taking context need to be disentangled. This is achieved by a full context X item format design (Table 1). Such a design is used in the current study containing four groups with potentially differing levels of SDR on the basis of their motivation and opportunity to distort their responses.
Research Design (2 × 2).
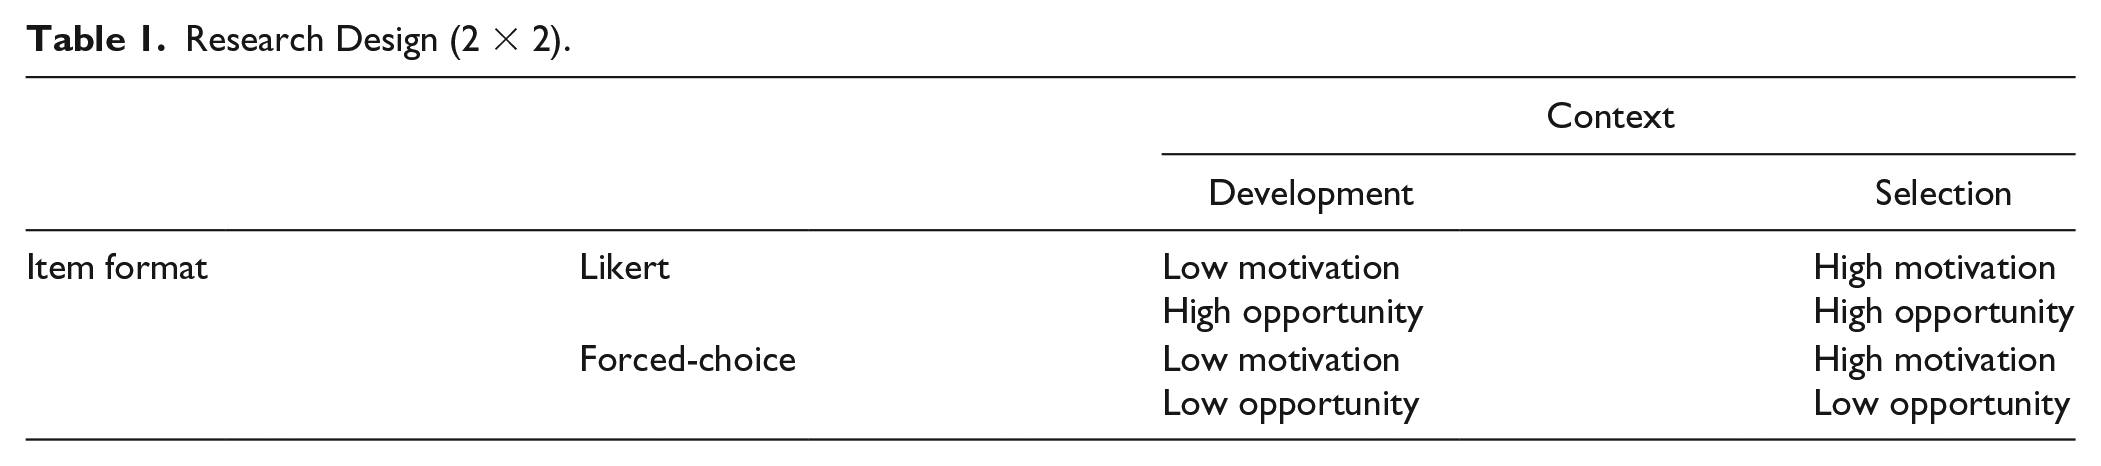
The main goal of the current study was to thoroughly test the influence of social desirability on the construct validity of personality tests in general—and the general factor more specifically—by comparing the factor structures across these four groups. If social desirability represents a response set related to situational pressures, then we would expect it to introduce error variance in the selection context, negatively influencing the instrument’s construct validity, and thus to lead to differences in factor structures between the selection and development groups. Because it is assumed that the FC format will reduce the amount of error variance that is introduced, when social desirability is seen as a response set, the expectation would be that the factor structures of the development and selection group will be more similar for the FC version than for the Likert version. Following the same line of reasoning, if the general factor is markedly different across the four groups, then this would imply that it mostly captures situation-specific variance emanating from response distortion. Alternatively, if the general factor is highly similar across the groups, then this would point in the direction of this factor reflecting a relatively stable personality characteristic, being less susceptible to situational pressures for response distortion.
As many studies on social desirability are limited in their use of students instructed to distort their responses (e.g., Pavlov, Maydeu-Olivares, & Fairchild, 2018; Smith & Ellingson, 2002), one particular asset of the present study is that it addresses the effect of social desirability in actual, real-life settings with participants either applying for real jobs or going through an assessment for their own career development.
Method
Sample and Procedure
Data were collected from the database of a large test development and publishing firm which develops instruments specifically for the HR market. Their clients mostly consist of selection and assessment agencies, recruitment agencies, career counseling firms, individual counselors/psychologists, and HR-departments of medium to large companies. The database was searched for candidates who completed a personality questionnaire (in Likert or FC format) as part of a career development process or a selection procedure and for which background information (gender, age, and education) was available. The applicants in the sample applied to a wide range of job positions at a large number of different organizations. Data were collected between July 2011 and March 2015.
These requirements resulted in an initial sample of 9,212 candidates (FC development; n = 1,673, FC selection; n = 1,473, Likert development; n = 3,325; Likert selection; n = 2,741). To reduce the influence of differences in demographics between the groups, a matching procedure as described in Anglim et al. (2017) was conducted in order to create samples with equal distributions in terms of age, gender, and education. The procedure is based on strata sampling, therefore, we created 5 × 2 × 3 = 30 different strata based on age (<25, 26-35, 36-45, 46-55, and >56 years), gender, and educational level (low, middle, and high). In each group, a similar number of participants was randomly sampled from each stratum (see Anglim et al., 2017, for a detailed description of the procedure). This resulted in a final total sample of 3,980 participants, with an equal number of 995 participants in each of the four groups, and with no significant differences in age (FC development: M = 39.0, SD = 10.0, range 17-63; FC selection: M = 38.6, SD = 10.0, range 18-66; Likert development: M = 39.0, SD = 9.9, range 17-62; Likert selection: M = 38.6, SD = 10.1, range 17-62) and gender (63.4% male in all four groups). The same was the case for educational level (5.7% lower, 23.1% middle, and 71.2% higher educated in all four groups).
Measures
Likert Personality Questionnaire
To measure personality, the Work-related Personality Inventory (WPI; Ixly, 2012) was used, which is based on the five-factor model (FFM). The WPI consists of 25 lower level facets, which combine into five higher order factors (see Table 2), namely (a) Stability, (b) Structure, (c) Exuberance, (d) Influence, and (e) Sociability, that overlap with the Big Five dimensions (Ixly, 2012, 2014). The Stability factor of the WPI overlaps with Emotional Stability (reversed Neuroticism) of the Big Five (r = .82 and r = .69 with the Dutch version of the Big Five Inventory (BFI; Denissen, Geenen, Van Aken, Gosling, & Potter, 2008) and the Five-Factor Personality Inventory (FFPI; Hendriks, Hofstee, & De Raad, 1999), respectively, as reported in the WPI manual; Ixly, 2012, 2014), Structure with Conscientiousness (r = .63 and r = .76), Sociability with Extraversion (r = .78 and r = .77). Exuberance mostly overlaps with Openness (r = .69 and r = .56), but also partly overlaps with Conscientiousness (r = .50 with the BFI). The Influence factor mainly overlaps with Extraversion (r = .57 with the BFI and FFPI), but is also moderately related to lower Agreeableness (r = −.46) and higher Openness of the FFPI (r = .40). In 2012, the WPI received a favorable rating from the COTAN, the official national test-auditing authority from the Dutch Association of Psychologists (NIP). This favorable rating implies that the committee has evaluated the empirical evidence supporting the quality of this instrument and concluded that it is reliable and a construct valid assessment of personality according to current main theories, in this case the FFM.
Means, Standard Deviations, and Effect Sizes of Facets and Factors for Development and Selection by Item Format.
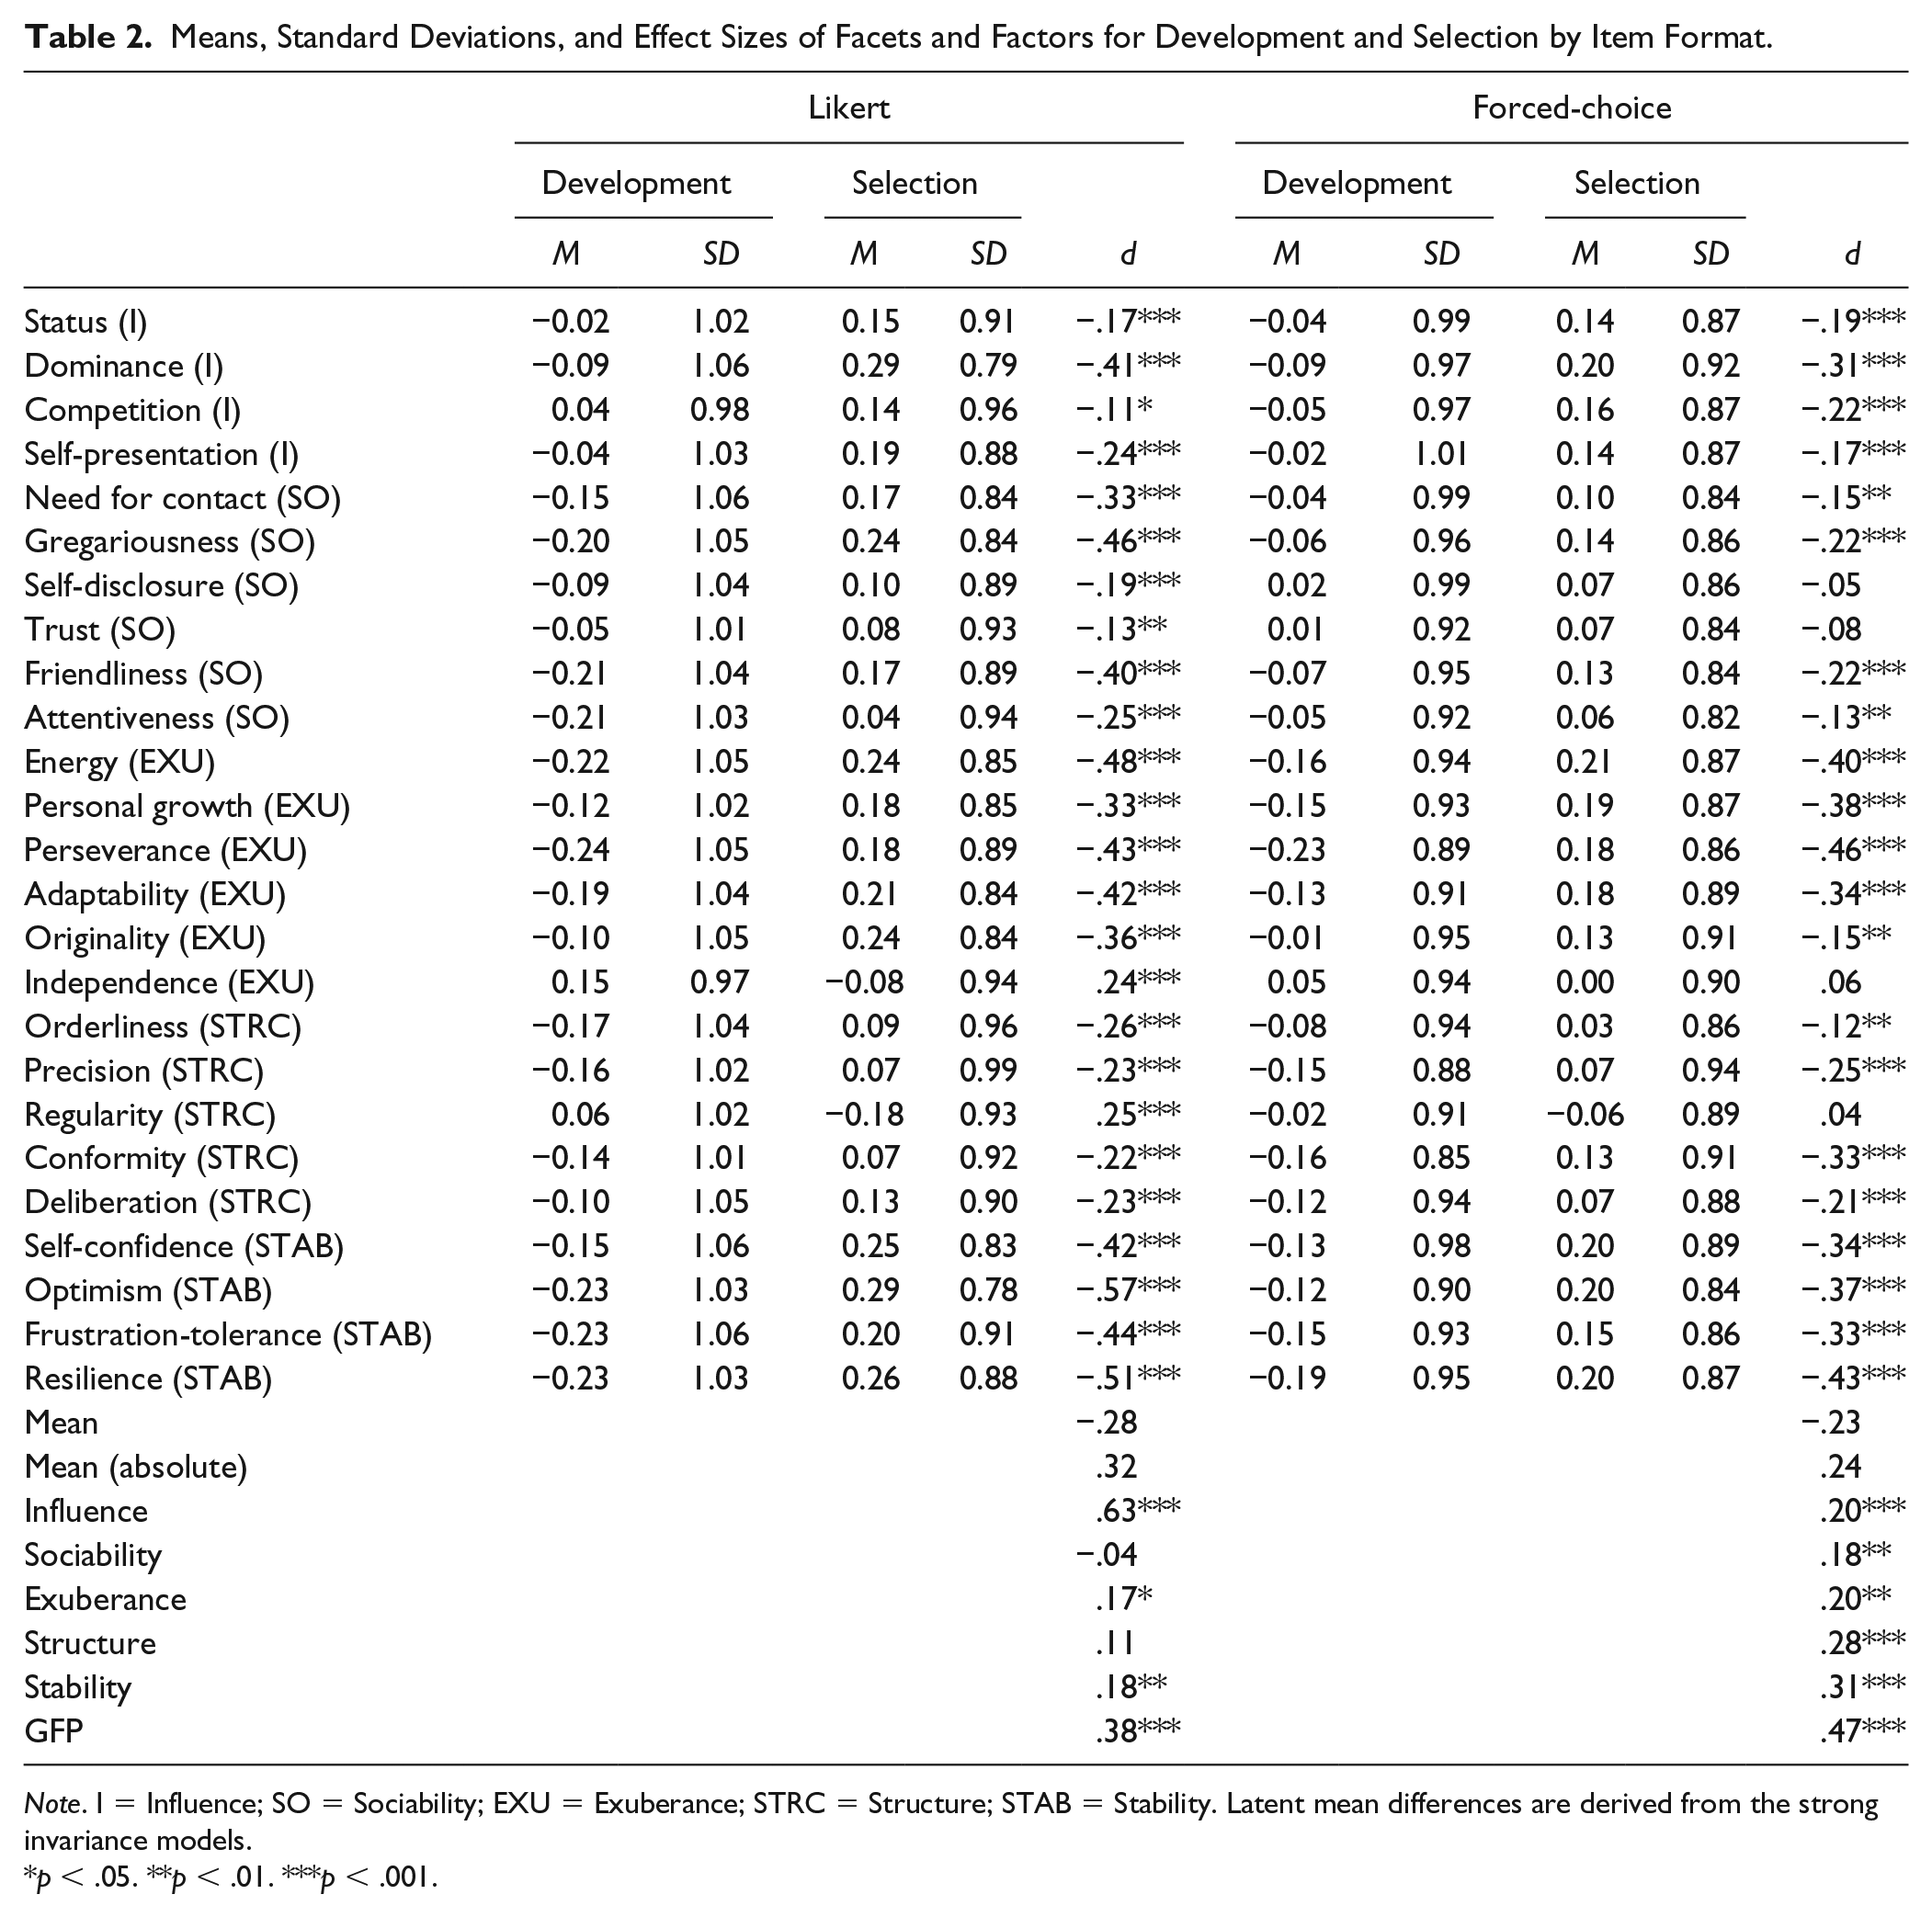
Note. I = Influence; SO = Sociability; EXU = Exuberance; STRC = Structure; STAB = Stability. Latent mean differences are derived from the strong invariance models.
p < .05. **p < .01. ***p < .001.
The Likert version of the WPI consists of 276 items, with a 5-point scale ranging from totally disagree to totally agree. All items are formulated in the third person; an example item of the Trust facet states, “Is quick to trust strangers.” For this version, facet scores were calculated by summing the items belonging to a facet and subsequently standardizing them to put the scores of the two instrument types on the same metric (see below). Reliabilities of the facets were adequate to good and comparable between the development (M = 0.90, SD = 0.02, ranging between .84 and .94) and selection context (M = 0.88, SD = 0.03, ranging between .78 and .93).
Forced-Choice Personality Questionnaire
The forced-choice version was previously constructed (not as part of the current study) based on the Likert version: items were paired in terms of their attractiveness based on their mean scores in the normative sample, a common method in the literature (e.g., Heggestad, Morrison, Reeve, & McCloy, 2006; Vasilopoulos et al., 2006). Each item consists of two statements with a 4-point rating scale to indicate the preference of one statement over the other. The forced-choice version is multidimensional in the sense that the items in each item pair load differently on different facets. In line with Brown and Maydeu-Olivares (2012), item pairs consist of items with both positive statements, both negative statements, and combinations of positively and negatively worded items. The total forced-choice questionnaire consists of 225 item pairs. An example item is presented in Figure 1.

Example item of the FC version of the WPI.
Normative scores for the FC version of the WPI were derived by applying the Thurstonian IRT model to the WPI-FC data in Mplus (Muthén & Muthén, 1998-2010), after which trait scores were obtained with the Bayes maximum a posteriori (MAP) estimation method. Mplus syntax was created by the Excel macro provided by Brown and Maydeu-Olivares (2012). The present FC questionnaire includes a rating scale with four options (Figure 1) to indicate one’s preference of one statement over the other, thus the model employed here is the ordinal extension of the Thurstonian IRT model. Recently, it has been shown that this model can successfully be used to recover personality trait scores (Brown & Maydeu-Olivares, 2018) from FC surveys. Empirical reliabilities (Brown & Maydeu-Olivares, 2011) were adequate and roughly equal in the development (M = 0.84, SD = 0.05, ranging between .76 and .92) and selection context (M = 0.82, SD = 0.05, ranging between .72 and .91).
Statistical Analyses
Standardized facet score differences between contexts within instruments were first investigated to assess the extent to which the FC method reduces the possibility of distorting responses. Based on the finding that FC tests can also be faked (e.g., Heggestad et al., 2006; Pavlov et al., 2018), we expect score differences between development and selection context for the Likert as well as the FC instrument. Yet, given that the FC format reduces the opportunity for response distortion, we can expect the development-selection difference to be smaller for this instrument type compared with the Likert instrument.
Exploratory Structural Equation Modeling
To investigate whether the factor structures of the personality questionnaires were equivalent across the four groups, we used the measurement invariance approach within the exploratory structural equation modeling (ESEM) framework (Asparouhov & Muthén, 2009). ESEM, in combination with target rotation, allows prespecifying a theoretical loading matrix with primary (targeted) loadings and (untargeted) cross-loadings. In the current study, this means that, for example, loadings of the facets intended to load on the Influence factor are estimated freely, while the loadings of all other facets on that factor are targeted (not fixed, they are still allowed to vary) at zero. ESEM reports factor solutions akin to exploratory factor analysis procedures while also providing model fit values typically found in confirmatory factor analysis (CFA) procedures, allowing for model comparisons.
ESEM has several advantages over CFA when studying the effects of response distortion on the overall factor structure and more specifically the general factor found in personality inventories (Lee, Mahoney, & Lee, 2017). By estimating cross-loadings, in other words, by allowing for relations between items or facets and untargeted, presumably construct-irrelevant factors, ESEM (vs. CFA) controls for both inflated factor correlations and inflated general factor loadings (Arias, Jenaro, & Ponce, 2018; Lee et al., 2017; Marsh, Morin, Parker, & Kaur, 2014; Morin, Arens, & Marsh, 2016). It hereby provides a more accurate picture of the extent to which presumably independent constructs overlap more when pressures for response distortion are present.
The general factor was specified in a bifactor model, in which the 25 facets directly load on the general factor, in addition to their specified domain factor (Figure 2). Bifactor models have gained popularity in the personality literature in recent years (Arias et al., 2018; Biderman et al., 2018) as they allow appropriate decomposition of variance attributable to the general factor and the specific domain factors (Rodriguez, Reise, & Haviland, 2016). Furthermore, the bifactor approach is line with the oft-used definition of social desirability as a factor influencing all personality traits to the degree depending on the desirability or evaluativeness of the trait (Biderman et al., 2018; Smith & Ellingson, 2002). In line with how bifactor models are traditionally conceptualized (e.g., Reise, 2012), we used orthogonal target rotation, which means that the general factor and all domain factors are uncorrelated. 1 All models were fitted using the robust maximum likelihood estimator in Mplus version 6.12 (Muthén & Muthén, 1998-2010).
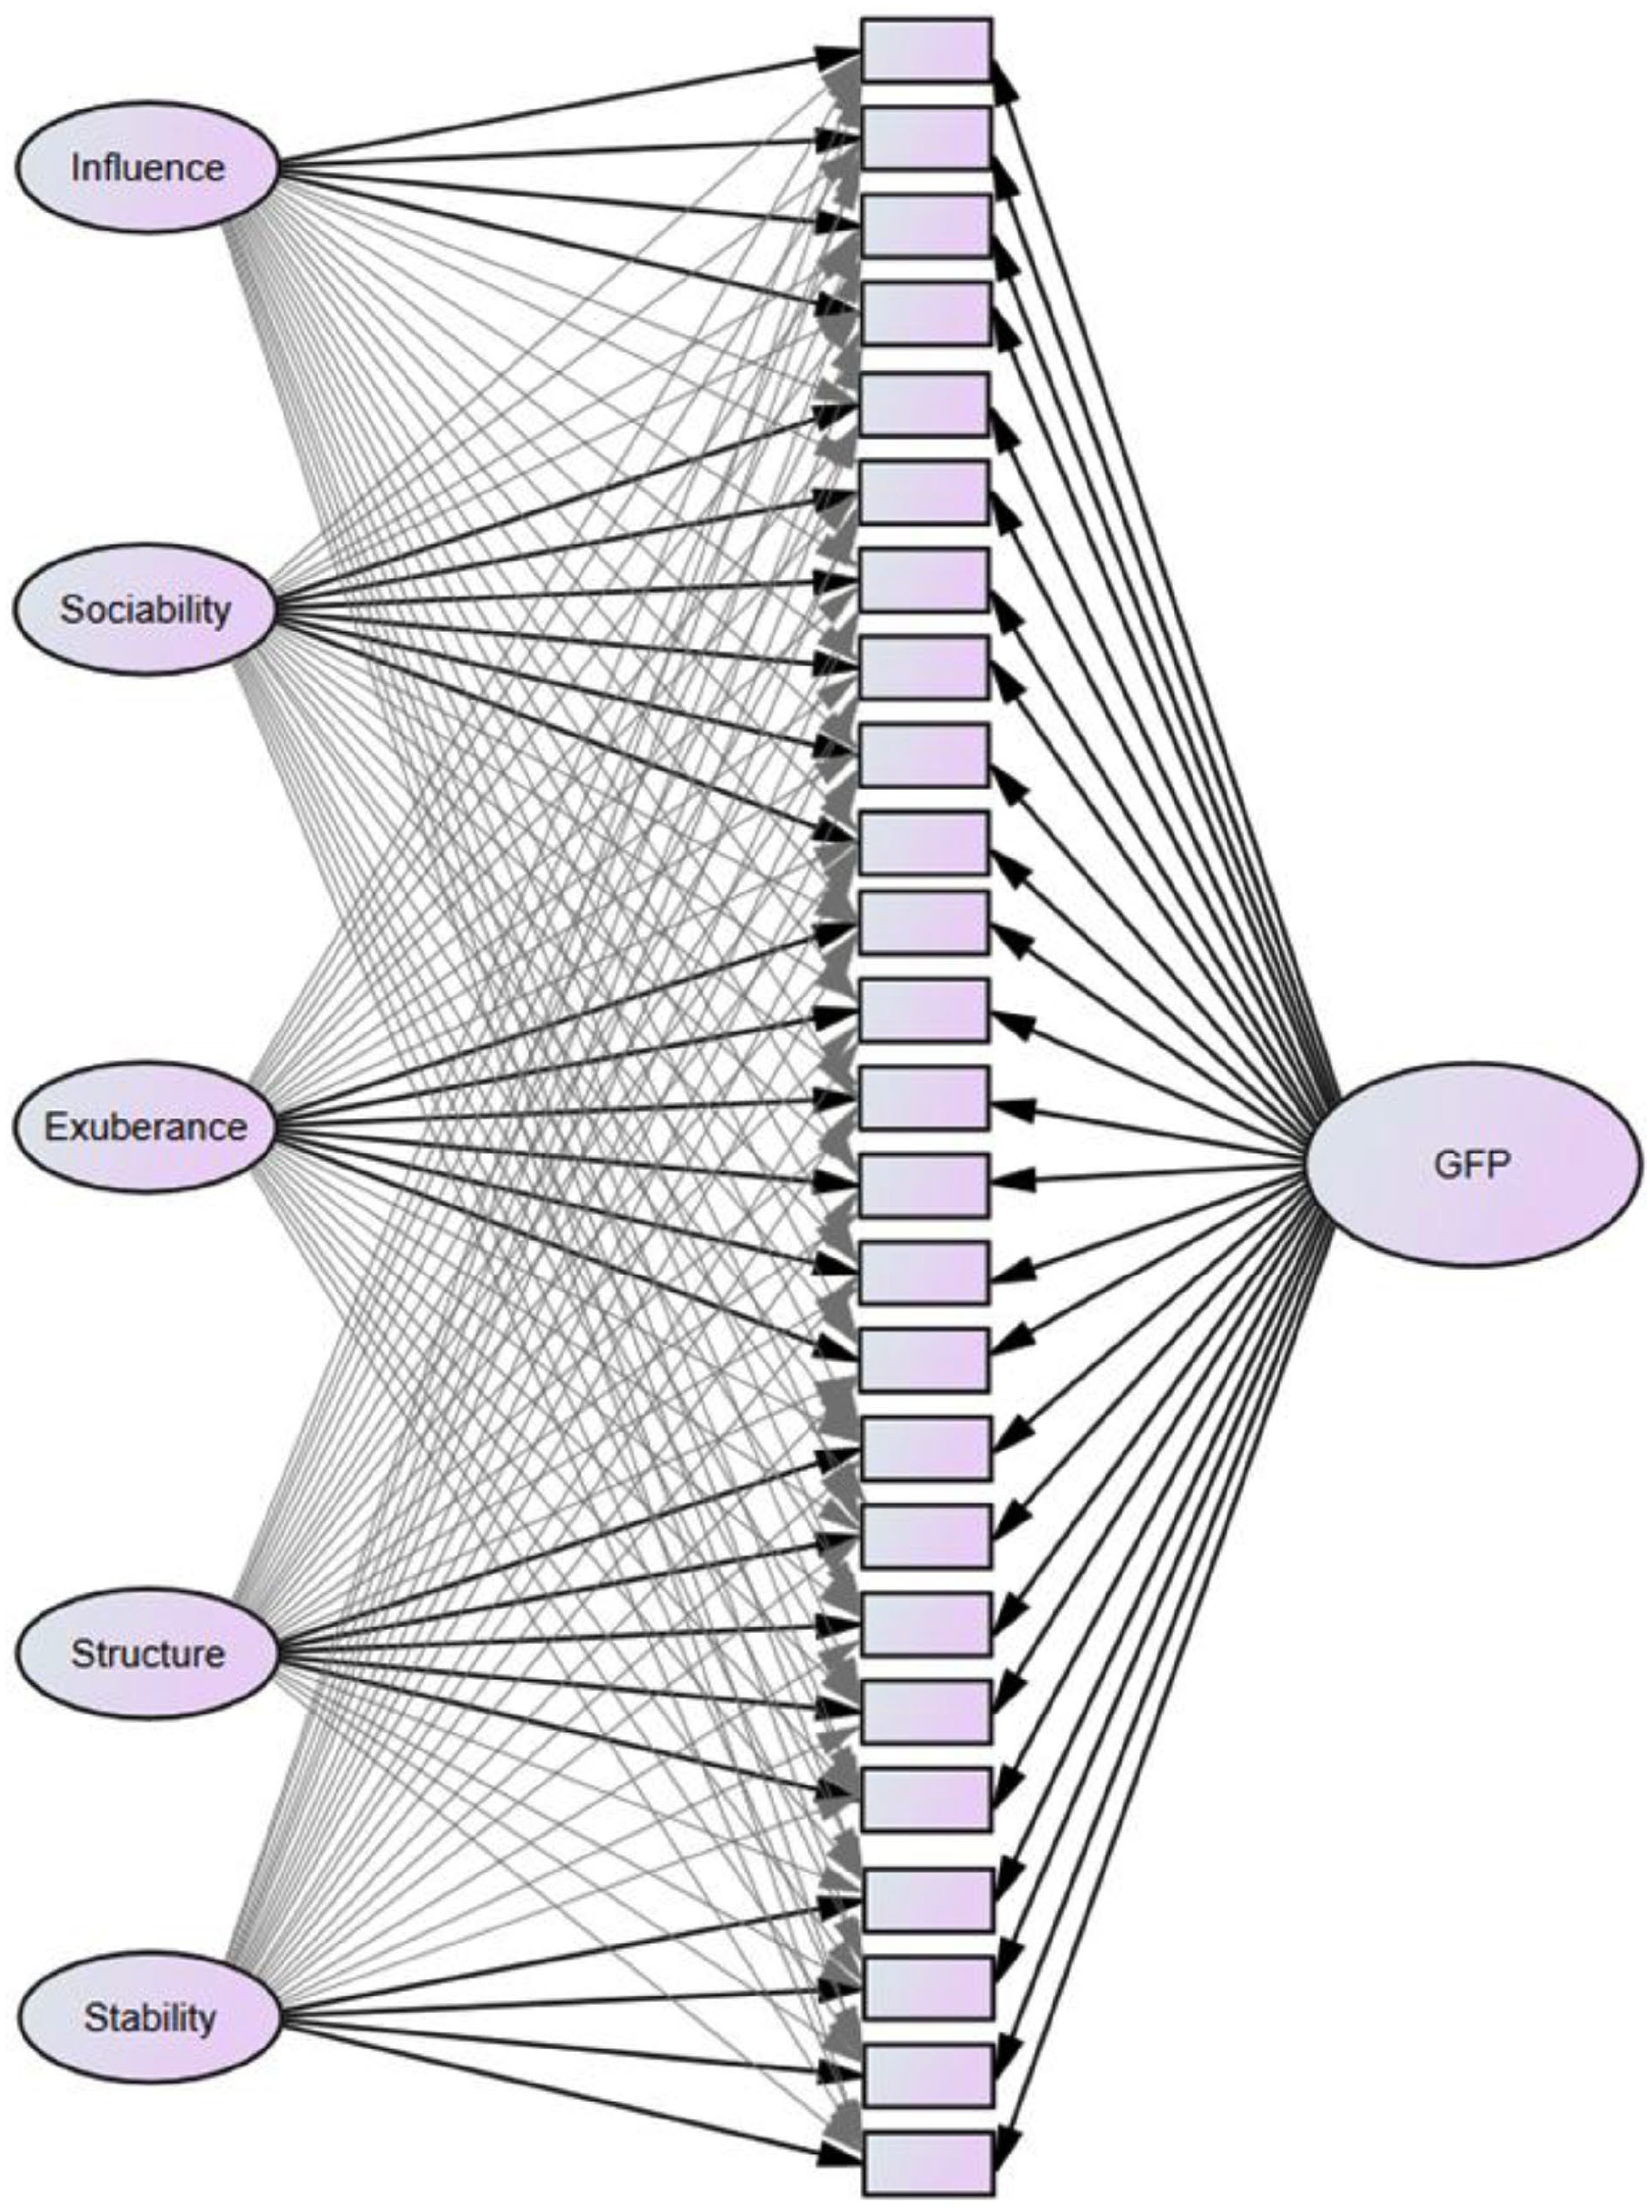
Schematic representation of bifactor ESEM fitted in the current study.
We followed the procedure (and Mplus syntax) for testing measurement invariance outlined by Morin et al. (2016), in which consecutively more restricted models are tested and compared in terms of model fit. In line with Morin et al. (2016), the following models were tested (see Table 3):
A model in which five correlated factors are estimated, separately for the development and selection groups (labeled as oblique model).
A model with one general factor directly loading on all facets, in addition to five specific domain factors estimated separately in both groups, without any imposed constraints (configural model). This bifactor model 2 and the oblique model are compared in terms of model fit to assess whether the addition of the general factor is a significant improvement over the correlated factors model.
A model in which all loadings (including cross-loadings) are constrained to be equal across both groups (weak invariance model).
A model in which all loadings and facet intercepts are constrained to be invariant (strong invariance model). If strong invariance can be demonstrated, then latent factor means from this model can be compared to investigate whether differences between the groups on these factors exist.
A model in which all loadings, intercepts, and facet uniquenesses (residuals) are constrained to be equal between the groups (strict invariance).
A model in which, additionally, factor variances and covariances are constrained to equality across groups (labeled variance–covariance model).
A final model in which, in addition to all previously specified constraints, the latent means are constrained to be equal across groups.
Goodness-of-Fit Statistics and Information Criteria for the Models Estimated.
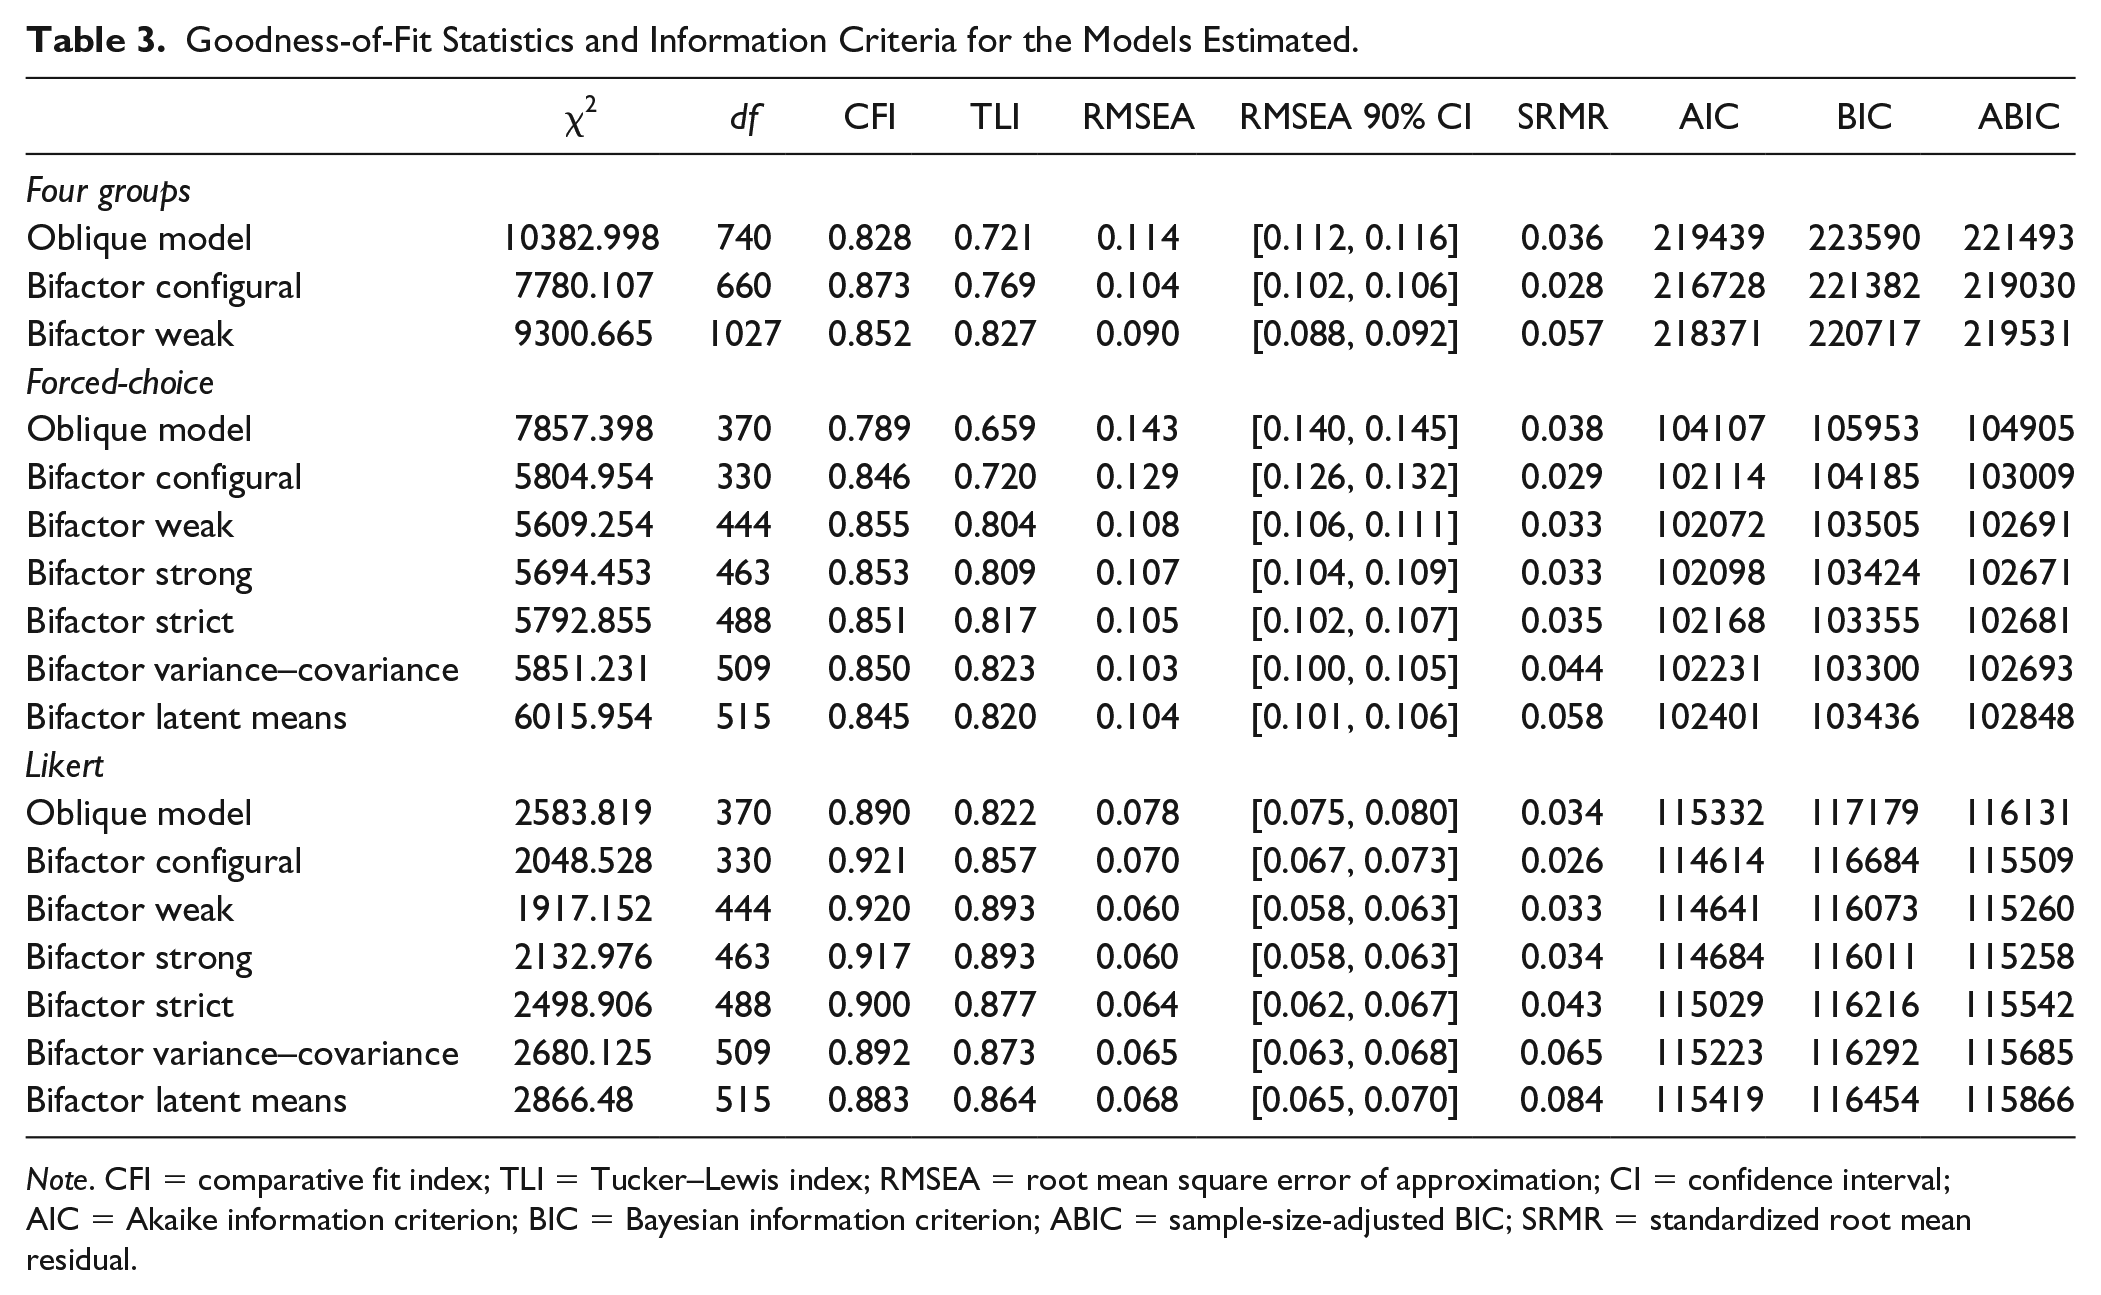
Note. CFI = comparative fit index; TLI = Tucker–Lewis index; RMSEA = root mean square error of approximation; CI = confidence interval; AIC = Akaike information criterion; BIC = Bayesian information criterion; ABIC = sample-size-adjusted BIC; SRMR = standardized root mean residual.
The two instrument types differ in terms of their format, and consequently, in terms of the scores they yield: the Likert version results in regular sum scores, while the FC version (being scored by IRT) yields theta (i.e., standard normal) scores. Thus, because the facet scores from the two different instruments are on different metrics, testing the invariance of intercepts or latent means across instrument types is unjustified. Consequently, only Model 1 through Model 3 were estimated for the four groups simultaneously. The full sequence of model tests were estimated within instrument types and results of these parallel analyses are compared to derive conclusions on similarity of factor structures across item formats.
Goodness of fit of each of the models was evaluated using the comparative fit index (CFI; Bentler, 1990), the Tucker–Lewis index (TLI; Tucker & Lewis, 1973), the root mean square error of approximation (RMSEA; Steiger, 1990), and the standardized root mean residual (SRMR). CFI and TLI values >0.90 and RMSEA and SRMR values of <0.08 are generally considered adequate (Hu & Bentler, 1999).
Invariance of parameters across groups constrained in each step was assessed by comparing the fit of the more restrictive model with the previous model. We followed the guidelines provided by Chen (2007) and Cheung and Rensvold (2002) stating invariance is implied when decrements in CFI and TLI values are <.01 and increases in RMSEA values are <.015 when moving to a more restrictive model. It has been shown, however, that the models’ information criteria can sometimes lead to different conclusions compared with fit values when testing measurement invariance (Morin et al., 2016). Therefore, in addition, we inspected the Akaike information criterion (AIC; Akaike, 1987), the Bayesian Information Criterion (BIC; Schwartz, 1978) and the sample-size-adjusted BIC (ABIC; Sclove, 1987) values between models, for which lower values indicate better fitting models.
Results
Descriptive Statistics
Table 2 shows the standardized differences in mean facet scores between the Likert and the FC versions of the personality survey. As expected, the difference between the development and selection context was significantly larger, t(48) = 2.41, p = .02, for the Likert version (average || d || = .32) than for the FC version (average || d || = .24). In general, facet scores were higher in the selection context than in the development context. The exceptions were the facets “Regularity” and “Independence” which, for the Likert version, were lower in the selection context, while for the FC version no significant differences were found. Apparently, these two facets are deemed socially undesirable when applying for a job. The pattern of score differences were, to a large extent, similar between the two instrument types: the correlation between the d values across the 25 facets was .81. For the factors, the average d value was −.39 for the Likert version and −.30 for the FC version.
Overall, these findings confirm that with the FC format, it may have been more difficult to score in the desired direction. This was also reflected in smaller differences in facet variances between the development and selection contexts for the FC version (average SD 0.95 vs. 1.02 for selection and development, respectively), compared with the Likert format (0.89 vs. 1.03).
Results From ESEM Analyses
Measurement Invariance
The fit values of the different models included in the measurement invariance tests are reported in Table 3.
Invariance across both contexts and item formats
First, we discuss the results from the tests of Model 1 through Model 3 based on all four groups simultaneously. The oblique model showed poor fit in comparison with common guidelines (with the exception of the SRMR value). Reasons for this can be found in the intercorrelations among the factors (Table 4). It appears that differences between the instruments were present, even in the absence of pressures for self-enhancement. The main culprit was the Structure factor, which showed the most diverging correlations across the two instrument types (see also Table 7). Within instruments, however, the correlations did not differ too dramatically across contexts. Although differences between the specific factors appeared to exist, adding the general factor in the bifactor (configural) model did, however, significantly improve model fit indicated by the fit values and information criteria compared with the oblique model. Thus, we continued with our invariance tests for this superior model.
Latent Factor Intercorrelations for Development and Selection by Item Format.
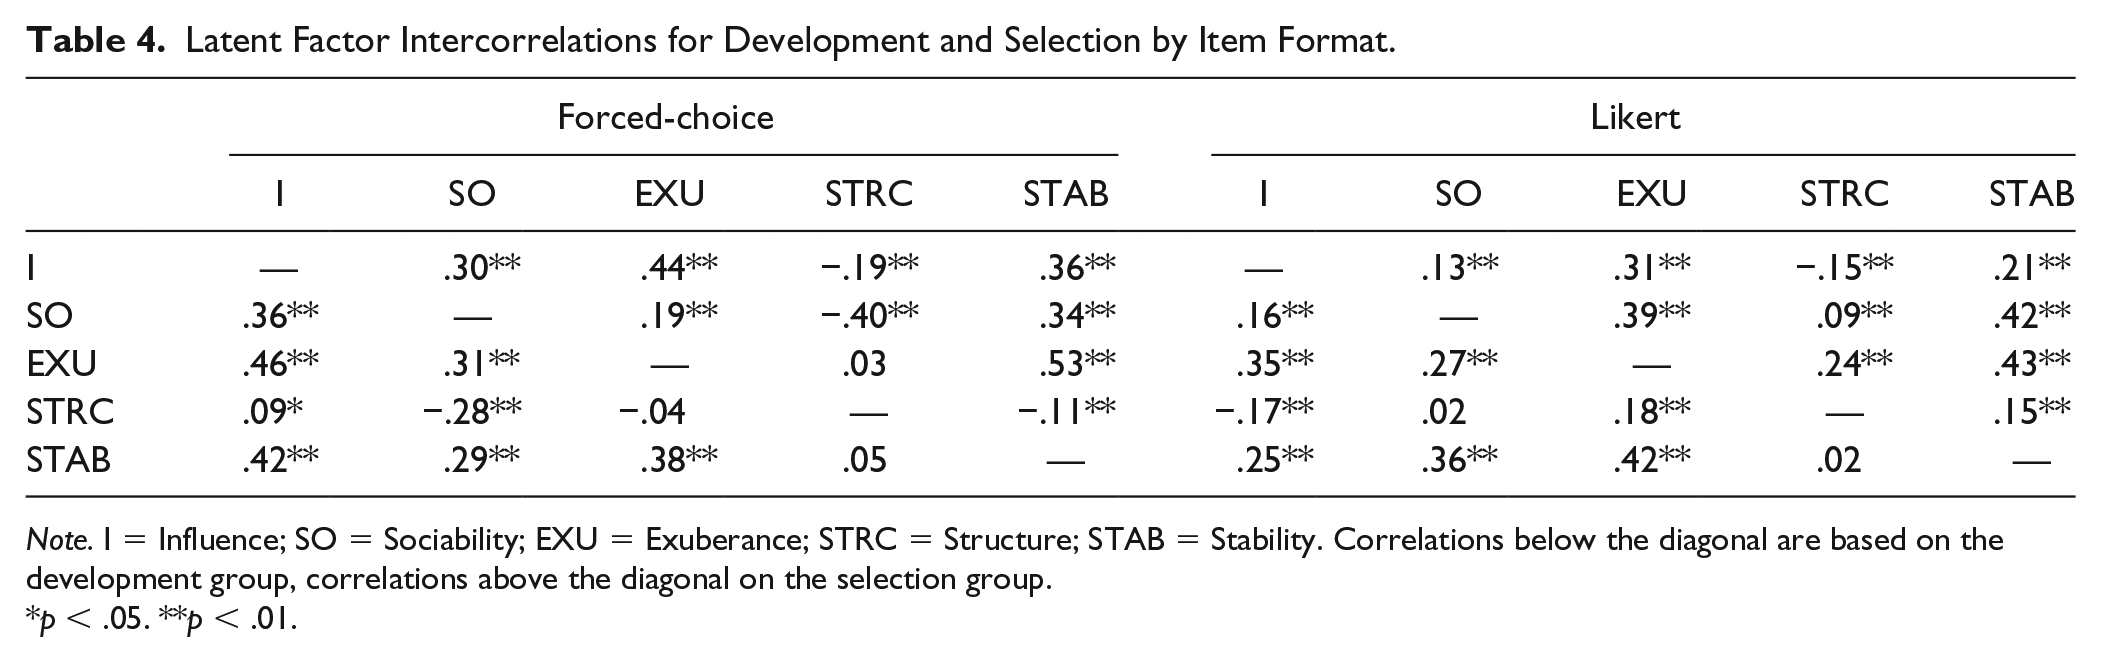
Note. I = Influence; SO = Sociability; EXU = Exuberance; STRC = Structure; STAB = Stability. Correlations below the diagonal are based on the development group, correlations above the diagonal on the selection group.
p < .05. **p < .01.
Evidence for the invariance test for equality of factor loadings (weak vs. configural) appeared to be mixed: the decrease in CFI value exceeded the cutoff of .01, and both the AIC and ABIC were higher in the weak model than in the configural model, all indicating noninvariance. However, the BIC value was lower for the weak model. In addition, the TLI value actually increased by a fairly large amount (ΔTLI = .058), while the RMSEA actually decreased (ΔRMSEA = −.014), indicating better model fit. Given that the RMSEA and TLI values impose a stronger penalty for model complexity than the CFI (Kenny, 2015), it appears more likely that invariance of factor loadings across the four groups held.
However, because of the mixed evidence, it is informative to investigate the factor loadings from the configural model to identify possible differences between the groups. Table 5 and Table 6 show the factor loadings from the configural model for respectively the FC and Likert versions of the personality questionnaire. Focusing on the FFM structure (ignoring the general factor first), we find that the ESEM bifactor model has recovered the targeted factor structure quite well in each of the four groups. That is, the targeted loadings were relatively high, while the cross-loadings were relatively low: the mean absolute targeted loadings ranged between .34 and .64, while the mean absolute cross-loadings ranged between .08 and .15. In general, the facets showed their highest loading on their targeted factor, with some exceptions (e.g., Self-presentation on the Sociability factor in the FC version in both contexts, and Perseverance on the Exuberance factor in all four groups).
Standardized Factor Loadings for Configural Bifactor Exploratory Structural Equation Model Solution for Development and Selection, Forced-Choice.
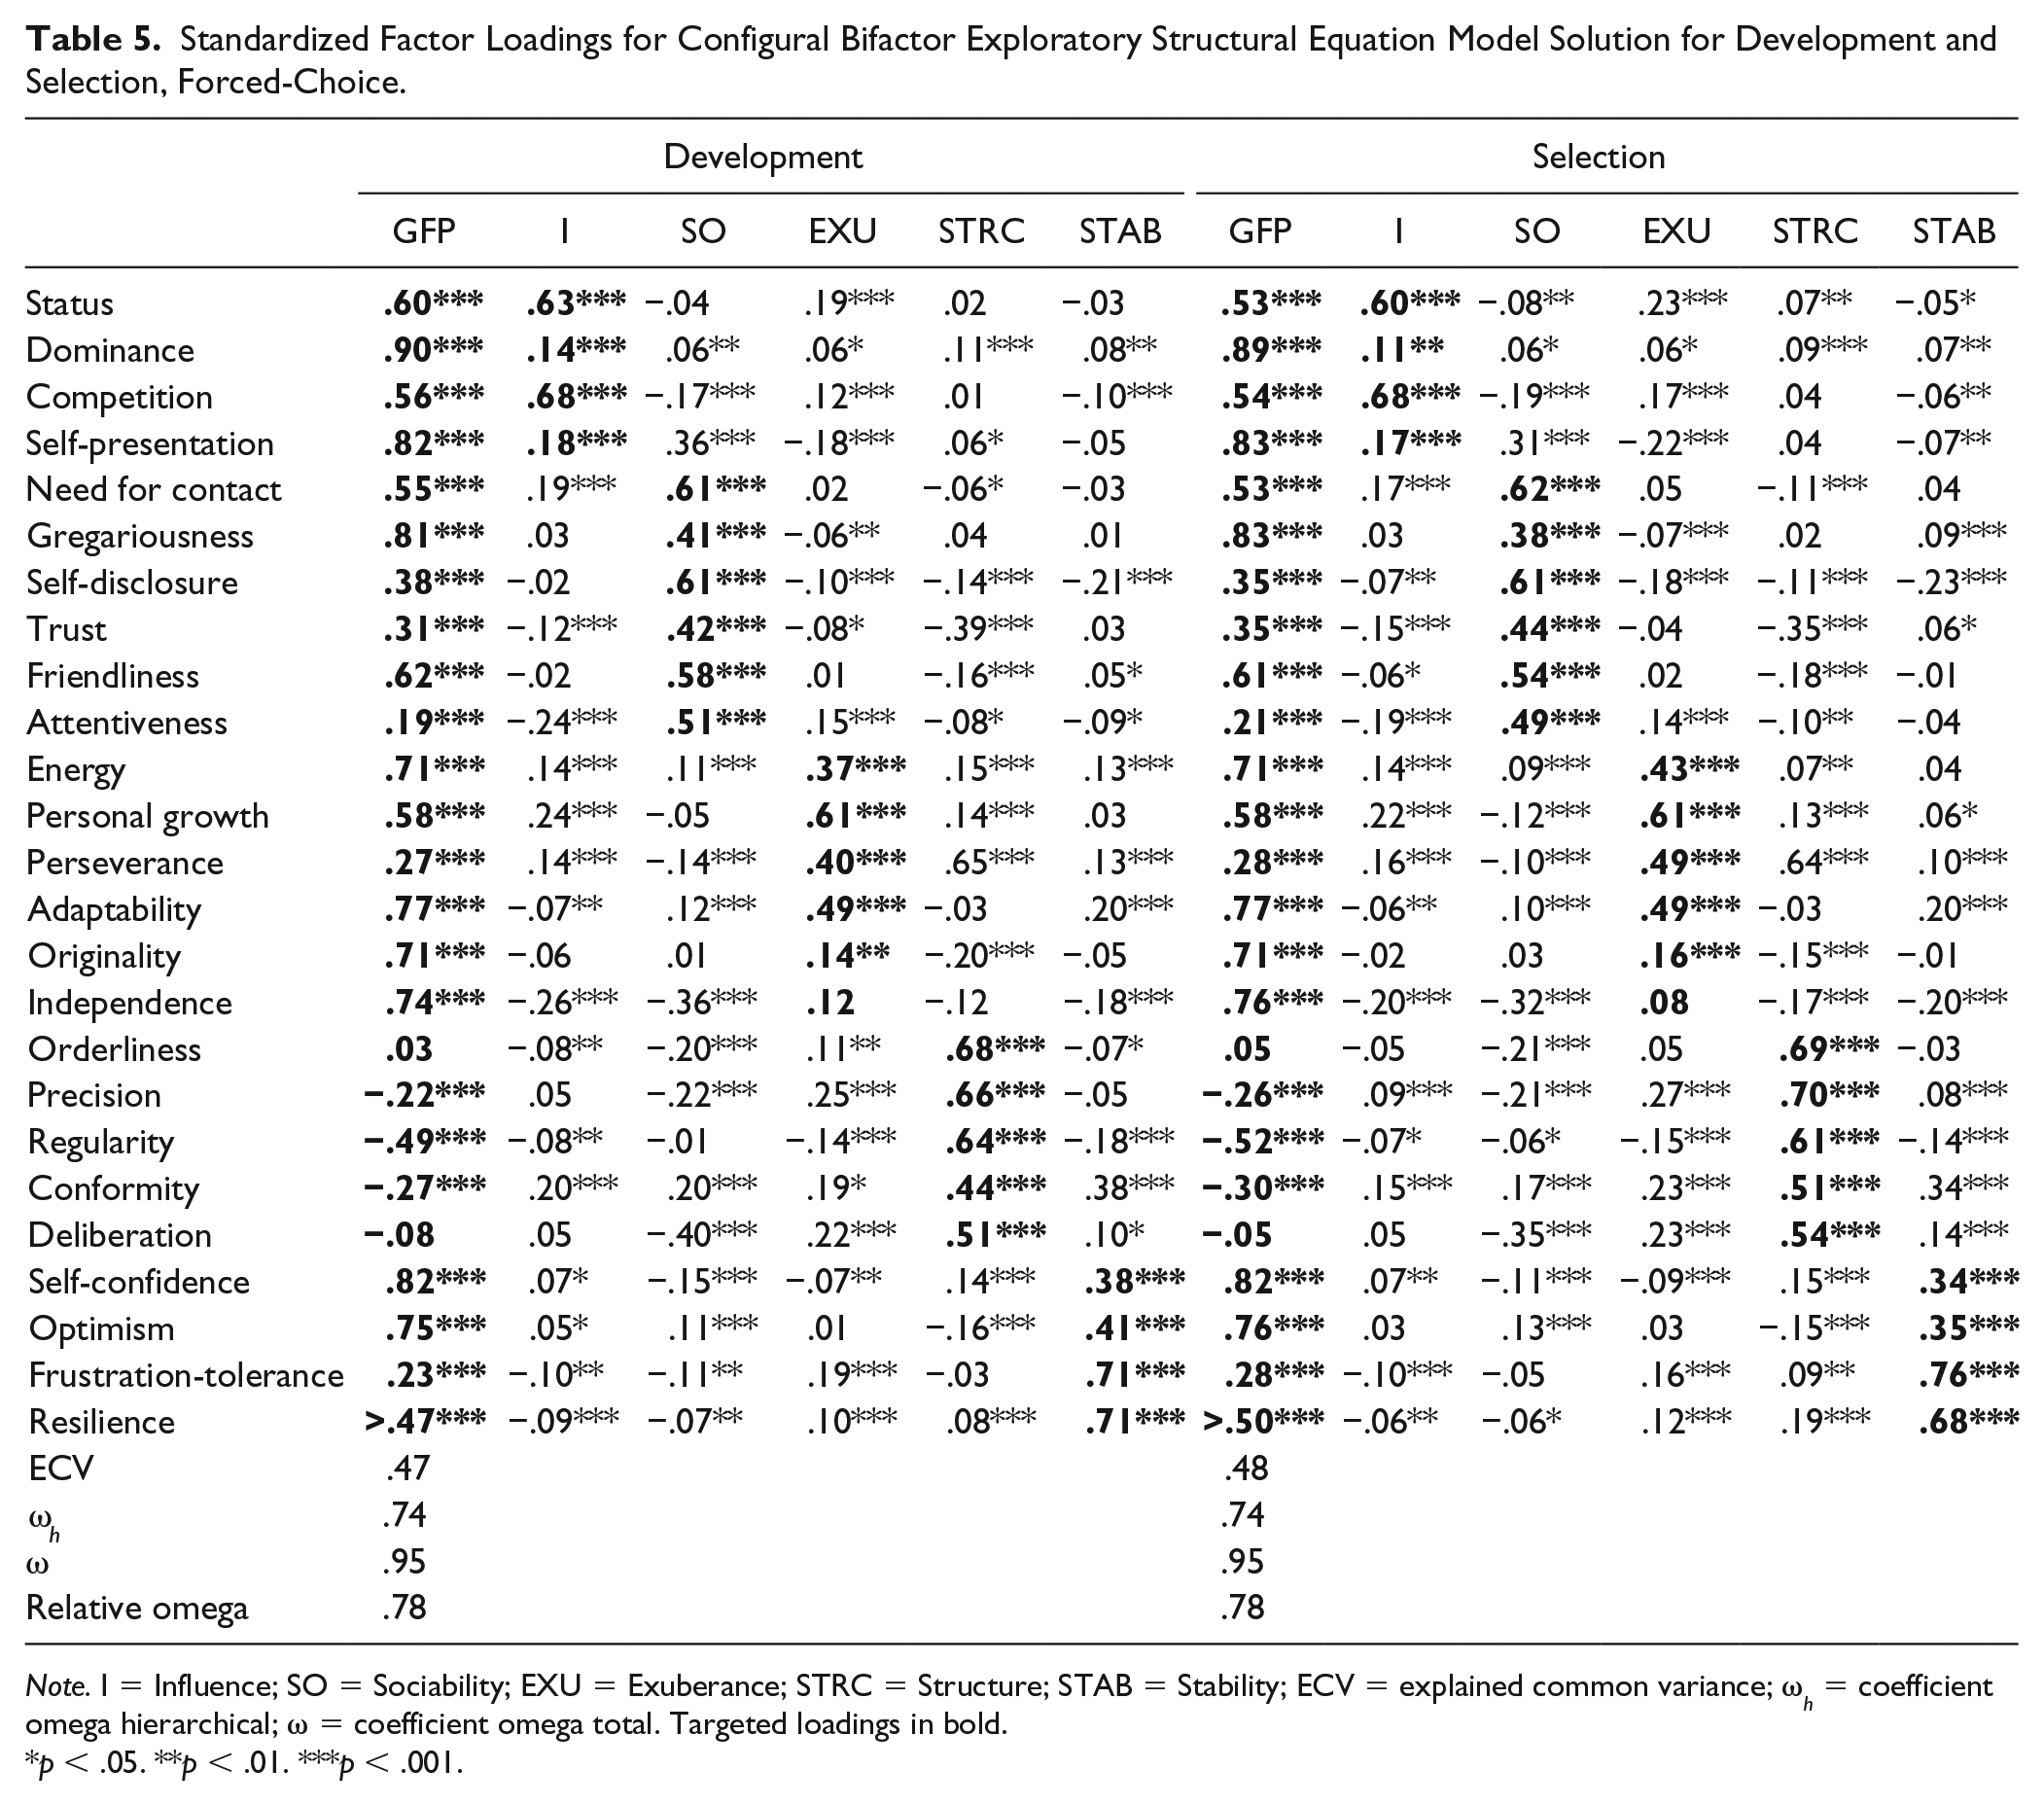
Note. I = Influence; SO = Sociability; EXU = Exuberance; STRC = Structure; STAB = Stability; ECV = explained common variance; ω h = coefficient omega hierarchical; ω = coefficient omega total. Targeted loadings in bold.
p < .05. **p < .01. ***p < .001.
Standardized Factor Loadings for Configural Bifactor Exploratory Structural Equation Model Solution for Development and Selection, Likert.
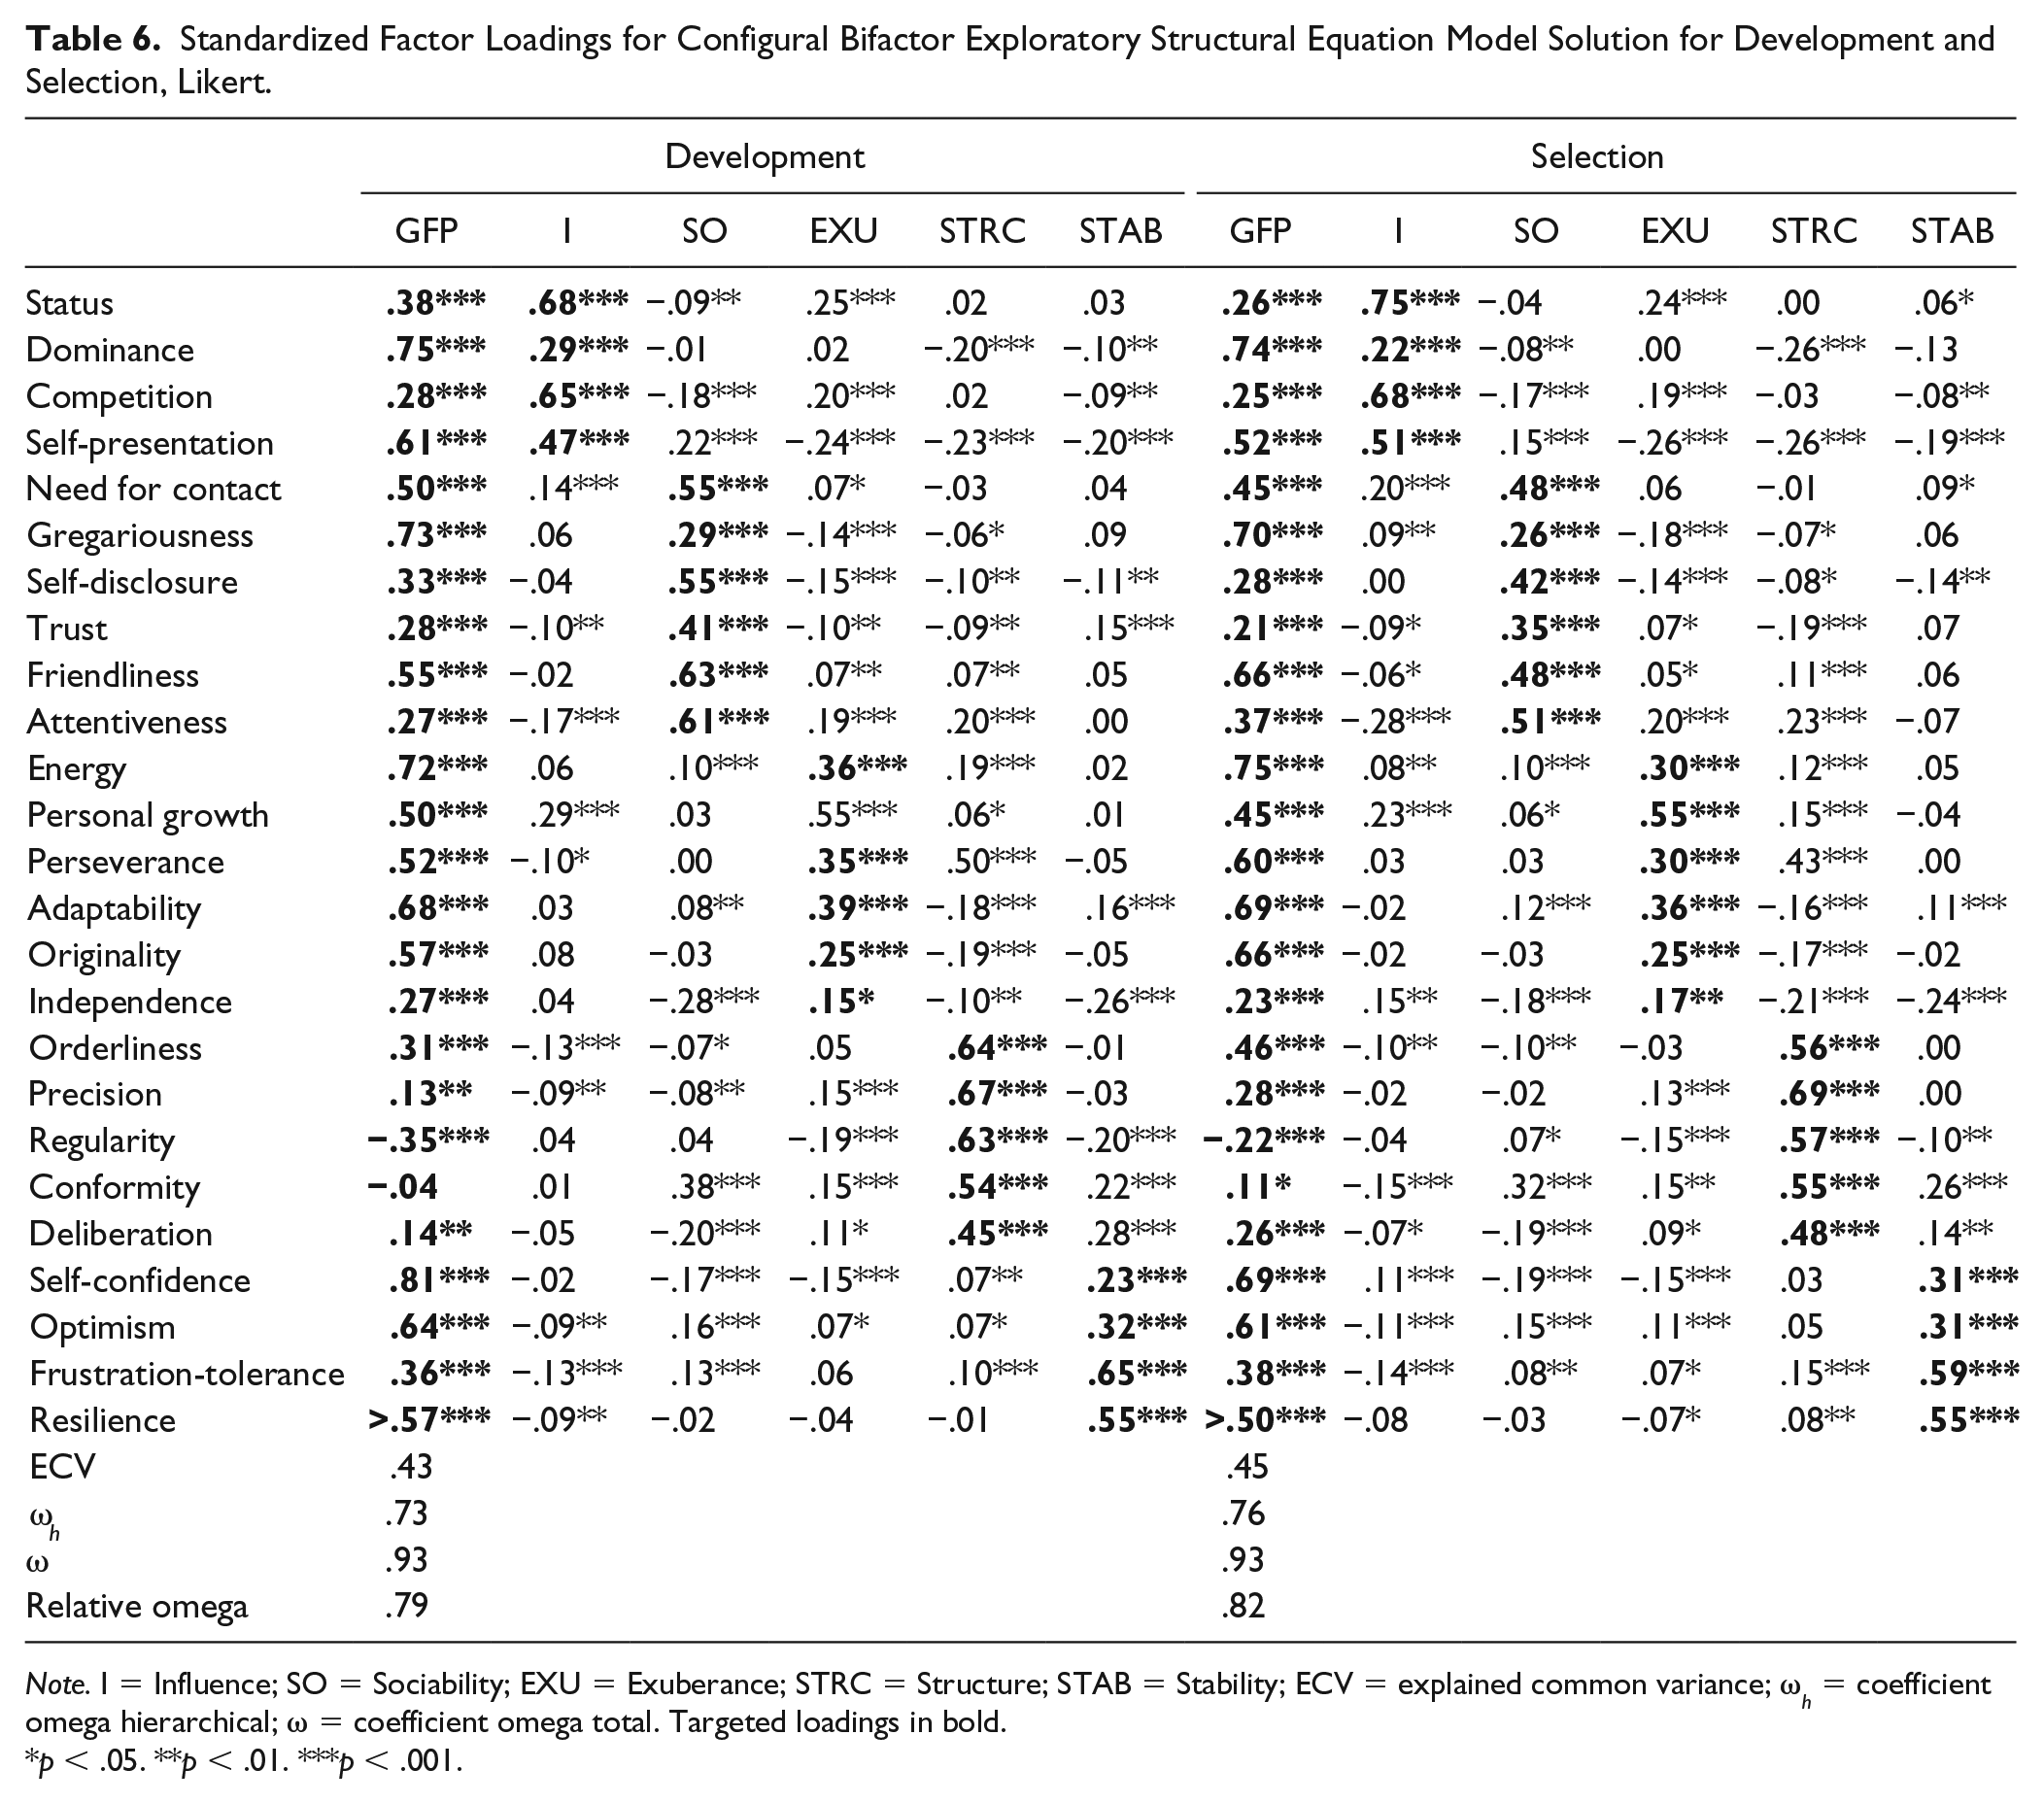
Note. I = Influence; SO = Sociability; EXU = Exuberance; STRC = Structure; STAB = Stability; ECV = explained common variance; ω h = coefficient omega hierarchical; ω = coefficient omega total. Targeted loadings in bold.
p < .05. **p < .01. ***p < .001.
It should be noted here that the factor loadings in Table 5 and Table 6 again show that some differences in the factor structures exist between the FC and Likert version, irrespective of context. For example, in the FC version, Trust had a relatively strong negative untargeted loading on the Structure factor in both contexts, while this was not found in the Likert version. Thus, differences in factor structures were more notable across instrument types than within instrument types across contexts. Still, congruence analyses showed that the five specific domain factors were highly similar across the four groups (most congruence coefficients being >.90; Table 7).
Congruence Coefficients for Specific Domain Factors and the General Factor Across Combinations of Context and Item Format Based on Configural Bifactor Exploratory Structural Equation Model Solution.
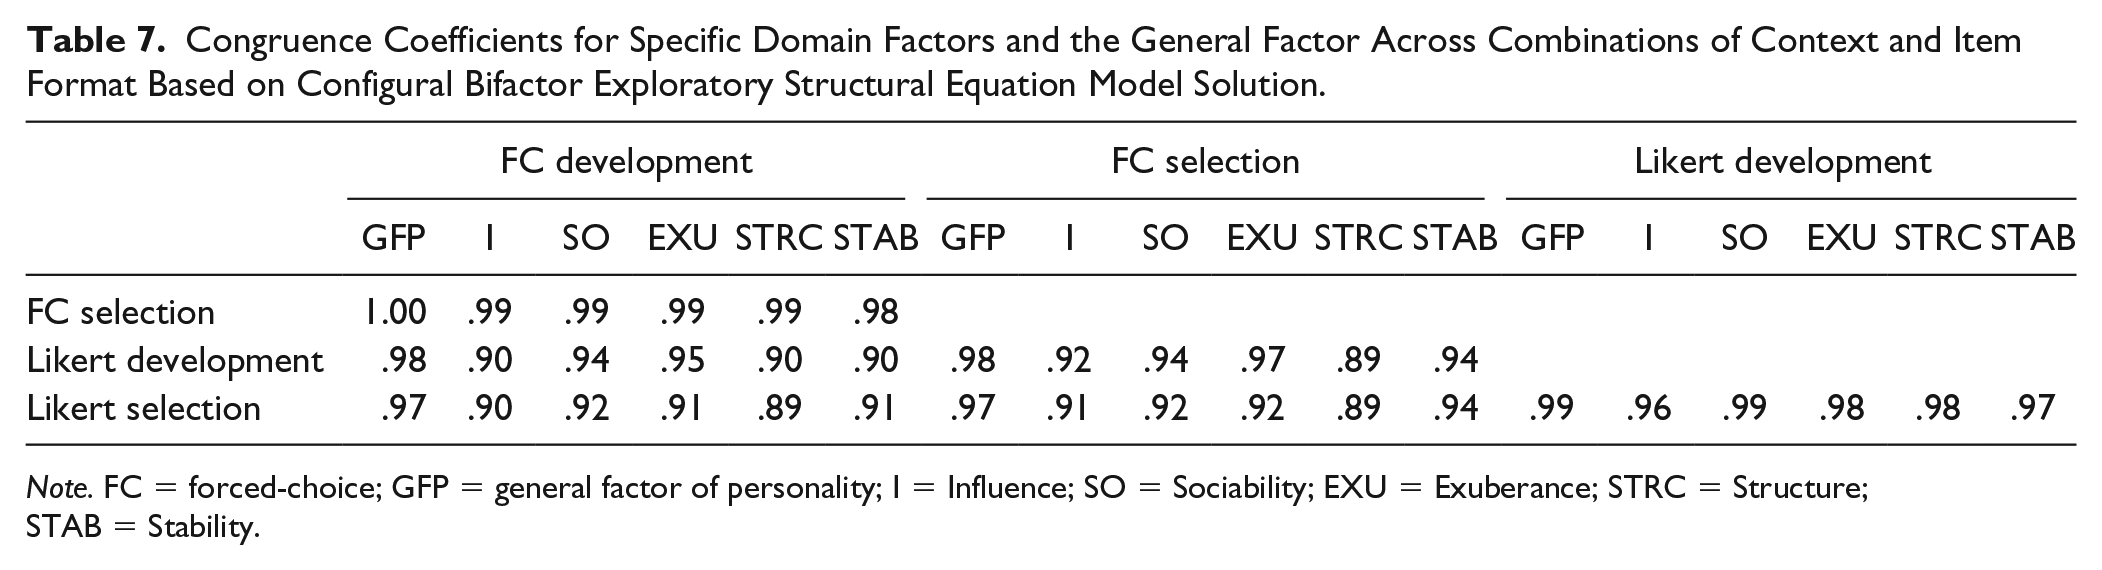
Note. FC = forced-choice; GFP = general factor of personality; I = Influence; SO = Sociability; EXU = Exuberance; STRC = Structure; STAB = Stability.
Focusing on the general factor, the results showed that this factor was well-defined in all four groups with an average loading of .43 in both the FC development group (range −.49-.90) and the FC selection group (range −.52-.89), .42 in the Likert development group (range −.35-.81) and .44 in the Likert selection group (range −.22-.75). In all four groups, the GFP was defined by high Dominance, high Gregariousness, high Energy, high Self-confidence, and low Regularity. However, the general factors from the two different instrument types had somewhat different “flavors”: Independence was only a strong indicator of the general factor in the FC version (λ of about .75 in both contexts). Similarly, competitiveness loaded on the general factor in the FC version (λ of about .55 in both contexts) but not in the Likert version (loadings <.30 in both contexts). Thus, the response format partly shaped the content of the general factor (see Discussion). However, a more formal test in the form of congruence analysis nevertheless showed the general factors to be essentially equivalent across groups (congruence coefficients approaching unity; Table 7).
Invariance across contexts within item formats
Although the previous analyses indicated that the factor structures were similar across the four groups, other relevant aspects (such as latent mean differences) could not be investigated. Therefore, we turn to our invariance tests within instruments across contexts.
Forced-choice. Generally speaking, for the FC version, in absolute terms, the fit values of the models were below common guidelines (Hu & Bentler, 1999), with the exception of the SRMR value. 3 However, in relative terms, adding the invariance constraints did not result in decreases in model fit exceeding the recommended cutoffs (ΔCFI and ΔTLI < 0.01 and ΔRMSEA < 0.015). The information criteria sometimes provided mixed evidence. For example, moving from the weak to strong model, the AIC value increased, while both BIC and ABIC decreased, indicating a better fitting model when factor loadings are constrained to be equal. However, in combination with the small decreases in fit indices found, it appears that measurement invariance between the development and selection group was largely supported for the FC version. An exception was the final latent means model; when testing invariance of latent means, information criteria are considered better indicators than changes in fit values (Fan & Sivo, 2009; Morin et al., 2016). The information criteria of the latent means model were all higher than the information criteria of the variance–covariance model, indicating that the latent means presumably were different across the four groups (see below).
Likert. The conclusions pertaining to the FC version largely applied to the Likert version, with some exceptions. Yet, overall, the fit values of the models for the Likert version were higher than for the FC version, and indicating adequate fit from the configural model onwards. A second difference compared with the FC version was that Strict invariance did not seem to hold; although the increase in the RMSEA value was below .015 (ΔRMSEA = .004), the decreases in CFI and TLI values were too large (ΔCFI = −.017 and ΔTLI = −.016), and all information criteria were higher in the more restrictive model. 4 Investigation of uniquenesses indicated that the error variances in the selection group were lower than the error variances in the development group (average u = .37 for selection, .46 for development). This was not the case for the FC version (average u = .28 for selection, .32 for development). These findings mimic those found for the facet variances (Table 2) and previous studies (e.g., Anglim et al., 2017), and could indicate that in the selection context, facet scores become more reliable because applicants respond in a more consistent fashion in line with an ideal response (Anglim et al., 2017; Griffith, Chmielowski, & Yoshita, 2007; cf. MacCann, 2013). In addition, evidence for the invariance of the variance–covariance matrix across contexts was mixed, given that the decreases in fit values were below the recommended cutoffs, while the information criteria increased compared with the strict model. Finally, as for the FC version, invariance of latent means did not seem to hold based on the information criteria.
Latent Mean Differences
The invariance tests showed that latent mean differences appeared to exist between the development and selection group for both instruments. Based on the parameters from the strong invariance model, for the Likert version, the latent mean of the general factor in the Selection group was d = .63 higher than in the development group, while in the FC version this difference was .20 (see Table 2). In terms of the specific factors, for the Likert version, the latent mean differences of the Influence (p = .56) and Exuberance (p = .08) factors were not significant. For the FC version, all latent mean differences of the specific factors were significant and somewhat larger (average d = .29) than for the Likert version (average d = .16). Apparently, differences between the development and selection context were absorbed by the general factor in the Likert version, while in the FC version, the differences were more evenly spread out across the general and specific factors. These findings appear to be in line with the idea that the FC format complicates elevating scores on all traits simultaneously, instead causing people to elevate their scores more on specific traits (e.g., Brown, 2008).
General Factor Saturation and Explained Total Variance
The relevance of the general factors in each of the four groups was estimated by OmegaH or ω h , which is a measure of explained variance by a higher order factor (McDonald, 1999; Revelle & Zinbarg, 2009; Rodriguez et al., 2016) and relative omega (by dividing ω h by ω, a measure of explained variance by all sources of common variance), which indicates how much of the reliable variance is captured by the general factor. Finally, the explained common variance (ECV) by the general factor was calculated, which indicates the relative strength of the general factor relative to the specific domain factors.
Table 5 and Table 6 (lower panels) show the ECV, ω h and relative omega values calculated based on the loadings from the configural model for the FC and Likert version respectively. 5 The results indicate that all three indicators of general factor saturation were highly similar across the four groups. Thus, the context and item format did not appear to have a strong influence on the size or importance of the general factor present in the personality inventories.
However, the size of the general factor in itself does not give direct insight into whether it mostly captures substantive or error variance. 6 Indications of these different types of variances can, however, be inferred from comparing the sources of explained total variance (ETV) in the bifactor model with those in the oblique model (five correlated factors). In the oblique model, each facet’s total explained variance can be divided in variance attributable to the specific domain factor (S), cross-loadings (CR), and error (uniqueness or u). In the bifactor model, the total explained variance is attributable to either the GFP, S, CR, or u. Consequently, when the GFP is introduced in the bifactor model, it must by definition absorb either variance attributable to, S, CR, or u. If the GFP in the bifactor model takes up mostly uniqueness variance from the oblique model, then this would suggest that the GFP reflects error rather than variance attributable to the substantive specific traits. If the explained variance due to S decreases considerably and moves to the GFP, then this would be more in line with the GFP capturing substantive trait variance. The final source of variance, CR, will most likely be a mix of substance and error: the cross-loadings indicate (partial) unintended overlap between facets, which can be either conceptually meaningful, or due to, for example, similarity in wording of items within the facets.
Table 8 shows the amounts of explained variance attributable to each of the aforementioned sources in each of the four groups. First, in all four groups, it becomes clear that when the GFP is introduced in the bifactor model, the largest reduction in ETV can be found for specific domain variance, followed by variance attributable to the cross-loadings. Thus, the GFP appears to absorb mostly variance from the specific domain factors, rather than variance attributable to measurement error. The fact that this result is found in all four groups suggests that this finding is unaffected by circumstances related to the motivation and opportunity to self-enhance. Note that this information only informs us that the makeup of the GFP appears to be consistent across the four groups, not what the makeup exactly is. That is, it provides some evidence that the GFP is not wholly artefactual, yet, this does not imply evidence for the claim that it is substantive.
Decomposition of Explained Total Variance in Oblique and Bifactor Exploratory Structural Equation Model.
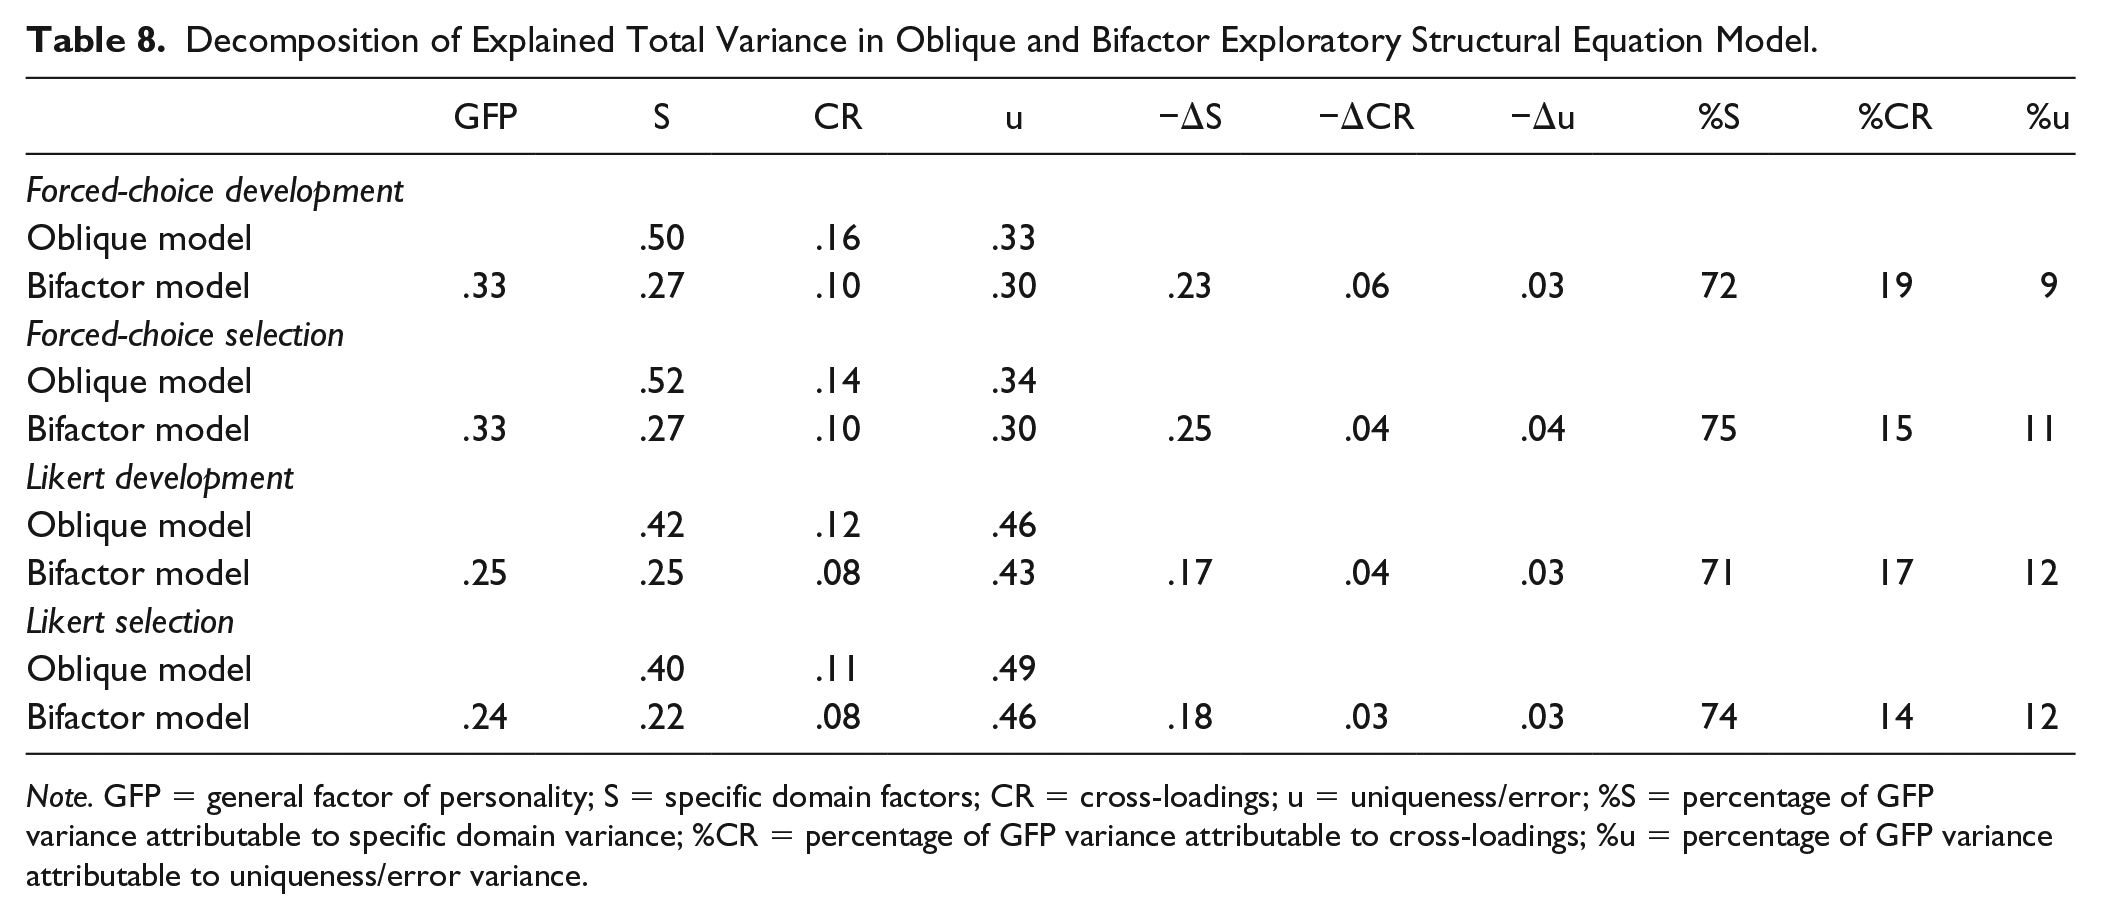
Note. GFP = general factor of personality; S = specific domain factors; CR = cross-loadings; u = uniqueness/error; %S = percentage of GFP variance attributable to specific domain variance; %CR = percentage of GFP variance attributable to cross-loadings; %u = percentage of GFP variance attributable to uniqueness/error variance.
Discussion
With regard to the main goal of the present study, we showed that the overall factor structures as well as the general factor were robust to differences in the item format of the questionnaire and test-taking context. Overall, the factor structure of the five factors and the general factors were nearly identical irrespective of whether one filled in the surveys in a selection or development context, and irrespective of whether the Likert or the FC version was used. In addition, over the instrument and context types, the level of explained variance by the general factor also was highly similar.
Our findings are in line with previous studies that did not find any differences in factor structures between high-stakes and low-stakes settings (e.g., Anglim et al., 2017; Ellingson et al., 2001; Marshall et al., 2005). Other previous studies, however, did find such differences. Explanations for the divergent findings might be found in methodological differences between our study and other studies (ESEM vs. CFA, [e.g., Schmit & Ryan, 1993], where CFA may lead to inflation of general factor loadings 7 ) or differences in the study setting (real-life vs. laboratory setting with faking instructions; e.g., Ellingson et al., 1999; Schermer, Holden, et al., 2019, Schermer, Krammer, et al., 2019). Another explanation may lie in the specific samples used for the low-stakes settings (career development vs. students; e.g., Schmit & Ryan, 1993). The use of a career development group in the current study may also have been responsible for the somewhat lower mean differences we found between the development and selection context compared to previous studies; a career development process is notably different from, for example, a setting in which students complete a personality survey for research purposes. Because of this setting, the development group might have responded slightly more socially desirable than other groups that are often used as a comparison for applicants. Interestingly, our effect sizes are highly comparable to those found in another study using a development group (Ellingson, Sackett, & Connelly, 2007), and were largest for (facets of) Emotional Stability as is often found (Birkeland et al., 2006) in the literature. Thus, our results appear to be largely in line with previous studies on this topic.
The results from the current study contribute to insight in the construct validity of the social desirability factor and provides additional information on the extent to which it might reflect a trait or an artefact. First, the fact that mean differences in facet scores and general factor scores were present between the development and selection context implies that the social desirability factor, in line with (modern) trait theories (e.g., Fleeson & Jayawickreme, 2015; Mischel & Shoda, 1995), is partly a function of the motivational context in which it is assessed. This conclusion was supported by the finding that, compared with the Likert version, the influence of the motivational context was smallest for the FC version.
Yet, it also became clear that the differences in means over the motivational contexts and the different survey types coexisted with similarity in factor structures. This similarity implies that the content and covariation among traits remains largely the same across contexts and item formats (i.e., people scoring high on Self-confidence also generally scored high on Resilience, regardless of whether a FC or Likert questionnaire was completed and regardless of the test-taking context). In the same manner, similarity of the general factor across the groups makes it plausible that this factor is not simply only the result of response distortion evoked by the context; if one would assume that the larger part of the social desirability factor was due to unrealistic self-enhancement—which should be increased in selection procedures and reduced by the forced-choice format—then it could be expected that the factor structure would differ more between the groups, which was not the case.
In general, the main findings described above can be summarized in the following theoretical model:
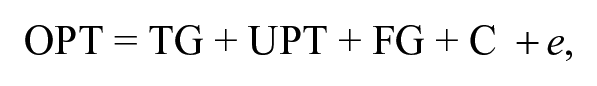
where OPT is the observed personality trait (item or facet) score in a selection context, TG represents “true” GFP variance, UPT is the unique variance of the personality trait, FG is “faked” GFP variance (caused by self-enhancement on all personality traits due to the test-taking context), C captures contextual factors (such as the job type one is applying for or the presence of warnings that faking will be detected; e.g., Dwight & Donovan, 2003; Furnham, 1990) and e represents unsystematic measurement error. Results from the present study imply that, when personality questionnaires are used in the selection context, levels of social desirability can be altered, but that score shifts appear to mainly take place in the FG part of the equation. For FC questionnaires, it appears that it is harder to alter the FG score, leading to smaller shifts in observed scores. Yet, overall, a significant amount of variance still remains in the TG and UPT part, enough to keep the rank orders between traits the same, retaining the factor structures and level of general factor saturation. Alternatively, if the GFP had truly represented merely a faking factor and hence the score shifts had mainly taken place in the TG parts, then the factor structures and the general factor would have been more different between the four groups.
The model presented above can easily be extended by the incorporation of interactions, for example, between TG and FG: it may be hypothesized that those with high TG (i.e., socially desirable) scores “fake” less because they do not need to, while those with lower TG scores add a certain constant to all the traits (captured by the FG score), yet not enough to fundamentally change the rank orders of persons across traits (Anglim et al., 2017, Ellingson et al., 2001). Again, this combination of response processes would result in mean shifts in observed scores but similar factor structures. As an example of an UPT × FG interaction, higher Conscientiousness might be associated with reduced faking (e.g., McFarland & Ryan, 2000). One can also think of interactions between FG and context (C); the type of job one is applying for may influence the extent and nature of applicant faking (Furnham, 1990). However, what most distinguishes the above model from previous models (e.g., Tett & Simonet, 2011) is that it incorporates a true social desirability factor (TG); consequently, hypotheses should be formulated in terms of relations between unique personality trait variance (UPT)—that is what remains after accounting for true individual differences in social desirability—and faking (FG).
In general, the loadings on the general factor found in the current study are in line with the theoretical account of the GFP as a social effectiveness factor. That is, loadings were high for facets related to “getting ahead” (Dominance, Energy, Self-confidence, and Adaptability) and “getting along” (Gregariousness and Friendliness). At the same time, in line with GFP theory and previous empirical studies (Van der Linden, 2011; Van der Linden, Scholte, et al., 2010), loadings were lower for facets which can be expected to be less directly related to the attainment of social goals (e.g., Deliberation, Orderliness, and Precision). However, it should be noted here that no definite conclusion can be drawn whether the general factor in personality is substantive or artefactual based on the results of the current study. We have shown that the general factor is unlikely to be mainly caused by response distortion due to the motivation to self-enhance; yet, this is not the same as showing that it is a substantive factor. The only way to properly investigate the substance of the general social desirability factor is by relating it to external criteria, such as other-reports (see Z. Chen et al., 2016), or objective outcomes (see, e.g., Pelt et al., 2017). Nevertheless, the results of the present study are informative regarding the role of the general factor in selection and assessment contexts and whether it should be treated as a nuisance or a potentially relevant construct.
A practical implication of the current study underlines previous statements that practitioners need not worry too much about the effect of SDR on construct validity, and that the FC format can remedy some of their concerns in terms of score shifts. Practitioners may thus use both Likert and FC questionnaires in both career counseling and selection contexts, without significant loss of construct validity. Accordingly, the choice for the instrument type should rather be based on other factors, such as their criterion validity or applicant reactions towards them. In terms of applicant reactions, studies have shown that FC questionnaires elicit more negative attitudes, because of their cognitive demands and frustration related to being forced to choose between two equally (un)attractive options (Converse et al., 2008). Regarding criterion validity, a recent meta-analysis has shown higher predictive validities for FC questionnaires compared with Likert questionnaires (Salgado et al., 2015). However, these meta-analytic data were gathered under low-stake settings and the results should be replicated based on data obtained in high-stake settings. In addition, because FC questionnaires are more cognitively demanding to complete (Vasilopoulos et al., 2006), part of the higher criterion validity might actually be due to cognitive abilities rather than the intended measured personality constructs. Higher saturation with intelligence of FC questionnaires might also explain why the (general) factor structures of the two instrument in the current study differed somewhat even when both were completed in the development context; perhaps, individual differences in intelligence influenced the content of the facets in the FC version to a larger extent than in the Likert version, slightly altering the (general) factor(s) and reducing model fit of the ESEM models of the FC instrument.
Limitations and Future Research
Although our between-subject design served the purposes of the current study, it comes with its limitations (Ellingson et al., 2007). For example, the motivated and nonmotivated groups were not formed at random. On the other hand, the matching procedure ensured that the groups were equivalent at least in terms of demographic variables. Still our findings might have been affected by group differences on confounding variables related to social desirability as a response style (e.g., competitive worldviews; Roulin et al., 2016), as a trait (e.g., self-control; Uziel, 2010), or both (e.g., integrity; De Vries, Zettler, & Hilbig, 2014; McFarland & Ryan, 2000, 2006). A repeated measures within-subject design using the same four groups as in the current study would be an interesting follow-up study as it allows for controlling for and investigation of aforementioned confounders (see Van Geert el al., 2016).
In the previous section, we have outlined a simple theoretical model that can be tested in the future. The current study can be regarded as a first step in disentangling the different sources of variance, but more studies are needed. Possibilities for further studies include variance decomposition studies (e.g., McCrae, 2018) comparing self and other reports based on Likert and FC versions of personality. The current study has shown that the FC method can reduce some rater bias in self-ratings, while Bartram (2007) showed a similar effect for other-ratings. Thus, when using the FC format for both self and other-ratings, more bias-free estimates of traits (facets, Big Five domains or the GFP) might be obtained.
The present study focused on the effect of item format and test-taking context on the construct validity of the GFP; a next logical step would be to focus on its criterion validity. That is, the substantive interpretation of the GFP would be even more plausible if similar associations between the GFP and criteria (e.g., job performance) are found in each of the four groups of the present study. In our view, a full, perhaps meta-analytic, investigation of the criterion validity of the GFP extracted from FC and Likert questionnaires (Pelt et al., 2017), both under low-stakes and high-stakes settings, would therefore be appropriate at this point (e.g., Salgado et al., 2015). In addition, with the advent of new psychometric methods to retrieve normative scores from FC questionnaires such as the Thurstonian IRT model, data from previous studies can be reanalyzed to get a clearer picture of the criterion validity of FC questionnaires—and the GFPs extracted from them.
A correlate that would be useful to take into account in future studies is cognitive ability. First, the relation between the GFP and cognitive abilities under low-stakes settings remains unclear (Dunkel, Van der Linden, Beaver, & Woodley, 2014; Loehlin et al., 2015). Second, under high-stakes settings, the association between the GFP and intelligence has been found to be positive and inflated—although this relation was only found in an instructed, laboratory setting (MacCann et al., 2017) and not with real job candidates (Schermer & Goffin, 2018). The positive finding is consistent with the idea that intelligence is related to identifying what behavior is required in selection situations (Bing, Whanger, Davison, & VanHook, 2004; Geiger, Olderbak, Sauter, & Wilhelm, 2018). Given that FC questionnaires make this identification harder, the relation between the GFP and intelligence may be stronger for these types of inventories (Vasilopoulos et al., 2006).
Concluding Remarks
SDR or faking continues to be of interest to both researchers and practitioners. The current study shows that in terms of construct validity, previously expressed concerns about the effect of SDR may be unwarranted in the sense that factor structures were highly similar across groups differing in their motivational pressures and opportunities to distort responses. The same equivalence was found for the general factor in the personality questionnaire. These results seem to suggest that social desirability in general, and the common variance among personality traits more specifically, appears to be more consistent and robust than previously thought.
Supplemental Material
Supplemental_Material – Supplemental material for The Motivation and Opportunity for Socially Desirable Responding Does Not Alter the General Factor of Personality
Supplemental material, Supplemental_Material for The Motivation and Opportunity for Socially Desirable Responding Does Not Alter the General Factor of Personality by Dirk H. M. Pelt, Dimitri Van der Linden, Curtis S. Dunkel and Marise Ph. Born in Assessment
Footnotes
Declaration of Conflicting Interests
The author(s) declared the following potential conflicts of interest with respect to the research, authorship, and/or publication of this article: The first author is employed by Ixly, the company that has developed and publishes the WPI, the personality measure used in the current study. The first author has no further financial involvements (e.g., royalties) concerning the WPI.
Funding
The author(s) disclosed receipt of the following financial support for the research, authorship, and/or publication of this article: This research was supported by Ixly, Utrecht, The Netherlands.
Supplemental Material
Supplemental material for this article is available online.
Notes
References
Supplementary Material
Please find the following supplemental material available below.
For Open Access articles published under a Creative Commons License, all supplemental material carries the same license as the article it is associated with.
For non-Open Access articles published, all supplemental material carries a non-exclusive license, and permission requests for re-use of supplemental material or any part of supplemental material shall be sent directly to the copyright owner as specified in the copyright notice associated with the article.