
Abstract
Test authors report sample reliability values but rarely consider the sampling error and related confidence intervals. This study investigated the truth of this conjecture for 116 tests with 1,024 reliability estimates (105 pertaining to test batteries and 919 to tests measuring a single attribute) obtained from an online database. Based on 90% confidence intervals, approximately 20% of the initial quality assessments had to be downgraded. For 95% confidence intervals, the percentage was approximately 23%. The results demonstrated that reported reliability values cannot be trusted without considering their estimation precision.
Keywords
General Introduction
Scores on psychological tests and questionnaires are used for making high-stakes decisions about hiring applicants for a job or rejecting them; assigning or withholding a patient a particular treatment, a therapy, or a training; accepting students at a school or rejecting them; enrolling students in a course or rejecting them; or passing or failing an exam. In these applications, the stakes are high for the individuals and the organizations involved, and tests must satisfy a couple of quality criteria to guarantee correct decisions. For example, the test score must be highly reliable and valid, and norms must be available to interpret individual test performance. In lower-stakes applications, tests also must satisfy quality requirements but usually lower than for high-stakes decisions (Evers, Lucassen, Meijer, & Sijtsma, 2010). For example, an inventory may be used to assess personal interests to help clarifying the kind of follow-up education a high school student might pursue. Often, the inventory is only one of the many data sources used next to, for example, school and parental advice. Another example is the use of the test score as the dependent variables in experiments (e.g., degree of anxiety) or an independent variable in linear explanatory models (e.g., as predictors of therapy success).
The assessment of a test involves many different quality aspects (Clark & Watson, 1995). This study focuses on test-score reliability. In particular, we study the problem that in test construction research, test constructors tend not to estimate confidence intervals (CIs) for test-score reliability and thus do not take the uncertainty of the estimates into account when assessing the quality of their test (Fan & Thompson, 2001). For example, a sample reliability equal to .84 is incorrectly treated as if it were a parameter not liable to sampling error and it is concluded, for example, that a test has a reliability of .84, ignoring that a 95% CI equal to, say, (.74; .91), would suggest true reliability may be considerably higher or lower than .84. Kelley and Cheng (2012) argued that CIs may be more important than reliability point estimates, and Wilkinson and the Task Force on Statistical Inference (1999) provided general guidelines for the use of statistics such as CIs in psychological research. In addition, test assessment agencies tend to base their assessments of reliability on the estimate thus ignoring sampling error (e.g., Evers, Lucassen, et al., 2010). This means that if they consider reliability denoted by ρ in excess of a criterion value of, say, c, to be “good,” they make the decision provided sample reliability r > c without statistically testing whether ρ > c given sample value r.
Maxwell, Kelley, and Rausch (2008) emphasized the importance of sample size considerations to obtain CIs allowing simultaneously to assess the direction, the magnitude (the authors refer to estimation precision), and the accuracy of an effect. For reliability, this translates to assessing whether, based on the available sample, one has enough evidence that ρ > c (c must not be in the CI), which is a power issue, whether one can pinpoint ρ to a sufficiently narrow range of plausible values, and whether one can be confident that an estimate of ρ is unbiased. The latter topic is problematic in reliability estimation, because all available methods are known to be lower bounds, and hence negatively biased, but it is also known which ones are more accurate, however leaving the magnitude of the bias unknown. Oosterwijk, Van der Ark, and Sijtsma (2017) discuss estimation procedures that tend to be positively biased. In this study, direction and precision are most relevant, and using sample r rather than the CI for ρ to make decisions invites reliability assessments that are too optimistic, providing test practitioners, their clients and patients with measurement instruments that promise better psychometric quality than is realistic, a situation one should want to avoid.
Relevance of the Study
We estimated the magnitude of the problem of ignoring CIs and treating reliability estimates as if they were parameter values in practical test construction and test quality assessment. We investigated this in a large database in which test assessments are collected (Egberink, Janssen, & Vermeulen, 2009-2016). The database is operated by the Dutch Committee on Tests and Testing (acronym COTAN) that works under the auspices of the Dutch Association of Psychologists (acronym NIP). Dutch and Dutch-language Belgian test constructors and test practitioners appreciate COTAN to assess their tests and the results published in the database. We investigated to what degree not taking CIs into account and relying solely on reliability point estimates affected the assessments of tests’ reliability. We determined the percentage of tests in the database for which we had to change the quality assessment when CIs were considered instead of point estimates.
COTAN is an active test assessment agency of good reputation that has assessed the quality of tests and questionnaires since 1959; also see Evers, Sijtsma, Meijer, and Lucassen (2010) and Sijtsma (2012). Dutch governmental and insurance companies require COTAN’s approval of tests as a necessary condition for accepting requests for particular benefits and payments, respectively. For the majority of the tests in the database, statistical information needed to estimate CIs was unavailable and despite great effort we were able to retrieve only little additional information from university libraries. Incompleteness of the available subset of tests concerns a typical problem found in meta-analysis, possibly introducing bias in the results. Despite this drawback, we expect we can have more confidence in tests for which complete information was available than in tests for which information was lacking. In addition, the available tests represent various psychological attributes well, thus sufficiently covering the testing field. The widespread use of tests in the Netherlands guarantees some degree of generality of the results, thus mitigating the call for a sample of tests from a larger geographic region. This study is unique and the available test subset is comprehensive even though it is incomplete.
Based on a sample estimate of the test-score reliability the test constructor reports, and using a generally accepted classification system that we discuss later, the COTAN database classifies the tests’ reliability as insufficient, sufficient, or good. Dutch and Belgian test constructors accept and use the COTAN classification system for test assessment including the reliability classification, as a guide for test construction, which amplifies its importance even though the classification is arbitrary to some extent and other guidelines are available in the literature. For different reliability classifications, see Nunnally (1978, p. 246), Cascio (1991, p. 141), Clark and Watson (1995), Murphy and Davidshofer (1998, pp. 142-143), DeVellis (2003, pp. 94-95), Smith and Smith (2005, pp. 121-122), Gregory (2007, p. 113), and McIntire and Miller (2007, p. 202). Evers et al. (2013, pp. 43-52), on behalf of the European Federation of Psychologists’ Associations (EFPA), provided four categories for reliability, the highest of which was labelled “Excellent” for high-stakes testing (r ≥ .9) and the next “Good” (.8 ≤ .9). Christensen (1997, pp. 217-219) discussed recommendations for reliability for dependent variables in experiments.
We chose to investigate the reliability rather the standard error of measurement, although one might argue that the latter quantity should be preferred for assessing the quality of decisions about individuals on the basis of test scores (e.g., Mellenbergh, 1996). Because the standard error of measurement is based directly on reliability, the choice for either one is arbitrary. Moreover, researchers routinely report reliability (e.g., AERA, APA, & NCME, 2014; Wilkinson and the Task Force on Statistical Inference, 1999), and test agencies assess reliability prior to the standard error of measurement, emphasizing reliability’s pivotal position in measurement assessment.
Based on our experience, we had no knowledge of articles reporting CIs for reliability and a quick and modest literature scan did not alter this conclusion. We found this absence remarkable, because in particular for coefficient alpha (Cronbach, 1951) methods for estimating standard errors and CIs have long been available (e.g., Feldt, 1965; Feldt, Woodruff, & Salih, 1987; Hakstian & Whalen, 1976; Kristof, 1963). In addition, several authorities have urged researchers to report CIs (e.g., AERA, APA, & NCME, 2014), but apparently so far this has had little success.
Organization of the Article
This article is organized as follows. First, the vast majority of the tests we studied used coefficient alpha (e.g., Cronbach, 1951) and a non-ignorable minority used the split-half method (e.g., Lord & Novick, 1968, pp. 135-136). Other methods were rarely used. Because split-half method and coefficient alpha are based on classical test theory (Lord & Novick, 1968), we discussed reliability as defined by classical test theory, and split-half reliability and coefficient alpha. For both methods, we showed how CIs can be computed. Sijtsma and Van der Ark (2015) discuss other approaches based on factor analysis and generalizability theory. Second, we discuss collecting reliability data for this study from the online database of COTAN that is available to paid subscribers, and we discuss both the assessment of reliability standards without (i.e., COTAN) and with (i.e., our approach) using CIs. Third, we present the results of the reliability data collection from the COTAN online database and we discuss the reliability assessment results using CIs for reliability and compare the results with the assessments COTAN published. Finally, we outline the results of this study and their meaning for future reliability assessment.
Reliability and Estimation Methods
Classical Test Theory and Definition of Reliability
Assume that a psychological test consists of
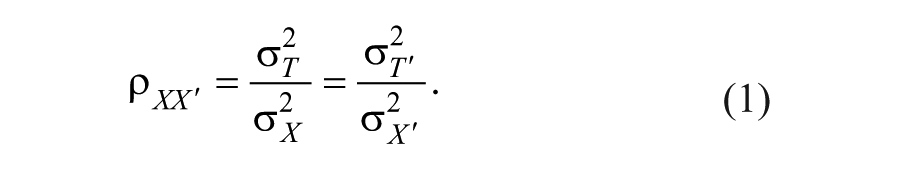
Reliability ranges from 0 (if
Reliability in Equation (1) cannot be computed in practice, because parallel test scores
The Two Reliability Methods Used in the COTAN Database
We investigated the split-half method and coefficient alpha. Cronbach (1951) argued that the latter method must replace the former, an advice that test constructors took to heart, making the easy to use coefficient alpha by far the most popular reliability method (Heiser et al., 2016). Despite heavy criticism (e.g., Clark & Watson, 1995; Cortina, 1993; Cronbach & Shavelson, 2004; Schmitt,1996; Sijtsma, 2009) and the existence of many alternatives providing better approximations to reliability (Sijtsma & Van der Ark, 2015), coefficient alpha continues to be the reliability method most frequently used (Heiser et al., 2016). We limited our attention to the split-half method and coefficient alpha, not because we prefer these methods but because they are predominantly used in the COTAN database.
Split-Half Method
The researcher splits his test in two halves, correlates the test scores obtained on the halves, and uses a correction formula to obtain an estimate of the reliability for the whole test. Formally, two situations may be distinguished. First, when the test halves are parallel, the product–moment correlation between the half-test scores
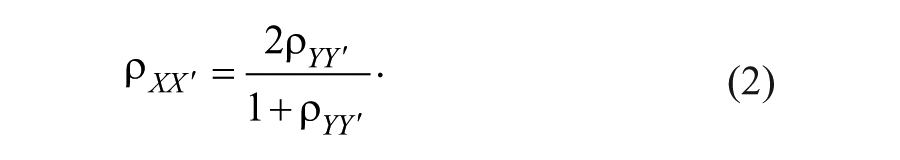
Second, when test halves are not parallel, Equation (2) produces an invalid result; that is,
Methods to compute a CI for SH are available (Charter, 2000; Fan & Thompson 2001). Let
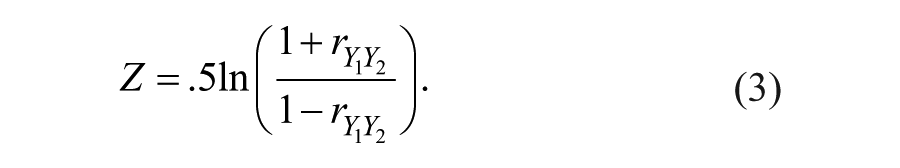
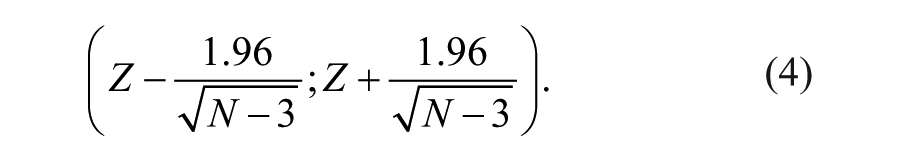
Fourth, the bounds of the CI can be transformed into bounds on the
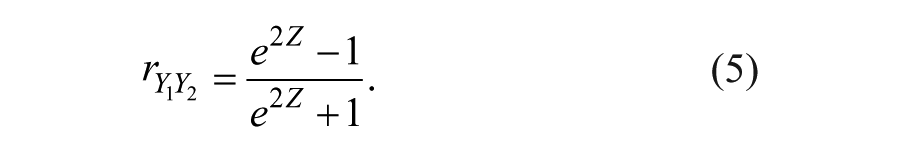
Finally, after having obtained the bounds of a CI for
Coefficient Alpha
Let the covariance between items
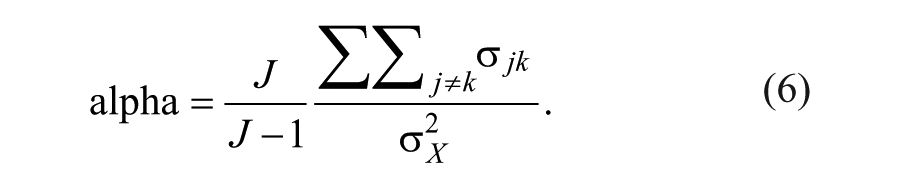
Given classical test theory assumptions, alpha is a lower bound to the reliability;
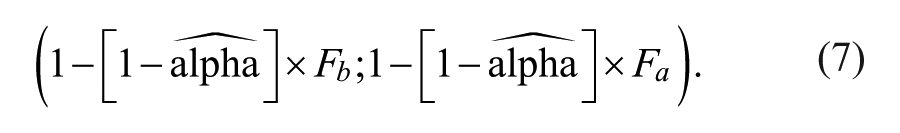
In this study, we used Feldt’s method (Feldt et al., 1987). Feldt’s method is convenient because it uses only information available for several tests in the COTAN database:
To compute the 95% CI for alpha, let the nominal Type I error rate be 0.05, and let
Method
We used the COTAN database to answer two questions: (1) What is the precision of reported reliability estimates expressed by 90% and 95% CIs; (2) Does considering precision change the qualification tests initially received with respect to reliability?
Test Population and Test Sample
COTAN assesses the most recent versions of tests that are used in the Dutch and Belgian practice for testing individuals to obtain a diagnosis, give an advice, or make a decision, and in addition COTAN assesses tests used in scientific research. COTAN’s database distinguishes three main test types: (1) person–situation tests measuring proficiency in a particular setting, such as employment or education. Examples are questionnaires assessing people’s vocational interests, tests for school achievement, but also inventories assessing patients’ behavior in mental institutions; (2) person tests measuring personality, addressing stable personality traits such as the big five, and also intelligence; and (3) situation tests assessing situational performance, which concern, for example, expert ratings of labor situations’ task characteristics and students’ judgments of the affective meaning of concepts. These three main test types are subdivided into 38 finer grained test types, which however are not useful for our study. Using an assessment system created by COTAN (Evers, Lucassen, et al., 2010), raters commissioned by COTAN assessed the reliability of 520 tests to have insufficient (138 tests), sufficient (217), or good (165) reliability. The tests were 309 person–situation tests, 153 person tests, and 18 situation tests. Forty tests may be placed in more than one category.
Collecting Tests and Composition of Test Subset
We distinguish test batteries and single tests. Test batteries consist of several subtests, test scores being provided for subtests and for the whole battery based on the subtest scores. Single tests measure one attribute and are either subtests from test batteries or tests measuring one attribute that are not part of a test battery.
Test publishers provide COTAN with a copy of the test and all corresponding materials including the manual, but COTAN is not allowed to grant researchers, like the present authors, access to these materials. Hence, we retrieved more detailed information from the COTAN online database (Egberink et al., 2009-2016) and test manuals available from libraries of the University of Amsterdam and Tilburg University.
To compute a CI, one needs number of items (J), sample size (N), and reliability estimate (r). For 116 (22.3%) out of 520 tests COTAN assessed the results were complete, hence we discarded 404 tests from the analysis for which J, N, or r were missing. In Table 1, entry “41” (Table 1; 3rd row, 1st column) should be read as “For 41 tests COTAN assessed to have “Good” reliability, we could retrieve all the relevant results.” These 41 tests entail both test batteries that are counted once, also when they were assessed for different groups, and single tests. Comparing categories for included and excluded tests, Table 1 shows that percentages vary little across assessment categories and test types (except for Situation tests, but here the frequencies were small), suggesting absence of bias due to lack of representation.
Tests Included in the Analysis and Tests Excluded From the Analyses, Arranged by Assessment Category and Test Type.
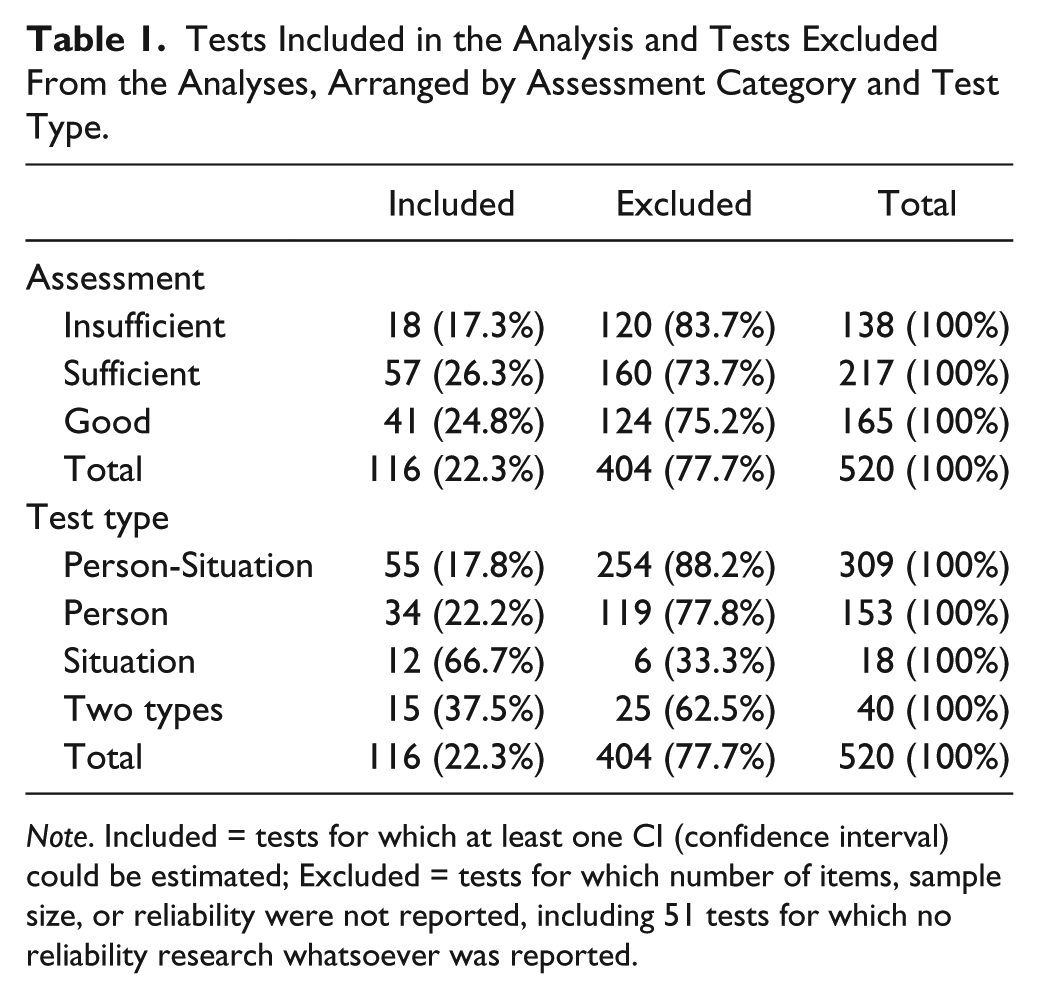
Note. Included = tests for which at least one CI (confidence interval) could be estimated; Excluded = tests for which number of items, sample size, or reliability were not reported, including 51 tests for which no reliability research whatsoever was reported.
The 116 tests produced 1,024 reliability estimates, 105 of which pertain to total scores on a test battery and 919 to single tests. Most reliability estimates (74.71%) were based on at most 20 items, and four tests contained more than 200 items. More than half of the reliabilities were estimated from samples smaller than 1,000 observations, and 53 reliabilities were estimated from samples ranging from 6,294 to 12,522 observations. Most (94.73%) reliability estimates varied between 0.60 and 0.95 (Figure 1). The split-half method was reported 87 times and coefficient alpha 937 times.
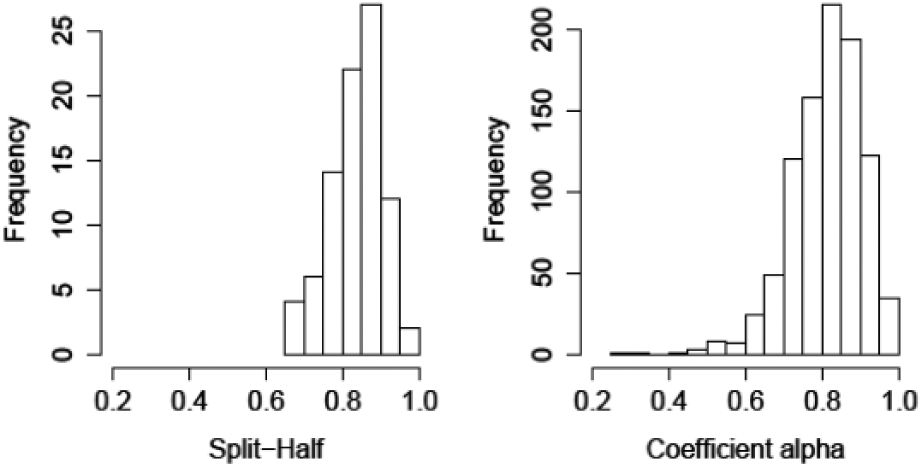
Split-half reliability (87 estimates) and coefficient alpha (937 estimates) distributions.
Frequencies M in Table 2 count the number of reliability values retrieved for test batteries and single tests, arranged by quality assessment and test type. Tables 1 and 2 are related as follows. The 41 tests enumerated in Table 1 (3rd row, 1st column) produce 55 reliability values (Table 2; 3rd row, 1st column) for total scores on test batteries, also separately counting available subgroup results; and 468 reliability values (3rd row, 5th column) based on single tests. For each count M mean number of items, sample size, and reliability are provided.
Descriptive Statistics for Reliability Estimates, Separately for Test Batteries and Single Tests, Arranged by Assessment Category and Test Type.
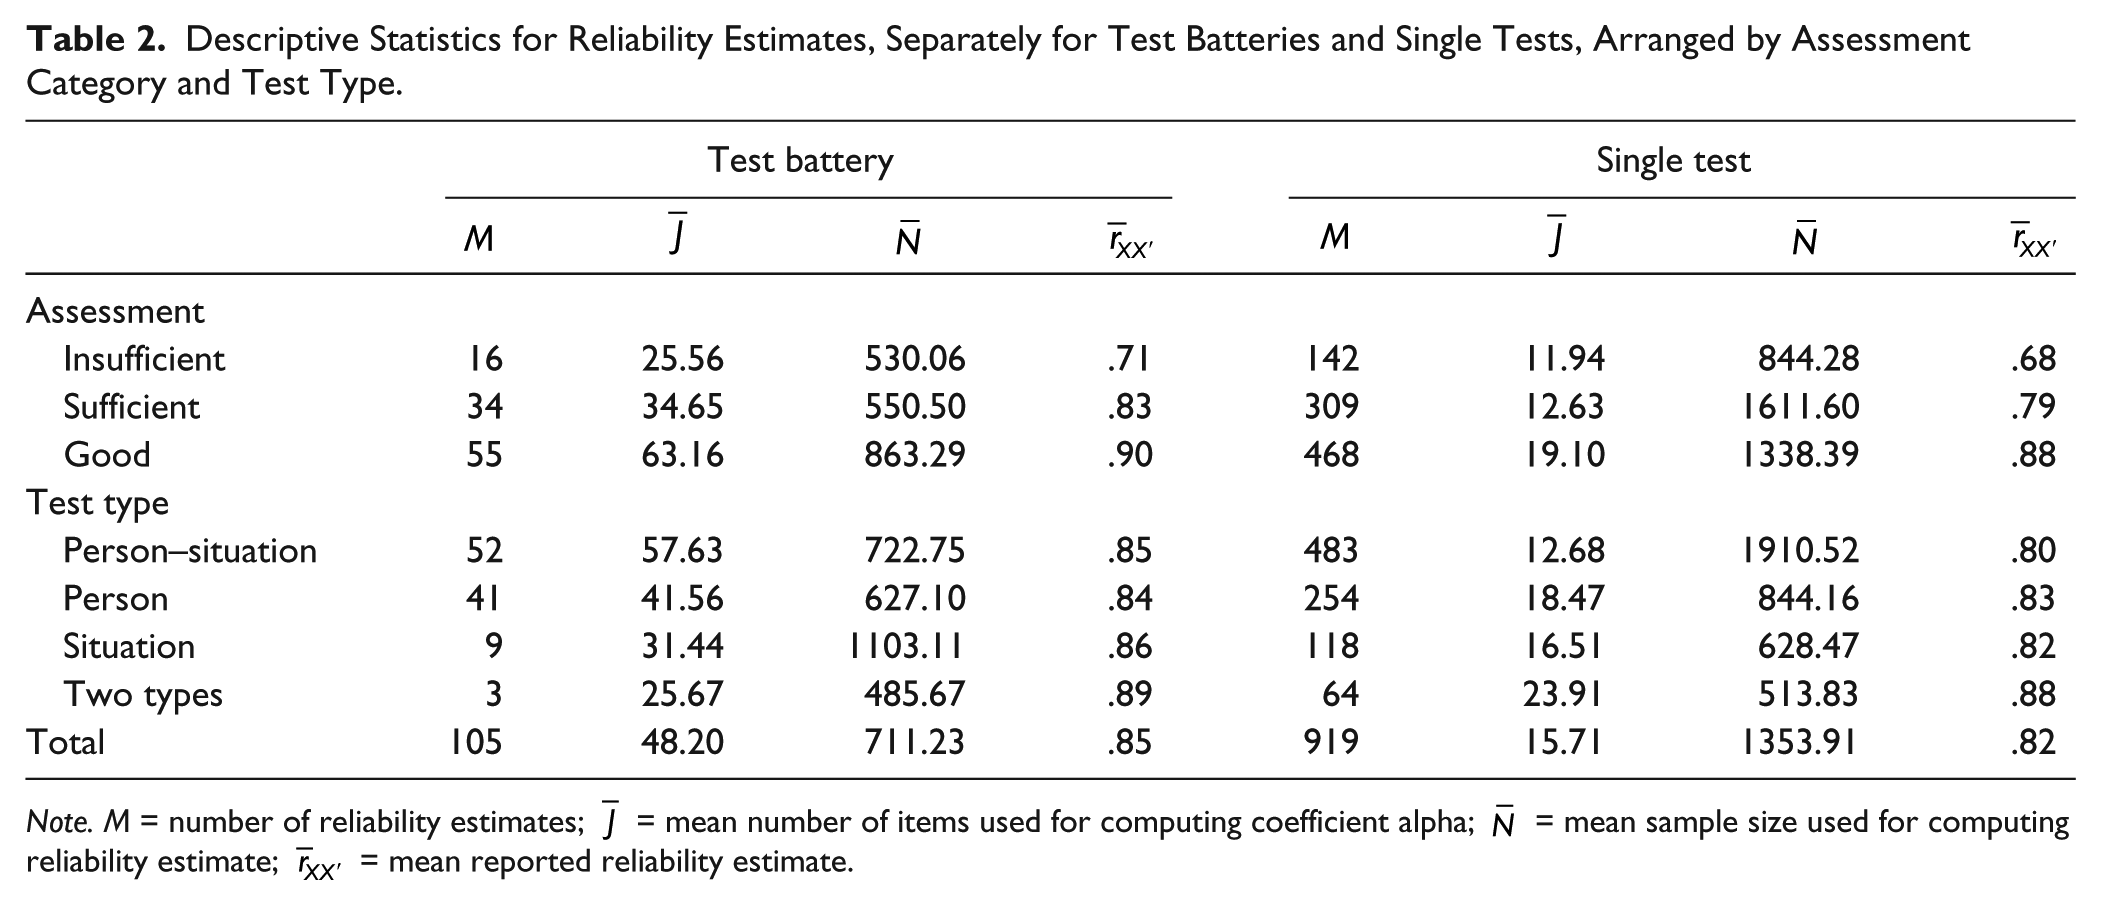
Note. M = number of reliability estimates;
Reliability Assessment Rules
COTAN Rules
COTAN distinguishes three mutually exclusive and exhaustive reliability intervals labelled “Insufficient” (I), “Sufficient” (S), and “Good” (G) to assess reliability. Let r denote a reported, estimated reliability, let
COTAN distinguishes three different uses of tests, which are, in decreasing order of importance reflected by smaller
Confidence Intervals
For individual advice, Figure 2 presents a numerical example for
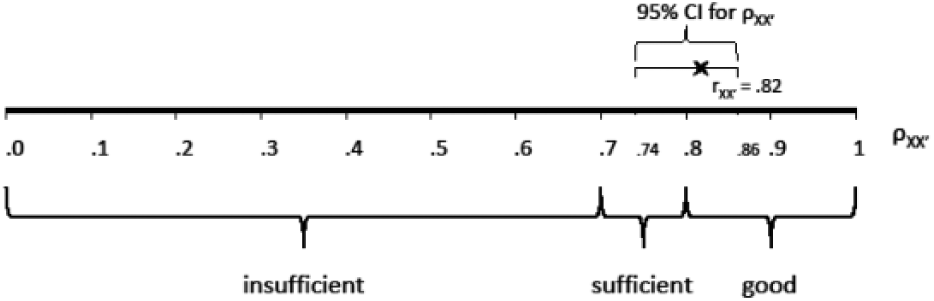
Example of qualification of reliability and CI for reliability.
Let L denote the lower bound of the CI and U the upper bound. The formalized decision rule taking CIs into account is as follows: (1) if
The decision rule that takes CIs into account cannot upgrade a reliability value to a higher category, because it tests whether a sample reliability value is significantly larger than a cut-off score; if yes, the original COTAN assignment is maintained, else it is downgraded. We chose our somewhat conservative procedure to protect the test practitioner and his clients and patients from tests that provide less quality than the assessment promises.
Results
As test batteries and single tests are longer and samples are larger, reliability and its assessment increase (Table 2) and mean CI95% and CI90% width decreases (Table 3), implying greater statistical certainty. Compared with test batteries, single tests contain fewer items, are based on larger samples, and have lower reliability, but mean CI width is approximately equal. For test type, Table 2 shows for test batteries that person–situation tests on average are the longest and are based on the largest samples. Different test types have almost the same mean reliability. Person–situation tests have the smallest mean CI width.
Proportion of Reliability Estimates (Pr) for Which the Lower Bound of the 90% CIs and 95% CIs Exceeds the
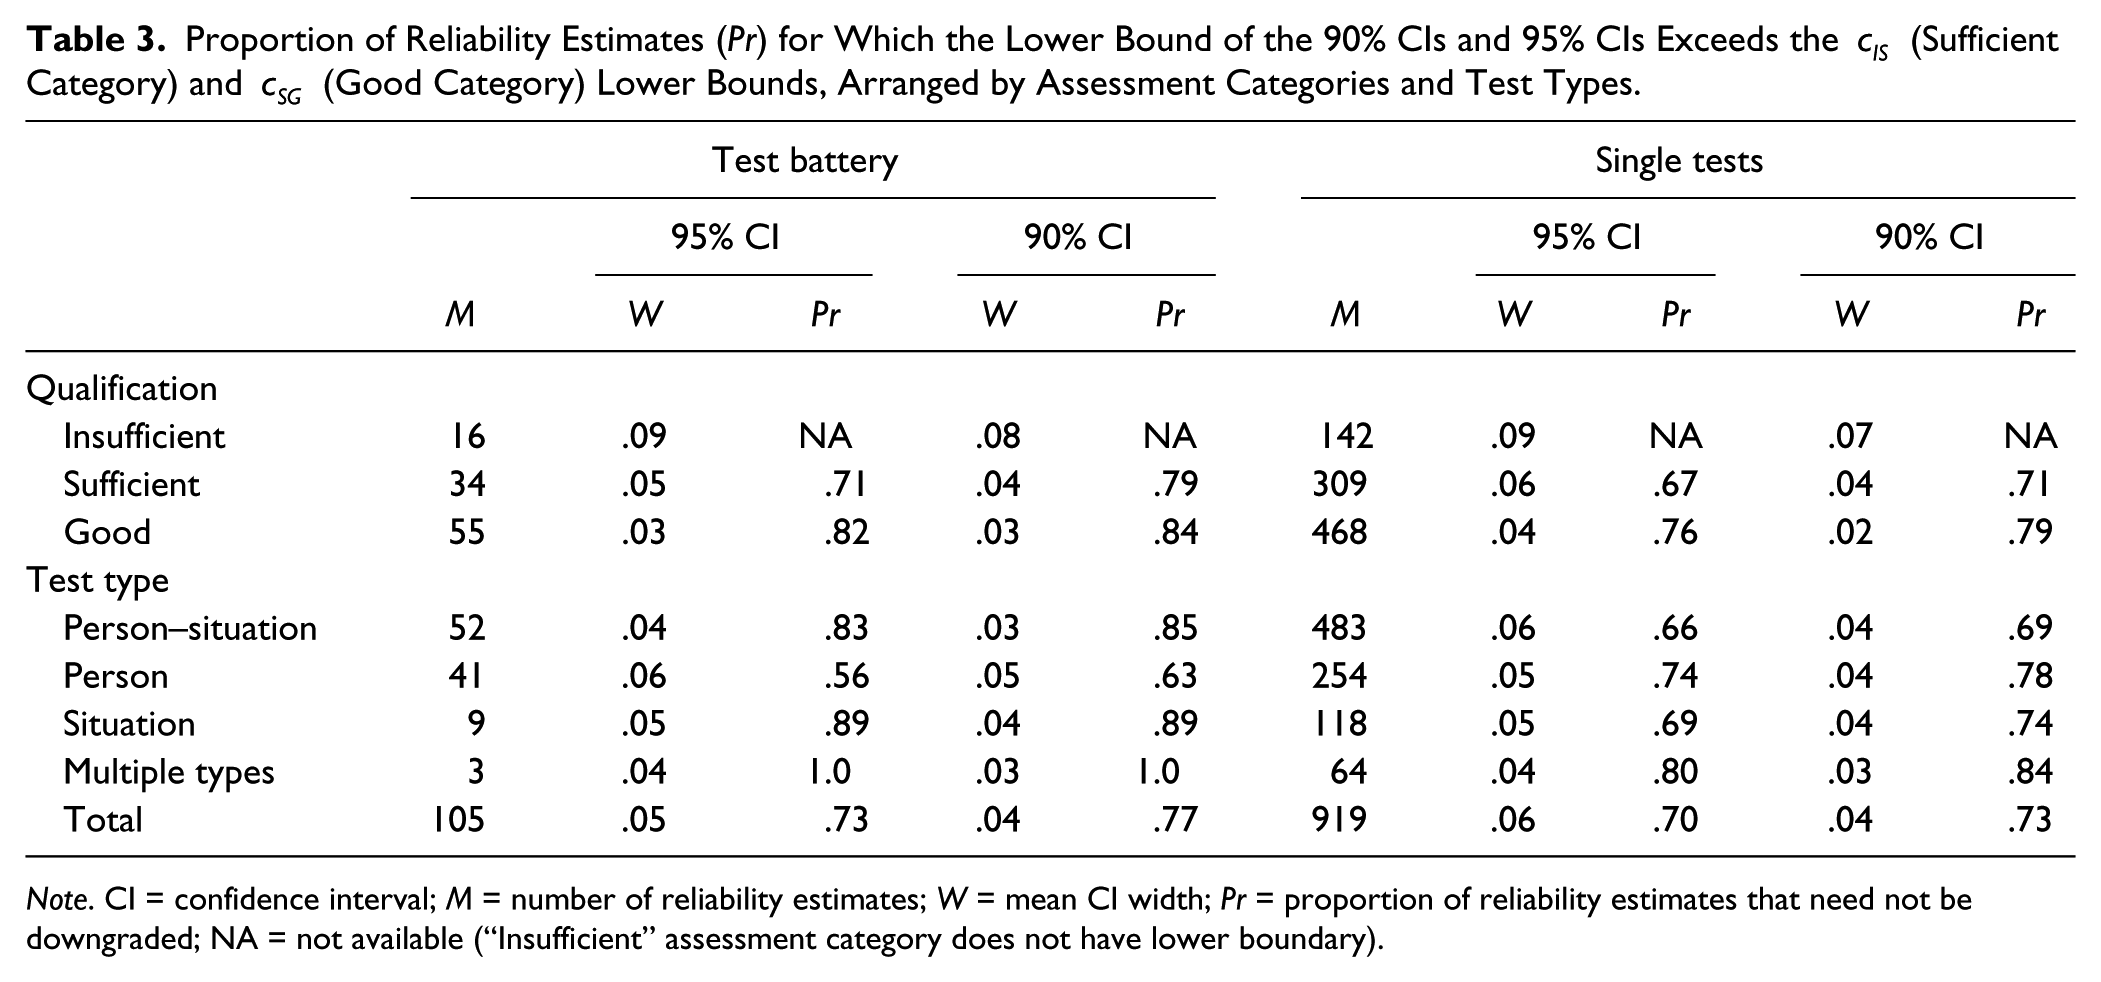
Note. CI = confidence interval; M = number of reliability estimates; W = mean CI width; Pr = proportion of reliability estimates that need not be downgraded; NA = not available (“Insufficient” assessment category does not have lower boundary).
Table 3 shows the proportions of reliability estimates that need not be downgraded when taking confidence intervals into account (Pr); that is, reliability estimates for which the lower bound of the 90% CIs and 95% CIs exceeds the cIS lower bound of the “Sufficient” category and the cSG lower bound of the “Good” category. Proportions for CI90% by definition are larger than for CI95%. The “Insufficient” category does not have a lower boundary; hence, Pr is not available (NA); 67% to 79% of the tests with the qualification “Sufficient” exceeded the cIS threshold, and 76% to 84% of the test with the qualification “Good” exceeded the cSG threshold. For person–situation test batteries and situation test batteries (lower-left panel), CI lower bounds exceeded c thresholds more often than for person test batteries.
Turnover Table 4 shows the COTAN assessments in the columns and the assessment based on CIs in the rows, with blanks in the lower triangles because using CIs can only produce the same or a lower assessment. Diagonal entries show frequencies of reliability estimates that were not reclassified. For test batteries, using 90% CIs, the entries add up to 16 + 27 + 46 = 89 (84.8% of 105 test batteries). Using 95% CIs, 81.0% of the reliability estimates were not reclassified. Of the 34 reliability estimates that were initially classified as “Sufficient,” 20.6% (90% CIs) and 29.4% (95% CIs) were reclassified as “Insufficient.” Of the 55 reliability estimates initially classified as “Good” 16.4% (90% CIs) and 18.2% (95% CIs) were reclassified to “Sufficient,” and in both cases none were reclassified as “Insufficient.” For single tests, out of 919 tests, 79.3% (90% CIs) and 76.5% (95% CIs) were not reclassified. Of the 309 reliability estimates originally classified as “Sufficient,” 29.1% (90% CIs) and 33.3% (95% CIs) were reclassified as “Insufficient.” Of the 468 reliability estimates originally classified as “Good,” 20.7% (90% CIs) and 23.5% (95% CIs) were reclassified as “Sufficient,” and 0.6% (90% CIs and 95% CIs) were reclassified as “Insufficient.”
Turnover Results for Assessment Categories for Test Batteries (Upper Panel) and Single Tests (Lower Panel), Without CIs and Using 90% and 95% CIs.
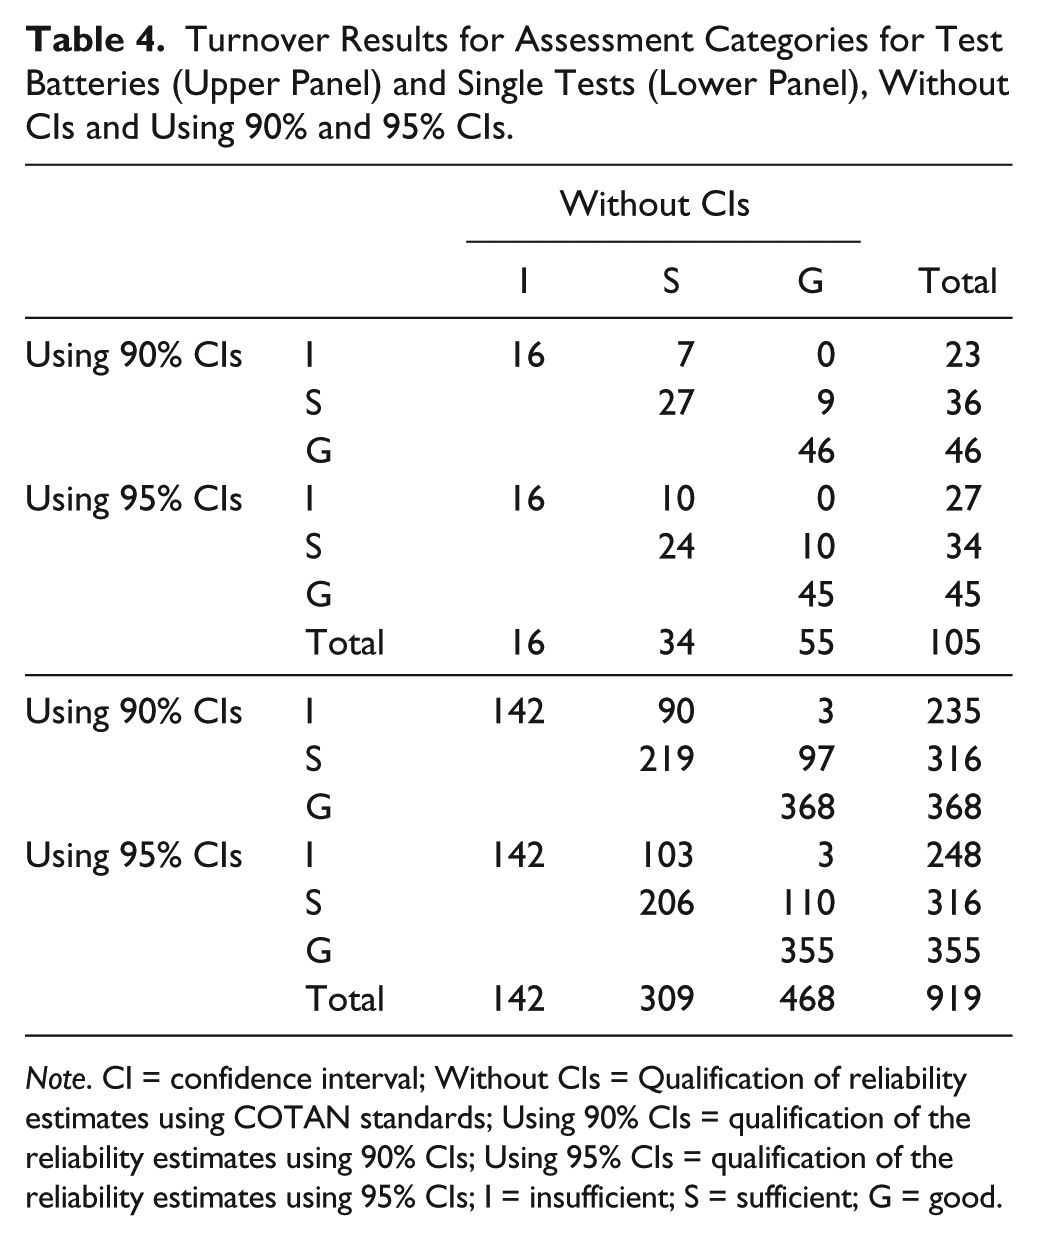
Note. CI = confidence interval; Without CIs = Qualification of reliability estimates using COTAN standards; Using 90% CIs = qualification of the reliability estimates using 90% CIs; Using 95% CIs = qualification of the reliability estimates using 95% CIs; I = insufficient; S = sufficient; G = good.
Discussion
Using CIs for test batteries, almost 20% of the reliability estimates had to be downgraded to the next lower category, and for single tests the percentage exceeded 20%, but downgrading from “Good” to “Insufficient” only happened with single tests and was rare, suggesting such extremities are not a problem in practice using COTAN rules and given the sample sizes typically used. These results demonstrate that interpreting sample reliability values without taking CIs for population values into consideration may produce conclusions, which are too optimistic. We hope this study is a wake-up call for anyone involved in test construction and test assessment not to treat sample results as parameters, and to assess reliability using CIs allowing a statistically well-founded decision whether ρ ≥ c and a precise estimate of ρ. Power and precision may not be accomplished simultaneously (e.g., high power may go together with low precision reflected by wide CIs), but for several statistical procedures (not including reliability) Maxwell et al. (2008) discuss sample size planning aimed at obtaining both power and precision.
Should using hard category boundaries such as cIS and cSG be preferred to soft interval boundaries? Soft boundaries allow labeling .79, say, “rather good” if .80 being only .01 unit higher was labeled “good,” whereas hard boundaries such as used by COTAN simply label .79 “insufficient” and .80 “good.” We make two remarks. First, whatever categorization one uses, if the purpose is to classify tests, in the end one needs to make a decision based on numerical sample values for which we recommend using CIs that reflect ones uncertainty due to sample size. When samples are large, CIs are not important anymore and human judgment should be used to assess what is reasonable and may be inspired by considerations such as the uniqueness of the test and the sample available, hence the difficulty to replace either. For example, a braille intelligence test for blind people may be unique, hence impossible to replace, and even a small sample of blind people may be hard to obtain, so that one must use whatever data are available and accept results for use provided they are not disastrous. Second, to link reliability values more tightly to labels that most people agree about needs the introduction of external criteria with respect to test utility, for example, referring to numbers of false positives and false negatives. Relating test results to utility of outcomes is a complex topic that is both important and beyond the scope of this study.
Will categorization systems other than COTAN’s produce different results? Probably, for example, if the systems’ boundaries do not match the database’s reliability values (boundaries are distant from where most reliability values are), or when a finer-grained system of boundaries is used so that intervals are narrower and more tests are downgraded more than one category. Related thereto, we also broke down results to test types and use scenarios corresponding to different boundary values, and found little differences for test types but found that as test use was more important (and boundaries higher), the percentage of reclassified tests decreased. For 95% CIs, we found for group-level test use 26.8% reclassification, for individual advice 20.5%, and for important individual decision 15.8%. A problem with these and similar breakdown results is that it is unknown whether trends like this would also be found with other databases and different categorization systems. We suspect these and similar results to be rather system-dependent and thus take such results not too literally.
Researchers and test constructors might consider using statistically more advanced methods for estimating CIs for coefficient alpha and the split-half method. Kelley and Cheng (2012) suggested a bootstrap method for obtaining CIs for methods other than split-half reliability and coefficient alpha. Cronbach (1951) intended alpha to replace the split-half method and since then many methods have been proposed that might be preferred to coefficient alpha because they are closer to true reliability ρ (Bentler & Woodward, 1980; Brennan, 2001; Guttman, 1945; Shavelson & Webb, 1991; Zinbarg et al., 2005). Hence, it is remarkable how persistent the use of coefficient alpha is, and even more the persistent albeit more modest use of the split-half method.
We recommend that test manuals and websites reporting test assessments standardize the information they provide comparable to a consumer’s guide giving technical and user-relevant information for washing machines and dryers, cars, cell phones, and computers. However, the absence at the COTAN website of simple statistics like test length, sample size, and reliability estimates may often not be due not to lack of standardization of the website but perhaps more to the absence of this kind of information in test manuals. A hypothesis the authors discussed but were unable to check is that large testing agencies probably are better used to working according to protocol than researchers working in smaller companies, on their own or in small teams in hospitals, and also researchers working in a university environment where academic independence is highly valued, perhaps at the expense of standardization. It is extremely important that large testing agencies and assessment authorities such as COTAN emphasize that anyone constructing, publishing, and selling tests provides the relevant information about test quality.
Footnotes
Declaration of Conflicting Interests
The author(s) declared no potential conflicts of interest with respect to the research, authorship, and/or publication of this article.
Funding
The author(s) received no financial support for the research, authorship, and/or publication of this article.