
Abstract
Keywords
Computerized neuropsychological test (CNT) batteries have become increasingly popular in clinical and research settings over the past years. A major advantage of CNT’s is the potential of having computers perform labor-intensive test administration, and accurate as well as less time consuming scoring procedures. The Central Nervous System Vital Signs (CNS VS; Gualtieri & Johnson, 2006) is a battery composed of CNTs that are mostly based on well-established conventional paper-and-pencil tests. CNS VS has been shown to be well suited for use as a brief clinical screening tool for cognitive dysfunction in different patient groups (Collins, Mackenzie, Tasca, Scherling, & Smith, 2014; Gualtieri, Johnson, & Benedict, 2006; Meskal, Gehring, van der Linden, Rutten, & Sitskoorn, 2015).
However, in spite of their widespread use and clinical utility, many CNT’s, including CNS VS, are limited in terms of their psychometric development, and stratified norms are often lacking (Arrieux, Cole, & Ahrens, 2017; Bauer et al., 2012). Most of the normative data have been collected and described by Gualtieri and Johnson more than a decade ago based on a sample of 1,069 volunteering American participants ranging in age from 7 to 90 years. Since 2006, the normative database has been expanded to over 1,900 participants (http://www.cnsvs.com), but unfortunately no information on the updated CNS VS normative database has been reported to date. As a result, there is no publically available description of the composition of the American sample regarding background characteristics, nor the basis on which participants were classified as “normal,” except that they had “no past or present neurological or psychiatric disorder, head injury, and learning disabilities” (Gualtieri & Johnson, 2006, p. 625 ). Hence, the representativeness of the norms for the American population cannot be evaluated and is uncertain. Moreover, although the CNS VS has been translated into over 50 languages, only normative data for the American version has been published. However, the performance on translated versions of the CNS VS could be affected by cultural influences rendering the norms for the American sample inapplicable to individuals in other countries. To the best of our knowledge, the applicability of the original norms to non-American samples has never been studied. In addition, the original CNS VS norms may be outdated, since norms were based on data that were collected over a decade ago. Ageing of norms is an important treat to the usefulness of normative data (e.g., Evers, Sijtsma, Lucassen, & Meijer, 2010).
Another limitation of the original CNS VS’ normative data concerns the absence of adjustments for effects of education and sex, as normalized scores are solely age-corrected. All three sociodemographic variables (i.e., age, education, and to a lesser extent sex) have extensively been found to correlate with performance on various neuropsychological tests (Heaton, Grant, & Matthews, 1986; Seidenberg et al., 1984), including performance on computerized tests (Gualtieri & Hervey, 2015; Iverson, Brooks, & Rennison, 2014; Swagerman et al., 2016). The absence of corrections for these variables when interpreting performance on neuropsychological tests hinders proper interpretation and comparison in terms of cognitive functioning.
In the current study, we evaluated the performance of a sample of healthy Dutch participants on the CNS VS against the original American normative data. In addition, we evaluated the impact of the sociodemographic variables age, education, and sex on performance using a regression-based procedure. By using this approach, individual normed scores can be derived. Formulae for obtaining sociodemographically adjusted normed scores based on normative data from the Dutch population are presented as well.
Method
Participants and Procedure
A total of 158 Dutch participants, recruited by convenience sampling from the broad network of the research group, volunteered to participate in the study. Participants were considered healthy if (a) there was no past or present psychiatric or neurologic disorder; (b) they had no other major medical illnesses in the past year prior to participation (e.g., cancer, myocard infarct); (c) they were free of use of any centrally acting psychotropic medication; and (d) did not have a history of or current alcohol or drug abuse. The computerized neuropsychological tests were, depending on participants’ preference, administered individually at Tilburg University (Tilburg, The Netherlands), Elisabeth-TweeSteden Hospital (Tilburg, The Netherlands), or at participants’ homes. Well-trained test technicians ensured appropriate conditions and remained present during the entire assessment. Participants provided written informed consent and filled out a questionnaire on health status.
The study was approved by the Medical Ethics Committee Brabant, The Netherlands (File number: NL41351.008.12).
Measures and Normative Data
Sociodemographic Characteristics
Number of years and completed level of education were self-reported by participants. Grade retention did not count as an extra year, neither did supplementary vocational courses that were attended after graduation. Actual number of years of education was verified (i.e., recalculated by the test technician together with the participant) during the assessment. To classify the level of education, the Dutch Verhage scale was used (Verhage, 1964). Its seven categories were merged into three ordinal categories: low educational level (Verhage 1 until 4), middle educational level (Verhage 5), and high educational level (Verhage 6 and 7; Table 1). Participants also rated their frequency of computer use on a 3-point scale with categories never, some, or frequent.
Description of Educational Levels.

Adapted from Verhage (1964).
Central Nervous System Vital Signs
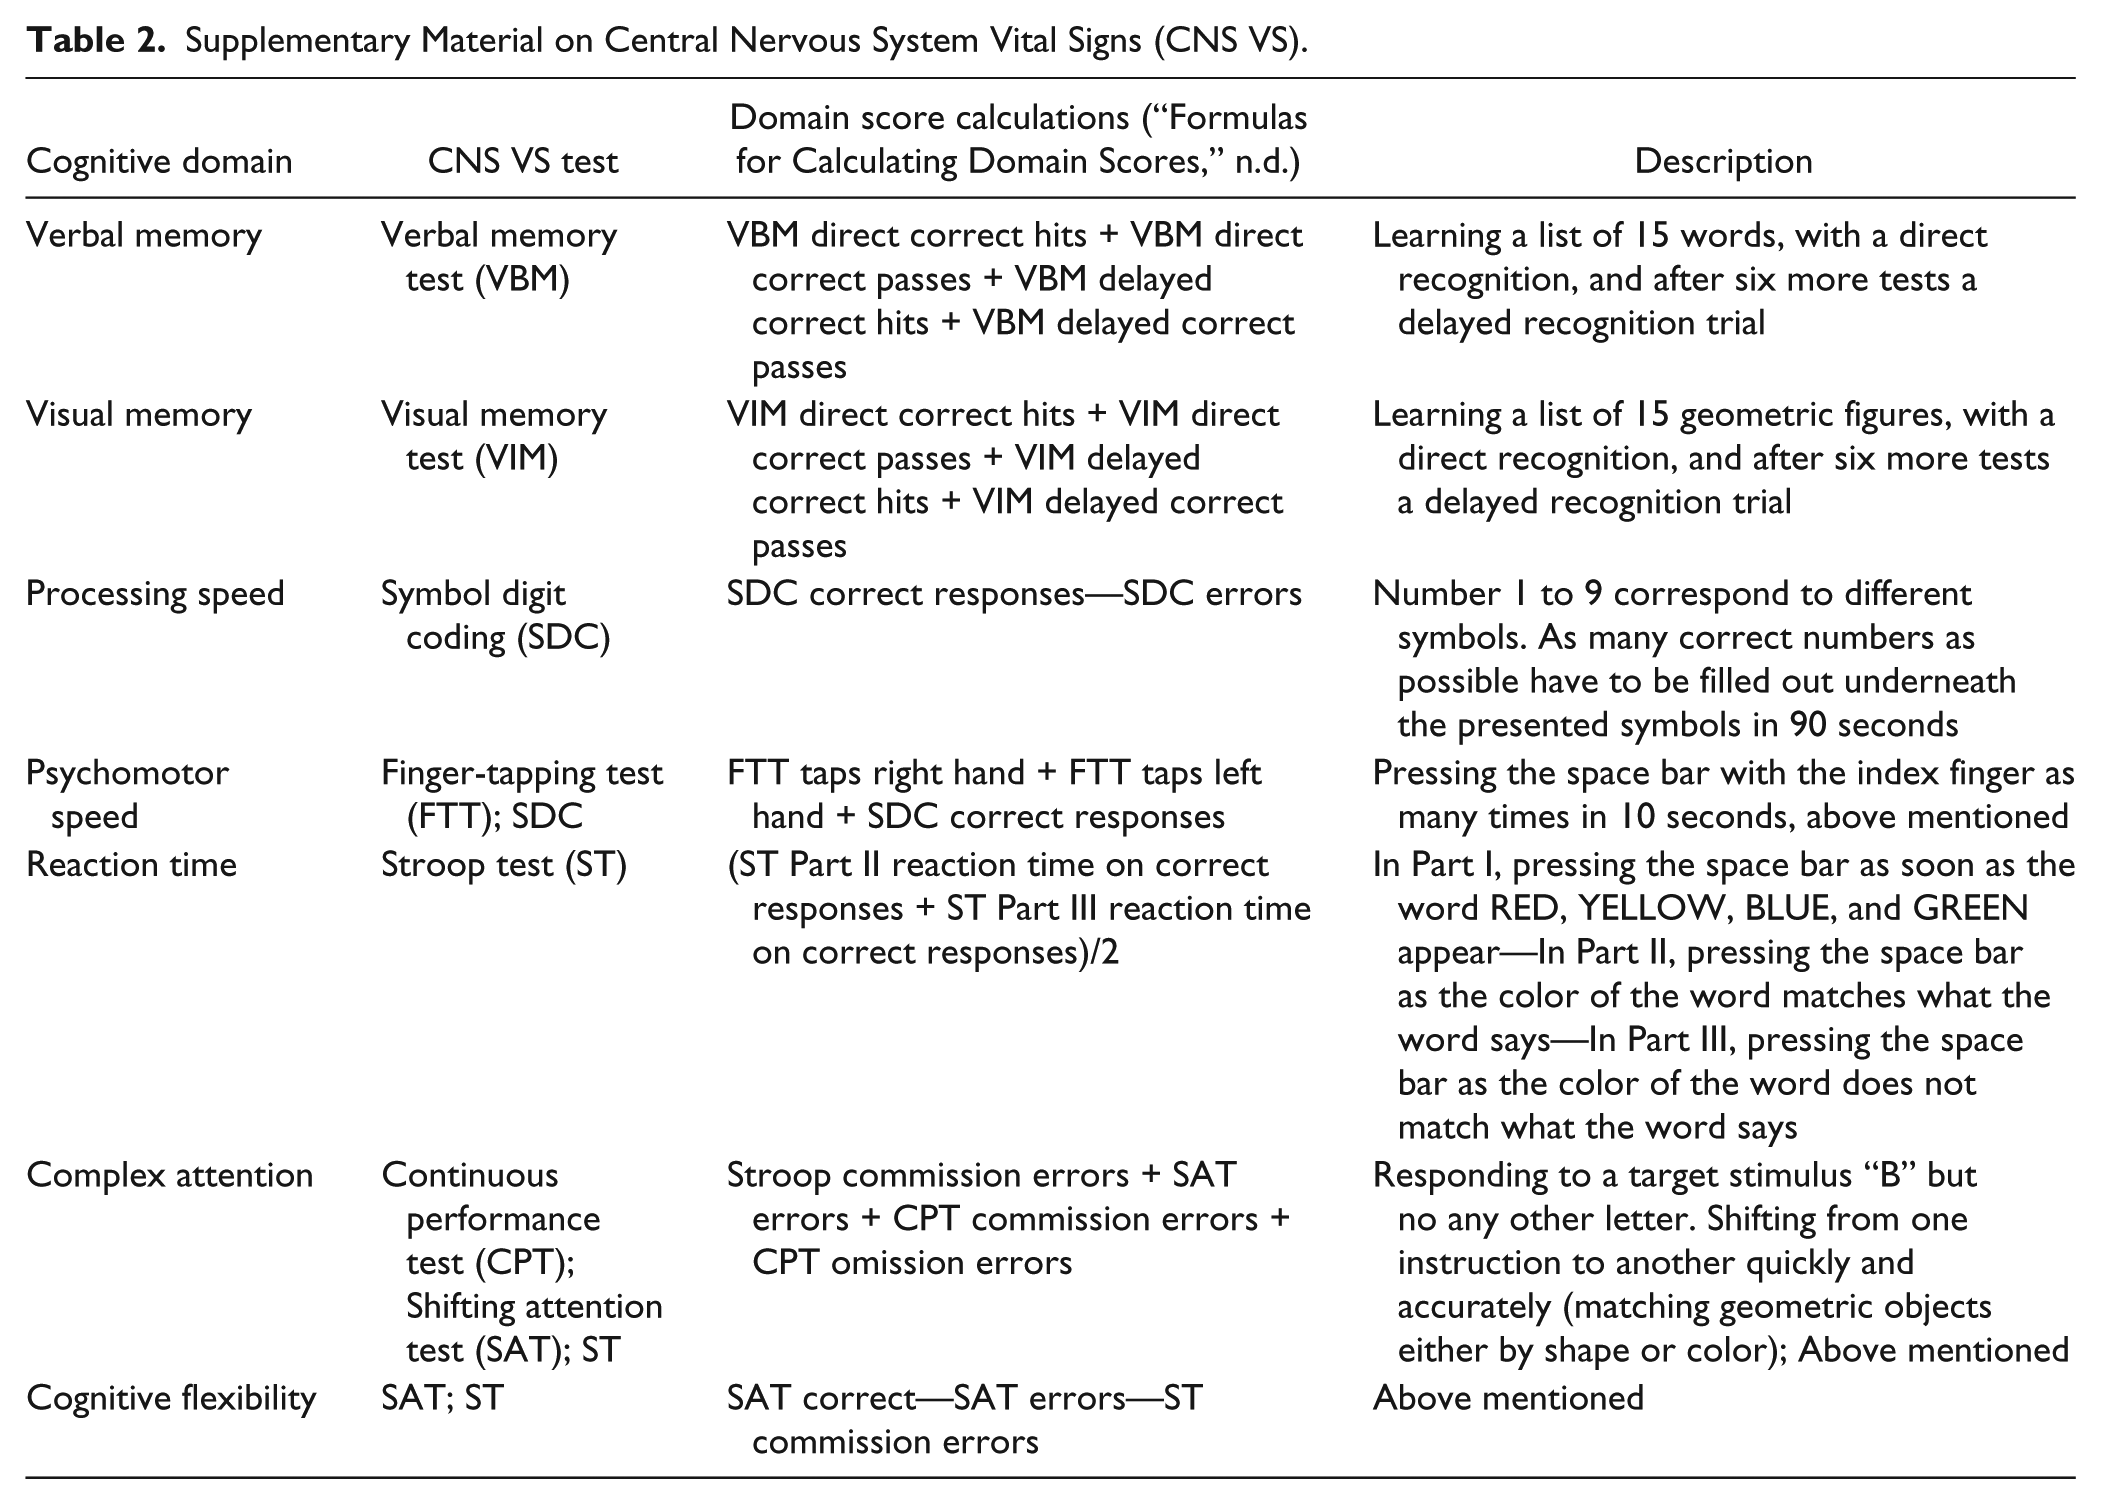
Cognitive functioning was assessed using the Dutch translation of the CNT battery CNS VS. It comprises seven neuropsychological tests, yielding measures of performance in 11 cognitive domains. Since some domains scores generated by CNS VS are very similar (i.e., mainly calculated based on components of the same tests), we chose to consider only 7 cognitive domains (Table 2). Time needed to complete the total battery is approximately 30 to 40 minutes. Scoring is automated and scores are presented in raw and normed scores, as well as percentile ranks, generating a summary report for clinical interpretation or statistical analysis. Raw scores include the number of correct or incorrect responses, reflecting accuracy, and mean reaction times (in milliseconds) on individual tests and domains, reflecting speed. Normed scores are automatically generated by the CNS VS and represent the performance of an individual relative to the American normative sample controlled for age. In the population, CNS VS normed scores are assumed to have a mean of 100 and a standard deviation of 15; higher scores always indicate better performance (Gualtieri & Johnson, 2006). The percentile rank of these scores refer to the proportion of scores in the normative sample that are equal to or lower than the score at hand. All testing was done using CNS VSX’ local software app, on the same type of laptop computers running Windows 7 Professional on 64-bit operating systems. Background programs were shut down at time of all assessments and laptops were disconnected from (wireless) internet resources.
Supplementary Material on Central Nervous System Vital Signs (CNS VS).
There is not a large body of literature regarding the reliability and validity of CNS VS. In the original reliability and validity paper, Gualtieri and Johnson (2006) describe CNS VS’ psychometric characteristics to be very similar to the characteristics of the conventional neuropsychological tests on which the battery is based. However, correlational studies suggest at best moderate correlations between CNS VS and traditional neuropsychological tests, and in addition, no consistent clear patterns of convergent or discriminant validity have been determined (Gualtieri & Hervey, 2015; Gualtieri & Johnson, 2006, 2008; Lanting, Iverson, & Lange, 2012a, 2012b). As no two presentations of CNS VS are similar due to the random presentation of stimuli, the battery is assumed to be suitable for serial administration without inducing practice effects.
CNS VS American Normative Database
As stated before, CNS VS’ normative database has been expanded to over 1,900 participants nowadays (http://www.cnsvs.com). However, we rely on information regarding the CNS VS’ normative sample described by Gualtieri and Johnson (2006) since detailed information (e.g., sociodemographic characteristics) about the enlarged normative sample is not available.
One thousand sixty-nine normal participants were included in the normative database of CNS VS. Background characteristics (i.e., sex, ethnicity, handedness, and computer familiarity) and normative data are represented for 10 age groups: less than 10 years old, 10 to 14 years, 15 to 19 years, in deciles to 79 years, and finally, 80 years and older, with group sizes ranging from 25 to 212 participants (Gualtieri & Johnson, 2006). In most age groups, there is a female predominance, ranging from 43% to 72%. Characteristics are not presented for the sample as a whole — hindering proper comparisons between the total Dutch and American samples with respect to age and sex. Information about education (e.g., level, number of years) of the American sample is not described by Gualtieri and Johnson (2006), or in the documentation of the CNS VS itself (http://www.cnsvs.com). Neither was such information available from any of CNS VS’ analyses regarding the establishment of the battery’s normative data.
Statistical Analysis
Mean Domain and Test Performance
To explore whether mean CNS VS performance of the Dutch participants differed from the mean performance of the normative American sample, a series of two-tailed one-sample z-tests was performed (test values: M = 100, SD = 15). CNS VS presents up to 10 different mean raw scores (i.e., for each of the 10 different age-groups of CNS VS’ normative sample) for each domain and test. Since adopting the same subgroups in the Dutch sample would dramatically decrease the sample size for these analyses, the automatically generated age-corrected normed scores were used in all comparisons between the American and Dutch samples. In this way, we also account for effects of age in both groups. Effect sizes (ES) for potential differences between the American and the Dutch samples were calculated and expressed as Cohen’s d using pooled variance. 1 ES between ≤0.20 and 0.49 were defined as small, between 0.50 and 0.79 as medium, and ≥0.80 represented large effects (Cohen, 1988).
Multiple Regression Analyses
To explore the effects of sociodemographic factors on CNS VS performance, a series of multiple linear regression analyses was conducted using raw CNS VS domain scores as the outcome variables and a predetermined list of sociodemographic predictors. Age (in years), education (dummy coded; middle education as reference category), and sex (coded as 0 = men, 1 = women) were predictor variables which were entered as a single block (“enter” method). Assumptions were evaluated as follows: independence of observations was evaluated by Durbin–Watson tests (Durbin & Watson, 1951), and linearity and homoscedasticity were examined using scatter plots of residuals. Potential multicollinearity between predictors was examined by inspecting Pearson’s correlation coefficients. By computing Cook’s distances, univariate influential cases were identified (Cook & Weisberg, 1982). Normality of residuals was investigated by visual inspection of histograms. Alpha was set at .02 in order to prevent the problem of inflated Type I errors related to multiple comparisons. All statistical analyses were performed with SPSS 22.0.
Normative Regression Formulae
The results of the regression models which regresses performance on age, sex, and educational level also provide the formulae for computing sociodemographically adjusted norms. Clinicians and researchers can use these formulae in future administrations of CNS VS to obtain normed scores for individuals on each cognitive domain, based on their age, educational level, and sex. In particular, all predictors were included in the normative formulae irrespective of the significance of the effect, as follows:

In this formula,
Application of Sociodemographically Adjusted Normative Formulae and a Real-Life Example.
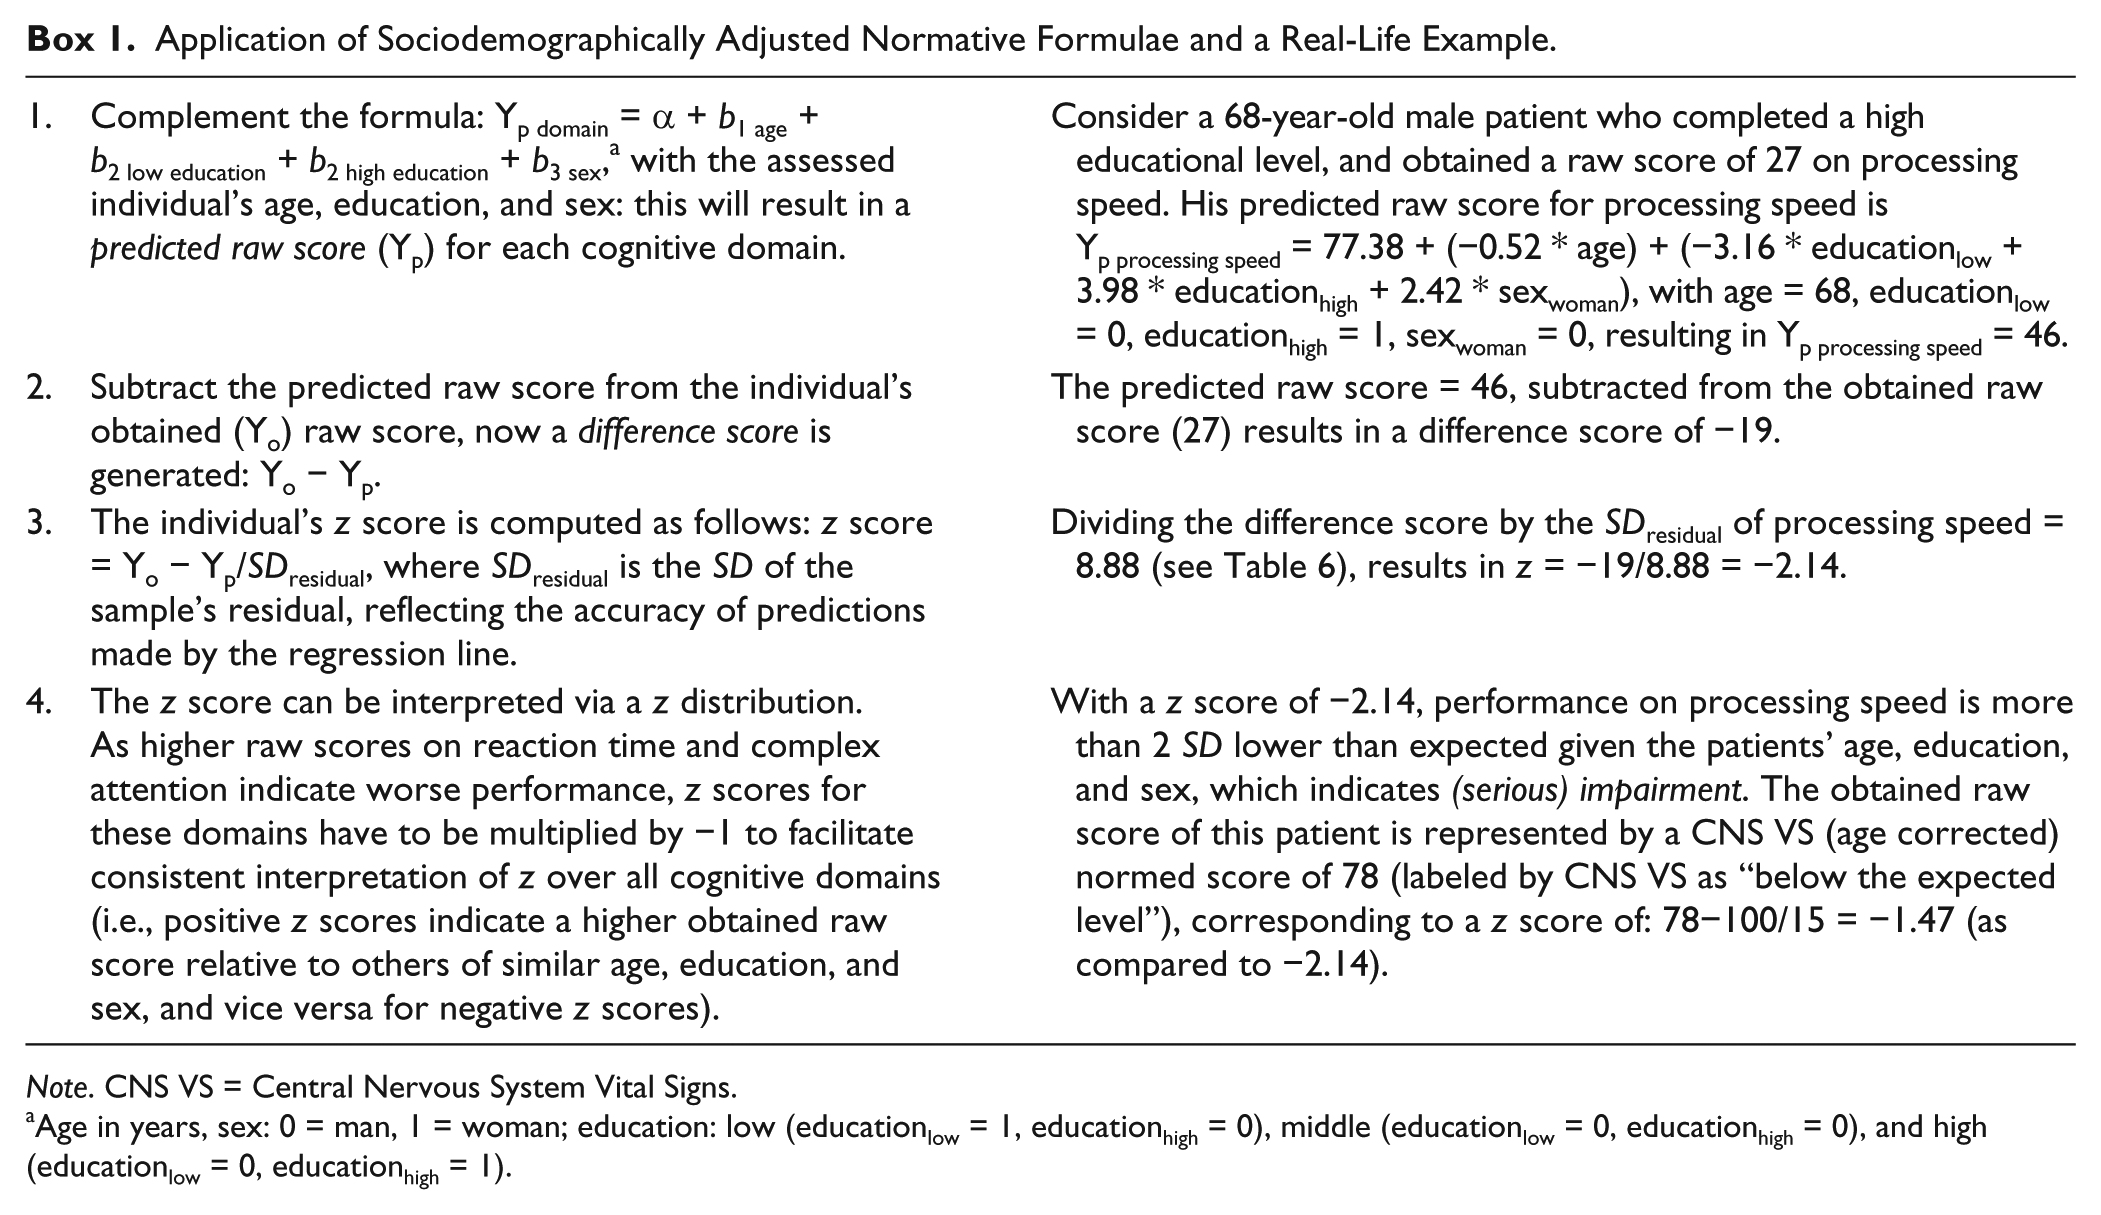
Note. CNS VS = Central Nervous System Vital Signs.
Age in years, sex: 0 = man, 1 = woman; education: low (educationlow = 1, educationhigh = 0), middle (educationlow = 0, educationhigh = 0), and high (educationlow = 0, educationhigh = 1).
Results
Sociodemographic Characteristics
Table 3 shows participants’ sociodemographic characteristics. Mean age was 45.9 (SD = 14.4) years, ranging from 20.0 to 80.0. There was a female predominance (57%) in the Dutch sample, which appears comparable to the American normative database of CNS VS. The participants completed 16.9 years of education on average. Almost all participants (97%) indicated to use the computer frequently. Men and women did not differ in terms of mean age, t(156) = 0.48, p = .162, and educational level, χ2(2) = 1.20, p = .550, neither did men and women differ in frequency of computer use, χ2(2) = 1.42, p = .491. Likewise, no significant differences between groups based on the three educational levels were found concerning age, F(2, 155) = 1.04, p = .355, and frequency of computer use, χ2(4) = 8.79, p = .067.
Sociodemographic Characteristics of the Dutch Sample (N = 158) and the American Sample (N = 1,069).
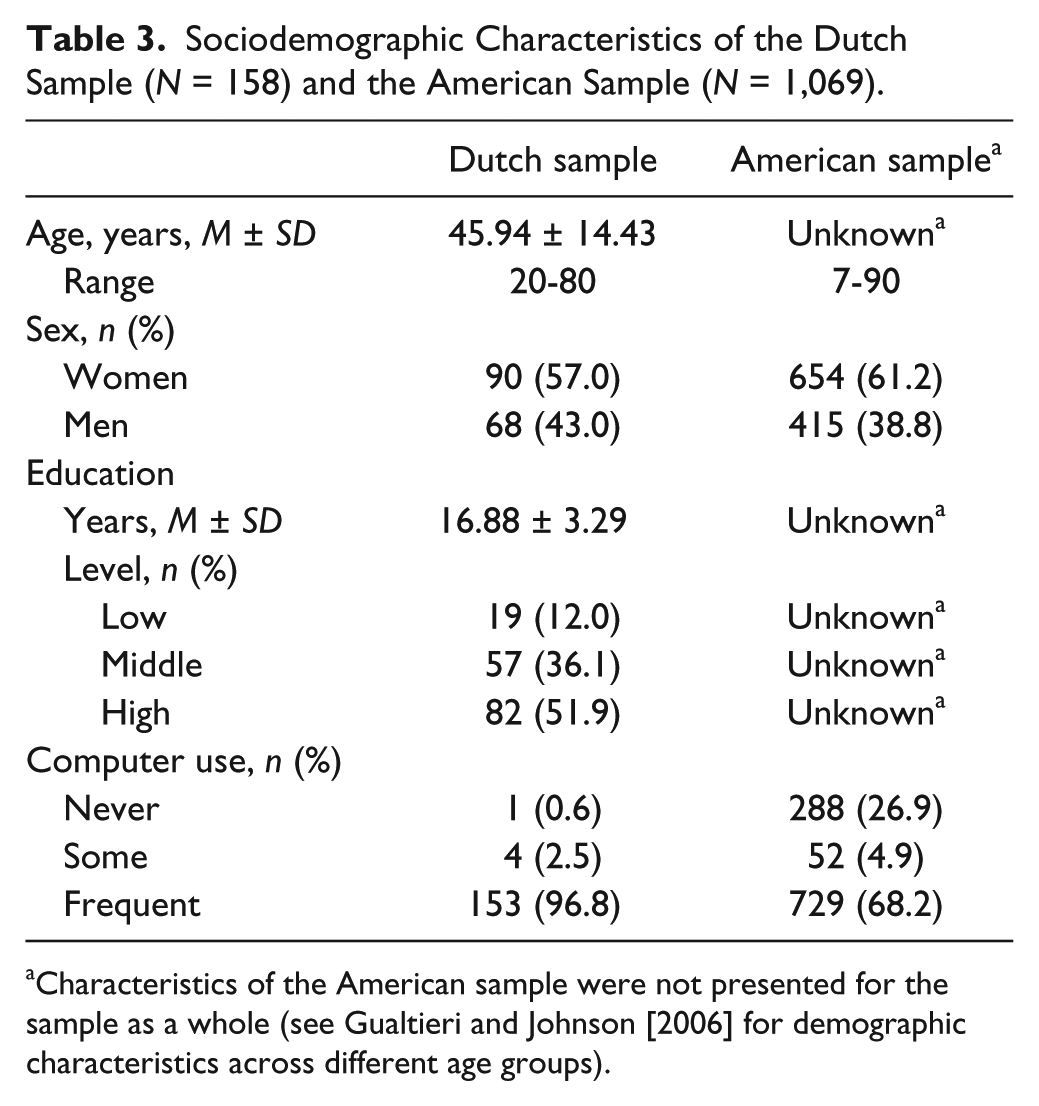
Characteristics of the American sample were not presented for the sample as a whole (see Gualtieri and Johnson [2006] for demographic characteristics across different age groups).
Mean Domain and Test Performance
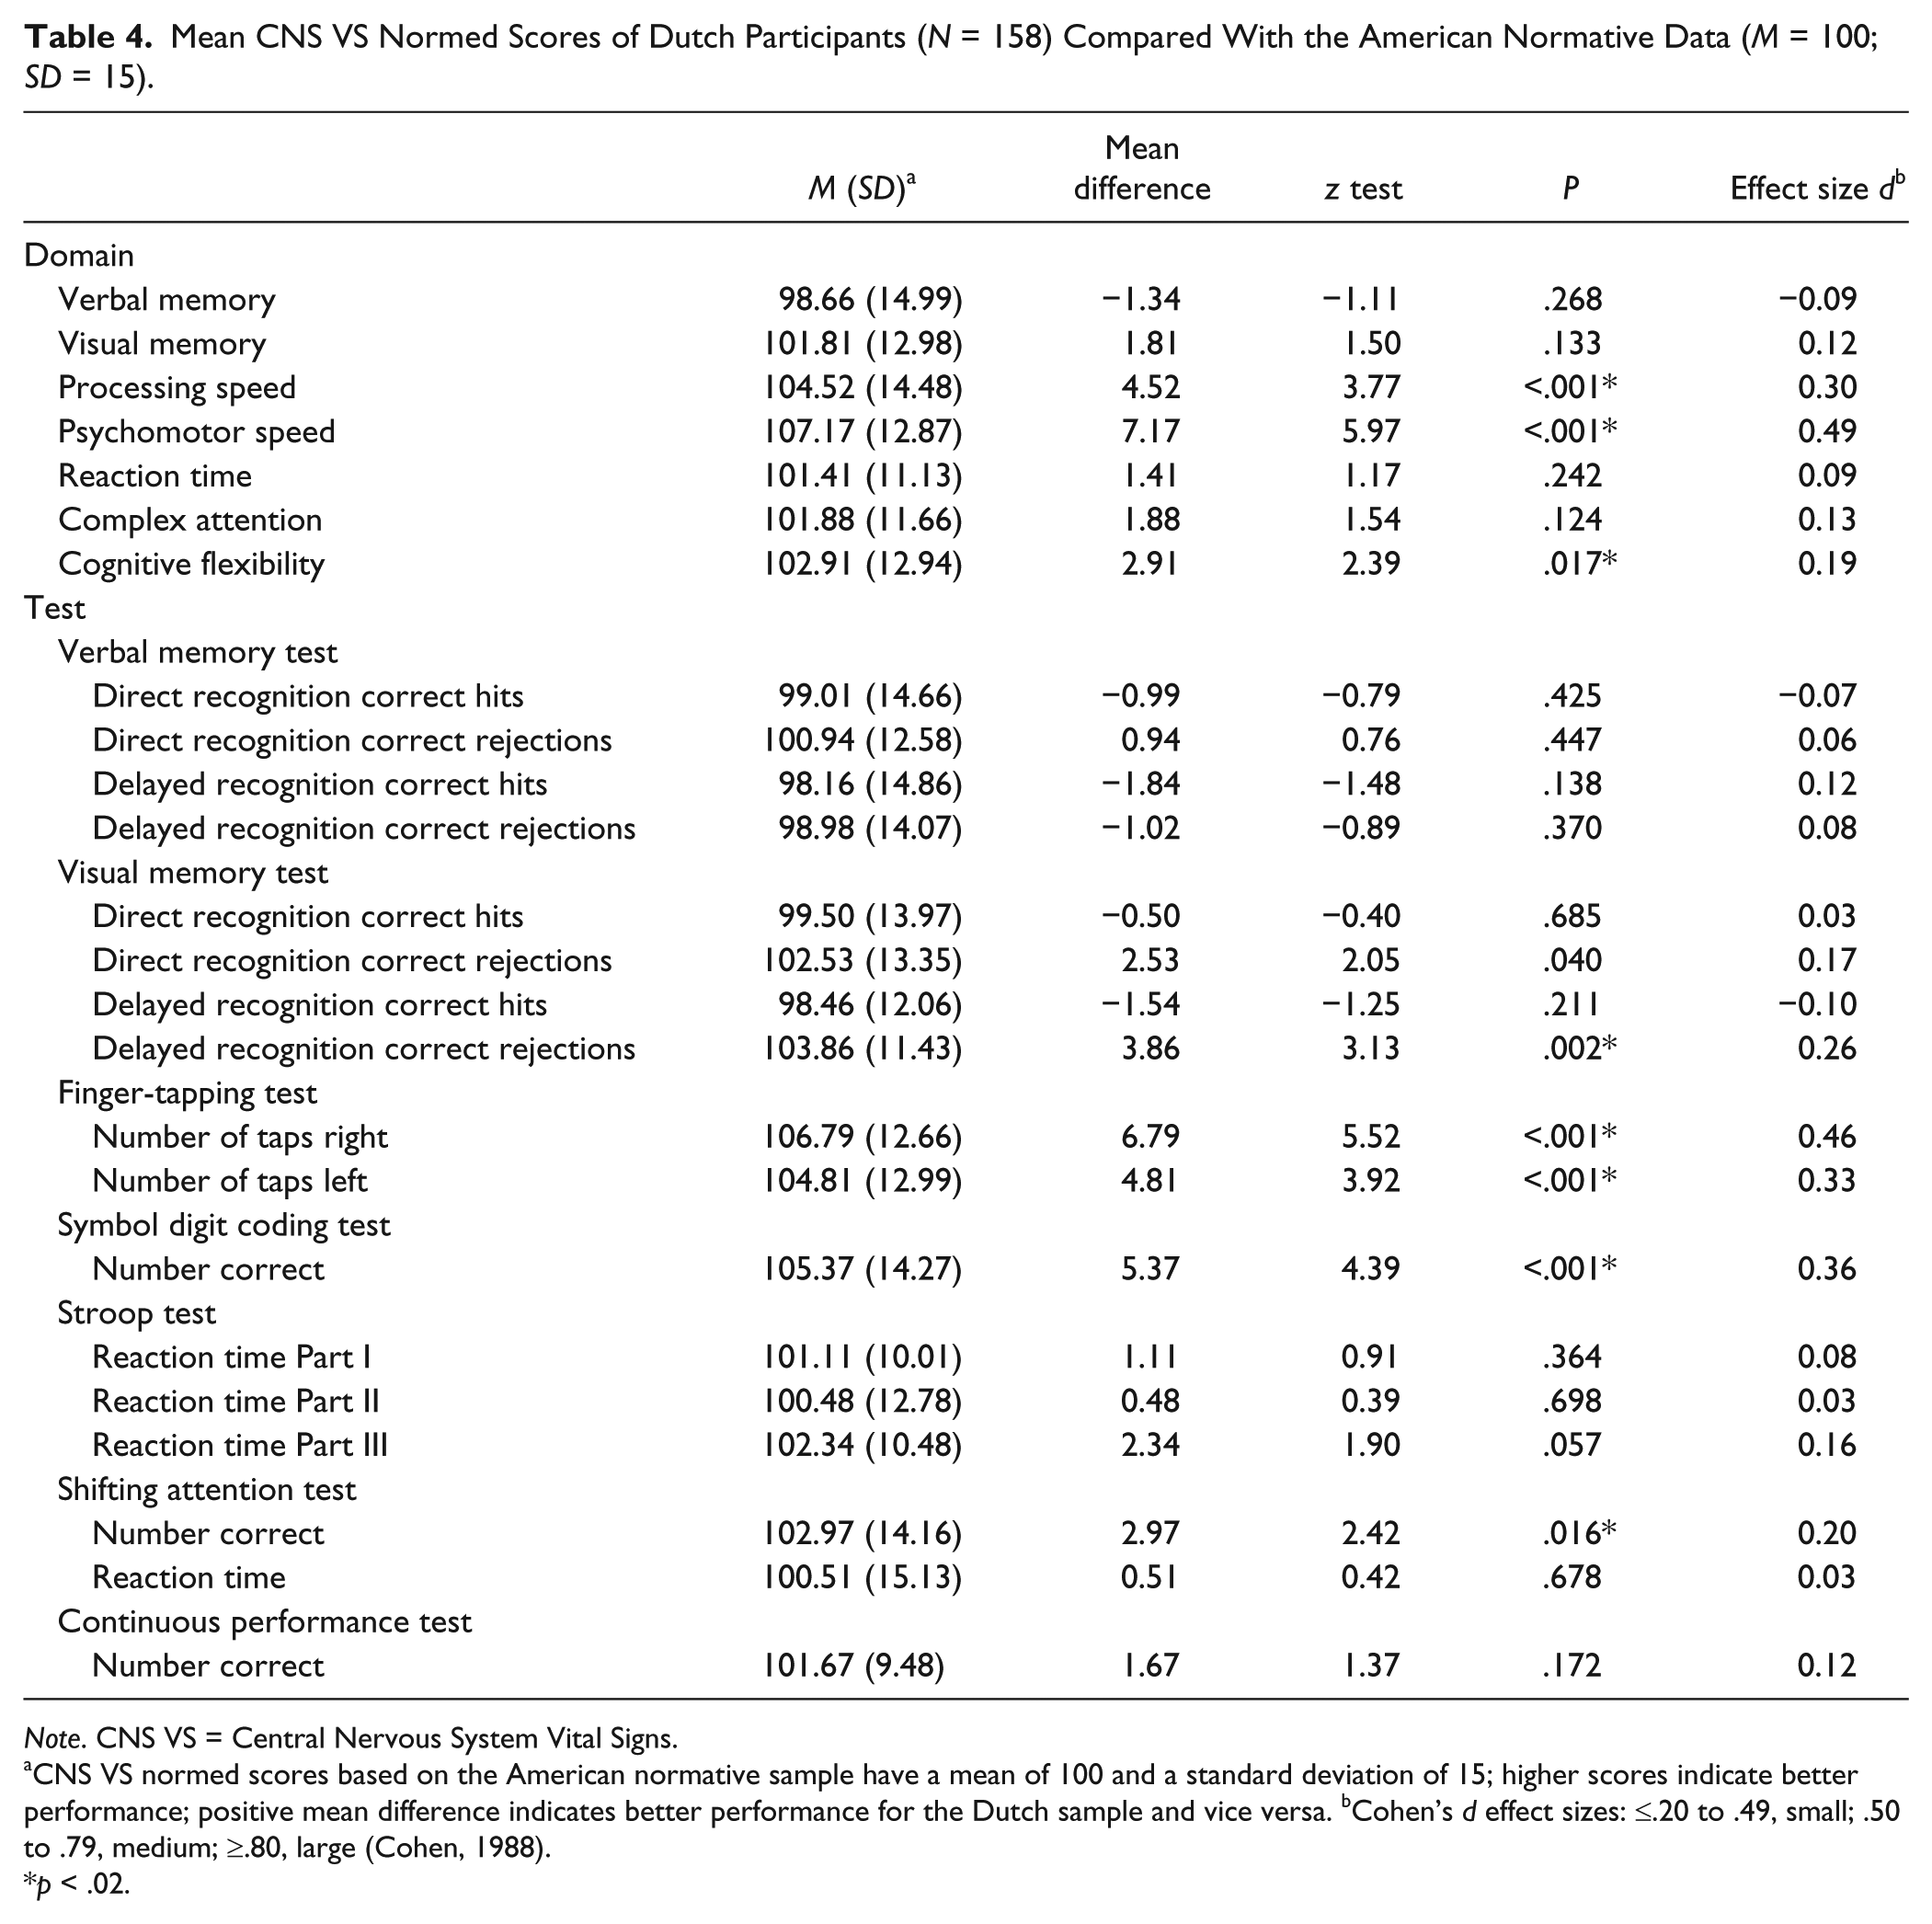
Table 4 shows mean differences for the Dutch sample as compared with the American-based normed scores (M = 100, SD = 15). Significant mean differences were found for the domains of processing speed (mean difference = 4.52, SD = 14.48; z = 3.77, p < .001), psychomotor speed (mean difference = 7.17, SD = 12.87; z = 5.97, p <. 001), and cognitive flexibility (mean difference = 2.91, SD = 12.94; z = 2.39, p = .017), where the Dutch sample demonstrated higher scores than the American normative sample. ES were small (Cohen’s d respectively 0.19 and 0.30 for cognitive flexibility and processing speed), except for psychomotor speed with a difference of near-medium size (Cohen’s d = 0.49).
Mean CNS VS Normed Scores of Dutch Participants (N = 158) Compared With the American Normative Data (M = 100; SD = 15).
Note. CNS VS = Central Nervous System Vital Signs.
CNS VS normed scores based on the American normative sample have a mean of 100 and a standard deviation of 15; higher scores indicate better performance; positive mean difference indicates better performance for the Dutch sample and vice versa. bCohen’s d effect sizes: ≤.20 to .49, small; .50 to .79, medium; ≥.80, large (Cohen, 1988).
p < .02.
At the level of normed individual test scores (e.g., representing reaction time, number of correct answers), the Dutch sample demonstrated significantly higher scores on 5 out of 17 measures compared with the American normative sample (see Table 4). The number of correct rejections in the delayed recognition Visual Memory Task was significantly higher in the Dutch sample, and Dutch participants performed significantly more taps on the Finger Tapping Test with both the right and the left hand. In addition, the numbers of correct responses on the Symbol Digit Coding task and Shifting Attention Task were higher in the Dutch compared with the original American normative group. A near-medium sized difference was found for the right hand Finger Tapping Test (Cohen’s d = 0.46), for the other tests, ES were small (Cohen’s d ranging from 0.20 to 0.36).
Multiple Regression Analyses
None of the assumptions regarding the regression analyses were violated. There was independence of residuals, with Durbin–Watson statistics ranging from 1.72 to 2.22. Scatter plots demonstrated linear relationships between the dependent and independent variables, and homoscedasticity. No problems with collinearity were identified, with correlations r between −0.01 and 0.38. No influential cases were identified (all Cook’s distances >1), and histograms demonstrated normally distributed standardized residuals for each cognitive domain.
Table 5 shows the results of the regression analyses. Overall, significant effects of age were found on performance in four out of seven raw cognitive domains scores (i.e., for processing speed, psychomotor speed, reaction time, and cognitive flexibility). Higher age was consistently associated with lower scores. Educational level was significantly associated with performance on three out of seven domains: participants with a high educational level (i.e., compared with a middle and low educational level) obtained higher scores on visual memory, processing speed, and cognitive flexibility. Sex was found to be significantly associated with performance on the verbal memory domain, in favor of women, and the psychomotor speed domain, in favor of men. The proportions of explained variances (R2) by age, education, and sex ranged from 7.2% (for the verbal memory domain) up to 46.2% (for the processing speed domain). Hierarchical regression analyses demonstrated significantly more explained variance for a model including both age and education, compared with a model with solely age, in four out of seven cognitive domains. In two out of seven domains adding the factor sex on top of age and education resulted in significantly more variance explained. Adding education or sex (in addition to age) to the regression model significantly increased the explained variance for the cognitive domains, except for the reaction time domain, where only age contributes significantly (data not shown).
Multiple Regression Based on the Dutch Sample (N = 158): Association of Age, Education, and Sex With Raw Cognitive Domain Scores of CNS VS.
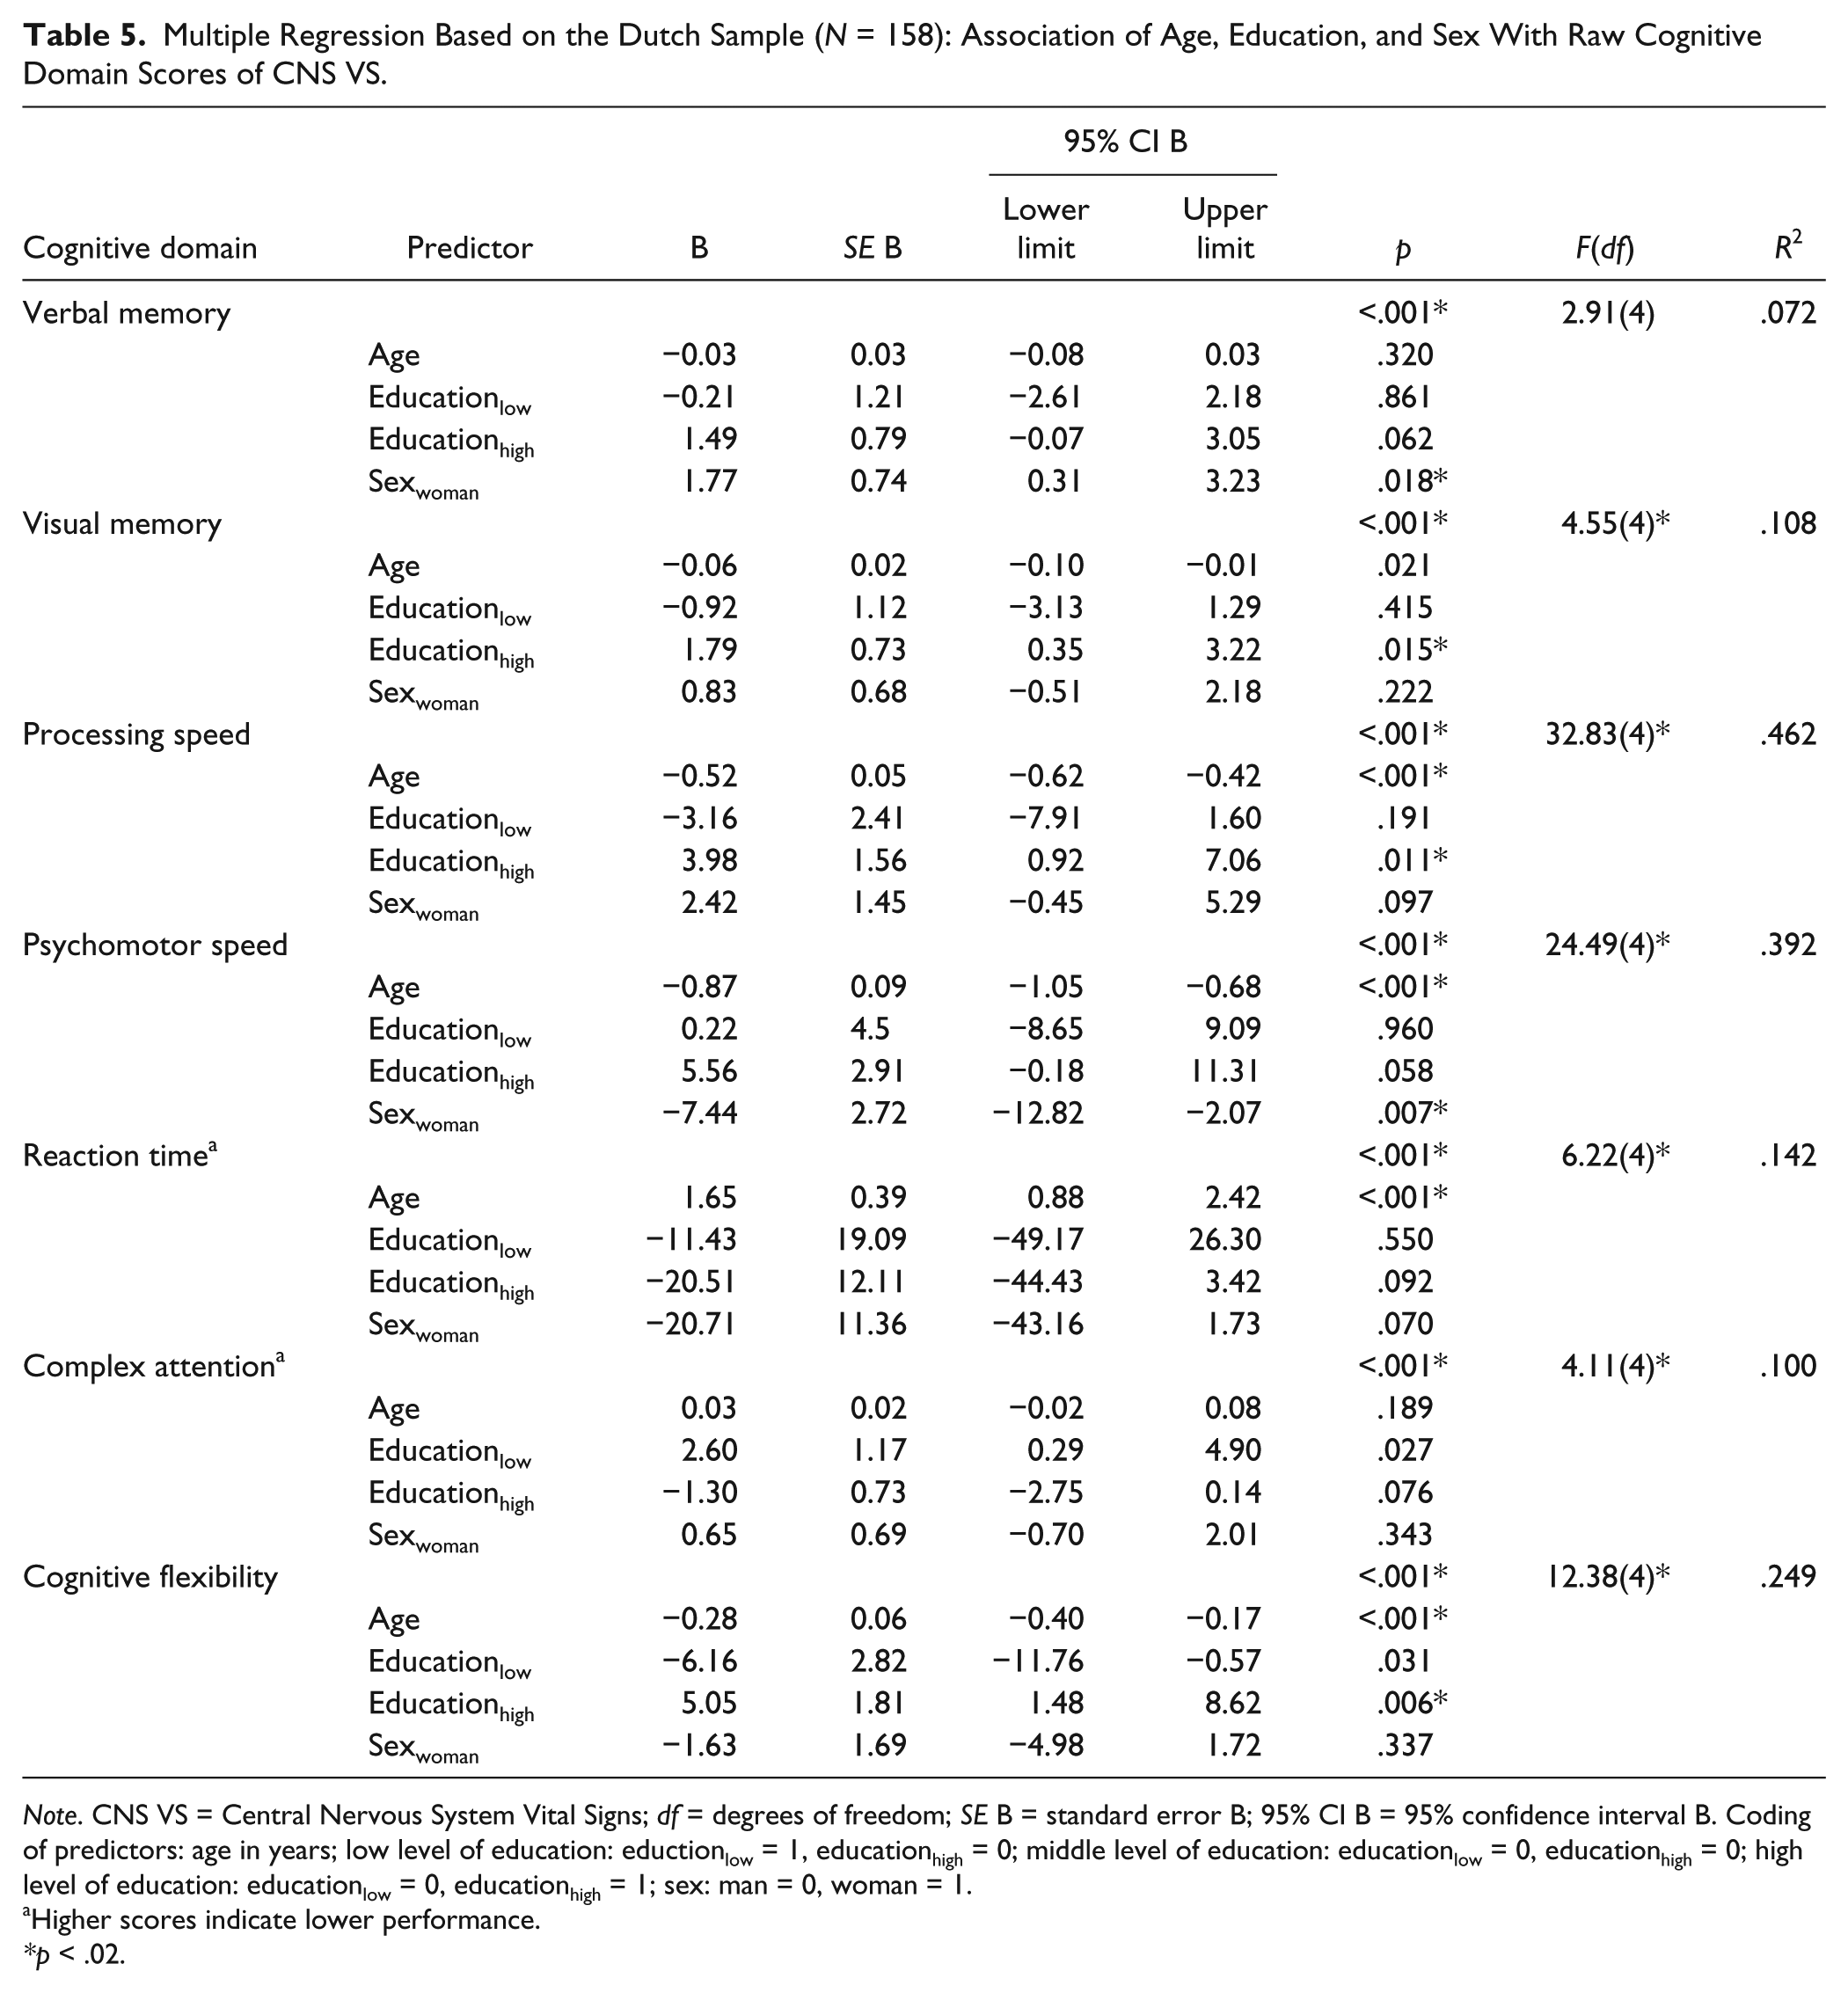
Note. CNS VS = Central Nervous System Vital Signs; df = degrees of freedom; SE B = standard error B; 95% CI B = 95% confidence interval B. Coding of predictors: age in years; low level of education: eductionlow = 1, educationhigh = 0; middle level of education: educationlow = 0, educationhigh = 0; high level of education: educationlow = 0, educationhigh = 1; sex: man = 0, woman = 1.
Higher scores indicate lower performance.
*p < .02.
Normative Regression Formulae
Table 6 shows the regression formulae that can be used to calculate normed predicted scores (i.e., corrected for effects of age, education, and sex) on cognitive domains of CNS VS for the Dutch population. An example of the application of the sociodemographically adjusted normative formulae is shown in Box 1.
Regression Formulae Based on the Dutch Sample (N = 158).
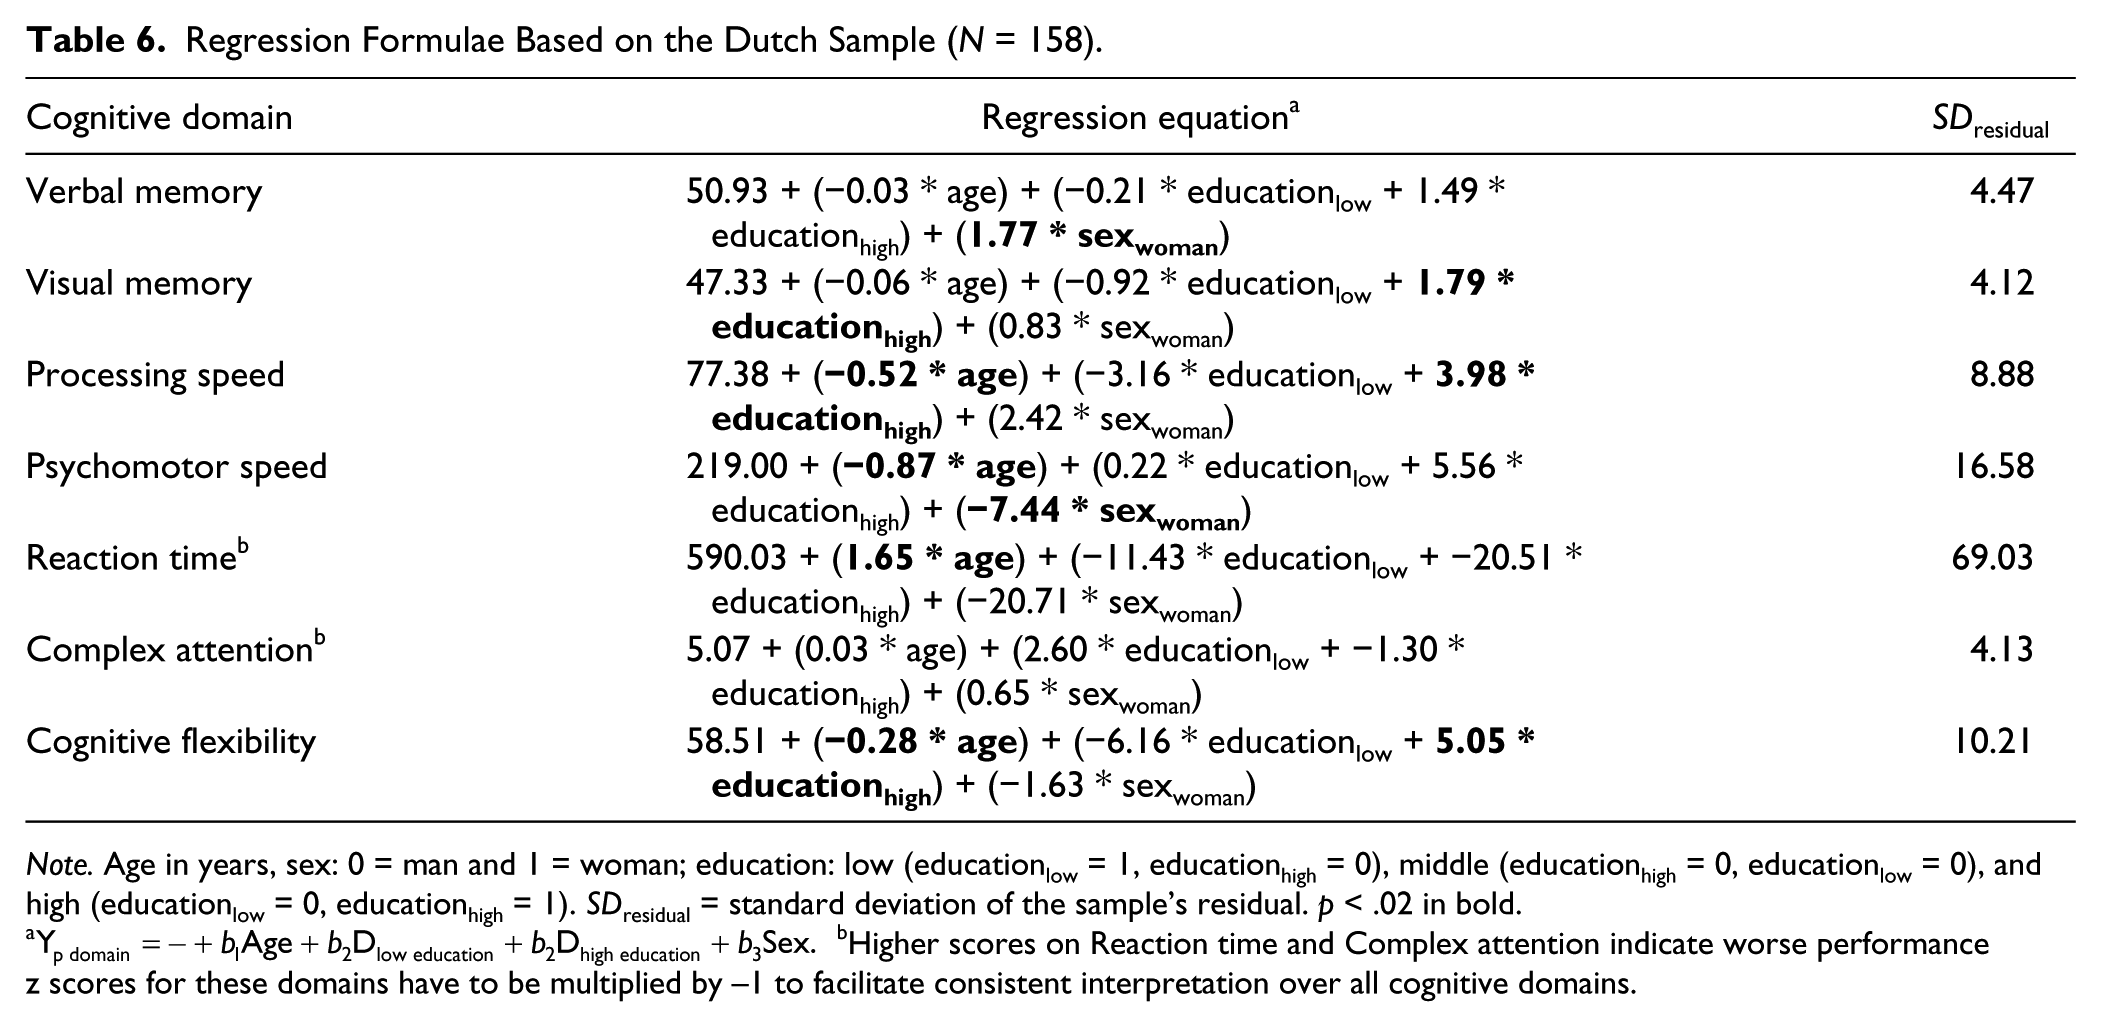
Note. Age in years, sex: 0 = man and 1 = woman; education: low (educationlow = 1, educationhigh = 0), middle (educationhigh = 0, educationlow = 0), and high (educationlow = 0, educationhigh = 1). SDresidual = standard deviation of the sample’s residual. p < .02 in bold.
Discussion
We examined the performance of a group of healthy Dutch participants who underwent neuropsychological examination with the computerized neuropsychological battery CNS VS. The purpose of this study was threefold: (a) to examine the applicability of the American CNS VS norms for the Dutch population; (b) to examine the effects of age, education, and sex on CNS VS performance of the Dutch sample; and (c) to provide sociodemographically adjusted normative formulae for the Dutch population.
At the level of individual CNS VS tests, scores in the Dutch sample were significantly higher on 5 out of 17 measures. Consequently, differences in mean performance for three out of seven cognitive domains were found between the Dutch sample and the American normative sample; in the two domains covering different types of speed, namely processing and psychomotor speed, and in cognitive flexibility.
It should be noted that computer skills — including keyboard work and on-screen visual scanning — have improved tremendously over the past decade, which may result in improvements in overall performance on computerized neuropsychological speed tests. Indeed, an earlier study on computer familiarity and CNS VS performance demonstrated significantly better (i.e., faster) performance in people who are very familiar with computers, opposed to people who reported only “some” familiarity with computers (Iverson, Brooks, Ashton, Johnson, & Gualtieri, 2009). As can be expected from the more frequent use of computers nowadays, our sample comprised too few participants with only some or none computer familiarity to look into these effects. The beneficial effects of computer familiarity may (partly) explain the differences between the American 2006 group and the Dutch 2016 group.
In addition, a possible Flynn effect should be considered given the headspring of the normative data presented by CNS VS. The Flynn effect refers to a substantial rise of the population’s performance on tests of intelligence in developed countries, typically about 3 to 5 points (i.e., on a IQ scale with a mean of 100 and standard deviation of 15 points) per decade. Explanations for the Flynn effect include genetic, environmental, methodological, and measurement factors (Flynn, 1984; Trahan, Stuebing, Hiscock, & Fletcher, 2014). It has been found that the impact of the Flynn effect extends beyond the measurement of IQ and has, for example, been demonstrated on measures of memory (Baxendale, 2010; Rönnlund & Nilsson, 2009), processing speed, and cognitive flexibility (Dickinson & Hiscock, 2011), with gains comparable to the size of the Flynn effect on measures of IQ. The scale of normed scores of CNS VS tests and domains is similar to that of IQ points, and the original normative data presented by Gualtieri and Johnson (2006) have been established over a decade ago. Therefore, mean normed cognitive domain scores can be expected to be about 3 to 5 points higher in the current 2015/2016 sample than the original normative data—which corresponds to the increased scores found in the present study.
Since the total variance explained by the sociodemographic variables added up to almost 50% in the present study (i.e., in particular for the processing speed and psychomotor speed domain), the influence of age, sex, and education should be taken into consideration when interpreting performance on the CNS VS. CNS VS incorporated corrections for age in their normative evaluation, but did not correct for effects of education and sex. Consistent with the literature, higher age was associated with lower performance (Verhaegen & Salthouse, 1997). Educational level was found to be positively associated with performance on visual memory, processing speed, and cognitive flexibility. Highly educated participants are likely to be somewhat overrepresented in our Dutch sample relative to the general Dutch population (CBS Statistics Netherlands, http://statline.cbs.nl/Statweb/). Although the higher performance of the sample might also be explained by this factor, we have no information on education in the original American normative sample, as these data are not disclosed by the authors. We may assume that this sample also included a relatively high proportion of highly educated participants, as these are typically (more) interested in study participation (Wacholder, Silverman, McLaughin, & Mandel, 1992). As would be expected, sex did not play a large role, except for the verbal memory domain favoring women, and the psychomotor speed domain favoring men. These findings are consistent with literature on sex differences in performance on other (computerized) tests (Gur et al., 2001; Iverson et al., 2014; Lezak, Howieson, Loring, Hannay, & Fischer, 2004; Silverstein et al., 2007), and reported by Gualtieri (n.d.) who examined sex differences in a subset of participants who completed the CNS VS battery during its standardization study.
Based on the collected data, we established regression-based normative formulae to adjust for the effect of sociodemographic variables on CNS VS performance. In future evaluations of performance in our (Dutch) patient studies, these normative data will replace the American norms.
Some critical remarks are in order with respect to the current study. Presented results are based on performance in Dutch healthy participants recruited on availability (i.e., convenience sampling). A disadvantage of this method includes the risk that the sample might not represent the Dutch population as a whole. As stated above, a relatively small number of low-educated participants (i.e., 12% compared with approximately 35% in the general Dutch population (CBS Statistics Netherlands, http://statline.cbs.nl/Statweb/) was included in the present study. The regression-based method requires smaller samples since continuous covariates do not have to be categorized (e.g., stratifying the sample into groups of different age, sex, and educational levels). Instead, it makes optimum use of the entire sample to estimate the normative statistics and the regression model (Evers, Lucassen, Meijer, & Sijtsma, 2009; Oosterhuis, van der Ark, & Sijtsma, 2016). However, one should always be careful when using these data for interpreting individual test performance of people who are in the extreme ends of age, or education (very low levels, or by contrast, very high levels of education). In addition, data were collected using a Dutch translation of the CNS VS battery. Since the equivalence with the English version of the test has never been confirmed, we cannot rule out that differences in difficulty due to translation of instructions and items also have a share in the observed differences (Bender, García, & Barr, 2010). Although our results may not be generalizable to other countries or to populations who speak other languages, they demonstrate that CNS VS users from other populations than the American should use and interpret the original norms with caution. Moreover, we recommend on considering adjusting for sociodemographic factors when interpreting CNS VS performance in American populations.
Also, changes in technology (i.e., computer hardware/software) since the collection of the initial American norms may have affected important parameters including timing accuracy. Although technical aspects and settings of the devices used in the present study were the same for all assessments, no information is available concerning devices that were used when collecting the American normative data. Differences therein might explain a small portion of the group differences in our study, but this is unlikely considering the generally rather small timing inaccuracies and the significant differences that we demonstrated for cognitive domains (Cernich, Brennana, Barker, & Bleiberg, 2007; Plant & Turner, 2009). Yet, although the timing precision of CNS VS on different test systems should be explored in more detail, CNS VS provides explicit recommendations concerning system requirements for installation, and states that their applications are designed to be working equally well over types of devices and types of applications (‘CNS Vital Signs Optimal Use Installation Guide’, www.cnsvs.com). However, evidence of this statement is not available.
Future studies should consider the psychometric robustness of CNS VS across cultures and (other) non-American languages. Furthermore, various clinical and research settings require repeated neuropsychological assessment, for example, for the evaluation of effects of intervention on cognitive functioning. This emphasizes the need for inspection of CNS VS regarding repeated assessment, addressing practice effects (i.e., improvements in performance due to familiarity with the test, its items, and test procedures opposed to true cognitive improvement). Currently, we are performing follow-up assessments in the same Dutch sample with the aim of establishing change indices correcting for potential practice effects and measurement errors to determine “true” (i.e., reliable) clinically meaningful cognitive change when administering CNS VS repeatedly over time.
The present study examined the applicability of the original American normative data of CNS VS to a non-American population: our results call the usefulness of the 2006 norms of the CNS VS in other populations than the American into question. Furthermore, we identified effects of education and sex, in addition to known effects of age, on CNS VS performance. These findings highlight the need for more up-to-date population-based norms for CNS VS performance. Sociodemographic factors should be considered when interpreting performance on this measure, for example, by applying sociodemographically adjusted normative formulae, as we have presented here.
Footnotes
Acknowledgements
The authors thank the research assistants for the recruitment and neuropsychological assessment, and in addition, Eline Verhaak and Wietske Schimmel for comments on an earlier version of this article.
Authors’ Note
A SPSS syntax for converting raw cognitive domain scores into z scores is available by contacting the authors.
Declaration of Conflicting Interests
The author(s) declared no potential conflicts of interest with respect to the research, authorship, and/or publication of this article.
Funding
The author(s) disclosed receipt of the following financial support for the research, authorship, and/or publication of this article: This study is funded by ZonMw, a Dutch national organization for Health Research and Development. Project Number 842003007.