
Abstract
Understanding the human factors of how drivers perceive hazards and behave at stop sign-controlled intersections is essential for developing effective roadway features. This study aimed to evaluate the naturalistic behaviors of drivers at stop sign-controlled intersections and to assess the speeds at which drivers maneuvered through stop signs when no cross-traffic was present. To this end, 62 vehicles were analyzed in two, two-lane, four-way roadway intersections in Michigan. Results of this study indicate that most drivers slow to non-zero minimum speeds before traveling through an intersection and measurably encroach beyond stop lines. Assessment of lines of sight and visual obstructions at the subject intersections indicate that drivers’ perceptions of risk, evaluation of potential hazards, and cost of compliance ultimately impact behavior, as seen through vehicle kinematics.
Introduction
Stop signs play a vital role in mitigating vehicle incidents by establishing right-of-way and regulating pedestrian, bicyclists, and vehicle movement through cross-traffic intersections (Woldeamanuel, 2012). As vehicle traffic fatalities continue to rise each year, it is crucial to better understand the relationship between human driving perceptions and vehicle kinematics at stop-sign controlled intersections (National Highway Traffic Safety Administration [NHTSA], 2021). Several factors have been identified that influence driver perceptions and behaviors leading to both zero and non-zero minimum vehicle speeds at stop signs (Allport, 1934; Tavassoli et al., 2019; Woldeamanuel, 2012; Woldeamanuel & Hankes, 2011).
Although vehicle laws and regulations may vary state by state, there is a consensus that drivers approaching a stop sign-controlled intersection should come to a complete stop before the crosswalk, stop line, or closest point of clear vision of approaching traffic prior to entering the intersection when no roadway markings are present. Once a full stop is completed, the driver must yield to traffic within the intersection and to traffic approaching the intersection at a speed or distance that would conflict with the stopped driver’s intended route of travel (Michigan Vehicle Code, Section (§)257.649). The language can vary between jurisdictions; some will add language that identifies conflicting vehicles as those that are so close as to present an immediate hazard. It is well established that these regulations are often ignored.
Several human factors play roles in influencing when drivers perceive that it is necessary or prudent to come to a complete stop at stop signs and where to do so (e.g., before the crosswalk, stop line, or closest point of clear vision). Woldeamanuel (2012) and Woldeamanuel and Hankes (2011) found that the driving environment, roadway design, phone use, number of passengers, law enforcement proximity, lighting conditions, and driver behaviors such as carelessness, distraction, inattention, and overconfidence influence driver behavior at stop signs.
Relating to the specific intersection environment, several studies have examined the effect of cross-traffic on driver stopping behavior. Naturalistic driving behavior regarding stop sign compliance rates has been studied since as early as 1934, determining that driver compliance at stop signs increases significantly with the presence of cross-traffic and even more when law enforcement is present (Allport, 1934; Feest, 1968). Allport noted that rarely do all individuals conform with the expectations or requirements (Allport, 1934). However, without the need to stop for approaching traffic, the stop sign compliance rate drops significantly, with vehicles performing “rolling stops,” or achieving a non-zero minimum speed.
Other location-specific observational studies have examined the relationship between stop sign compliance in the presence and absence of cross-traffic. A 2017 study performed in Qatar analyzed driver stopping behavior with and without cross-traffic and found that, on average, 25% of drivers came to a complete stop. The compliance rate of drivers specifically when no cross-traffic was present was not specified (Shaaban et al., 2017). A study of driver behavior at stop signs conducted between 1979 and 1985 in Quebec, Canada found that when cross-traffic was present, approximately 59.4% to 77.7% of drivers came to a complete stop while 20.0% to 36.8% of drivers simply reduced speed and performed a rolling stop. Alternatively, when cross traffic was absent, 12.1% to 33.3% of drivers came to a complete stop and 53.6% –to 74.2% of drivers performed a rolling stop (McKelvie, 1986; 1987). Researchers found that the presence of cross-traffic was more influential on driver compliance then sex or age (McKelvie, 1986).
Drivers constantly seek information about their environments as they approach and navigate intersections, assessing the presence and approach of other vehicles, bicyclists, or pedestrians in the intersection in addition to managing environmental conditions and being alert for other roadway hazards (Campbell et al., 2012; Yamani et al., 2015). Changes in the driver’s required cognitive workload as they approach an intersection may lead to greater non-compliance and non-zero minimum speeds. A driver’s ability to perceive and react to potential hazards, such as cross-traffic, incoming pedestrians, and bicyclists, is also affected by their speed as they approach such intersections and the complexity of the environment (presence of cross-traffic vs. clear road). Though considerable efforts have been made to assess vehicle compliance at stop sign-controlled intersections, little research has been conducted to assess the speeds of non-compliant drivers maneuvering through such intersections.
The aim of this study was to evaluate the naturalistic behavior of drivers at stop sign-controlled intersections and assess the minimum vehicle speed as drivers approach a stop sign-controlled intersection prior to accelerating through the intersection when no cross-traffic was present.
Method
Data Collection
Two intersections were observed. Intersection 1 was located at Runyan Lake Road and White Lake Road in Tyrone Township, MI. White Lake Road is a two-way roadway with one eastbound and one westbound travel lane, and has a speed limit of 35
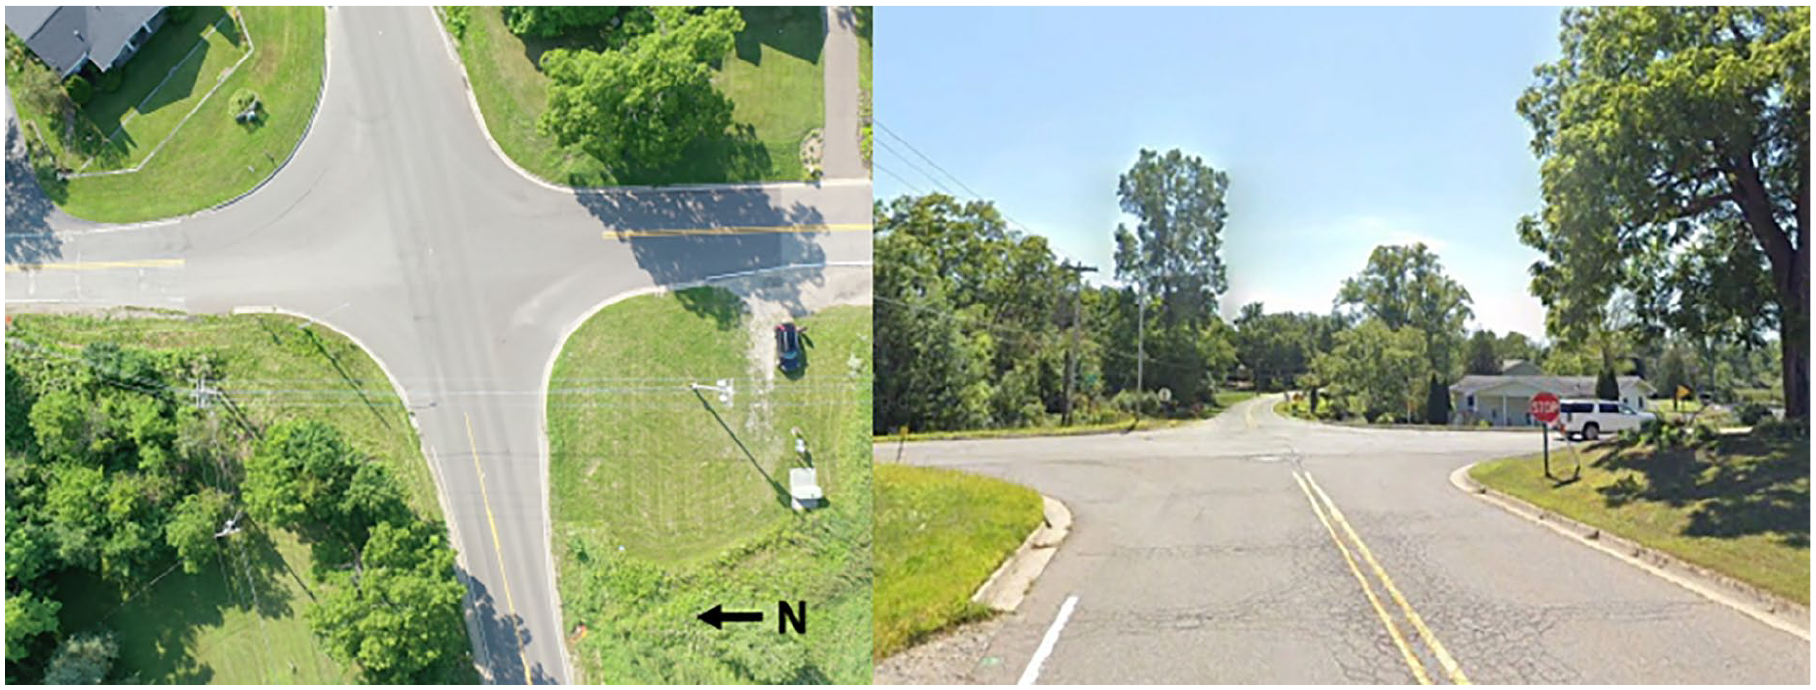
Intersection 1—Aerial photograph of (left) and Google earth street view looking south (right).
Intersection 2 was located at 9 Mile Road and Taft Road in Novi, MI. 9 Mile Road is a two-way roadway with one eastbound and one westbound travel lane and designated left turn lanes for both eastbound and westbound traffic. 9 Mile Road has a speed limit of 30
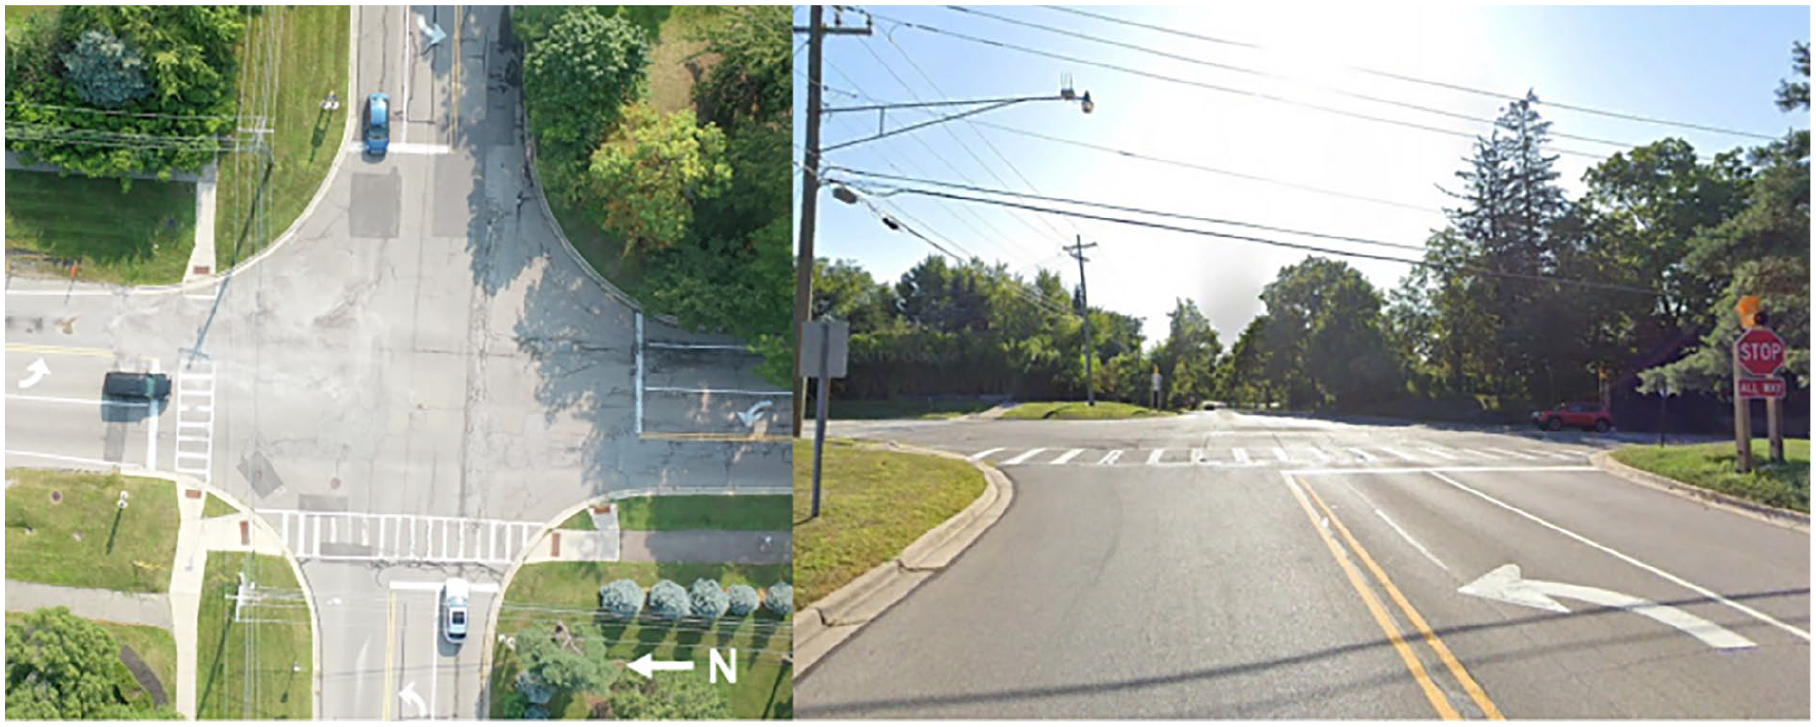
Intersection 2—Aerial photograph (left) and Google earth street view looking east (right).
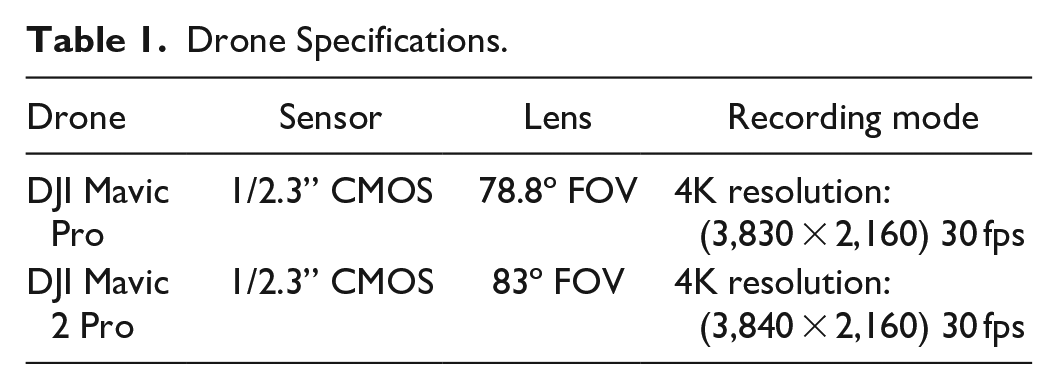
Driver behaviors were recorded using a small unmanned aerial system (sUAS/drone) in Class G airspace under Federal Aviation Administration (FAA) Small Unmanned Aircraft Regulations by a licensed remote pilot. DJI Mavic Pro and DJI Mavic 2 Pro were used to record video footage of vehicles entering and exiting the subject intersections (Table 1). Drones were positioned at a corner of the intersection and held in place at altitude for the duration of the data collection.
Drone Specifications.
Sixty-two vehicles were analyzed—31 vehicles per intersection. The objective of this study was to observe driver behavior when there was not a need to stop for approaching traffic. Therefore, only instances where cross-traffic was absent were evaluated for this study. Instances where pedestrians or bicyclists were present were excluded. One-way ANOVA and Tukey’s multiple comparisons test were used to identify a difference among means (p ≤ .05).
Data Analysis
The aerial footage captured by the drone was processed using a camera-tracking and image analysis engine software (The Pixel Farm Ltd, 2020) to calculate vehicle speeds as well as the location relative to the required stopping point that the minimum vehicle speed was reached (Carter, 2019). Vehicle locations and speeds were calculated by tracking a distinct point on the vehicle through the scene, accounting for drone movement and instability using a fixed reference point. Aerial imagery was scaled using 3D laser scan data of each intersection. The calculated vehicle speed was verified by comparing speed measurements on an instrumented control vehicle to the vehicle’s speed calculated using the analysis software. The lowest vehicle speed was identified for each vehicle. The “lowest speed distance” was defined as the longitudinal distance between the front of the vehicle and the required stopping point at the time when the minimum vehicle speed was reached. The required stopping points were defined as the stop sign for Intersection 1 and the stop line for Intersection 2. Photographs of proper and improper vehicle stopping positions are shown in Figures 3 and 4, respectively. Each stop sign location was also uniquely identified (A–F) as depicted in Figure 5.
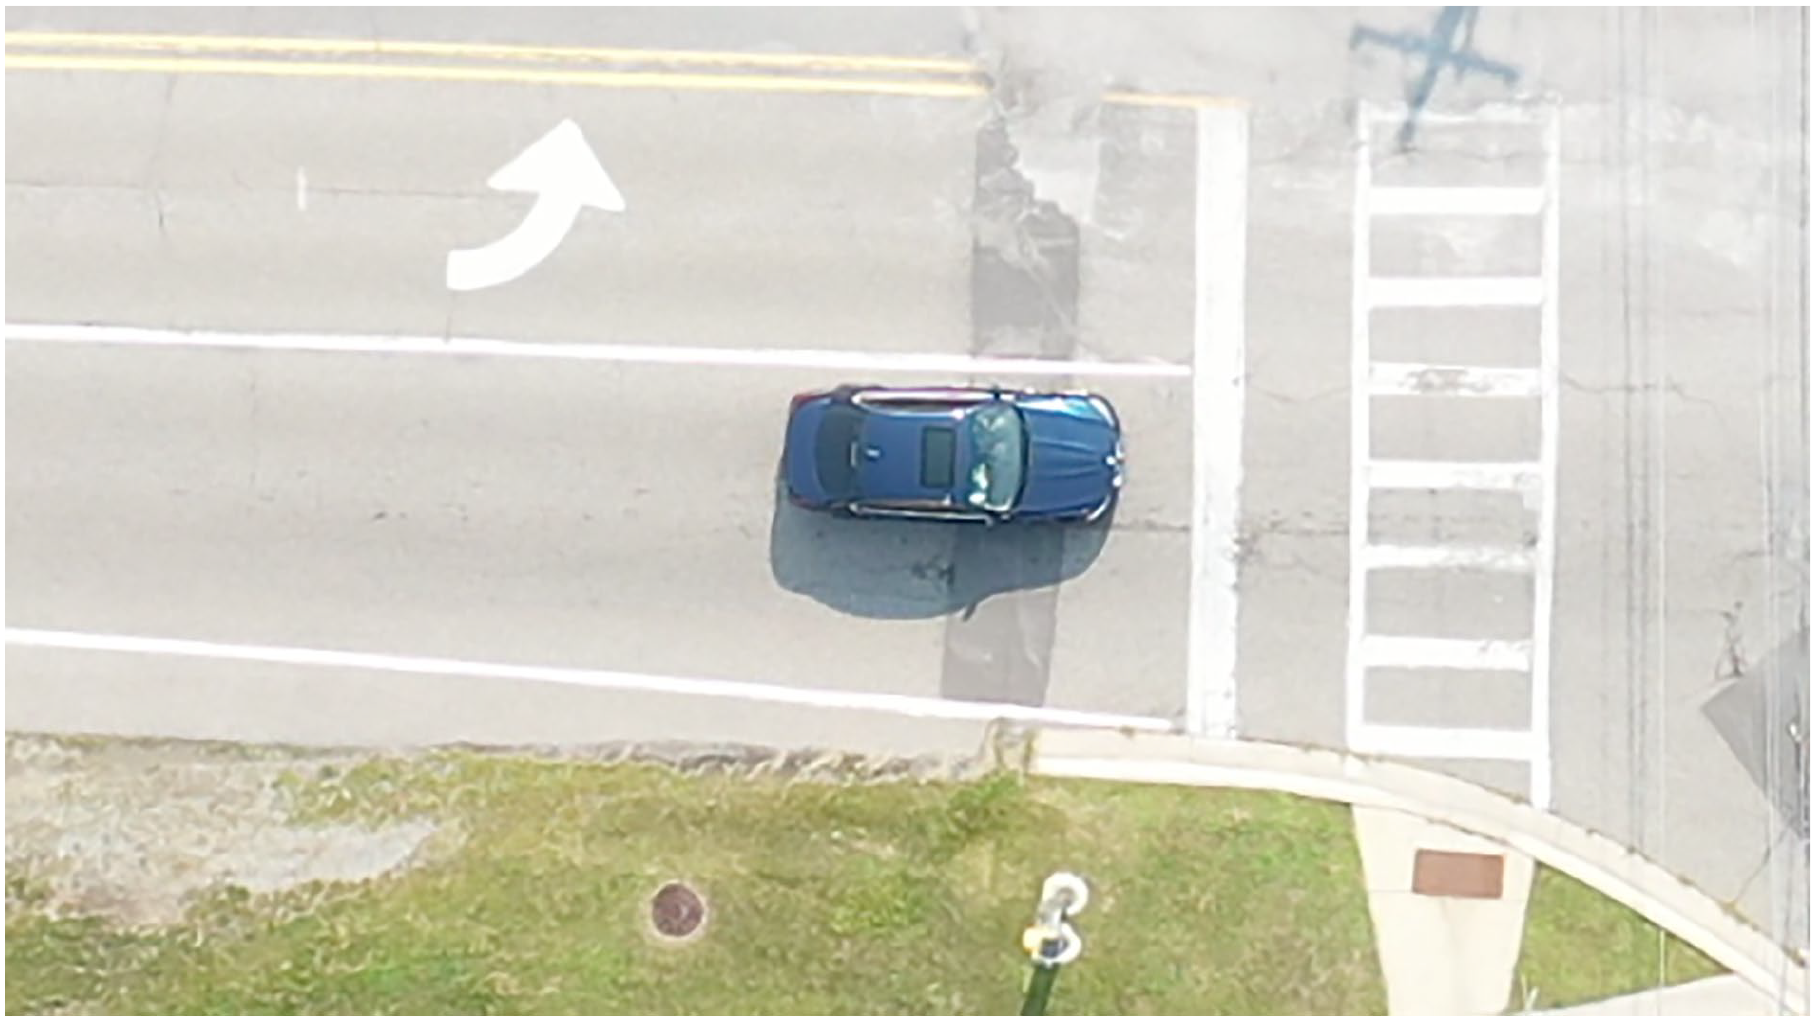
Example of proper stop location at Intersection 2.
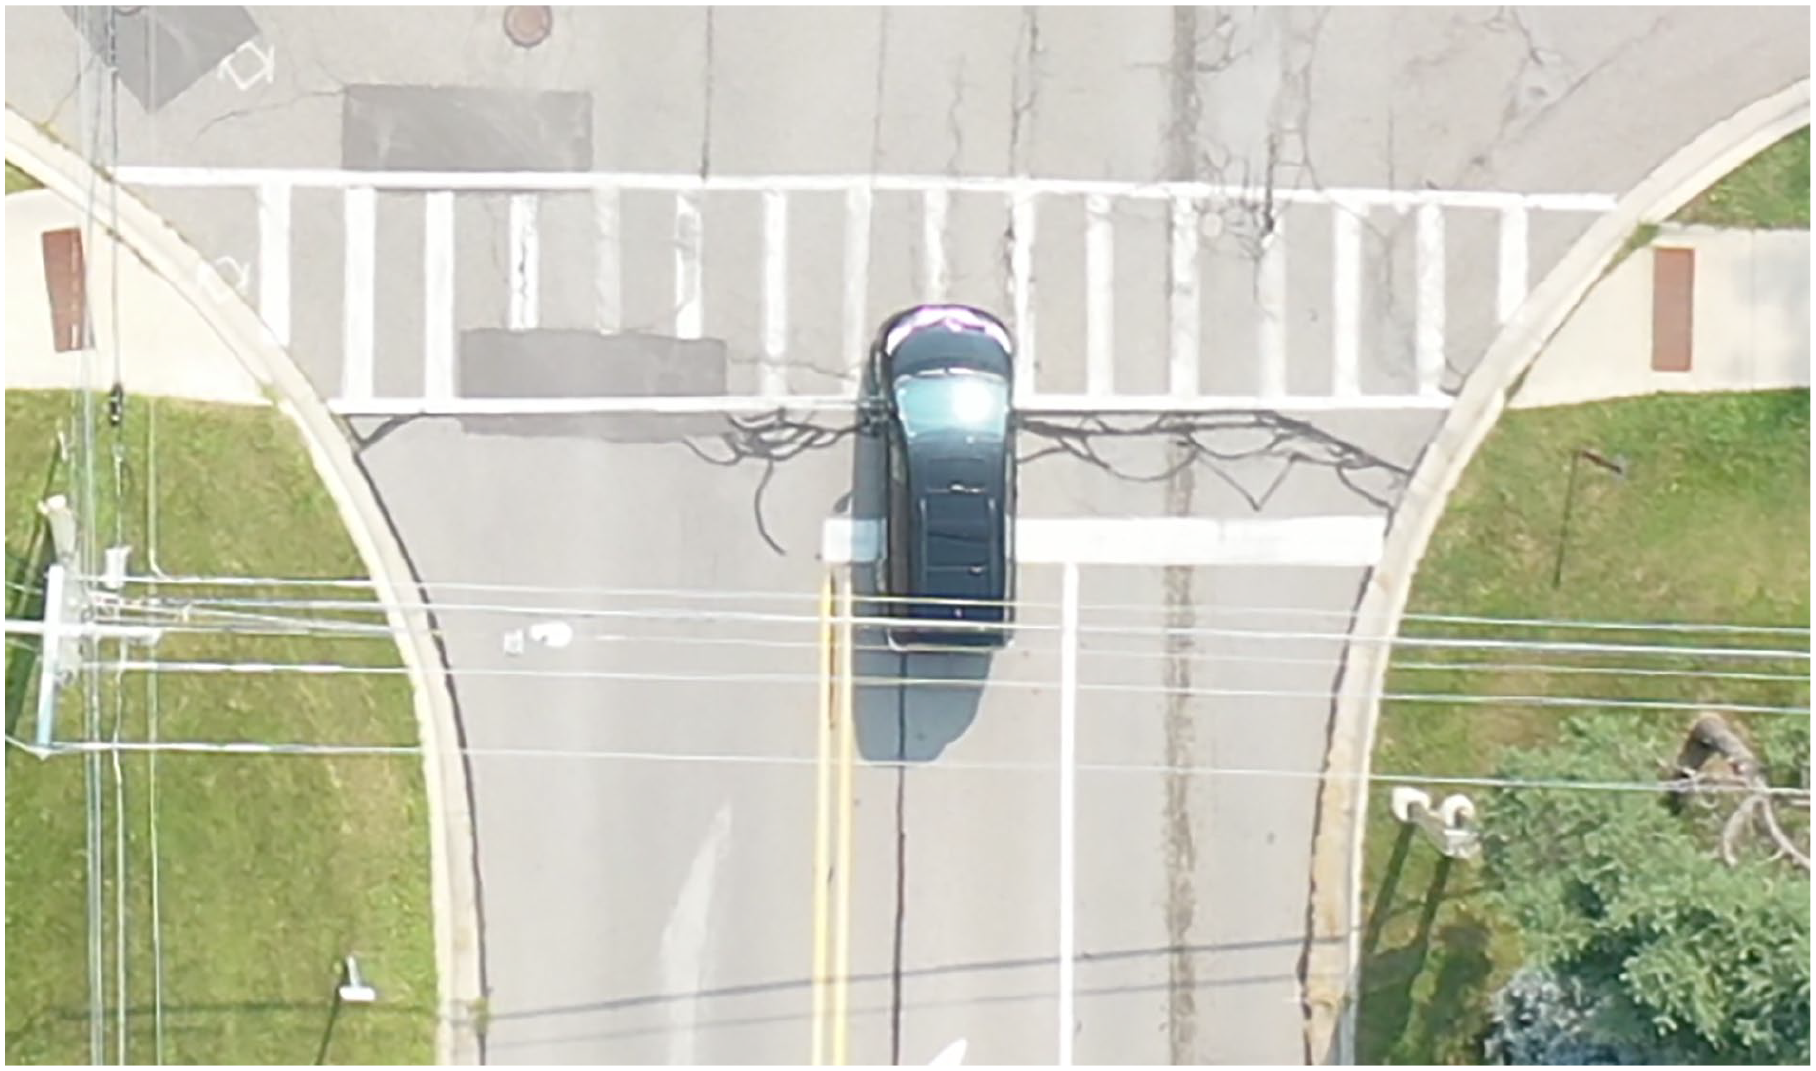
Example of improper stop location at Intersection 2.
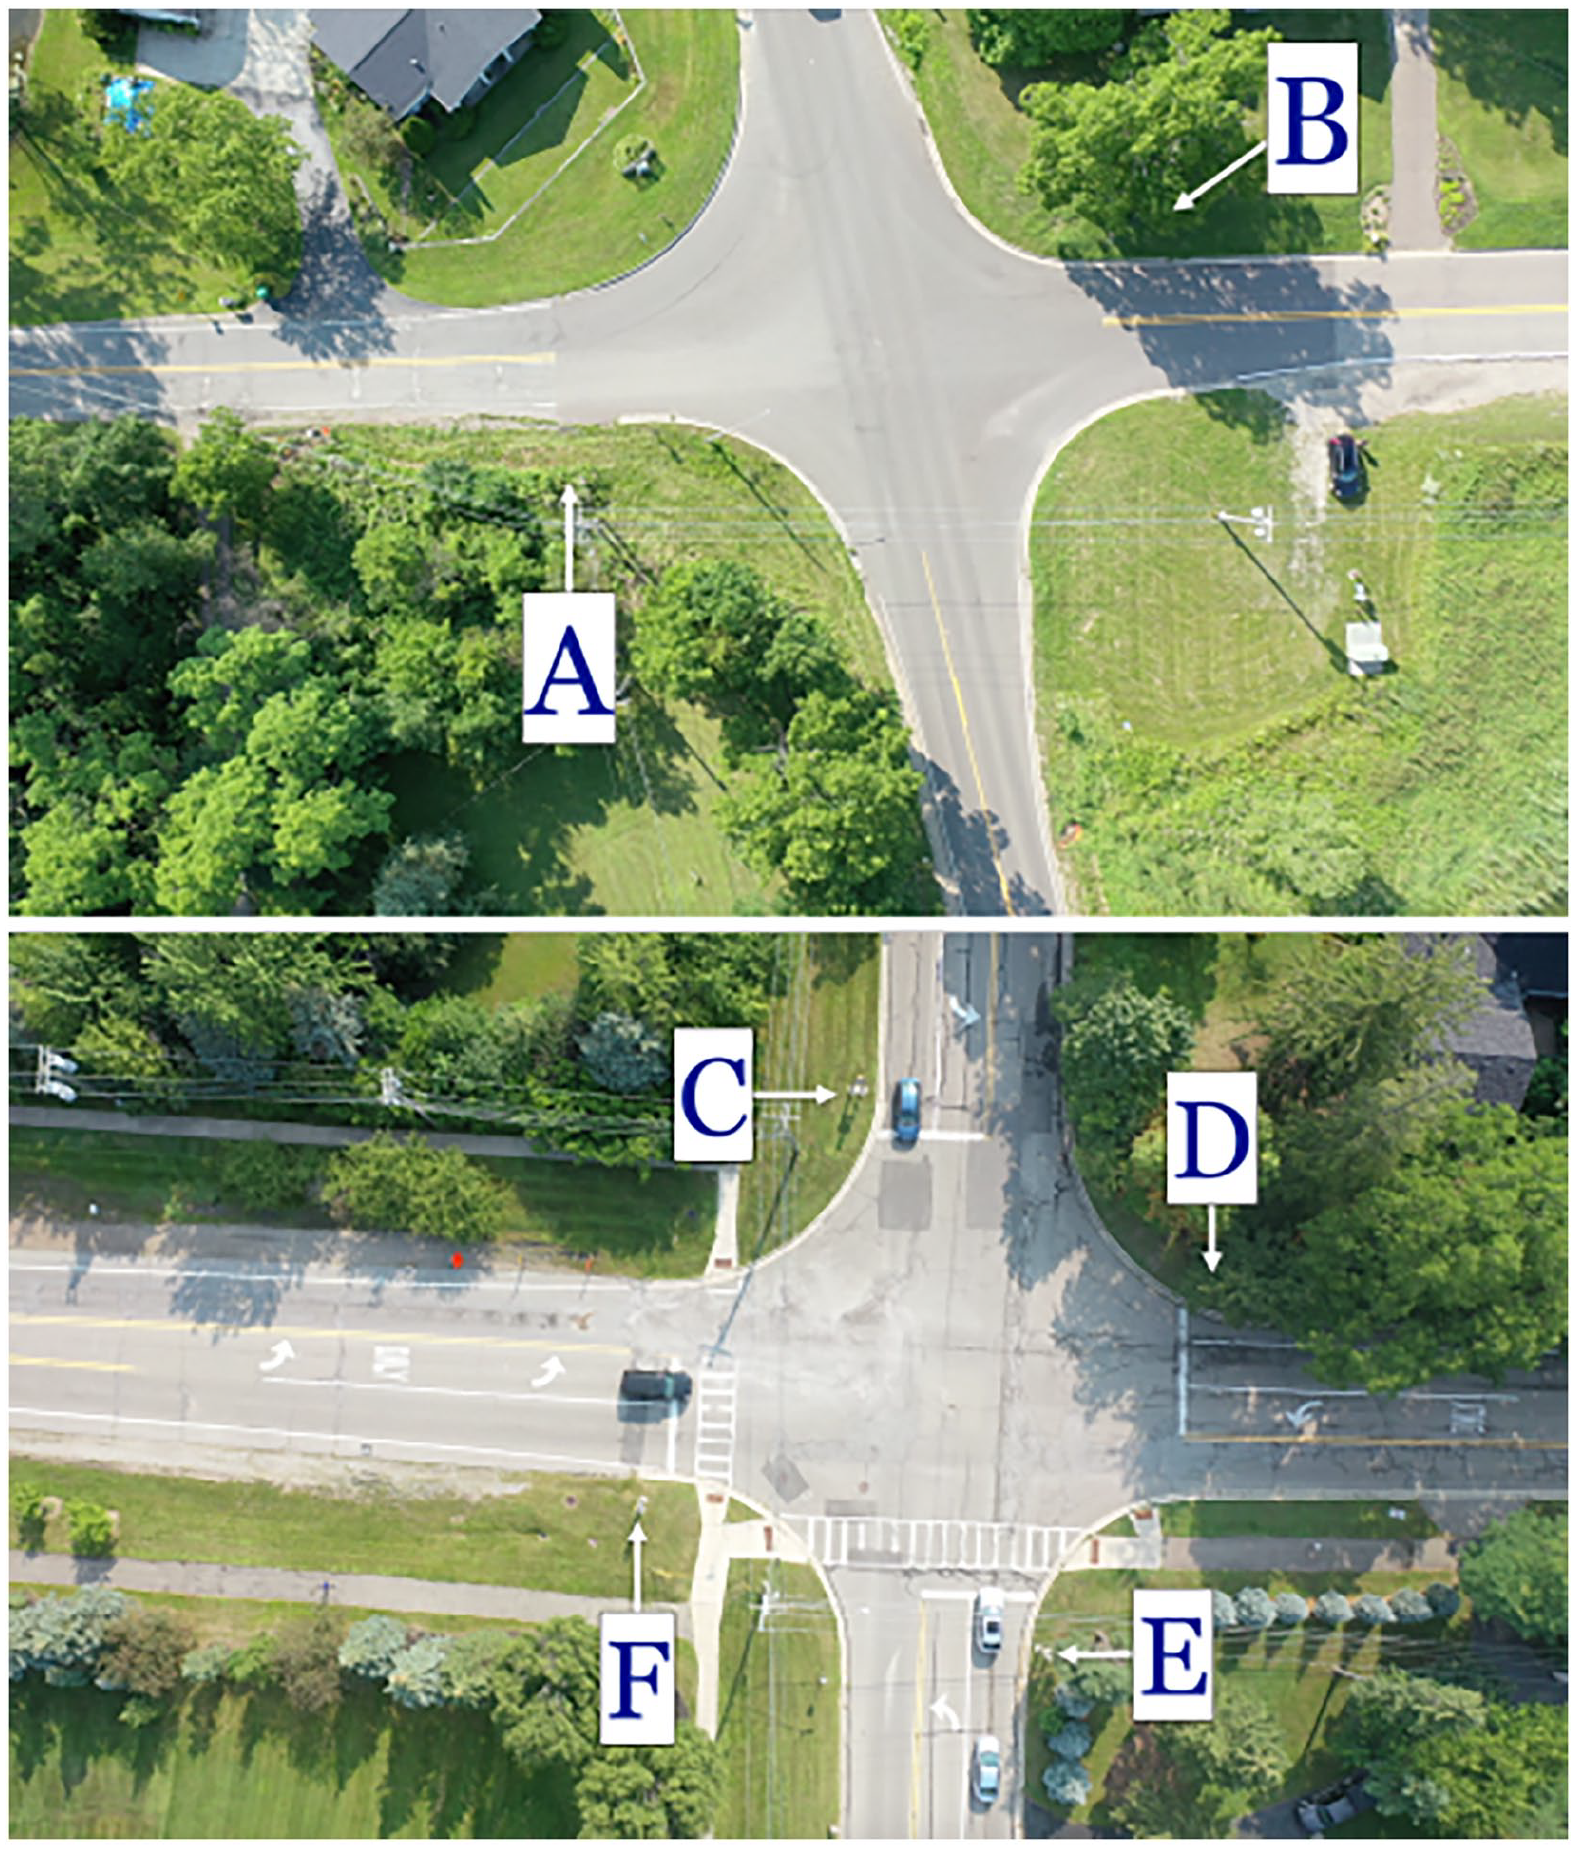
Identifiers of stop sign locations for Intersection 1 (top) and Intersection 2 (bottom).
Results
Minimum speeds prior to acceleration (
Average Minimum Speeds and Lowest Speed Distances (±SD) at Stop Sign-Controlled Intersections, by Location.
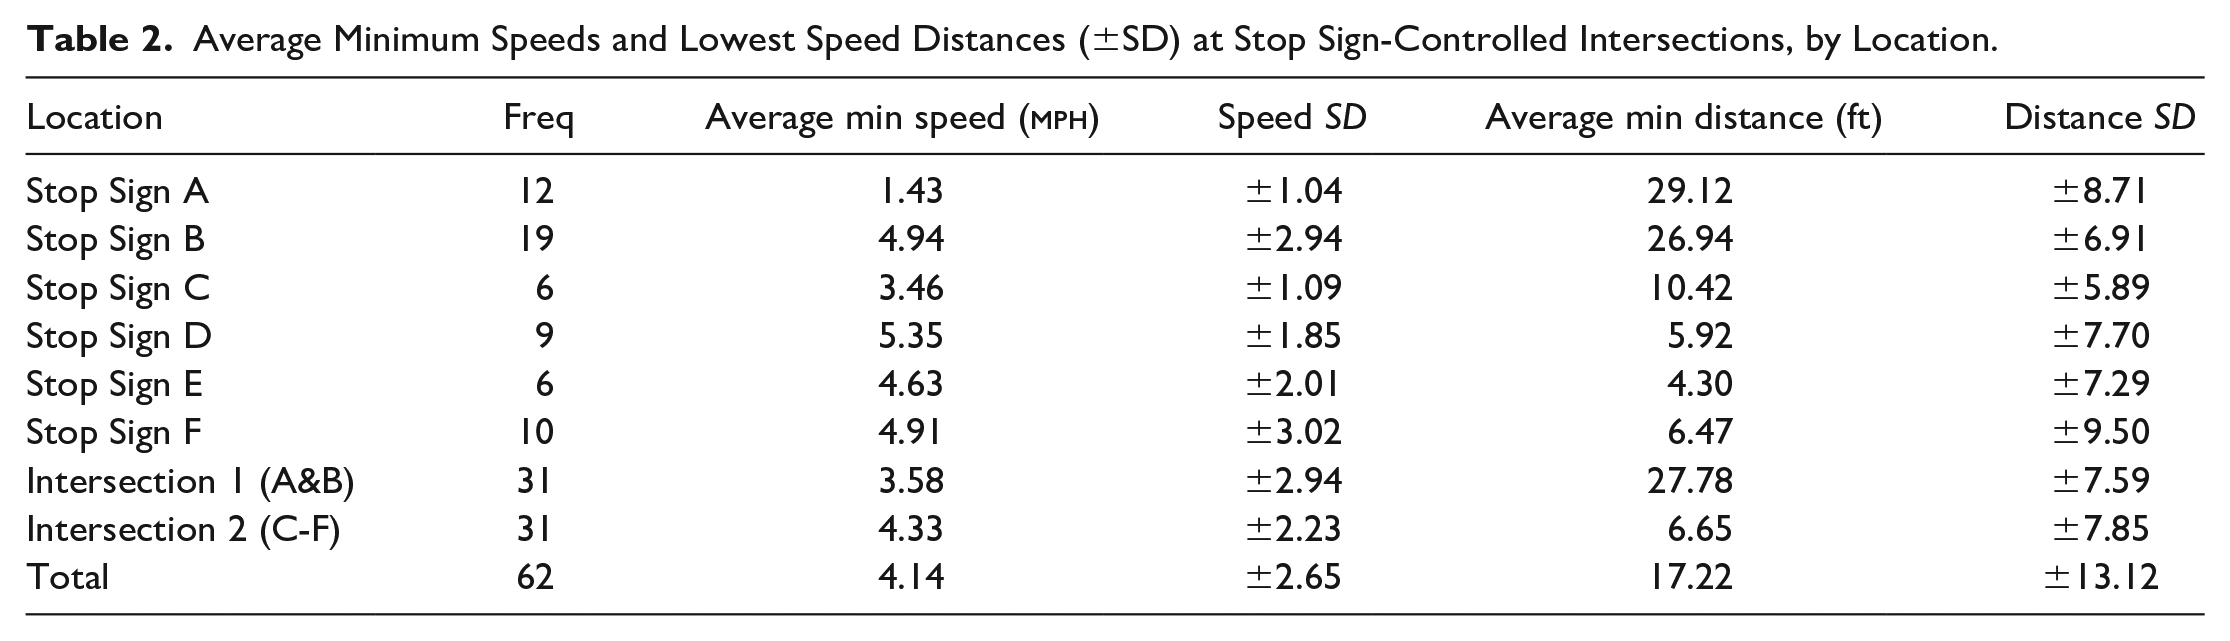
Stopping distance was measured as positive (distance past the stop line) and negative (distance before the stop line). For Stop Signs E & F, it was further observed if the vehicles stopped within the marked pedestrian crosswalk. At Stop Sign E, three out of the four vehicles that passed the stop line reached their lowest speed within the crosswalk. At Stop Sign F, two vehicles reached their lowest speed within the crosswalk while two vehicles stopped slightly beyond the crosswalk. It was noted that the crosswalk for Stop Sign F was not as wide as that at Stop Sign E. There was no significant difference between the minimum speeds between the two intersections (p > .05) but there was a difference between the stopping point distances (p < .05).
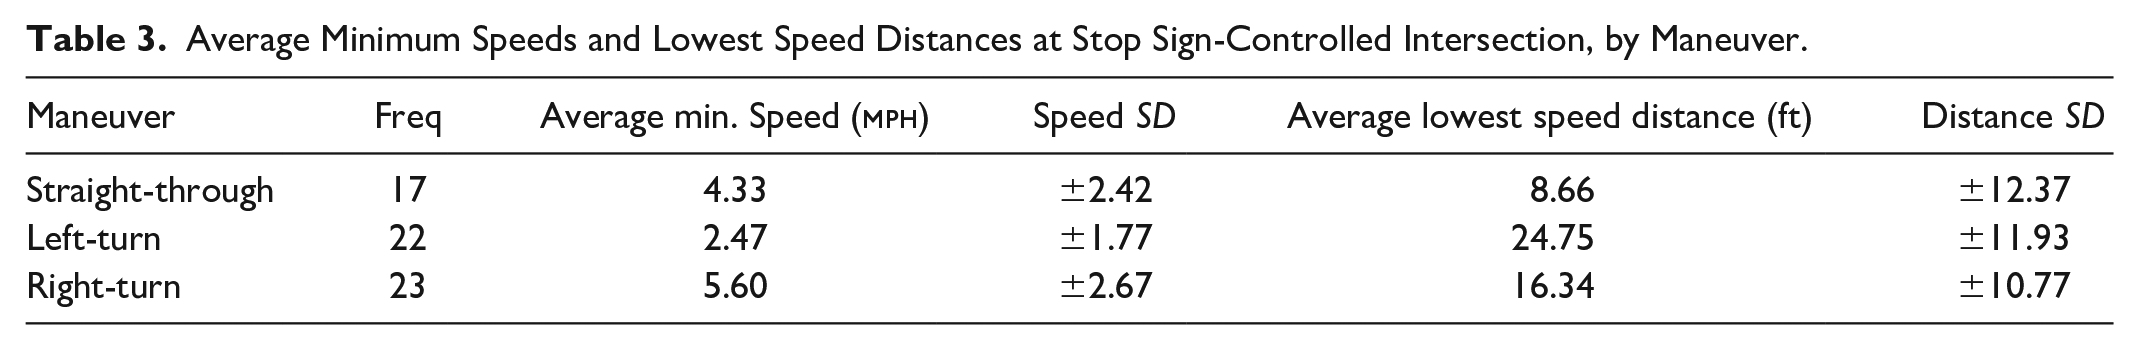
Average speeds and stopping distances were also analyzed based on whether drivers conducted a left-turn, right-turn, or traveled straight across the intersection (Table 3). Results show a difference between the speeds and distances of vehicles making a left-turn versus a straight-through maneuver (p < 0.05) as well as between vehicles making a left-turn versus a right-turn maneuver (p ≤ .05).
Average Minimum Speeds and Lowest Speed Distances at Stop Sign-Controlled Intersection, by Maneuver.
Regarding the potential relationship between stopping speed and distance, Intersection 2 resulted in drivers having overall greater encroachment at higher speeds; however, no strong conclusion could be made.
Discussion
The minimum speeds for non-zero stops of the vehicles approaching the intersections ranged from 0.4 to 12.2
Drivers are accustomed to navigating complex roadway scenarios at high speeds (i.e., changing lanes on an interstate road, entering/exiting highways, navigating sudden stops, and emergency situations). In the given study, the simple, low-risk environment encountered by the drivers may have led to a greater perceived cost of compliance (Wogalter et al., 1989; 1987).
Another factor to consider is the driver’s perceptions on appropriateness of the stop sign when they are extremely familiar with the area. Hendrick (2000) observed driver behaviors at two stop sign-controlled intersections when cross-traffic was absent. Of the two scenarios, one stop sign was perceived within the local community to be appropriate while the other was deemed unnecessary. Drivers were much more likely to stop at the “highly appropriate” stop sign (82%) compared to the “inappropriate” stop sign (37%).
The design of the stop-sign intersection may also be a contributing factor that affects drivers’ decisions as they approach the subject area. Higher encroachments were observed for Intersection 1, an intersection without a painted stop line. Duhn et al. (2020) assessed the impact of stop lines in increasing vehicle compliance at stop sign-controlled intersections. The research found no significant relationship between the presence of a stop line and crash occurrence; however, the presence of stop lines was found to reduce the lowest speed for vehicles that did not make a complete stop.
Each stop sign corresponds with a unique visual scene and potential obstructions, consisting of roadway, shrubs and trees, pathways, buildings, and other signage. The actions and behaviors of drivers at each stop sign is a result of the distinct cognitive environment, sensory cues, and roadway information available at a given time and place. Vehicle kinematics and driver behavior can and will vary amongst stop signs. At Intersection 1, it was observed that drivers approaching Stop Sign A encountered an elevated lawn to their right which would have obscured traffic approaching from their right (Figure 6). At Stop Sign B, it was observed that large trees to the right of the stop sign could have obstructed traffic approaching from the right (Figure 6).
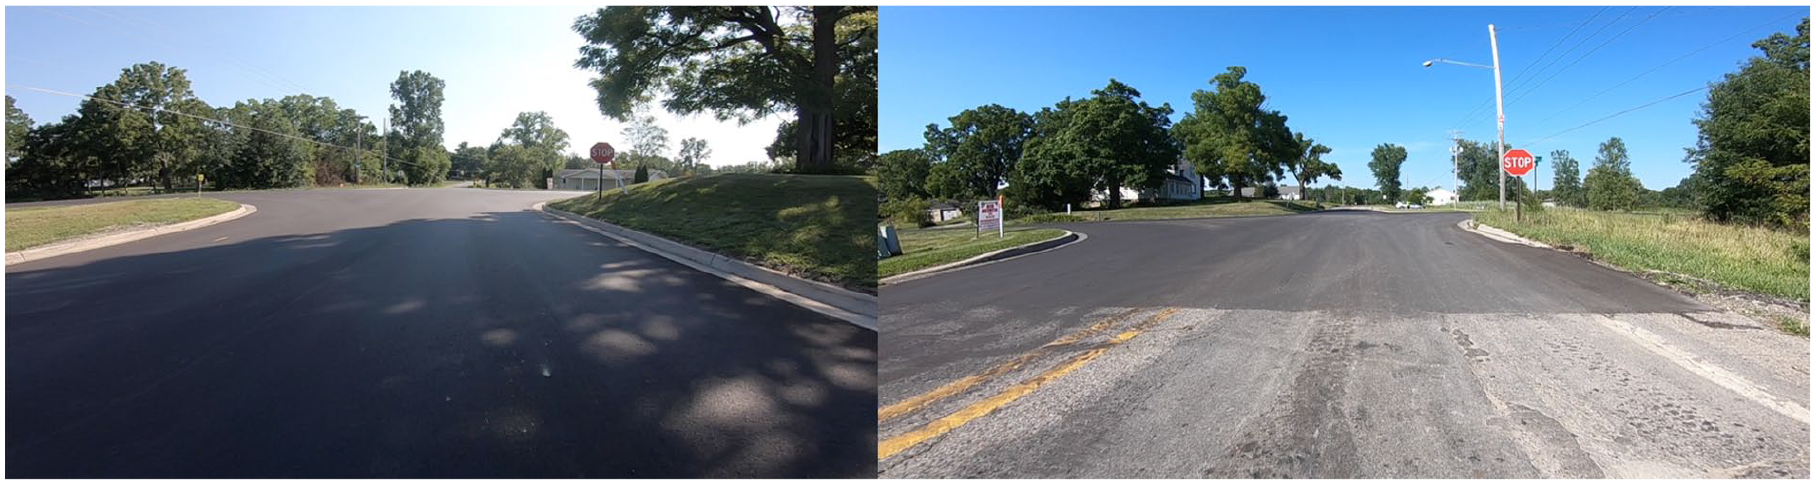
Elevated lawn to right of Stop Sign A (left) and tree cluster to right of Stop Sign B (right).
A line-of-sight analysis was conducted for location A and found that visibility of cross-traffic was maximized approximately 30 feet beyond the stop sign location. Results of this study show that average “lowest speed distance” was 29 feet beyond the stop sign, indicating that drivers did reach minimum speeds at the location of greatest visibility. Similar factors limiting sight lines at Stop Sign B could explain why drivers had significantly more encroachment at Intersection 1 compared to Intersection 2. Out of the four stop sign locations at Intersection 2, driver’s sight lines were most impacted due to a dense cluster of trees at the corner of Stop Sign D (Figure 7). This would have obscured traffic approaching from the right and left for drivers at Stop Sign D and C, respectively.
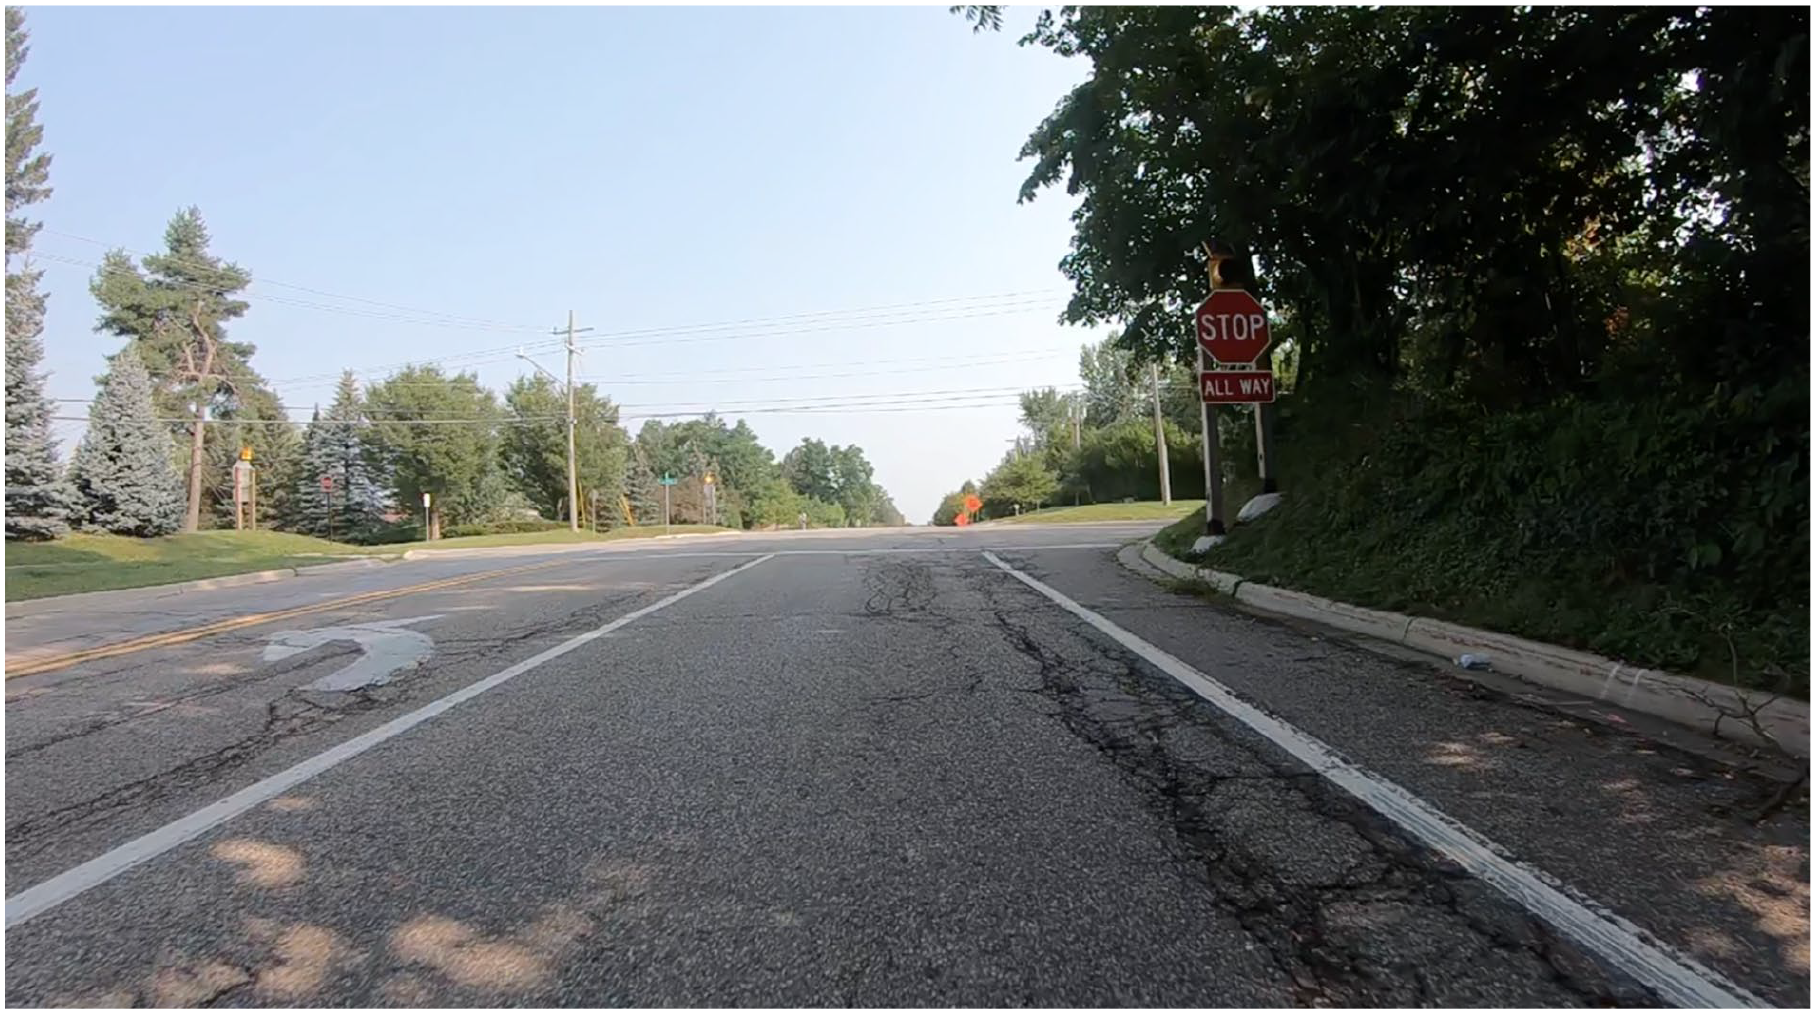
Tree cluster to right of Stop Sign D.
The results show that Stop Sign C did have the highest average encroachment and the lowest average minimum speeds. Studies have supported limited sight distances as a possible reason for vehicles exceeding the stop line when stopping or slowing. (Kolarik et al., 2020).
In this study, drivers overall reached lower speeds when conducting a left-hand-turn while exceeding the greatest distance beyond the required stopping point. From a human factors perspective, the issue of sight distances and sight line limitations may explain this observation. Drivers turning left must account for the greatest number of potential roadway conflicts. Turning left has greater statistical crash occurrence compared to right-hand or cross-through maneuvers (Choi, 2010). As a result, drivers turning left likely perceive the need to slow down and obtain a clearer view of the roadway.
Conclusion and Future Work
The aim of this study was to evaluate naturalistic driver behaviors through vehicle kinematics at stop sign-controlled intersections in the absence of cross-traffic. It was observed that drivers generally do not come to a complete stop and that the location of vehicles’ lowest speed often encroaches beyond the location of a stop sign or stop line and into the intersection. Human factors considerations based on the unique visual landscape are key to understanding driver behaviors at stop sign-controlled intersections.
The assessment of driver behaviors did not include observations to further assess whether the driver was distracted, inattentive, or careless, among other factors. Aerial footage of the vehicles was unable to capture contributing influences, such as if the driver was using their phone or interacting with passengers. The design of the study limited the ability to track drivers’ eyes and to evaluate which direction they were gazing as they maneuvered through the intersection. In addition, sight lines at each of the stop signs, aside from Stop Sign A, were not analyzed to determine if driver had sufficient visual field when appropriately stopped at the stop sign. To that end, a follow-up study was conducted where driver behaviors at stop signs were observed to determine where drivers stopped in relation to the nearest point of clear line of sight. For example, in one of the follow-up locations observed, drivers were required to encroach beyond the stop line in order to obtain a clear line of sight at the subject intersection. Preliminary results indicate that drivers are prone to elect to come to a stop at the point where they are able to assess a clear line of sight (even if that means going beyond the stop line). Drivers were observed to frequently creep forward and conduct two- or three-stop maneuvers prior to traveling through the intersection. These observations show that the complexity of the roadway environment and potential obstructions impact driver perceptions, behaviors, and vehicle kinematics at stop sign-controlled intersections.
Footnotes
Declaration of Conflicting Interests
The author(s) declared no potential conflicts of interest with respect to the research, authorship, and/or publication of this article.
Funding
The author(s) received no financial support for the research, authorship, and/or publication of this article.