
Abstract
Pain, especially chronic pain, is a complicated and subjective experience, threatening global healthcare as one of the most severe health problems. Traditionally, pain is assessed by Visual Analog Scale to indicate the pain intensity by the patient’s self-report, causing them to become biased by various psychosocial factors. In this study, we performed two distinct labeling methods to assess the pressure pain in Quantitative Sensory Testing and to differentiate healthy controls and chronic low back pain patients: time period labels and percentage timestamp labels. Physiological signals such as blood volume pulse and galvanic skin response were collected. The time period labeling method was to segment via fixed time windows. The percentage timestamp labeling method was to select the timestamp labels based on the percentage of the threshold or the tolerance time. Both methods demonstrate different advantages when visualizing the information of different pain states and different participant groups.
Introduction
Pain, especially chronic pain, is a complicated and highly personal experience, threatening global healthcare as one of the most formidable clinical challenges. In 2021, a significant proportion of the U.S. adult population, representing 20.9% or around 51.6 million people, suffered from chronic pain (Cohen et al., 2021). Within this group, a substantial subgroup of 17.1 million individuals (6.9%) were suffered with high-impact chronic pain (Rikard et al., 2023). This condition is not merely a source of discomfort and harm to those suffering; it impacts their quality of life and presents considerable social and economic challenges. In addition, the subjective nature of pain complicates its assessment and management, highlighting the critical need for objective methods in the diagnosis and treatment process.
The pain assessment is traditionally performed via the Visual Analog Scale (VAS) and the Verbal Rating Scale (VRS) (Hartrick et al., 2003; Jensen et al., 2003), indicating the participants’ pain intensity. These tools rely heavily on patients’ self-reported measures, which is a simple and subjective tool to measuring pain levels. However, the reliance on self-reporting presents limitations, particularly in cases where patients such as infants or stroke patients may have difficulty communicating their pain scenarios. Quantitative Sensory Testing (QST), particularly assessing pressure pain threshold and tolerance, offers a more objective and quantifiable approach to pain measurement (Edwards et al., 2005). Instead of verbally presenting their pain intensity on a scale of 0 to 10, participants provide the time when they feel the pain as a threshold and when they want to stop the pain as the tolerance. At the same time, the pressure value is also recorded as the objective assessment of pressure pain. QST can provide insights into the mechanical aspects of pain processing and aid in diagnosing chronic low back pain (Meints et al., 2019; Moscato et al., 2023).
Physiological sensors have significantly advanced the objective assessment of human states and characteristics (Zhu et al., 2022). In the pain intensity estimation, facial expression was used to estimate pain intensity levels by comparing three neural network models, and the highest performance was obtained by integrating personalized spatial-temporal information (Guo et al., 2021). Pupillometry data was applied to predict pain levels via a genetic algorithm with an artificial neural network classifier (Wang et al., 2022). Multimodality physiological classification outperformed the single modality physiological models (Lin et al., 2022). The team also examined the portability of the automatic pain estimation model in the mobile app and wearable sensors, and a COMPASS Application was developed and proved its performance using wearable sensors including electrocardiogram (Zhu et al., 2023).
The labeling method is one of the unforeseen problems in the pressure pain assessment field. Traditionally, researchers categorize pressure pain into two periods: threshold period as low pain and tolerance period as high pain, and develop the classification models afterward (Khan et al., 2023). However, the participants were exposed to gradually increasing pain instead of constant pain stimulus. In addition, different participants report different lengths of threshold and tolerance periods. This time variance needs to be addressed to match the pain label with the time period. Therefore, to assess the pressure pain between healthy controls and chronic low back pain (cLBP) patients, we performed two distinct labeling methods to assess the pressure pain states: time period labels and percentage timestamp labels. We also discussed the advantages and disadvantages of these two distinct methods in terms of assessing the pain states and the participant groups.
Methods
This study was approved by the Institutional Review Board (IRB) at Brigham and Women’s Hospital and was carried out from January 2022 to May 2022. Both healthy controls and cLBP patients were recruited to perform the QST pressure pain session in a clinical lab setting. Our work is to collect physiological data from participants, including blood volume pulse (BVP) and galvanic skin response (GSR) (Figure 1a). Pressure pain threshold and tolerance were assessed using a digital pressure algometer, which increases the pressure via a flat round transducer on a small skin area. The researcher increased the pressure pain gradually at a steady speed of ~1 lb./sec. Once the pressure pain stimulus began, the pressure value and the timestamp were first recorded when the participant reported the onset of pain as pain threshold and was terminated when the participant reached their maximum pain tolerance as pain tolerance. Participants performed the QST pressure pain session twice. In each session, four trials were performed, including the left forearm, the right forearm, the left trapezius, and the right trapezius.
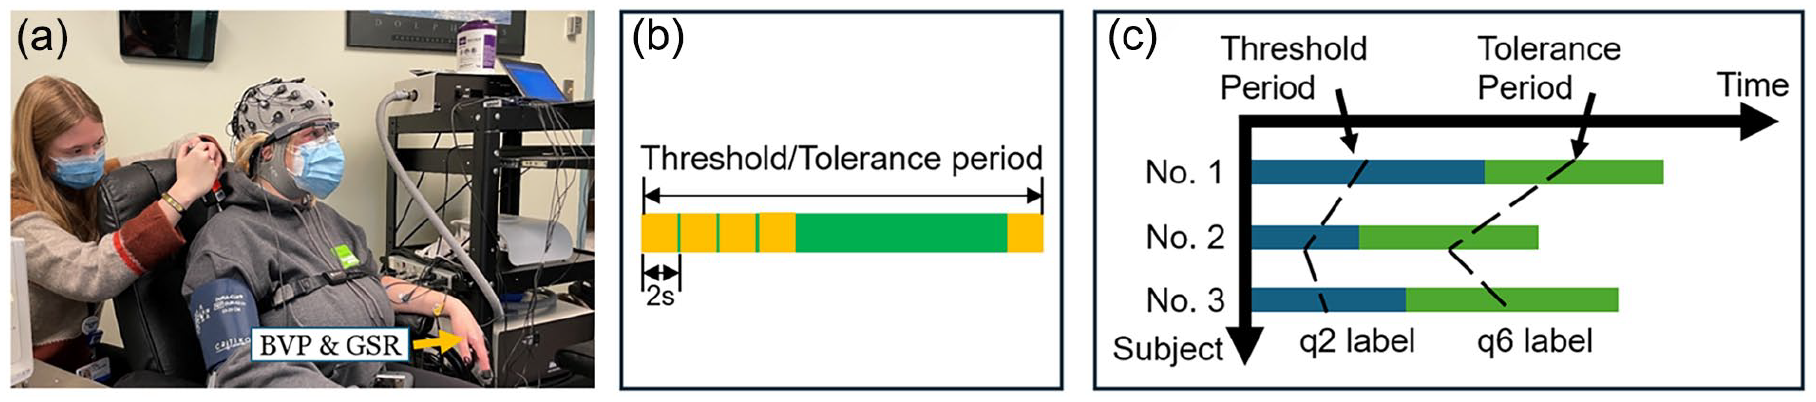
(a) Pressure pain experiment, (b) schematic diagram of the time period labeling method, and (c) schematic diagram of percentage timestamp labeling method.
We synchronized physiological (BVP, GSR, EMG, and RR) data by resampling them to 50 Hz, filtering, and employing linear interpolation methods to fill in any missing gaps. BVP signal was filtered via a fifth-order Butterworth band-pass with [0.5, 1.2] Hz as cut-off frequencies. GSR signal was filtered via a fifth-order Butterworth band-pass with [0.1, 1] Hz as cut-off frequencies. In addition, two additional features were extracted from the BVP signal: heart rate and Root Mean Square of Successive Differences (RMSSD) using the NeuroKit2 package in Python (Makowski et al., 2021). Statistical features, such as mean and standard deviation were then generated from each time series signal.
The time period labeling method was to segment the threshold and tolerance periods via fixed 2-second time windows (Figure 1b). The percentage timestamp labeling method was to select the timestamp labels based on the percentage of the threshold or the tolerance time, and the corresponding physiological features were generated within a fixed 2-s time window ahead of the selected timestamps (Figure 1c). We label the 0%, 25%, 50%, and 75% of the threshold period as “q0,” “q1,” “q2,” and “q3,” respectively. Similarly, we label the 25%, 50%, and 75% of the tolerance period as “q5,” “q6,” “q7.” The threshold and tolerance timestamp were labeled as “Th” and “Tol.” A 3-s after tolerance was labeled as “Tol_post.”
A 2-s fixed time window was selected for both labeling methods. In assessing the time period labeling method, a boxplot comparison with a pairwise Mann-Whitney U test was assessed. In assessing the percentage timestamp labeling method, a mean line plot and error bar plot comparison were investigated between different percentage timestamp labels. The error bar was computed based on 95% of the confidence interval around the mean. A pairwise Mann-Whitney U test was assessed between participant groups at each time label.
Results
Initially, 25 individuals were evaluated for participation, but one individual was not included due to scheduling conflicts. This resulted in recruiting 24 participants, consisting of 16 females and 8 males, including 17 healthy controls (mean age: 28.8 ± 13.1 years old) and 7 patients with cLBP (mean age: 44.4 ± 14.5 years old). The time variance between pain threshold and pain tolerance sessions is high, with standard deviations (STD) of 3.74 and 5.34, respectively, compared to their mean value of 6.86 s and 13.99 s.
Figure 2a, c, e, and g show the boxplots of physiological features using the time period labeling method when comparing healthy controls and patients and comparing pain threshold and tolerance. As Figure 2a, c, e, and g, show, heart rate, RMSSD, GSR mean, and STD features show significant differences when comparing healthy controls and patients in both pain threshold and pain tolerance sessions. However, there is no significant difference when comparing pain threshold and tolerance in the same participant groups. Only GSR STD feature shows the difference when comparing pain threshold and tolerance in the participant group.
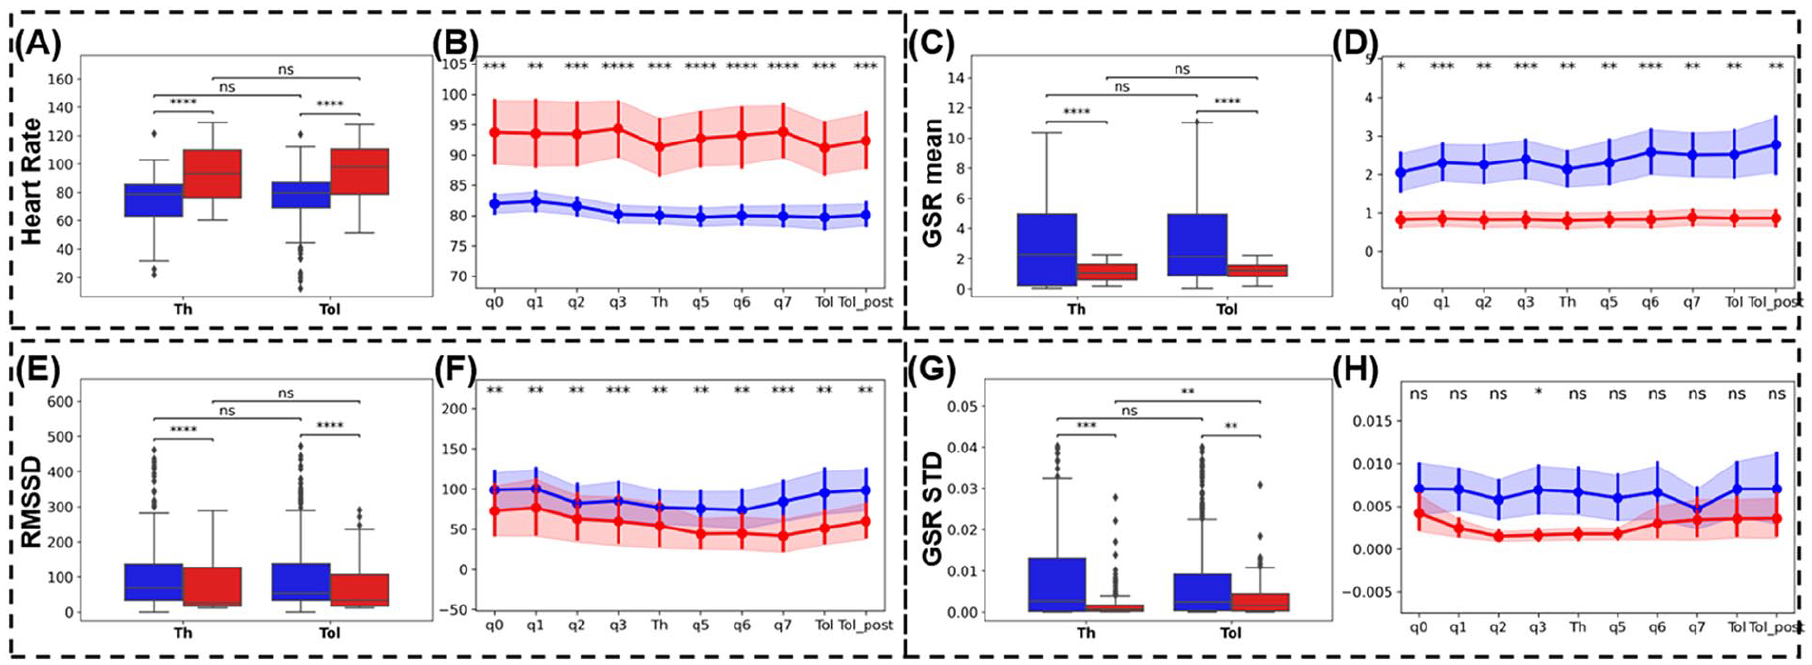
Two labeling methods were applied to different features (heart rate (a) and (b), GSR mean (c) and (d), RMSSD (e) and (f), GSR STD (g) and (h)). Blue represents healthy controls, red represents cLBP patients. The time period labeling method was applied to (a), (c), (e), and (g) and demonstrated in boxplots. The time period labeling method was applied to (b), (d), (f), and (h) and demonstrated in line charts with error bars. The error bar was computed by 95% confidential intervals on the mean. The percentage timestamp labeling method was applied to (b), (d), (f), and (h).
Figure 2b, d, f, and h show the line and error bar plots of physiological features using the percentage timestamp labeling method when comparing healthy controls and patients in “q0,” “q1,” “q2,” “q3,” “Th,” “q5,” “q6,” “q7,” “Tol,” and “Tol_post” labels. From Figure 2b, d, and f, we find that heart rate, RMSSD, and GSR mean features show significant differences in all percentage timestamp labels when comparing healthy controls and patients. As for the GSR STD feature, only the “q3” label shows a significant difference, while the other labels do not show such a difference. Additionally, the error bars demonstrate the individual variance in physiological signals at different percentage timestamps. The variance in patient groups is much higher than the healthy control groups for the heart rate feature, while for the RMSSD feature, these two groups show similar error bars across all timestamps. For the GSR feature, the healthy control group shows a higher variance than the patient group. For the GSR STD feature, the variance in the healthy control group remains the same, but the variance in the patient group drops largely near the “Th” label, but increases again between “Th” and “Tol_post” labels.
Discussions and Conclusions
This study implemented a novel labeling method to assess pressure pain via physiological signals among patients with and without chronic low back pain. The time period labeling method demonstrates significant differences between healthy controls and patient groups in pain threshold, and pain tolerance periods. However, this labeling method doesn’t show the difference in comparing pain threshold and pain tolerance period. The percentage timestamp labeling method shows such an advantage in explaining the differences in pain threshold and pain tolerance period. First, this novel method normalizes the time length variance to the same percentage timestamp labels. Second, this novel method shows the overall trend in the pain threshold and pain tolerance period. Third, the error bar shows the individual variance at different timestamp labels, indicating how the individual variance develops over time. Both labeling methods provide insightful information comparing different pain states and between different participant groups.
In general, the objective assessment methods need to be tailored to different pain stimuli scenarios. For example, the traditional time period labeling method is appropriate to the scenarios where participants need to self-report their pain level at a fixed time slot (Lin et al., 2018; Wang et al., 2020; Zheng & Lin, 2022). But for the scenario without a fixed time slot where participants can self-report at any given time, the time period labeling method needs to be tailored based on the different reporting times. A percentage timestamp labeling method shows the potential but needs to be validated in the future study. Future studies should examine additional physiological signals such as respiration rate, electromyography, pupillometry, and electroencephalogram. These findings could lead to objective diagnostic tools and treatment approaches, moving beyond the limitations of self-reported pain assessment methods.
Footnotes
Declaration of Conflicting Interests
The author(s) declared no potential conflicts of interest with respect to the research, authorship, and/or publication of this article.
Funding
The author(s) disclosed receipt of the following financial support for the research, authorship, and/or publication of this article: This work has been financially supported by a U.S. National Science Foundation project entitled “Novel Computational Methods for Continuous Objective Multimodal Pain Assessment Sensing System (COMPASS)” under the award #1838796, #2326971.