
Abstract
We investigated how attention-demanding aural and visual discrimination tasks attenuate visually-induced self-motion (vection) and how task accuracy and response time are affected by experiencing various levels of vection-inducing motion in a virtual environment. Seventeen seated observers were presented simulated motion at various virtual camera speeds from stationary to 15 m/s in a straight virtual corridor through a Vive Pro Virtual Reality headset as they performed aural, visual discrimination tasks, or no task at all. Observers generally perceived less vection at all motion levels when they performed visual discrimination tasks compared to when they had no task. Increased vection was associated with reduced accuracy on the visual task and increased response time to the aural task. These results suggest that the amount of vection perceived in virtual reality simulators can be attenuated when users perform attention-demanding tasks related to visual processing, and, conversely, vection-producing motion can affect performance in attention-demanding tasks.
Introduction
Virtual reality (VR) renders a wide range of realistic, abstract, or fanciful virtual environments (VEs) with compelling presence and immersion (Souza, et al., 2022; Witmer, 1998). It has long been argued that presence and immersion lead to more engaging entertainment experiences and importantly more effective simulation and training for the military and other armed forces (Oliver, 2022), for vehicle driver training, aviation, space exploration (Guthridge et al., 2023; Hille, 2020; Taheri et al., 2017), and with reduced risk for dangerous tasks and environments (Landeck, et al., 2023). VR can also simulate compelling self-motion also known as vection through the virtual environment based on visual motion (optic flow) presented in typical wide field of view displays. Strong vection in stationary observers may even lead to more compelling and enjoyable experiences (Riecke et al., 2006). Vection may also produce an undesirable set of side effects known as visually induced motion sickness (VIMS) characterized by symptoms including dizziness, eyestrain, stomach symptoms and headache (Keshavarz et al., 2014).
In Fujii et al. (2019), vection in VR was found to increase with both motion speed and framerate, but not with motion blur. Seno et al. (2011) reported that vection made the perception of return time of travel shorter than the perception of outward time of travel and affected the magnitude of random numbers that people generated. Seno et al. (2011) concluded that induction of vection requires attentional resources because they found that vection strength was weakened or inhibited when observers performed rapid serial visual presentation (RSVP) and multiple-object-tracking (MOT) tasks. As VR simulations have content with various forms of motion and require users to respond to visual and aural stimuli, prompts and commands, could it also be possible that simulated motion and the resulting vection affect how users perform attention-demanding tasks?
We therefore investigated the effects that simulated motion has on the time taken for observers to respond to attention-demanding visual and aural tasks and the accuracy in performing those tasks. We also investigated the effects that performing such visual and aural tasks in VR simulations may have on the strength of vection that observers may experience. The findings in this work contribute to the current body of knowledge about attention and vection in VR and inform VR simulator designers and content creators about the effects of simulated motion on users’ attention.
Method
Participants
Seventeen observers ranging from 18 to 27 years participated in the experiment. Ten were compensated with course participation credits while others were paid a $15 CAD compensation. Criteria for participation was scoring at least 80% in a listening test where they indicated the number of distinct pure tones played, and successful completion of stereovision acuity tests, where they identified various shapes presented as random dot stereograms (Julesz, 1971). The Office of Research Ethics of York University, Toronto, Canada approved the study.
Simulation
The virtual space in Figure 1 is a 3D model of an 800 m office hallway developed in Autodesk 3Ds Max. It had eight 100-m length adjoining sections linked by sliding doors. Dividing the hallway into adjoining sections maintained a high-quality rendering free from aliasing effects of very long distances. A 1 × 0.5 m semitransparent screen positioned 1.5 m in front of the observer and 1.5 m from the floor served as an instruction board and user interface (UI), displaying appropriate prompts for participants, and allowing them to interact with the simulation through a handheld Vive controller. Stimuli used in the visual discrimination task were 126 × 126-pixel uniform grayscale PNG images with grey levels of 20, 60, 100, 140, 180, and 200, rendered to a 20 × 20 cm image container on the screen. Audio stimuli for aural discrimination tasks were 0.4 s duration, 330, 350, 370, 390, 410, 430, 450, and 470 Hz single-frequency tones sampled at 44.1 kHz and stored as uncompressed (.wav) files.
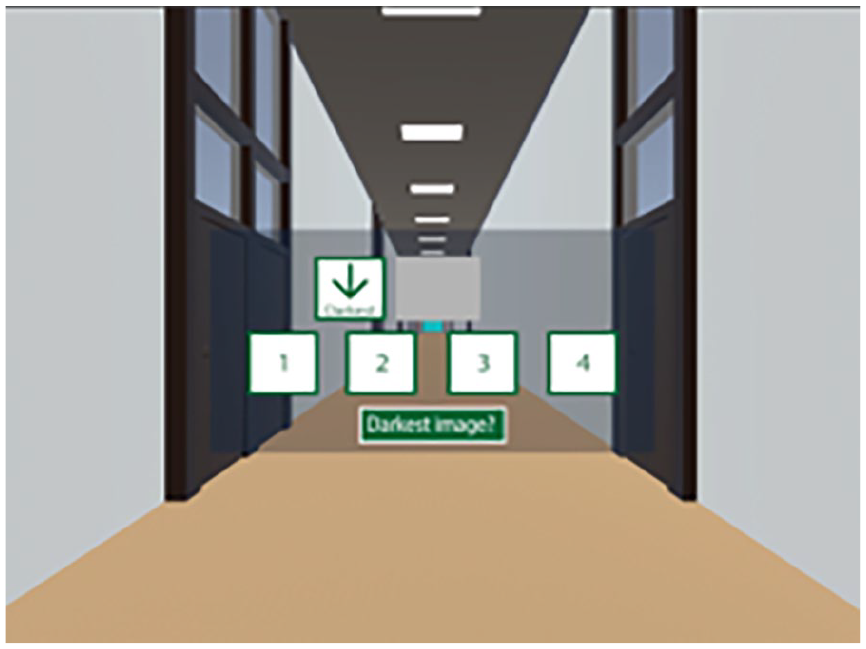
100-m virtual office hallway and the semitransparent UI with task information for the observer.
Apparatus
The stimuli and experiment workflow were implemented in a simulation on the Unity 3D game engine version 2018.4.19f1 running on a Windows 10 Intel Pentium i7 quad core PC with an Nvidia 2080 GPU. The simulation was rendered using an HTC Vive Pro VR headset delivering visual and aural content at 60 fps. Observers responded to prompts and tasks with the trigger button of their handheld Vive controller.
Procedure
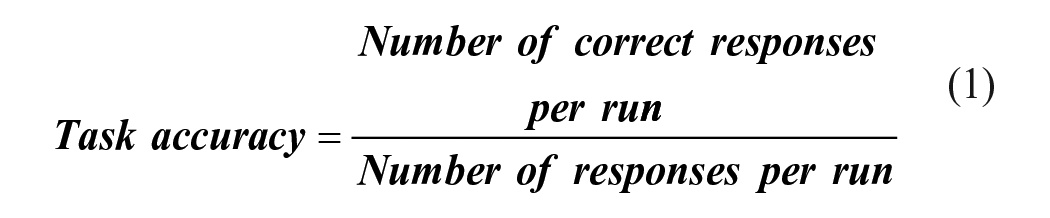
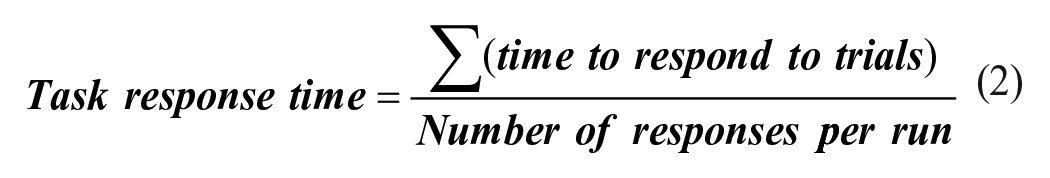
Participants wore the VR headset and sat in a chair, with the controller in one hand and headset earphones over their ears. They were administered the listening and stereovision acuity tests and shown a demo of the moving virtual environment to have them experience and understand vection. Participants also performed four trials of each of the visual and aural discrimination tasks in a practice session in the stationary virtual environment. For each trial of the aural discrimination task, four different single frequency tones (see Simulation) were presented in an unpredictable sequence to the participants. Participants were then prompted to select the index (1, 2, 3, or 4) of either the highest or lowest pitched tone with their controller. The period of silence (inter-tone interval) between one tone and the next was 0.4 s leading to a total presentation time of 2.8 s for the four tones on a given trial. Each trial in the visual discrimination task, like the aural task, had a sequential presentation of four stimuli. Four distinct greyscale PNG images were presented in sequence, and participants indicated the index of either the brightest or darkest image displayed. The duration of display of each image and off-time between each display was 0.4 s for a total presentation time of 2.8 s. The attribute (darkest/brightest grey level or lowest/highest pitch) that participants were instructed to choose was displayed as a prompt above and below the option buttons throughout the trial as shown in Figure 1. The experiment was divided into 11 runs of trials with combinations of the following conditions in a factorial design: (a) Virtual camera speed at 0 (no motion), 5, 10, and 15 m/s, and (b) task type namely, no task, aural discrimination task, and visual discrimination task. We excluded the redundant no-task-no-motion condition from the set of runs. Each run lasted 40 seconds, with forward motion through the virtual environment simulated by the motion of the virtual camera. The first 5 s simulated constant acceleration from rest to maximum speed for the run (0, 5, 10, or 15 m/s), constant speed for the next 30 seconds, then deceleration at the same rate for the final 5 s. During each run of trials observers completed approximately 5 trials of the specified task. There was a random ordering of the 11 runs for each participant. At the end of each run participants indicated with the controller the intensity of vection they experienced on a scale of 0 = no vection to 10 = very strong vection similar to Fujii & Seno (2020). Task Accuracy, and Response Time (average time taken to respond to task questions) were also calculated (equations (1) and (2)). All runs are shown in Table 1.
Codes for 11 Experiment Runs Formed From 3 Task Types and 4 Virtual Camera Speeds.
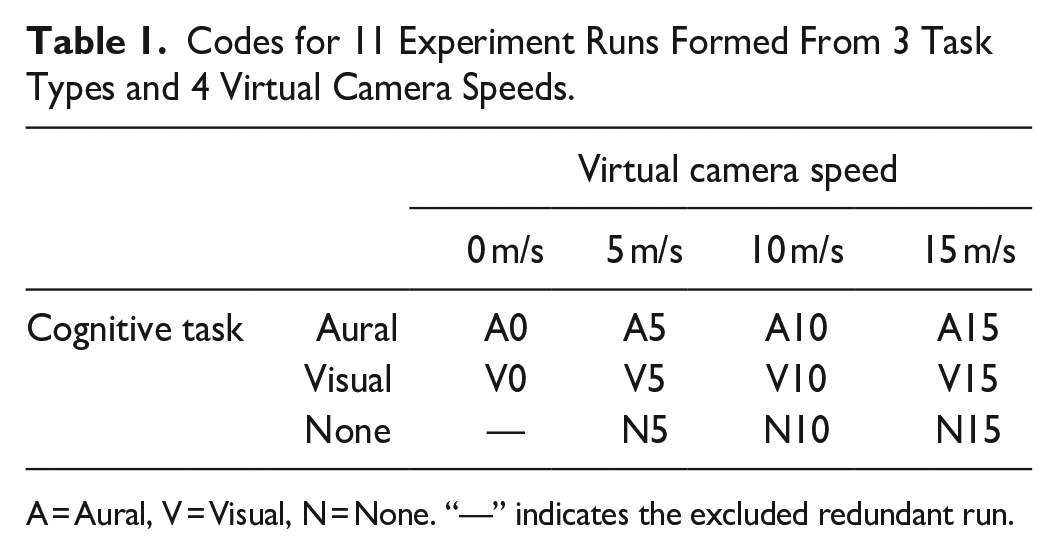
A = Aural, V = Visual, N = None. “—” indicates the excluded redundant run.
Results
Results of the repeated-measures ANOVA (rANOVA) analysis on data collected from the 17 participants are presented in the following subsections. The level of statistical significance (Tenny & Abdelgawad, 2023) adopted for null-hypothesis testing was .05. Significant effects among various means observed were further analyzed with Fisher’s Least Significant Distance (LSD) post-hoc test (Meier, 2006). Partial Eta Squared (η p 2) effect sizes (Lakens, 2013) are also reported for the main and interaction effects. Relationships between vection intensity and the two other response variables of task accuracy and task response time were analyzed using a Linear Mixed Effect Regression model.
Effect of Simulated Motion and Task Type on Vection
Graphs of average vection intensities plotted against virtual camera speeds and task type are shown in Figures 2 and 3. There was a significant main effect of virtual camera speed on vection intensity (F [2, 24.479], p < .001, η p 2 = .605) and a significant main effect of task type on vection intensity (F [2, 3.616], p = .038, η p 2 = .184). The interaction effect between virtual camera speed and task type on vection intensity illustrated in Figure 4 was not significant (F [4, .916], p = .460, η p 2 = .054). Pairwise comparisons of average vection intensities across virtual camera speeds revealed significant difference in vection intensities at virtual camera speeds of 5 and 15 m/s (p < .001, 95% CI [−2.395 −1.213]) and 10 and 15 m/s (p < .001, 95% CI [−1.698 −0.812]). Pairwise comparisons of average vection intensities across no, aural and visual tasks showed significant difference in vection intensities between only no task and visual task (p = .025, 95% CI [0.147 1.892]). As expected, vection was typically not reported for the stationary trials.
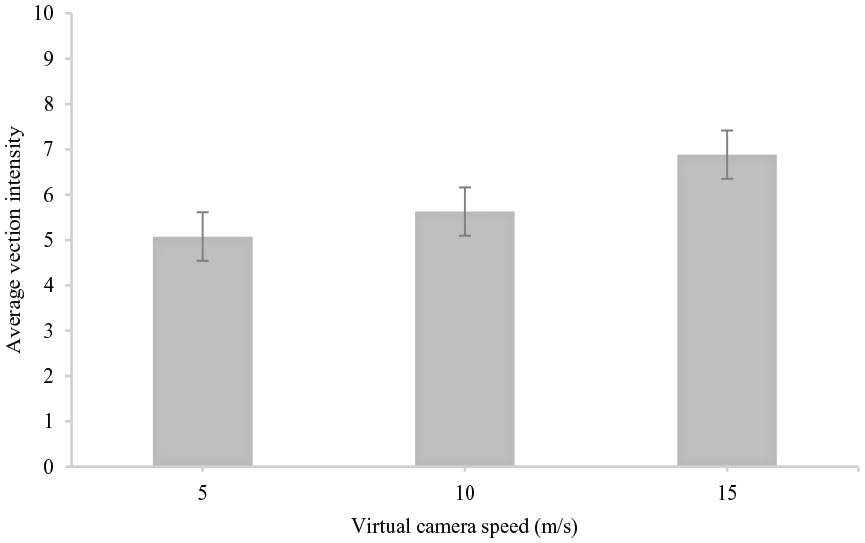
Average vection intensity plotted against simulated camera speed. Data collapsed across task types. Error bars represent ±1 standard error of the means.
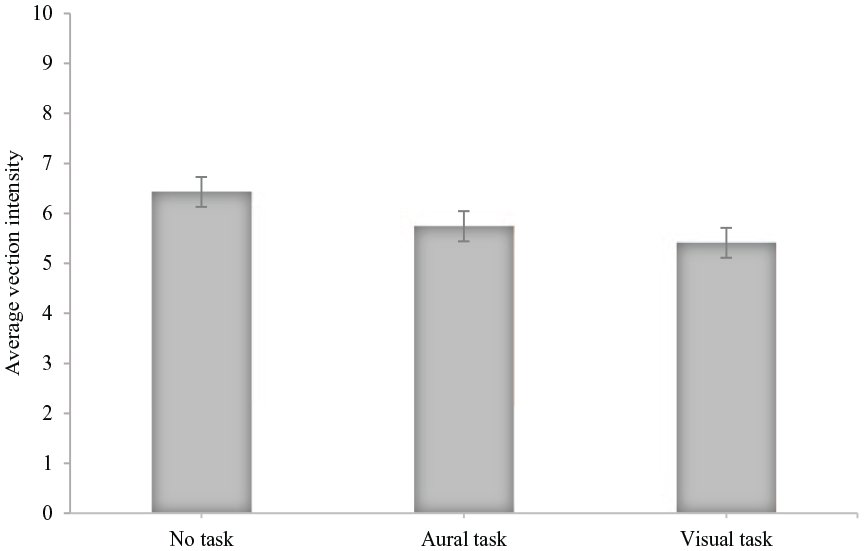
Average vection intensity plotted against task type. Data collapsed across virtual camera speeds. Error bars represent ±1 standard error of the means.
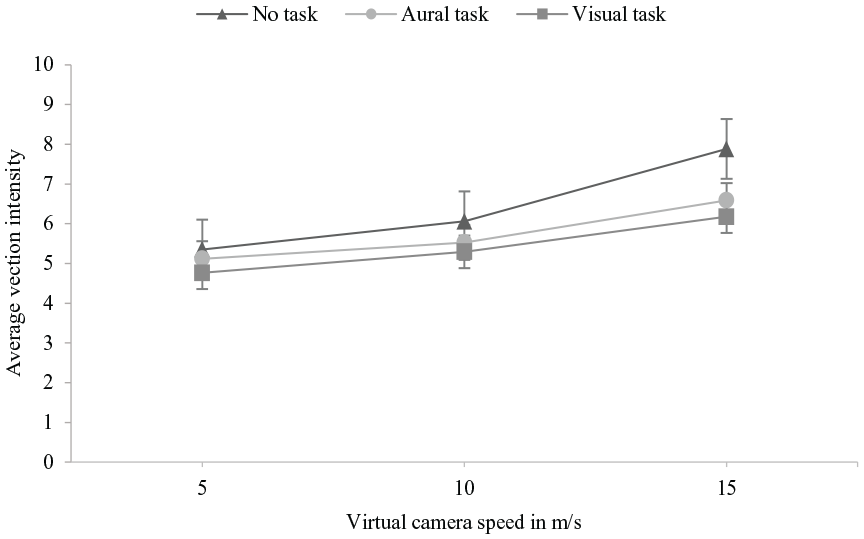
Interaction effect of virtual camera speed and task type on vection. Error bars represent ±1 standard error of the means.
Effect of Simulated Motion and Task Type on Task Accuracy
The graphs in Figures 5 and 6 show average task accuracy plotted against virtual camera speed and task type. There were no significant main effects of simulated speed (F [2, 2.319], p = .115, η p 2 = .127) or task type (F [1, .660], p = .428, η p 2 = .040) on task accuracy. There was also no significant interaction between simulated speed and task type on task accuracy (F [2, .164], p = .850, η p 2 = .010).
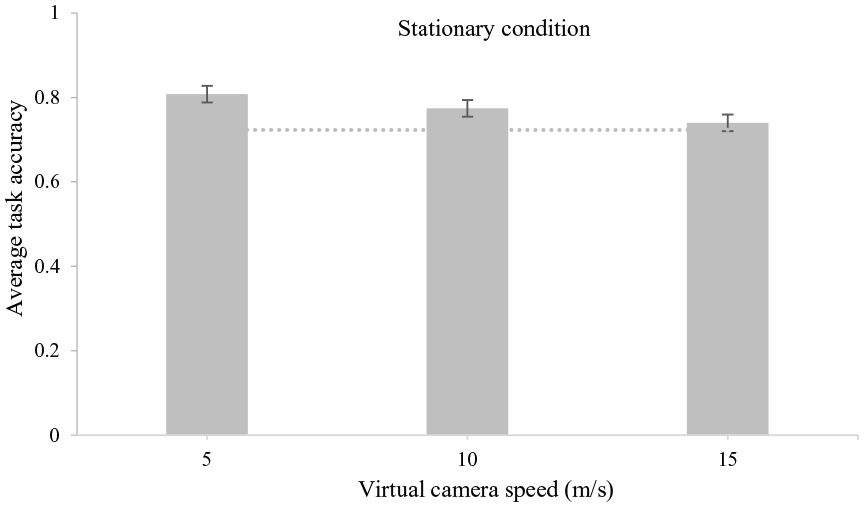
Average task accuracy plotted against virtual camera speeds. Data collapsed across task types. Error bars represent ±1 standard error of the means. The dotted line shows average accuracy for the stationary condition.
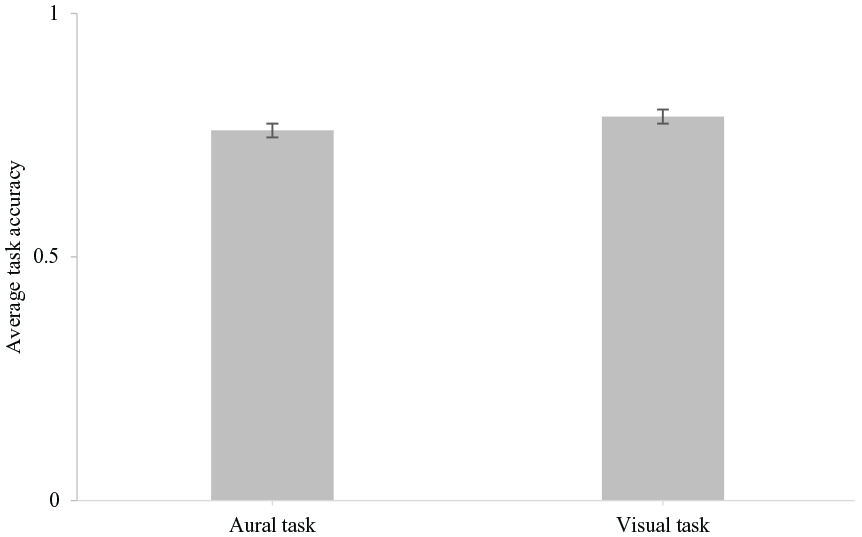
Average task accuracy plotted against task type. Data collapsed across virtual camera speeds. Error bars represent ±1 standard error of the means.
Effect of Simulated Motion and Task Type on Task Response Time
Plots of average task response times against virtual camera speeds and task type are shown in Figures 7 and 8. We performed an rANOVA using polynomial contrasts for the speed. Main linear effect of speed was significant (F [1, 16] = 9.98, p = .006) but there was no significant quadratic effect (F [1, 16] = .106, p = .749). There was a significant main effect of task type with mean aural response times being longer than visual (F [1,16] = 20.814, p < .001). The interaction between speed and task type was significant for the linear term (F [1, 16] = 4.843, p = .043), but not for the quadratic term (F [1, 16] = .005, p = .943). The interaction showed a linear increase for the aural task but a flatter speed dependence for the visual task in Figure 9. The difference between the aural and visual task response times was significant (p < .001, 95% CI [.251 .6880]). Pairwise comparisons of average response times across virtual camera speeds showed a significant difference in response times at virtual camera speeds of 5 and 15 m/s (p = .006, 95% CI [−.411 −.081]).
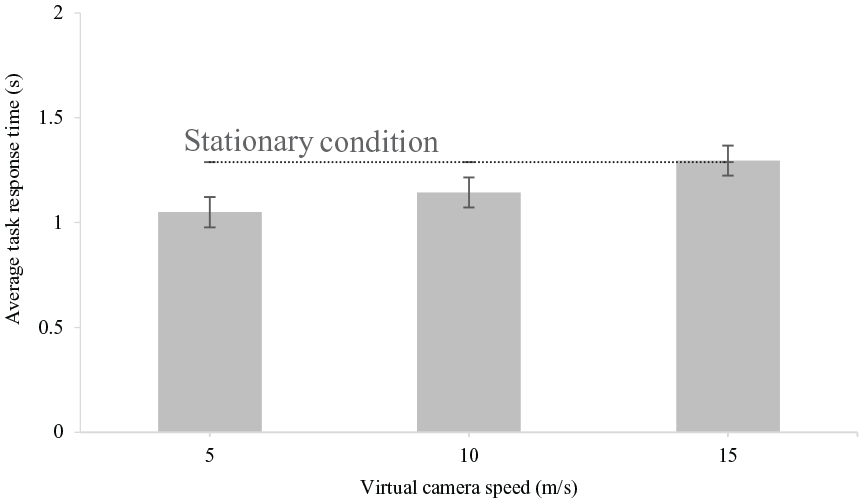
Average task response time plotted against virtual camera speed. Data are collapsed across task type. Error bars represent ±1 standard error of the means. The dotted line shows average task response time for the stationary condition.
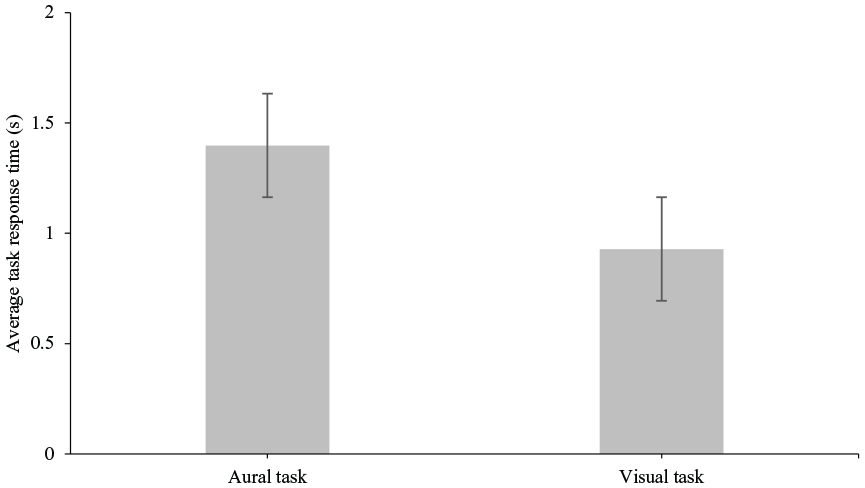
Average task response time plotted against task type. Data are collapsed across virtual camera speeds. Error bars represent ±1 standard error of the means.
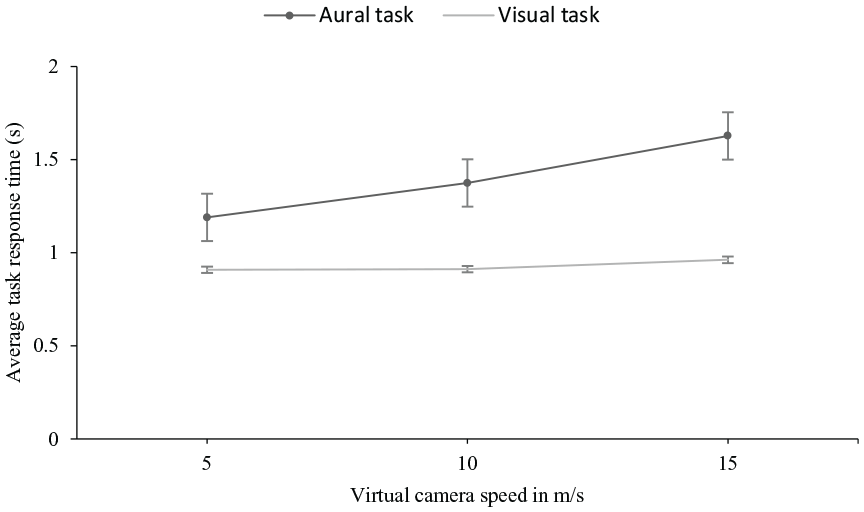
Interaction effect of virtual camera speed and task type on task response time. Error bars represent ±1 standard error of the means.
Relations Between Vection and Task Performance
Average task accuracy of participants was weakly related to vection ratings for the visual but not the aural task. Linear mixed-effect modelling of the relationship between task accuracy and vection was negative and significant for the visual task (t [27.16] = −2.70, p = .012), but was not significantly different from zero for the aural task (t [38.55] = −1.18, p = .244).
The relationship between the log of response time with vection was not significant for the visual task (t [29.87)] = .424, p = .675) but was positive and significant for the aural task (t ([48.87] = 2.47, p = .017). Thus, aural and visual task performance both degraded (response time increased and accuracy decreased, respectively) with increase in vection but the effect was very small.
Discussion
The effects of the speed of simulated motion in VR content on the intensity of vection experienced by participants in this study agrees with findings in previous studies (e.g., Fujii et al., 2019; Keshavarz et al., 2019; Landeck et al., 2023). But unlike these studies where participants observed optical flow without performing any attention-demanding task, we have shown here that stimulus motion speed significantly affects self-motion perception even when observers have attention-demanding tasks to perform. Researchers have typically been interested in vection as the dependent variable—its objective measures, functional significance, and neural bases (Palmisano et al., 2015), its benefits (Riecke et al., 2012), and problems typified by its relationship with VIMS (Keshavarz et al., 2015; Kuiper et al., 2019). Like Seno et al. (2011), we showed that average magnitude of vection was significantly reduced when participants did a visual attention-demanding task, but the attenuation was not significant when they performed the aural attention-demanding task. Together, these results show that the intensity of self-motion experienced by stationary observers of VR content with compelling motion can be reduced by having them perform attention-demanding visual tasks. As vection is processed by attentional resources related to motion and spatial processing, further attentional loading on resources responsible for motion and spatial processing weakens it. There was no measurable effect of vection ratings on aural task performance. This absent or weak effect may reflect the partial independence of attentional resources across sensory modalities (Ersin et al., 2021; Kahneman, 1973). It would be interesting to test this hypothesis using auditory evoked vection (Väljamäe, 2009). Designers of VR experiences should be aware of the reciprocal relationship between visual vection and visual attention. Visual attention-demanding tasks could be used where possible in VR simulators to either reduce vection and potentially VIMS or increase observers’ tolerance to these sensations. Our findings suggest that having aural discrimination tasks alone may not be as effective for this purpose as having visual tasks in these simulators. The overall cognitive and loading effects of motion and visual and aural attention-demanding tasks, and tasks delivered in other modalities on users of these systems should be studied to yield optimal results for users’ benefit.
Increase in response times to the audio task with increasing speeds likely resulted from significant unattenuated effects of VR content motion interfering with participants’ attention to aural discrimination. A similar effect of simulation speed on peoples’ delayed response to batting a VR baseball was reported in Rolin et al. (2019). While the response time dependence on vection appears to be only present in the aural but not visual task, further research with a larger number of participants or range of vection responses could confirm whether the effect of speed on response time differs by sensory modality. We opine that the increased task response times during stationary conditions indicated in Figure 7 may have resulted from participants inadvertently waiting for leading motion cues to start their tasks. The possible cuing effect of motion on people’s attention to tasks in mixed stationary and non-stationary conditions will need further investigation.
The non-significant difference between aural and visual task accuracies over levels of simulated motion suggests that changing the levels of motion in VR environments on its own may not cause significant change in observers’ accuracies in such tasks. The significantly longer time taken by participants to respond to aural than visual discrimination tasks in the presence of VR motion suggests that the aural task placed significantly greater cognitive load on participants. VR simulator designers and administrators should therefore carefully consider the types of stimuli used in their simulators to better understand potential response delays that such VEs could induce in their users. Such effects for example could affect timely responses and situational awareness of operators immersed in dynamic VEs while performing similar tasks. None of the participants in this study reported any undesirable VIMS symptoms before, during, or after the experiment.
Conclusion
In this work we used motion in VR to induce the sensation of self-motion (vection) in stationary observers. The intensity of the self-motion reported by observers varied directly with the amount of motion (the speed of the virtual camera) transporting viewers through the virtual environment. The intensity of self-motion experienced by observers in moving VR was significantly reduced when they performed visual attention-demanding tasks suggesting that visual processing resources are shared between the normal VR scene and the visual task. This reduction in perceived self-motion while observers performed the aural task was smaller and not significant. Compelling motion producing vection was also found to affect performance in attention-demanding tasks. These findings will be helpful for designers of VR simulators to create systems that enhance user comfort with sustainable cognitive load and situational awareness, and free from VIMS. Further research will investigate the role of motion cues in VR in delaying task responses and comparing task performance in VR versus conventional 2D displays.
Footnotes
Declaration of Conflicting Interests
The author(s) declared no potential conflicts of interest with respect to the research, authorship, and/or publication of this article.
Funding
The author(s) disclosed receipt of the following financial support for the research, authorship, and/or publication of this article: This work was supported in part by funding from the Innovation for Defence Excellence and Security (IDEaS) program from the Canadian Department of National Defence (DND). Any opinions and conclusions in this work are strictly those of the author(s) and do not reflect the views, positions, or policies of - and are not endorsed by - IDEaS, DND, or the Government of Canada.