
Abstract
As advanced automated systems become more complex, there is a greater need to analyze the difficulty of human-automation coordination. We developed a novel visual analytics tool to evaluate human-automation coordination by examining the relationship between projection, explanation (retrojection), and the understanding of current events through time. The What’s Next Diagram visualizes demands on human sensemaking as operators answer Wiener’s key automation surprise question: what will automation do next. The tool can assess whether operators can answer the question directly and quickly given the design and architecture of human-automation systems. It can be used as a model of multi-agent coordination, as a tool for post-mortem analysis, or an aid for design. We illustrate how the tool can be used to identify system requirements for anomaly response in the aviation domain.
Keywords
Introduction
Studies of human-automation interaction have shown that, generally, humans and automation together can perform better than either counterpart alone (National Academies of Sciences, 2022). However, for effective collective joint performance to be realized, humans and automated systems need to be able to coordinate their activities in dynamically changing situations (Johnson & Vera, 2019). The human’s perspective on managing automated systems is described well by the questions that people typically ask themselves when interacting with automated systems, first coined by Earl Wiener in 1989 and later expanded into a more elaborate set by Sarter and Woods (1995): (a) What is automation doing now? (b) Why did it do this? (c) What will automation do next? (d) How can I get automation to do what I want or need?
These questions illustrate how managing automated systems involves continuous work to make sense of ongoing events and automation behavior, to look back in time to find explanations for (mis)behavior, and to look forward in time to anticipate what is to come. These processes of sensemaking, retrojection (explanation), and projection are fundamental to synchronizing one’s own activities with those of automated systems and with evolving events or processes in the environment (Hoffman & Klein, 2017). Projecting what will happen next given one’s current understanding of the situation (“projection of future status”) is considered the highest level of situation awareness (Endsley, 1995, p. 37). The questions also illustrate how breakdowns in coordination can occur when design characteristics of automated systems obscure or otherwise make it difficult for people to look ahead, leading to well-documented issues such as automation surprises and bumpy transfers of control (Sarter et al., 1997).
Taking advantage of advances in autonomous capabilities results in the delegation of more decision-making/action authority to automated systems. In general, field experience and research show that the more authority and autonomy automated systems have, the higher the need for them to work collaboratively with humans (Johnson & Vera, 2019). To support the design and evaluation of new systems for their ability to coordinate with human problem holders, we developed a new event-based visual analytics tool (Potter & Woods, 1991; Christoffersen et al., 2007). This tool can be used to analyze coordination between human and automated systems through time, and identify how design features of automated systems support or hinder the ability of humans to maintain awareness of system behavior. The tool directs analysis of two inter-related temporal flows: how automation is acting to control processes over time given how the automation is configured and authorized to act, relative to how operators understand what the automation will do next given what they believe about how the automation is configured, what events have occurred and what maneuvers are going on.
Background
Advanced automation provides new capabilities that are used to advance key industry goals. Deploying new forms of automation enhances efficiency and productivity enabling operations at new scales. Automation is also deployed to address specific safety problems that have been identified. However, deploying automation also creates new challenges, new forms of cognitive work/joint activity, and new vulnerabilities that can undermine safety (see Woods et al., 2010; Woods, 2016; the PARC/CAST Flight Deck Automation Working Group, 2013, which captures these effects in aviation). As more autonomous automation is deployed and given higher authority to act on its own, coordination between operators and automation becomes more critical (Dekker & Woods, 2024). Poor support for human-automation coordination can diminish the usefulness of automated systems and has led to a variety of well-documented safety problems. Wiener’s (1989) seminal work identified key challenges for flight crews to work with automated systems (Wiener, 1989). Further studies by Sarter and Woods (1995) identified automation surprise and bumpy transfers of control as key issues when automated systems are strong and silent, that is, significant control authority with limited means to answer Wiener’s key questions.
Clark (1996) and Klein et al. (2005) described requirements for coordination that map to Wiener’s basic questions. For two agents (human or automated) to effectively coordinate their activities, they need to be mutually observable, predictable, and directable. Observability relates to making one’s current state and actions visible to others (to help them understand what one is doing now and why). Directability relates to the need to be receptive to (re-) direction by others. Predictability relates to making ongoing activities visible to other agents so they can anticipate what one is going to do next.
As automation advances to do more on its own, its ability to act in ways that are observable, directable, and predictable, becomes increasingly critical. Research in cognitive systems engineering and human-AI interaction emphasize observability and directability. Explainable AI (xAI) addresses the observability issue for black-box machine learning algorithms, but only on retrojection, not projection or the linkage between the two as is required for dynamic risky worlds.
Several studies have developed visual representations to support humans in predicting and anticipating what automated systems are going to do next. Woods and Elias (1985) developed and implemented a event-based display that highlighted what would happen next in a highly automated high risk dynamic system during anomalies (called significance messages). Roth et al. (1987) created an advisory system based on anticipatory information that focused on how actions now change what will happen next. These designs helped the operator coordinate with automated systems to answer Wiener’s third question: what will happen next? However, cases of automation surprise, which is a breakdown in coordination between the automation and human supervisors, require the person to look back, or retroject, to explain unexpected system behavior when it is under the control of the automation suite (Sarter et al., 1997). The responsible person needs to determine why what happened did not align with their understanding of what the automation would do next, while under pressure to look ahead in order to re-direct automatic control (Hoffman & Klein, 2017).
Method
The What’s Next Diagram is a visual analytics tool that can be used to represent and analyze coordination over time between automated systems and a human operator or problem holder. The layout out is shown in Figure 1. The diagram uses a temporal frame of reference created by juxtaposing axes that are both dimensions of time. The x-axis shows actual time as it progresses from the start of a scenario, while the y-axis shows the human’s comprehension of events—what they believe has happened so far (down) and what they believe will or might happen in the future (up). The diagonal is a powerful landmark where actual events over time intersect with the human’s comprehension of the events over time.
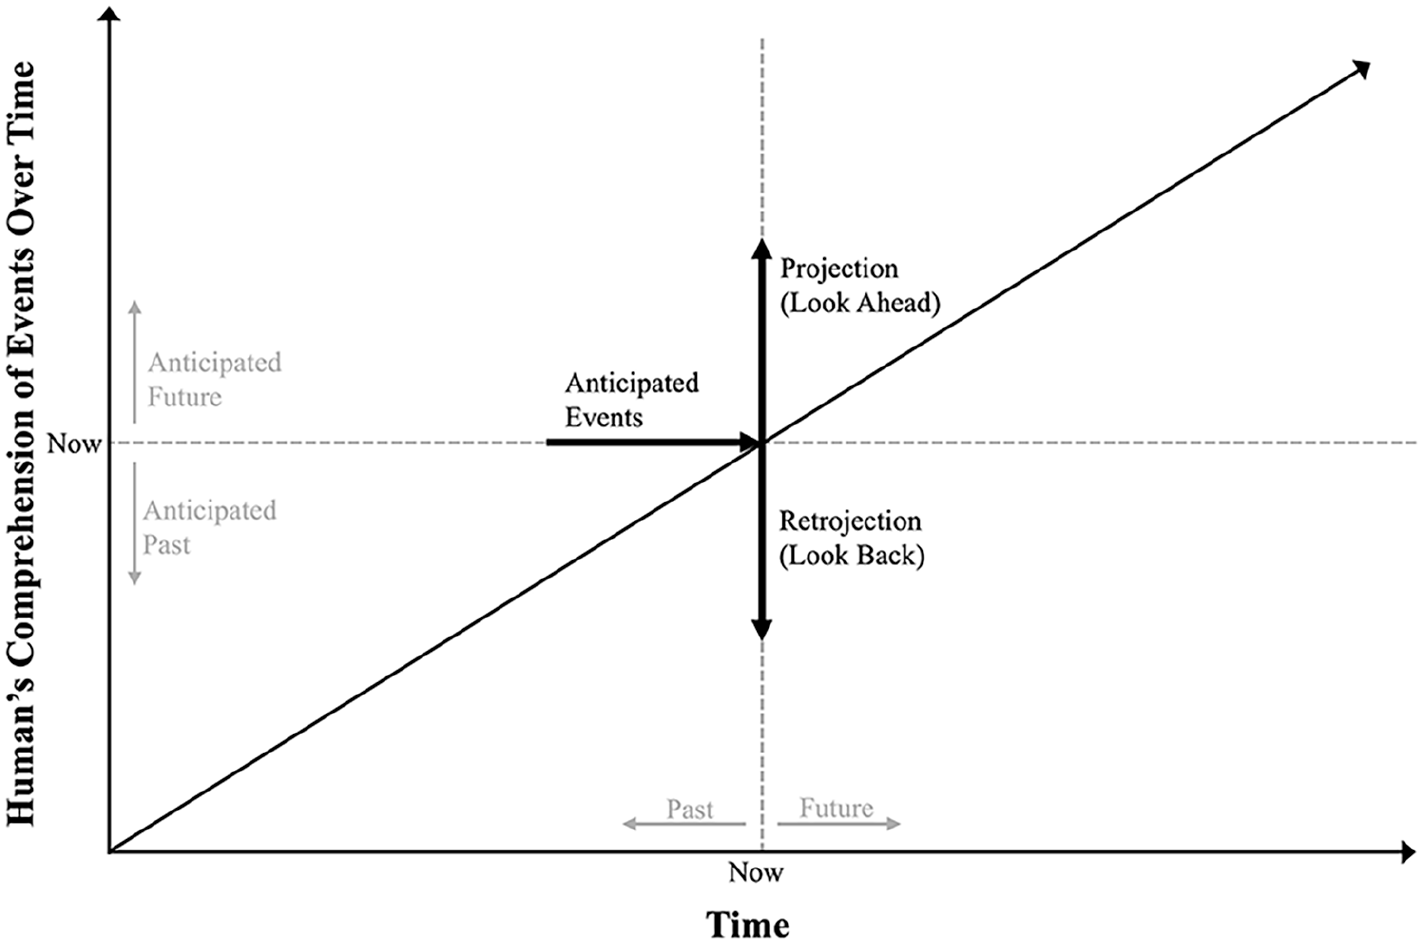
Axis layout of what’s next diagram.
As scenario time progresses, the “now” moves as events play out where the diagonal captures a good match of comprehension and actual events looking ahead or looking back. Above the diagonal are the expectations, or projections, agents have of what will happen next based on the cues perceived about the configuration of automated systems, its (control or supervisory) authority, and how the automation will carry out control during maneuvers. When a mismatch occurs, agents look back in time to explain how the automation suite is controlling the system. Retrojection is represented below the diagonal. Thus, the diagram can capture, at any point in an evolving scenario, anticipation—projecting what will happen next, surprise—mismatches of operator expectation and automation behavior, and explanation—efforts to make sense of what has happened that was unexpected.
Moving “now” from left to right moves the scenario through time. The diagram captures the changing projections and retrojections of the person along the vertical dimension as new cues come in about what automation is doing, what has happened, and what automated will do next. Likewise, changes are likely to occur as the person interacts with automated systems, by re-directing its behavior (for example, by engaging a different mode, setting a new target for automation to follow or directing the automation to initiate a new maneuver). The representation captures how projections of future events materialize as time progresses—reinforcing their current model, or, fail to materialize—a surprise to be reconciled.
Thus, the What’s Next diagram is a visual representation of the process of answering Wiener’s key questions as a scenario evolves over time. The demands for comprehension, anticipation, and explanation of automation behavior in context become visible to an analyst. The temporal progression reveals how workload can compound over time and combine in unexpected ways as coordination between operators and automation breaks down. Diagnostically, the tool affords assessments of design characteristics of automated systems in terms of support for observability, predictablility, and redirectability in difficult, nonnormal and abnormal situations.
Example
We have used the What’s Next diagram to analyze several incident cases from the Aviation Safety Reporting System (ASRS) and aviation accident reports. We have also used the diagram in a forward-looking way, by creating future-incident scenarios to evaluate the ability of an operator to coordinate with envisioned automation systems, given a particular system design. A brief example is provided here to demonstrate the utility of the tool to analyze an envisioned automated system. Go to https://tinyurl.com/wnd-example to see animations of the static figures in the paper.
The example highlights a coordination problem in the operations of Unmanned Aerial Vehicle (UAV), which is the loss of a command and control (C2) link to the ground operator when the UAV is in busy airspace (i.e., there is surrounding traffic). The C2 link is used to receive data in real-time about the state/activity of the UAV, onboard automation, and to (re-)direct the automation to change the UAVs behavior. Loss of C2 link is a common concern in UAV operations (Barrett et al., 2024; Gregory et al., 2020; Woods and Balkin, 2018). In busy airspace, the ability to (re-)direct what the UAV will do next is essential to avoid conflicts or collisions with surrounding traffic. We use the What’s Next Diagram to identify how a human supervisor can coordinate with this automated system, including where potential hazards or miscoordination may emerge.
The first step in conducting the analysis using the What’s Next Diagram is to visualize the onset of the event in question. The generating of scenarios should consider cases which would challenge operators in real-world operations. The first two events in our timeline include the operator monitoring the UAVs in the area followed by the onset and recognition of a lost C2 link on one UAV (Figure 2). After the fleet operator has waited to see if the link would reconnect with no success, they consider contingencies.
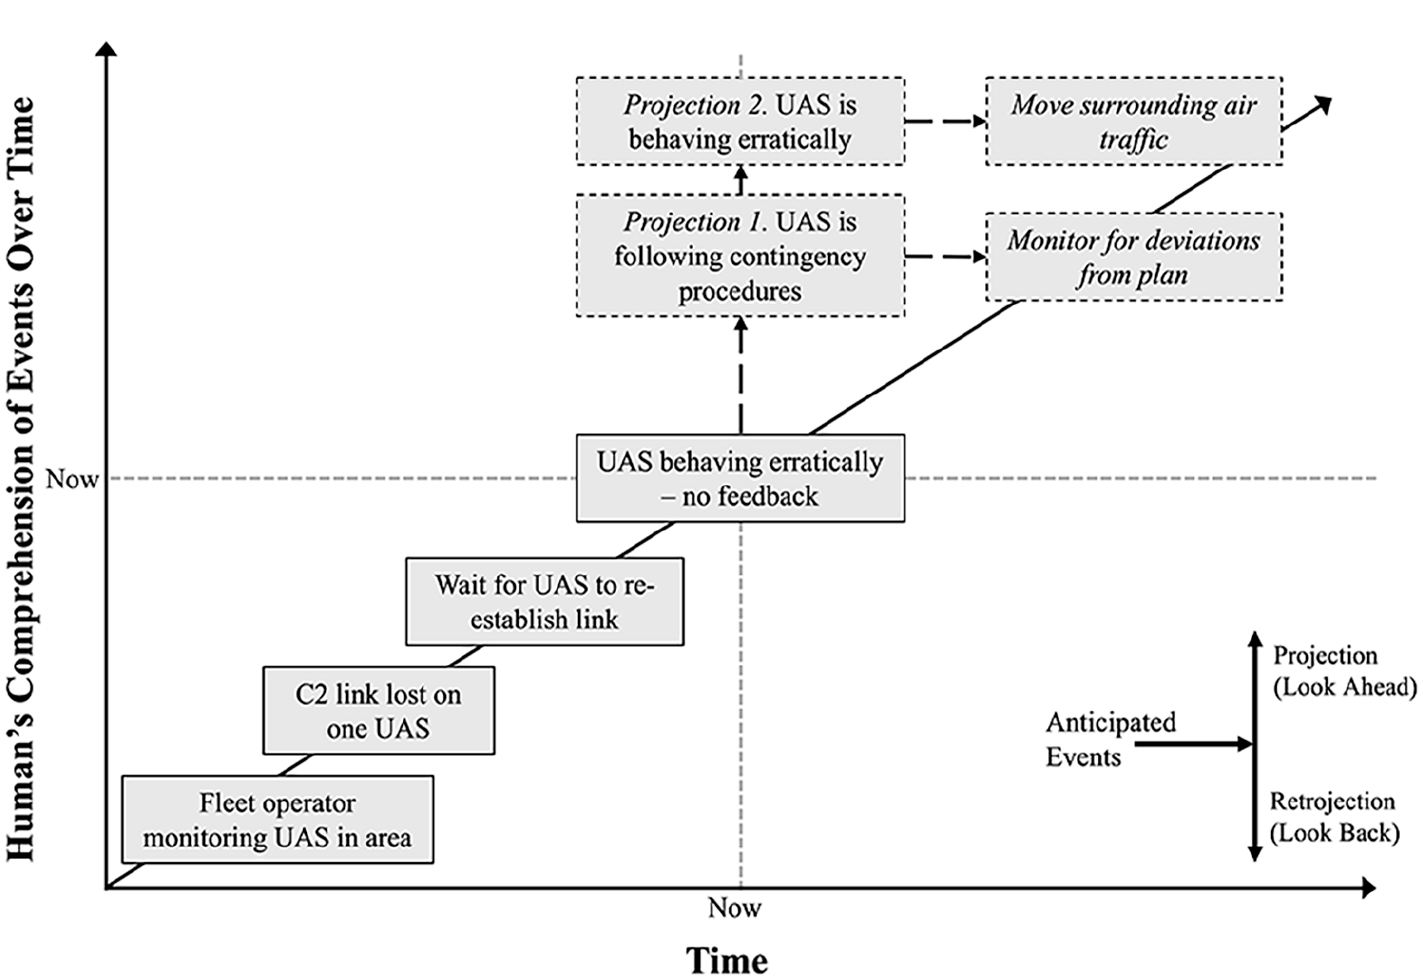
Alternate projections possible given ambiguity in design.
Typically, a UAV is programmed with one or more contingency procedures that are to be executed in the case of a lost link. For this example, we assume the contingency procedure is to divert to and land at the nearest vertiport. However, even with contingency procedures onboard, there is potential for ambiguity in what the UAS will do next, depending on the feedback the UAS provides (Woods & Balkin, 2018) and any related or additional failures onboard the UAV. The operator must determine if what they think is the controlling contingency procedure is in fact being followed.
Multiple projections of what the UAV will do may exist simultaneously. We illustrate two possible projections of the UAV’s behavior (Figure 2). Should the UAV indeed divert to the nearest vertiport, it may require the operator to reroute any traffic in the way of the diversion path. On the other hand, should the UAV not divert, a different section of the airspace may need to be cleared. Here, cues or information about the UAV’s current behavior and its intent is critical to coordinating the response between the UAV and operator (who also directs surrounding traffic). The more informative the indication is of what is next, the more predictable the UAS behavior. The challenge is the needed feedback is not available or minimal because of the lost C2 link.
The WND can also be used to analyze how coordination can be re-established following breakdowns. If we assume that an incorrect projection was made, this can lead to a coordination breakdown and an automation surprise. As a vignette on the base scenario, we assume the operator incorrectly believes the UAV is following its contingency procedures. In Figure 3, we show situation in which the UAV re-establishes its connection in a location that is unexpected to the operator. The operator must find explanations of this occurrence, backtracking the behavior of automation on-board the UAV (“Why did it do that?”). Explanations of what happened and why based on what is observable in the design are plotted below the diagonal.
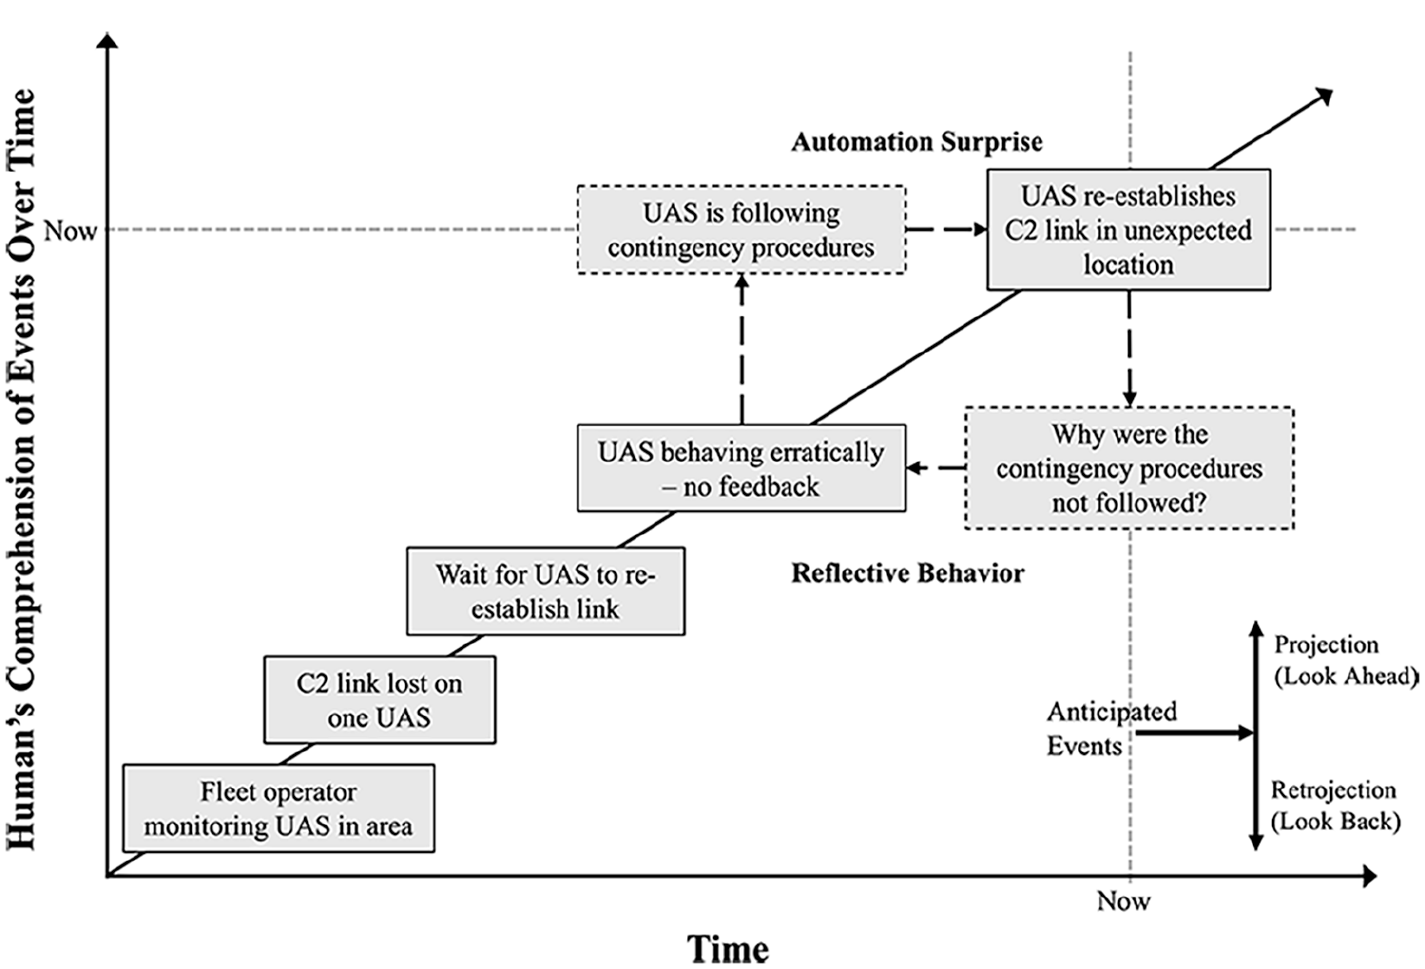
Automation surprise following inaccurate projection of what would happen next.
From this kind of analysis, one can derive a set of requirements for supporting projection and retrojection.
Contingency management procedures need to be accessible by all potentially affected actors in the airspace to reduce potential for ambiguity in a UAV’s behavior following a lost link.
More autonomy on board the UAV to decide what to do needs to also provide mechanisms for other actors in the system to understand UAV intent. Without it, more autonomy can significantly complicate the ability of other actors in the airspace to respond in a synchronized manner.
To support operators in recovering from automation surprises in the case of lost C2 links, when the link is re-established information should be shared that helps the operator understand what the UAV has done while the link was lost.
Building from the initial scenarios, alternate projections can be explored as additional vignettes. As contingency management procedures and automation behavior are specified in more detail for a design in progress, they can be incorporated in the What’s Next Diagram for further assessment.
In this example, we did not explicitly consider effects of time on the ability to coordinate given the rate at which events unfold. When the diagram is animated, it can be used to analyze how the pace of work interacts with multiple cognitive tasks to increase the risk of overload. For example, the need to explain surprising automation behavior both distracts and enhances the ability to anticipate future automation behavior and re-direct the automation as needed.
Discussion
We illustrated how the What’s Next diagram can be used to analyze human-automation interaction and evaluate the capability of a human-automation system to coordinate activities when disruptions arise. The representation can be used throughout a design process, from identifying coordination requirements during the earlier conceptual stages of a design, to assurance testing before designs are deployed, to revisiting designs after incidents occur. Both retrospective and future-oriented analyses can benefit from visualizing human-automation interaction through the lens of the What’s Next Diagram. Analyses of past incidents or scenarios provide insights in how a design hindered or supported coordination which can make accident investigations more sensitive to human-automation coordination problems and automation design avoiding hindsight bias. Future scenarios can be plotted given current proposed design to see where coordination breakdowns may arise. Groups or organizations tasked with assurance testing and assessments before designs are deployed can use the diagram to explore test scenarios quickly to identify problem areas to address.
In the example case, the What’s Next diagram helped reveal the need to make the contingency procedure predictable to operators when initiated, as the maneuver unfolded in context of other constraints, and as the system returned to normal functioning after the disruption of the loss of communication.
Support for coordination between automated systems and people is more than developing interface features. The What’s Next diagram can be a tool that reveals more fundamental architecture problems in human-automation systems especially as automation becomes more capable of autonomous activities and as people delegate more authority to automated systems to act on their own in uncertain situations (Dekker & Woods, 2024). In efforts underway, we are applying the diagram to a range of cases of deploying more autonomous automation which has high authority to carry out activities on its own which will serve as tests of the procedures for using the diagram as an analytical tool.
The What’s Next diagram is a tool that can be combined with other techniques can help increase the sensitivity an analysis or test of the capability of a human-automation system to coordinate when handling non-normal and abnormal situations. We are integrating the visualization with computational modeling and simulation capabilities to study coordination. The What’s Next Diagram lends itself well to visualize results from the author’s work on modeling and simulation (e.g., Barrett et al., 2024). Furthermore, the visualization helps stakeholders understand the findings from simulations studies about areas for modification and improvement.
For example, output from the Work Models that Compute (WMC) computational framework can be visualized in the What’s Next Diagram to highlight how coordination demands unfold and can be managed over time. WMC is a fast-time computational simulation framework which serves to evaluate human and machine system designs (Pritchett et al., 2014). It has shown to provide valuable insights about system behavior in domains such as space operation (IJtsma et al., 2019), on the flight deck (Pritchett et al., 2014), and future UAV operation (Barrett et al., 2024). These kinds of visual analytics combined with computational modeling and simulation techniques hold promise for system designers to better understand the complexity of human-automation interaction. Contrary to existing methods for studying human-automation interaction, this type of tool can more thoroughly and efficiently analyze how interactions between humans and automated systems play out over time, including how emergent effects may arise that are difficult to predict.
Challenging events are situated in time where there may be a variety of ways elements can build up or combine. Because the diagram is grounded in a temporal frame of reference it visualizes the interplay of the cognitive processes of projection, surprise, and retrojection as automation competencies still are limited and automation sometimes misbehaves when non-normal and abnormal situations arise. Wiener’s insight that operators need to be able to answer the question—what will automation do next?—is 35 years old. With this insight being more relevant than ever with higher-authority and autonomous automation, there is now an analytics tool to assess whether operators can answer the question directly and quickly given the design and architecture of human-automation systems.
Footnotes
Declaration of Conflicting Interests
The author(s) declared no potential conflicts of interest with respect to the research, authorship, and/or publication of this article.
Funding
This work was funded in part by the National Science Foundation (NSF) under CAREER award #2238030 to Dr. Martijn IJtsma. All figures are copyright IJtsma, Post, Nijveldt, Woods 2023. All rights reserved.