
Abstract
Despite advancements in vehicle safety and driving aids, road traffic accidents remain a major issue globally, largely due to human error. A comprehensive understanding of driver behavior, particularly in recognizing unsafe practices, is essential for reducing accidents and enhancing road safety. However, the complexity of human behavior and the variability of driving conditions complicate this task. Traditional methods of driver behavior analysis often rely on limited sources such as video feeds or vehicle telemetry. In contrast, the adoption of multimodal data analysis, which incorporates diverse data types like images, text, audio, depth, thermal, and IMU data, offers a richer perspective on the driving environment. This study employs multimodal embedded learning to analyze these data sources, resulting in a deeper, more holistic insight into driver behavior. The findings suggest that this comprehensive approach can significantly improve the prediction and prevention of unsafe driving practices by integrating various indicators of potential hazards.
Introduction
The rapid advancement of vehicle technology has revolutionized the transportation industry, particularly with the development of intelligent and autonomous systems. Understanding driver behavior is critical not only for individual safety but also for overall traffic dynamics and road safety (Vanlaar et al., 2008). Traditionally, driver behavior has been studied using methods such as self-reported surveys, driving simulators, and observational studies (Ziakopoulos et al., 2020). While these methods have provided valuable insights, they often suffer from limitations such as self-reporting bias, limited ecological validity, and the inability to capture the full complexity of real-world driving (Ziakopoulos et al., 2020).
With the advent of advanced sensor technologies and data analytics, a more comprehensive approach to studying driver behavior has become feasible (Castignani et al., 2015; Shirazi et al., 2016). This multimodal approach involves the integration of diverse data sources, including visual, auditory, physiological, and contextual information, to create a holistic understanding of how drivers interact with their vehicles and the road environment (Engström et al., 2010; Murali et al., 2022; Němcová et al., 2020; Tavakoli et al., 2021). Visual data, captured through dashboard cameras and eye-tracking systems, provides detailed information about where drivers are looking and how they are responding to visual stimuli (Crundall et al., 2011; Donges, 1978; Fernández et al., 2016). Auditory data, obtained through in-car microphones, can reveal conversational patterns and ambient noise levels, offering clues about the driver’s focus and stress levels (Bořil et al., 2012; Malta et al., 2009). Physiological data, collected via wearable sensors, provides real-time indicators of a driver’s physical and emotional state, such as heart rate variability and skin conductance (Healey & Picard, 2005). Contextual data from GPS and vehicle telemetry systems adds another layer of depth, linking driver behavior to specific environmental and situational factors (Fridman et al., 2019).
The integration of these multimodal data streams enables a richer and more nuanced analysis of driver behavior than has been possible with traditional methods (Regan et al., 2011). By capturing the interplay between different types of data, researchers can identify patterns and correlations that would otherwise go unnoticed. For instance, a driver’s increased heart rate might be linked to a challenging driving condition identified through GPS data, or a moment of distraction observed through eye-tracking might coincide with a specific auditory stimulus (Michon, 1985).
Inspired by this, the overall goal of this study is to integrate multi-modal embedded learning and analyze multimodal data sources for a holistic understanding of driver anomaly behavior. We achieve this by using state-of-the art ImageBind to create an embedding of the several data inputs. Then we developed an encoder to classify the anomaly behavior of drivers. The dataset utilized in this study was from DriveSafe publicly available dataset. Our developed model shows improved accuracy and efficiency.
The remainder of the paper is structured as follows. The second section “Related works” is a review of relevant literature. Section “Method” contains the data and methodology used for this study. Section “Results and Discussions” is a discussion of the model development results. Section “Conclusion” concludes with a summary of the research, conclusions drawn from the findings, and recommendations for future research.
Objective
The main objective of this work is to integrate multi-modal embedded learning and analyze multimodal data sources for a holistic understanding of driver behavior.
Related Works
The importance of understanding driver behavior has been highlighted in various studies. Li et al. (2013) presented a multimodal approach to track distraction in real driving scenarios using noninvasive sensors. Their study built statistical models to determine driver distraction, highlighting the effectiveness of integrating multiple data sources for comprehensive driver behavior analysis. Similarly, Athish (2024) reviewed various approaches for monitoring driver behavior and predicting unsafe driving behaviors, underscoring the significance of multimodal data in enhancing the accuracy of driver state assessments.
The HARMONY study by Tavakoli et al. (2021) provided insights into the naturalistic driving behavior of Chinese drivers using a human-centered multimodal approach. This study demonstrated the importance of considering the context of external events and driver reactions to improve understanding and prediction of driver behavior. The Drive & Act dataset by Martin et al. (2019) further extended the application of multimodal data by focusing on fine-grained classification of driver behavior in autonomous vehicles, showing the benefits of cross-view and multimodal settings in capturing detailed driver actions.
Narayanan et al. (2020) introduced a gated recurrent fusion method to learn driving behavior from temporal multimodal data, reporting superior performance over traditional multimodal and temporal baselines. Their study on the Honda Driving Dataset (HDD) highlighted the potential of advanced machine learning techniques in improving the classification and prediction of driver behavior. Roitberg et al. (2022) conducted a comparative analysis of decision-level fusion for multimodal driver behavior understanding, comparing different fusion strategies and demonstrating the effectiveness of multimodal approaches in driver activity recognition.
In summary, the integration of multimodal data and the application of advanced machine learning techniques have significantly advanced the understanding of driver behavior. By leveraging these approaches, it is possible to develop more accurate and reliable models that can enhance the safety and efficiency of intelligent vehicle systems. This paper builds on these advancements by presenting a multimodal approach to understanding driver behavior, highlighting the benefits of integrating diverse data sources for comprehensive driver state modeling.
Method
Dataset and Description
The dataset utilized in this study is a publicly available collection of driving data gathered using a smartphone app called DriveSafe, developed by the University of Alcala (UAH) in Madrid, Spain. The UAH-DriveSet dataset provides an extensive collection of naturalistic driving data gathered by six different drivers using various vehicles, including a fully electric car. The dataset captures three distinct driving behaviors: normal, drowsy, and aggressive. Data was collected on two types of roads—a motorway and a secondary road.
The motorway route is a 25 km round trip with up to four lanes in each direction and a speed limit of 120 km/h. The secondary road route is approximately 16 km long with typically one lane in each direction and a speed limit of 90 km/h. Each driver performed multiple trips on both routes, simulating the three driving behaviors.
This dataset includes more than 500 min of driving data, consisting of raw sensor data (including GPS and IMU), processed semantic information, and video recordings of the trips. The processed data features maneuvers recognition (such as acceleration, braking, turning, lane weaving, lane drifting, over-speeding, and car following) and driving style estimation (normal, drowsy, and aggressive; Romera et al., 2016). These steps are crucial for automating the extraction of semantic information from raw measurements, which is essential for data reduction in naturalistic driving studies (NDS).
The tests were conducted on the drivers’ vehicles, with two phones placed on the windshield as shown in Figure 1 below. One iPhone running the DriveSafe app was positioned in the center of the windshield, with its rear camera aimed at the road. The app includes a simple calibration stage to ensure the phone is perpendicular to the ground and aligned with the vehicle’s inertial axes.
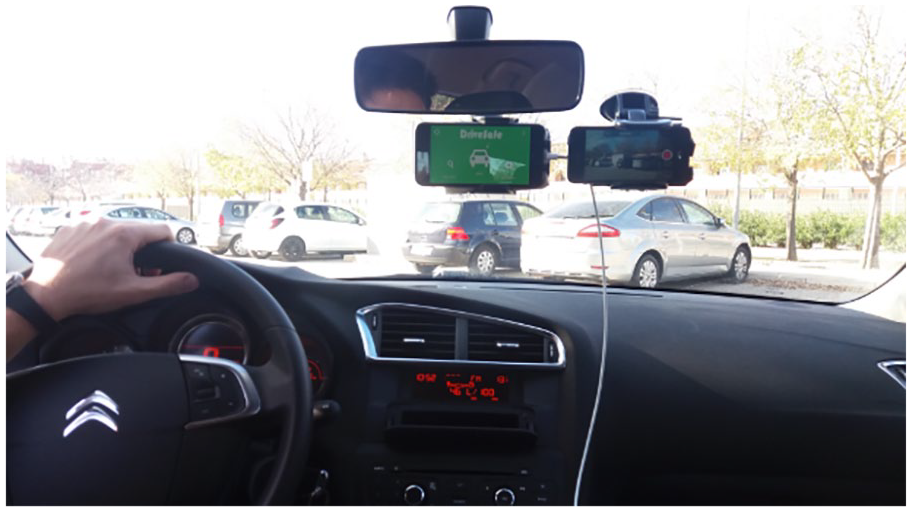
Setup of the DriveSafe App installed on the left phone, with another phone’s camera used for recording.
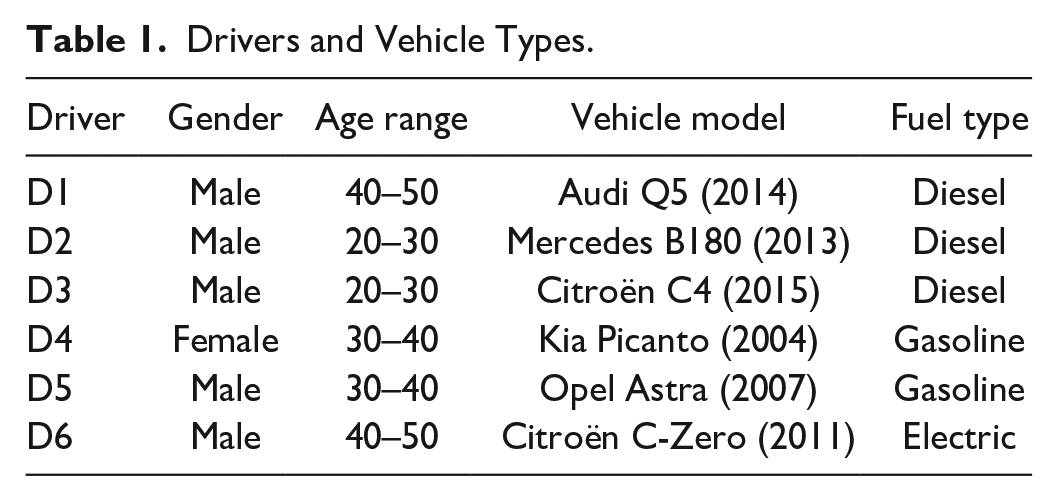
A second phone was placed next to the first to record a video of the entire route. Both the recorder and the DriveSafe app were started at the beginning of each route, and the testers completed each route without further interaction with the phones. The drivers and their vehicles are listed in Table 1.
Drivers and Vehicle Types.
Data Preprocessing
The raw IMU data, which includes accelerometer and gyroscope readings, is preprocessed to align with the video data. This involves resampling the IMU data to match the frame rate of the video recordings and applying Kalman filter to smooth the sensor readings.
The video recordings from the DriveSafe app are segmented into frames and synchronized with the IMU data. Each video frame is paired with the corresponding IMU reading based on the timestamp.
ImageBind Framework
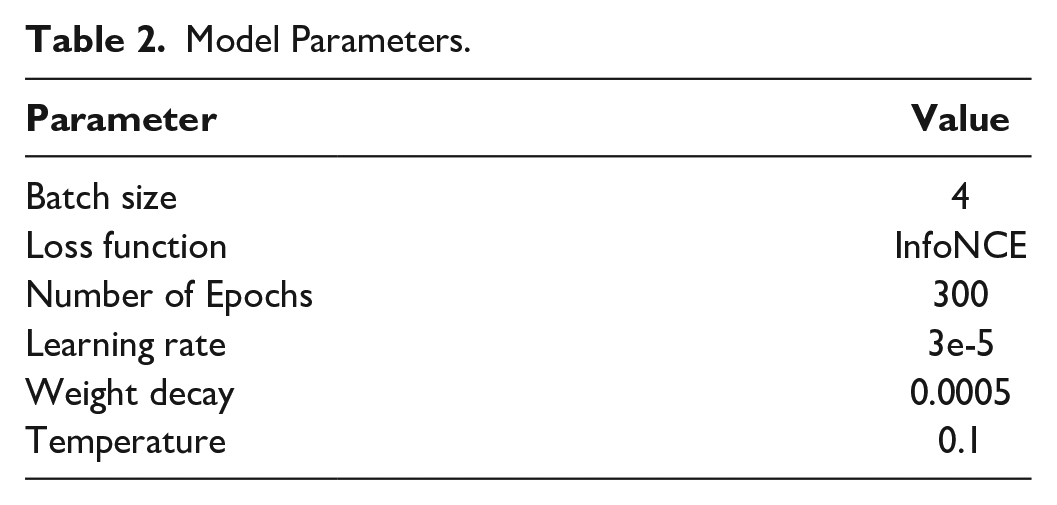
ImageBind, is a versatile framework capable of learning a joint embedding space across six different modalities: images, text, audio, depth, thermal, and IMU data. The key innovation of ImageBind is its ability to align embeddings from various modalities using images as a common anchor, thus enabling cross-modal retrieval and zero-shot learning without the need for explicit pairing of all modalities (Girdhar et al., 2023). Using the preprocessed IMU and video data, the ImageBind model is trained to learn a joint embedding space. The video frames (treated as images) and IMU readings are fed into their respective encoders (Vision Transformer for images and a 1D convolutional transformer for IMU data). The encoders transform the inputs into normalized embeddings. The embeddings are optimized using a contrastive loss function, which ensures that paired image-IMU embeddings are close in the joint space while non-paired embeddings are distant. This is achieved using an InfoNCE loss as shown in Table 2, which maximizes the similarity between positive pairs (image and corresponding IMU reading) and minimizes it for negative pairs.
Model Parameters.
In summary, this architecture has four main components; Encoders: Separate encoders for each modality (images, text, audio, depth, thermal, IMU) based on the Vision Transformer (ViT) architecture. For IMU data, a 1D convolutional transformer is used to handle time-series sensor data.
Linear Projection Heads: Modality-specific linear projection heads are attached to the encoders to produce fixed-size embeddings, which are then normalized.
Decoder module: then processes the embedding space to reconstruct the multimodal inputs, enabling comprehensive analysis and prediction of driver behavior.
Contrastive Learning Framework: The InfoNCE loss is employed to train the model, leveraging large-scale image-text data and naturally paired multimodal data (e.g., video-audio, image-depth) as shown in Figure 2 below.
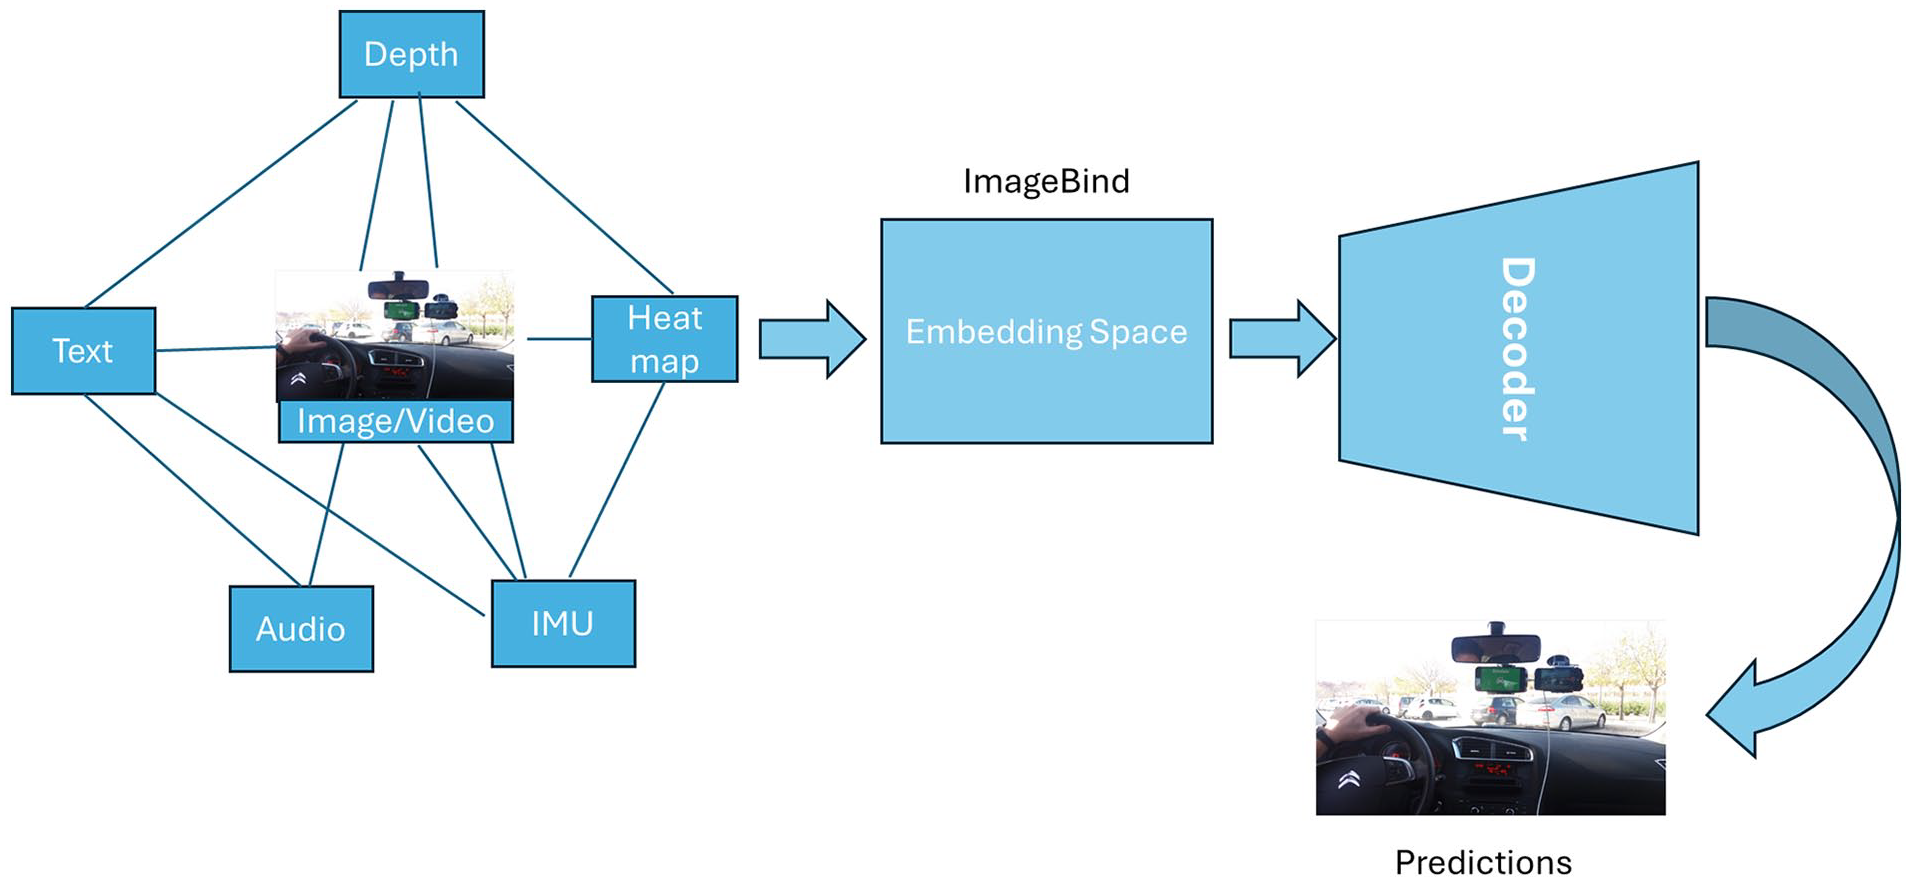
The model architecture.
Training: The training experiments were carried out using the Google Colab platform, leveraging its computational resources (GPU) for efficient model training. The data after preprocessing involved synchronizing IMU, and video data, resampling IMU data to match the frame rate of video recordings and aligning these data sources to create comprehensive input pairs for the model.
The model then utilized the ImageBind framework, which employs contrastive learning with an InfoNCE loss function to optimize the similarity between paired video-IMU embeddings while minimizing it for non-paired embeddings. This approach allowed the model to learn robust joint embeddings from multimodal data. The training process aimed to capture the nuances of driver behavior effectively, leading to the identification of distinct driving patterns such as normal, aggressive, and drowsy driving.
Results and Discussions
The training loss graph in Figure 3 shows the variation in the loss function over 300 epochs. The loss function is a crucial indicator of how well the model is learning from the data during training. In this case, the simulated data shows fluctuations around a mean value, indicative of noise. Despite these fluctuations, the overall trend suggests the model is learning, but the high variability points to potential areas for improvement in training stability.
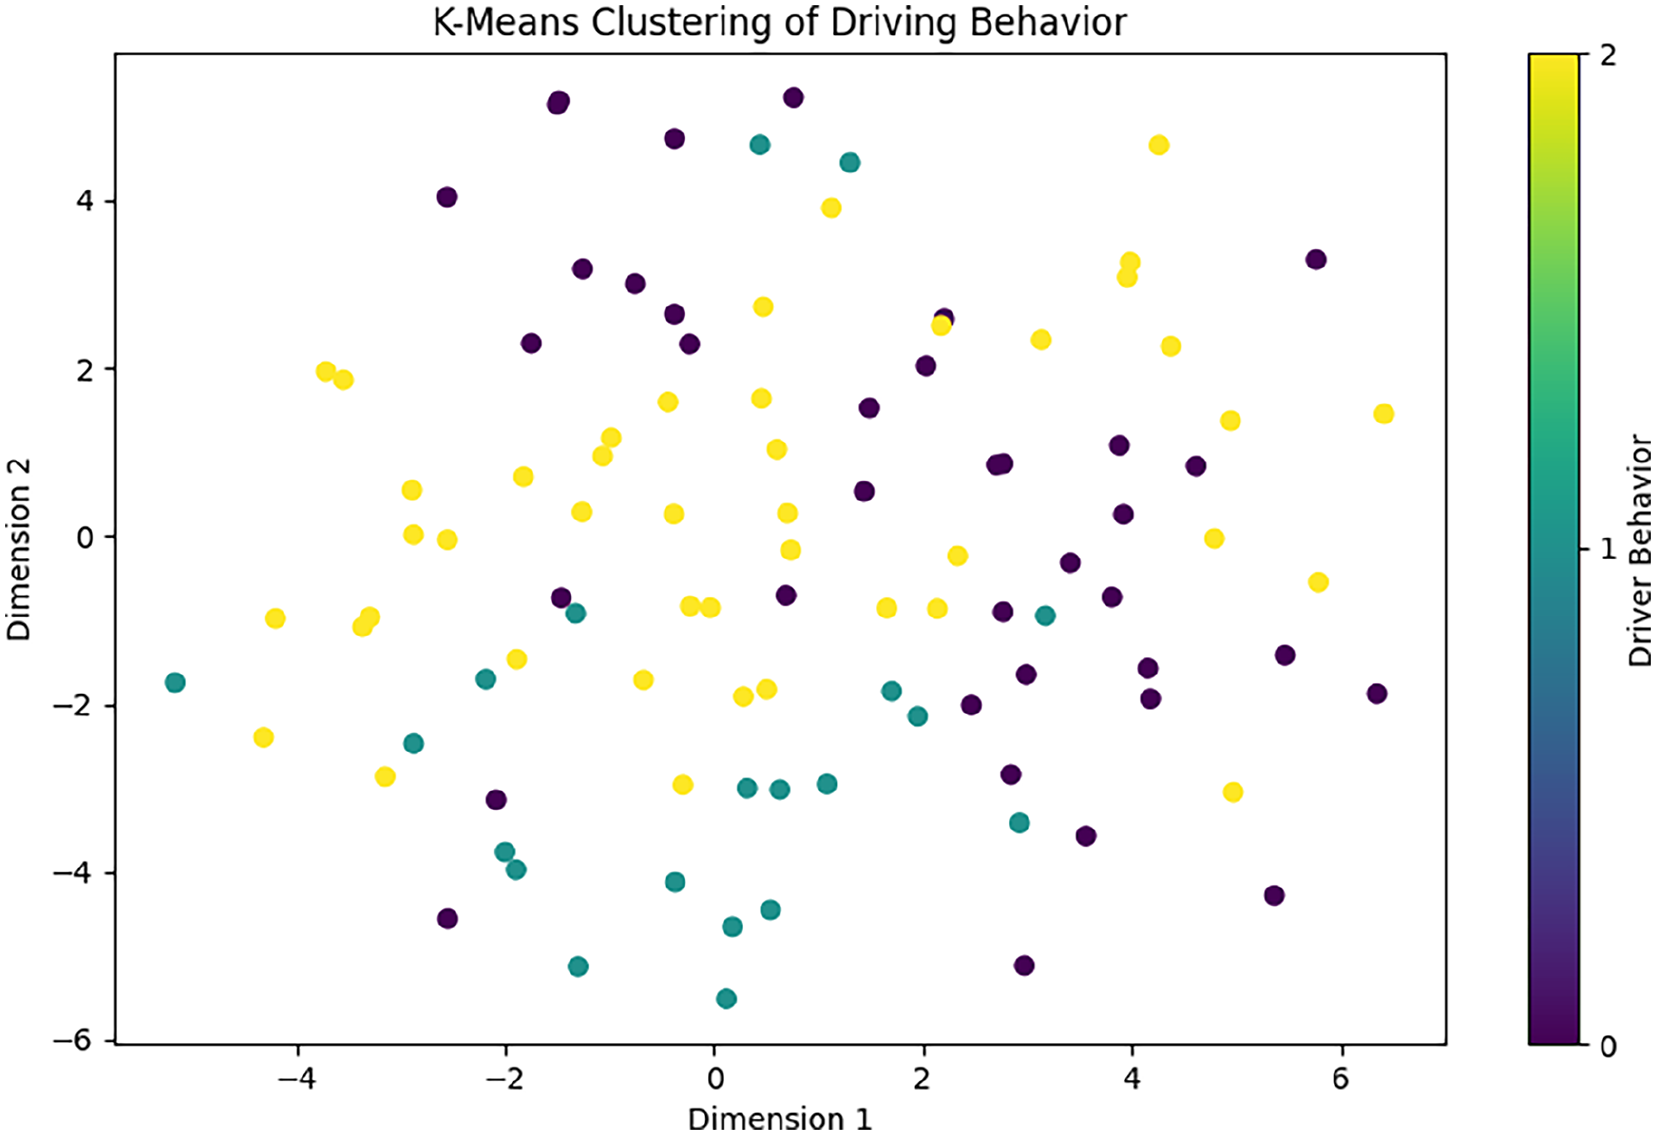
K-means clustering of driving behavior.
The t-SNE visualization (Figure 4) is a dimensionality reduction technique used to visualize high-dimensional data in a 2D space. The different colors represent different driver behaviors (normal, aggressive, and drowsy). The plot shows how the embeddings of these behaviors are distributed in the reduced space.
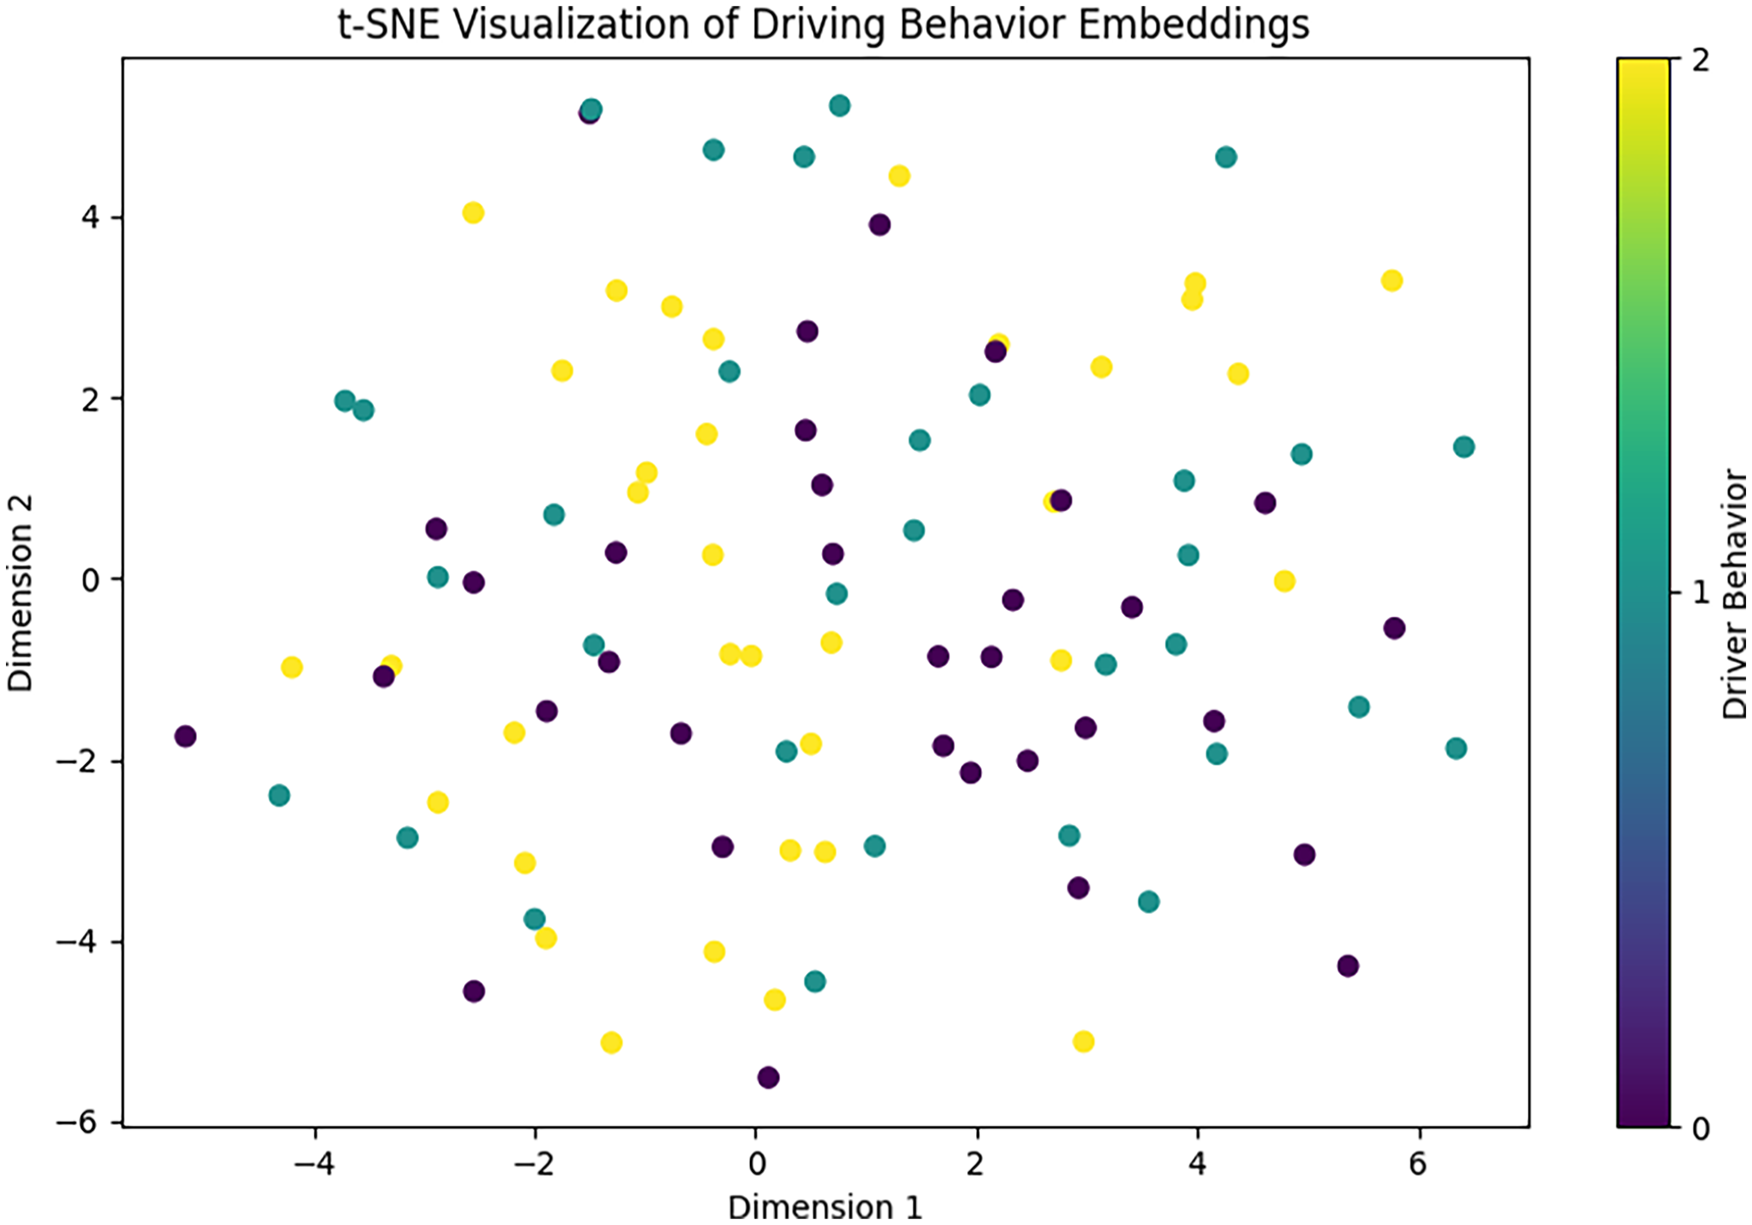
t-SNE visualization of driving behavior embeddings.
In this plot:
Yellow points represent normal driving behavior.
Purple points represent aggressive driving behavior.
Teal points represent drowsy driving behavior.
The visualization shows a reasonable separation between clusters, indicating that the model can distinguish between different driving behaviors based on the embeddings.
The K-Means clustering plot (Figure 3) shows the result of applying K-Means clustering to the t-SNE reduced data. The different colors represent the clusters identified by the algorithm, corresponding to different driver behaviors.
In this plot:
Yellow points represent one cluster, normal driving.
Purple points represent another cluster, aggressive driving.
Teal points represent the third cluster, drowsy driving.
The clusters indicate that the model successfully grouped similar driving behaviors together, validating the effectiveness of the embeddings generated by the model.
Overall, the training loss graph indicates that the model is learning but is affected by noise, leading to fluctuations in the loss value. Also, the t-SNE visualization and K-Means clustering results show a clear separation between different driving behaviors. This indicates that the multimodal approach using ImageBind is effective in capturing the nuances of driver behavior from the integrated data sources (video, IMU).
Conclusion
In summary, this study successfully employed a multimodal approach using ImageBind, demonstrating significant potential in classifying and distinguishing between different driving behaviors. The visualizations indicate that the model effectively groups similar behaviors, providing valuable insights that are crucial for the development of advanced driver assistance systems (ADAS). Future work will focus on addressing training noise and exploring additional data sources to further enhance the model’s accuracy and reliability. By continuing to refine these methods, we can improve the robustness and effectiveness of ADAS, ultimately contributing to safer and more efficient transportation systems.
Footnotes
Declaration of Conflicting Interests
The author(s) declared no potential conflicts of interest with respect to the research, authorship, and/or publication of this article.
Funding
The author(s) disclosed receipt of the following financial support for the research, authorship, and/or publication of this article: We are grateful to the creators of the UAH-DriveSet for making this valuable dataset publicly available. This work has been funded by the National Science Foundation (ERC HAMMER, Award 2133630). This work was also supported by the Department of Energy Minority Serving Institution Partnership Program (MSIPP) managed by the Savannah River National Laboratory under BSRA contract 0000602156. The views and conclusions contained herein are those of the authors and should not be interpreted as necessarily representing the official policies or endorsements, either expressed or implied, of these organizations.