
Abstract
This work develops interpretable models to predict near-real-time cognitive workload (CWL) in teams operating in complex environments. Existing approaches using neurological sensors are impractical for field use. Our approach integrates multimodal data from non-invasive behavioral and physiological sensors to robustly detect CWL changes. We apply multidimensional recurrence quantification analysis (MdRQA) with a novel pattern analysis extension to identify recurring multimodal signatures indicative of different CWL states. A multiparty dataset with fNIRS, behavioral, and physiological measures from teams performing a gamified search and rescue mission and individual resting state tasks were used. The findings indicate that the multimodal patterns derived from non-invasive measures were significantly associated with a neurological measure of CWL within 10s time slices. Moreover, the multimodal patterns were predictive of individual and team performance over-and-above the neurological measure of CWL. This can enable timely interventions by intelligent systems to optimally manage team CWL and enhance human-machine teaming in demanding environments.
Introduction
Cognitive workload (CWL) is widely acknowledged as a key factor that affects human performance, where human error is especially likely when CWL is relatively high (overload) or, conversely, low (underload). CWL change may occur due to influences like time constraints, surroundings, expertise level, and task load intensity itself, with the overarching result being that more demanding tasks induce greater workload (Charles & Nixon, 2019). Task overload can result in rushed decisions and heightened stress (Wickens, 1979), while task underload can cause mind-wandering and complacency (Zhang & Kumada, 2017).
Because it is crucial to manage CWL in important situations, from everyday driving to air traffic control (Flin et al., 2016), research has examined how unobtrusive measures, such as sensor technologies, can be used to detect real-time changes in workload. Moreover, as technologies to augment cognition (Fiore & Wiltshire, 2016) become more common in educational settings (e.g., intelligent tutoring), or control rooms (e.g., information displays), there is continued interest in monitoring CWL in real time. Sensor-based approaches have been explored for real-time detection of CWL. For example, functional near-infrared spectroscopy (fNIRS) has emerged as a promising sensor-based approach for real-time detection of cognitive workload (CWL). Studies have explored its application in various domains, including aviation (Çakır et al., 2016) and medical training (Bracken et al., 2020). Physiological data can also assess affective CWL components in real-time, a viable alternative or supplement to task performance measures (Ikehara & Crosby, 2005). However, no single measure is optimal across all contexts (Hankins & Wilson, 1998; Miyake et al., 2009; Wilson, 1993). Although multiple measures detect CWL changes, there is a need to move beyond neurological sensors (e.g., EEG and fNIRS) that are often impractical to use in ecologically valid settings. Instead, effective real-time CWL sensing is needed for high-stakes environments (e.g., manned-unmanned air vehicles), using embedded or wearable sensors capable of collecting physiological data.
Across contexts, an invariant challenge remains the development of more sophisticated models capable of explaining and predicting variations in workload. Further, these require conceptual and analytic techniques that can integrate multimodal data. We address this gap by advancing interpretable models that combine physiological and behavioral signals to determine signatures of team workload states in complex settings. Specifically, we utilize fNIRS data as a neurological “ground truth” indicator of CWL. This is based on prior research showing fNIRS data can provide objective measures of CWL (Aghajani et al., 2017; Cao et al., 2022; Causse et al., 2017; Coffey et al., 2012; Liu et al., 2017). We use multidimensional recurrence quantification analysis (MdRQA; e.g., Amon et al., 2019; Wallot et al., 2016) with a novel pattern analysis extension, to develop interpretable models that enable deeper insights into the multimodal markers indicative of high and low CWL. Altogether, this work provides a novel approach for identifying cognitive states in complex settings. This can enable new technologies such as automated adaptation based on operator needs or human-machine teaming applications requiring real-time user state modeling. Towards this end, we address the following research questions:
Method
Data Set
We utilized a publicly available dataset (ToMCAT; Pyarelal et al., 2023) capturing teams working together under time pressure to complete shared tasks. This dataset included 40 teams with three members in each team. The key experimental task was a Minecraft-based search and rescue mission involving time constraints and coordination between team members (see Huang et al., 2022 for full description). In addition, three baseline tasks were completed to facilitate data interpretation when compared to data gathered during the more demanding search and rescue scenario. We only utilized one of the baseline tasks “the resting state task” for our analysis.
This dataset simultaneously recorded multiple subjects’ neural activities (hyperscanning) during team interactions (Sinha et al., 2016). The dataset includes EEG and fNIRS as primary neural markers of CWL. As described, the use of fNIRS as a CWL baseline has been shown in other task settings, like the n-back working memory task (Aghajani et al., 2017; Liu et al., 2017) and flight simulator (Causse et al., 2017) and validated using other measures such as machine learning and statistical analysis. Additionally, behavioral and physiological measures (electrocardiography, gaze tracking, pupillometry) were collected over the full session. Previous studies showed physiological measures such as heart-rate-variability (HRV), eye tracking, and pupil dilation have been associated with cognitive load (Ikehara & Crosby, 2005; McDuff et al., 2014; Pomplun & Sunkara, n.d.; Wilbanks et al., 2021; Takahashi et al., 2000). Therefore, we utilized these measures (HRV, gaze tracking, and pupil dilation) to derive interpretable real-time indicators of high and low cognitive load based on non-invasive sensing.
Participants
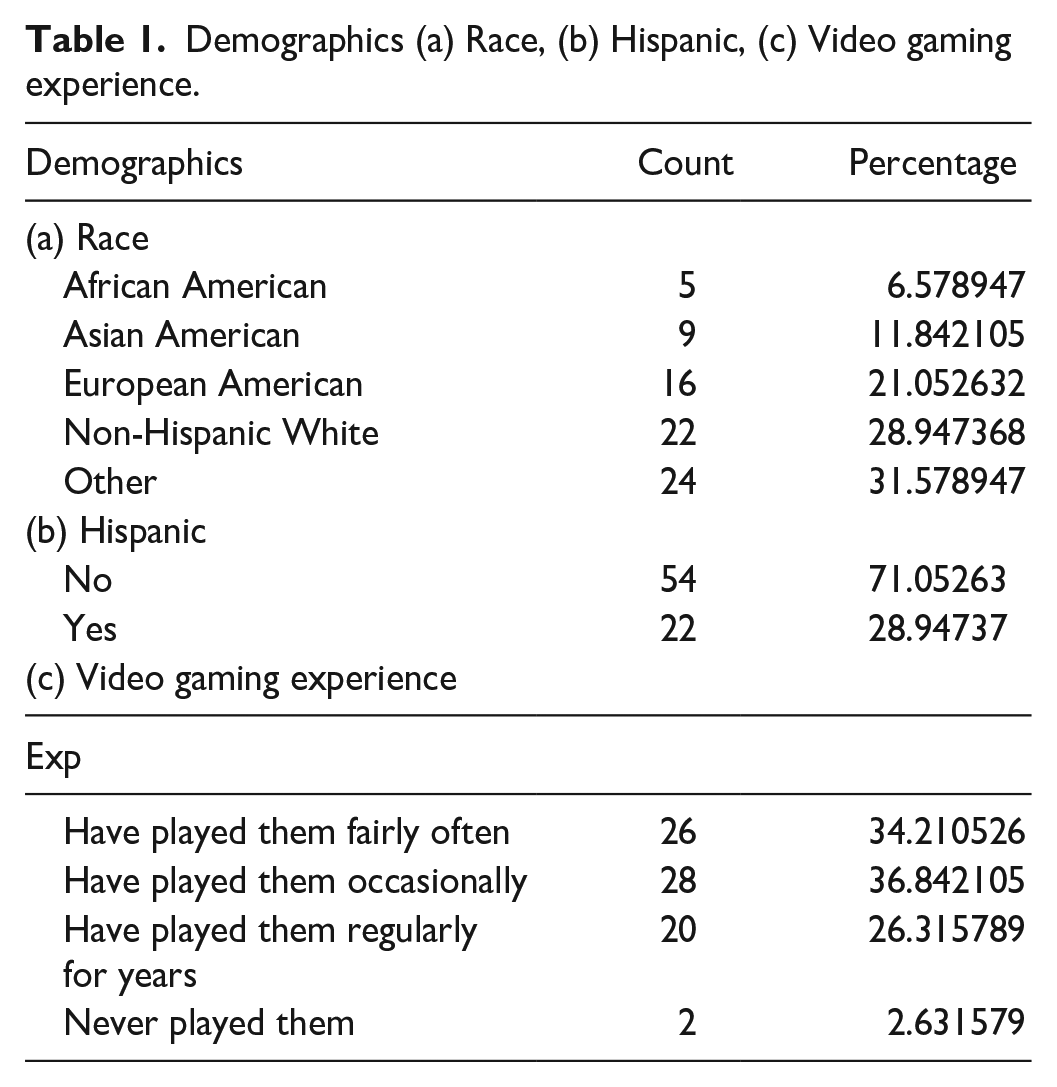
There were 40 teams, each with three members. For the no-show of any participant, they used a confederate as a team member instead of a real participant (n = 18), leaving n = 102 valid participants. We also removed participants from the analysis due to technical issues (device, calibration; n = 22) and missing demographic info (n = 2). Finally, we had 76 real participant data and 33 team/group session data for the final analysis. Among these 76 participants, the mean age was 35.6 years (SD = 10.2), with 45% identifying as males (n = 33), 55.3% as females (n = 42), and 1.3% (n = 1) who preferred not to say. See Table 1 for aggregated demographic information of (a) race, (b) ethnicity, and (c) video gaming experience.
Demographics (a) Race, (b) Hispanic, (c) Video gaming experience.
Data Pre-processing
For the analysis, we used data from the 17-min Minecraft mission Saturn A task (ToMCAT dataset, Pyarelal et al., 2023). We examined multimodal patterns derived from non-invasive sensors of eye movement, heart rate variability, and pupillary response. We investigated how the multimodal patterns corresponded to an fNIRS near-real-time measure of CWL, as well as team performance.
Heart Rate Variability (HRV)
Root mean square of successive differences (RMSSD) is a quantitative measure that reflects short-term heart rate variability (Ciccone et al., 2017; DeGiorgio et al., 2010). For RMSSD calculation we used a 10 s window. Notably, the HRV time window constrained the temporal resolution of our analyses. That is, sensors are commonly used for near-real-time detection, prediction, and intervention, motivating the need for short time windows (i.e., faster sampling rate). However, research suggests time windows shorter than 10s are precarious in their ability to reflect states of interest, like HRV, accurately (Baek et al., 2015). Thus, the HRV measure was calculated at a 10s sampling rate, in turn, guiding the sampling rate used for all sensor measures (also see Amon et al., 2019). We used the Neurokit python package to apply a band-pass filter to the signal (.67–45 Hz; Pyarelal et al., 2023) and then used the BIOSPPY python package for the RMSSD calculation.
Eye Movement
Cognitive workload affects smooth pursuit eye movements, with higher deviations in gaze points at higher workload levels (Kosch et al., 2018). The eye-tracking system used in this study was Pupil Core (Pupil Labs GmbH) with eye-tracking data sampled at 250 Hz (Pyarelal et al., 2023). We calculated the absolute difference between x and y coordinates from each time point and then identified the Euclidean distance between consecutive gaze points. Then we removed outliers ±4 standard deviation from the mean.
Pupillary Response
Increases in pupil size are associated with increased cognitive processing demands (Sibley et al., 2015). We calculated the percentage change in pupil size from pupil diameter. Afterward, we calculated the average diameter change during the rest state task and applied the average diameter change of the rest state task as the baseline diameter for the pupillary response calculation while in the Minecraft mission task.
Functional Near-infrared Spectroscopy (fNIRS)
Increase in HbO and decrease in HbR in the prefrontal cortex have been shown to indicate higher cognitive workload (Causse et al., 2017; Toichi et al., 2004). For analysis, fNIRS reliability was improved by averaging across a small number of channels overlying a cortical region of interest (Luke et al., 2021; Wiggins et al., 2016). In the ToMCAT dataset (Pyarelal et al., 2023), the optodes mainly cover the frontal lobe area. Therefore, we collected all the frontal lobe optics and prefrontal cortex as our region of interest. We then calculated the average of oxygenated hemoglobin (HbO) and deoxygenated hemoglobin (HbR) from all the channels from the above region of interest. Deoxygenated hemoglobin (HbR) performs better than HbO in CWL measure (Bracken et al., 2020; Hirshfield et al., 2023; Zhuang et al., 2021), hence we only presented results from HbR for our study. fNIRS was recorded using NIRSport2 (NIRx Medical Technology LLC), which records and streams fNIRS signals at 10.2 Hz (Pyarelal et al., 2023).
Analysis
MdRQA is an extension of recurrence quantification analysis in that it incorporates unsupervised learning to classify different time points as recurrent (repeating) or not. We completed MdRQA along with pattern analysis via the following three main steps:
(1) First, we created categorical versions of the HRV, eye movement, and pupillary response timeseries, where time points within each measure were split into high (H) or low (L) values, based on the median value per measure across participants. This initial step allowed us to derive easy-to-understand multimodal clusters (Necaise et al., 2021).
(2) Next, we followed the MdRQA procedure, comparing the similarity of every timepoint to every other timepoint within a time series and marking it as recurrent or non-recurrent based on the relative similarity of compared points (see Necaise et al., 2021 for parameter selection procedure). When performing this step with multiple time series per participant (HRV, eye movement, and pupillary response), all the time series measures must revisit a similar state for it to be marked as recurrent, even if the values of the different measures are dissimilar. For example, in this case, a recurrent pattern might include a minimal eye movement with a minimal pupillary response but a maximal HRV value, reflecting high-intensity focus. This step yields a binarized recurrence matrix indicating which time points are recurrent or not.
(3) Next, we projected the pattern assignments back onto the original recurrence plot to produce a color-coded plot distinguishing the different classes of recurrent states (Necaise et al., 2021). In this case, the color-coded points reflect recurrent patterns of an individual’s multichannel behavioral and physiological activity that occur over time during the collaborative task. Feature extraction of patterned recurrent states derived from non-invasive sensing was then examined in relation to the fNIRS HbR measure of CWL to determine those multimodal signatures most predictive of high and low CWL, as well as how the multimodal patterns predicted performance.
From the three sensing measures (HRV, eye movement, and pupillary response), we examined eight distinct patterns. For example, pattern H-L-H represents high HRV, low eye movement, and high pupillary response respectively. We coded non-recurrent points as N-R-P and used N-R-P pattern as the reference group for the mixed-effect regression. In this case, N-R-P points represents shifts to novel states (i.e., the time points being compared are unique from one another). Figure 1 shows one example of a multidimensional recurrence plot for the non-invasive sensing measures HRV, eye movement, and pupillary response.
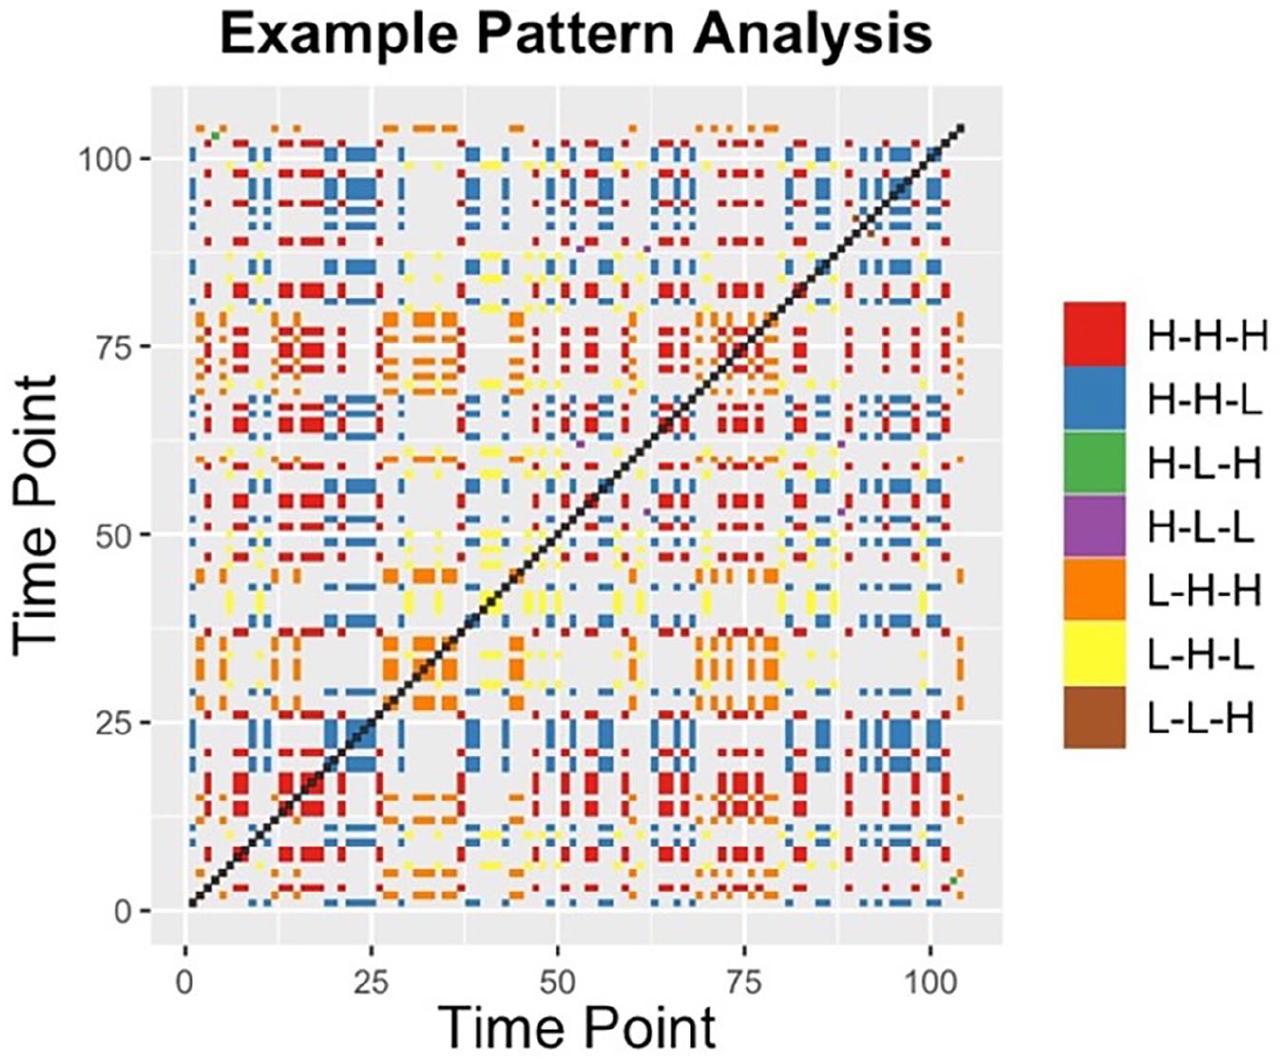
Example participant multidimensional recurrence matrix, with points representing 10s time windows. Via pattern analysis, recurrent values were color-coded to depict specific patterns that repeat, in this case, combinations of low (L) and high (H) levels of the non-invasive sensing measures, HRV, eye movement, and pupillary response. For this participant, we see a concentration of red points (H-H-H) in the beginning of task (bottom-left), shifting to yellow points (L-H-L) in the middle of the task, followed by blue points (H-H-L).
Results
Multimodal Patterns From Non-Invasive Sensing Reflect a Neurological Measure of CWL
First, we were interested in how the non-invasively sensed multimodal patterns are associated with a more traditional neurological measure of cognitive load like fNIRS-derived HbR (Causse et al., 2017; Toichi et al., 2004).
To address RQ1, we identified patterns from non-invasive sensor measures of HRV, eye movement, and pupillary response that are associated with changes in HbR. To examine the extent to which the multimodal patterns of the non-invasive sensors reflect HbR levels, we applied a mixed-effect regression model with HbR as an outcome variable, pattern type as a predictor, and participant ID and team ID as random intercepts. We also controlled for demographic variables of age, gender, and videogame experience, as well as number of timepoints available for analysis per participant. The results can be found in Table 2. The model shows a significant relationship between the non-invasive sensor patterns and frontal lobe de-oxygenation. Moreover, the multimodal patterns differed in the extent to which they mapped to HbR. Specific patterns (LLL, LLH, LHH, HLL, HLH, HHL, HHH) were significant predictors at the p < .05 level.
Mixed-effect regression analysis examining the association between the neurological measure of CWL (HbR) and multimodal patterns of HRV, eye movement, and pupillary response within 10s windows, controlling for demographics and time points available for analysis.
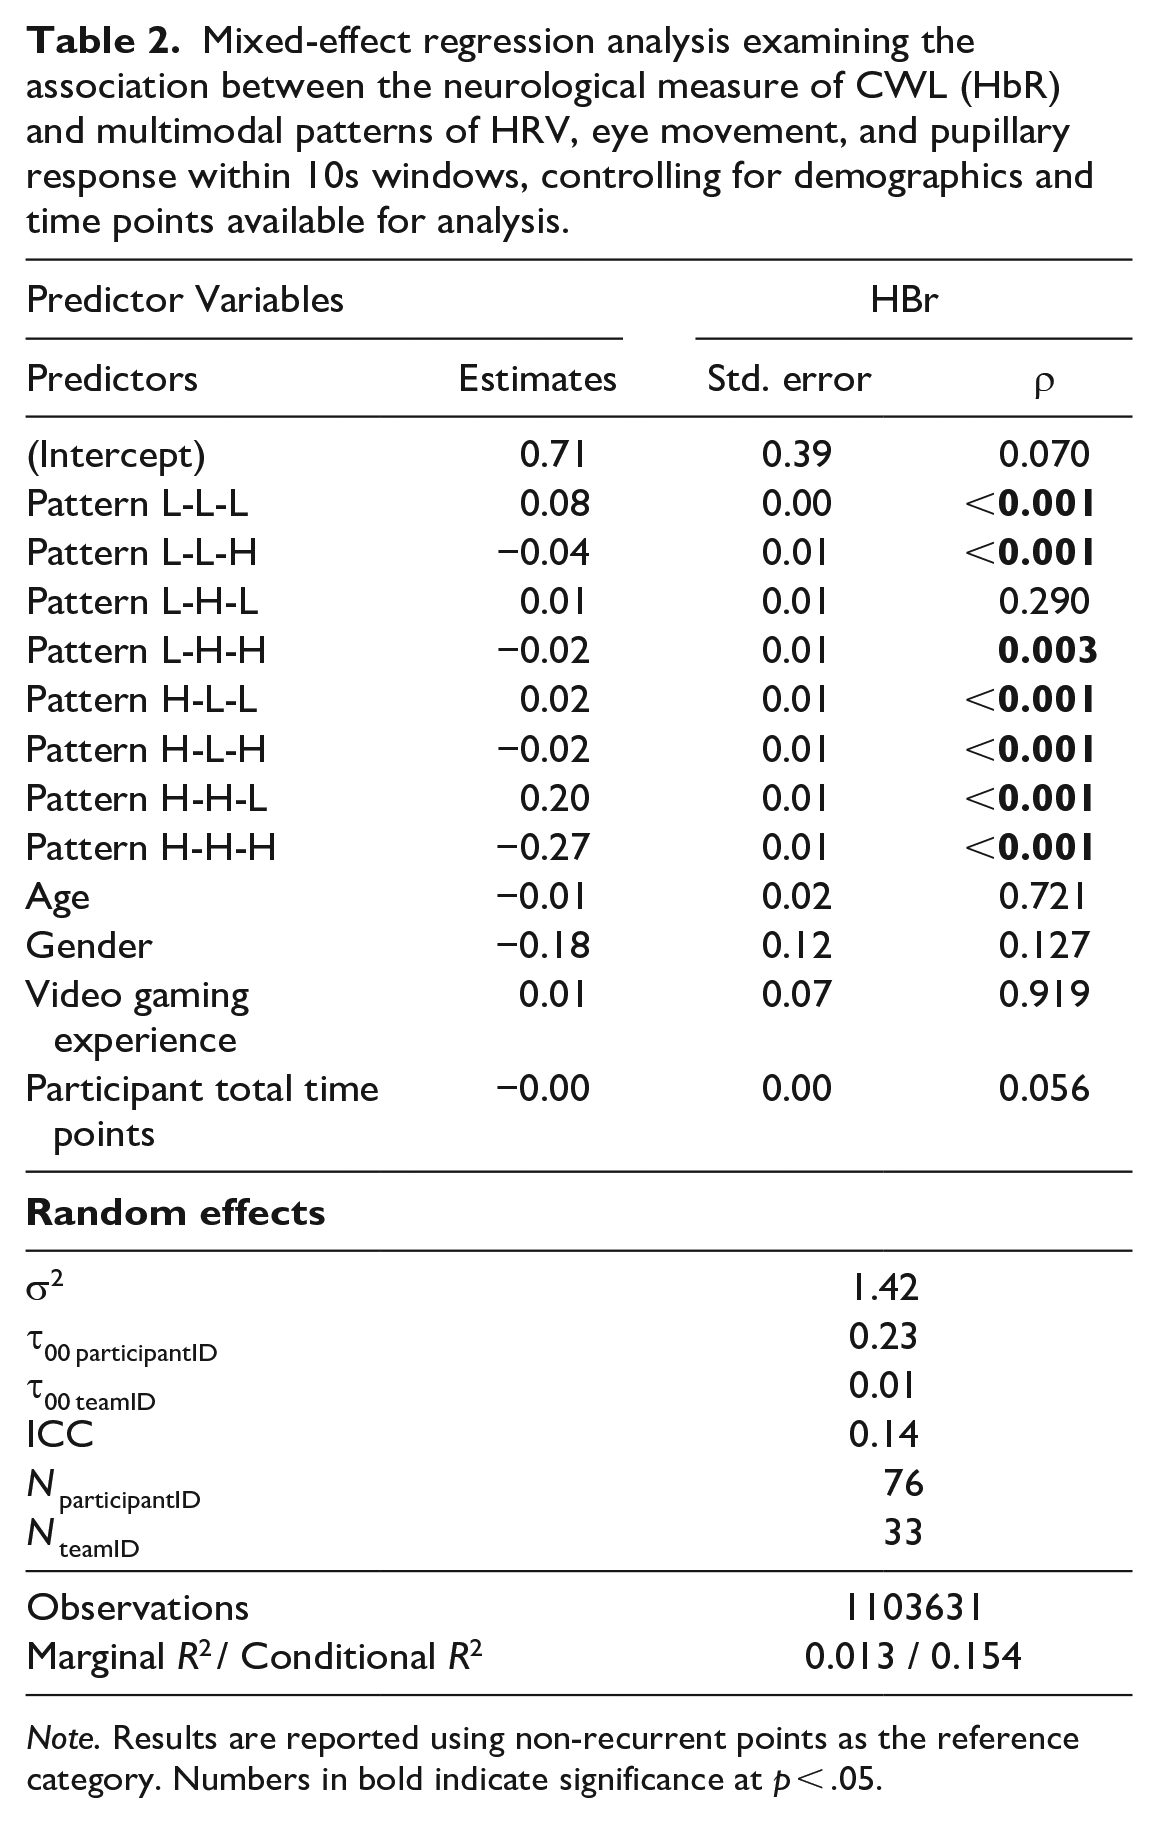
Note. Results are reported using non-recurrent points as the reference category. Numbers in bold indicate significance at p < .05.
Multimodal Patterns From Non-Invasive Sensing Distinguish Between High and Low CWL as Measured Neurologically
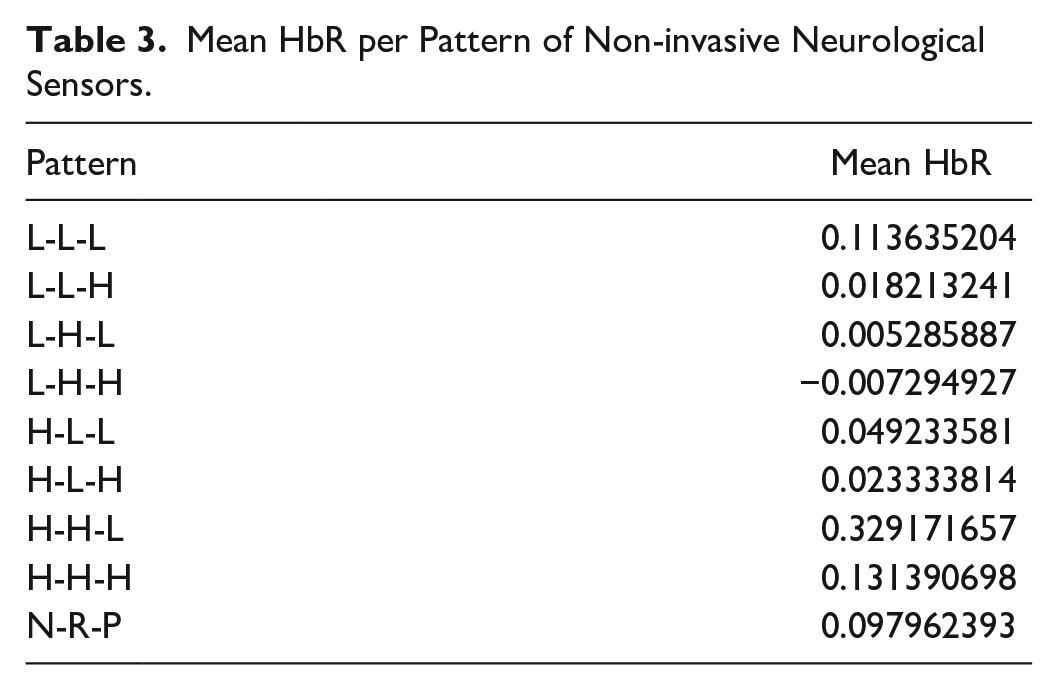
To address RQ2, we identified which patterns were related to high vs low CWL as a first step toward understanding how the patterns differently reflect CWL states. To do this, we calculated the mean HbR for each multimodal pattern and participant. These averages are shown in Table 3. For example, the pattern “H-H-L” reflects high HRV, high eye movement, and low pupillary response, respectively, and was significantly associated with the highest HbR levels. In this way, patterns differently map to the neurological measure of CWL.
Mean HbR per Pattern of Non-invasive Neurological Sensors.
Multimodal CWL Patterns From Non-invasive Sensing Predict Task Performance
To address RQ3, we examined which multimodal patterns from non-invasive sensors most strongly predicted task performance. We performed two linear regression analyses with either team performance or individual performance (Mine craft mission score) as the outcome variables. Each participant’s multimodal pattern frequency was a predictor and we added demographics (age, gender, video gaming experience) as control variables. Results are shown in Table 4. The findings show that different multimodal patterns map onto team versus individual performance. In both cases, the multimodal pattern frequencies outperform HbR in predicting performance.
Comparison of Logistic Regression Analysis Between Team and Individual Performance Prediction Using Non-invasive Sensor Patterns Frequency and Demographics.
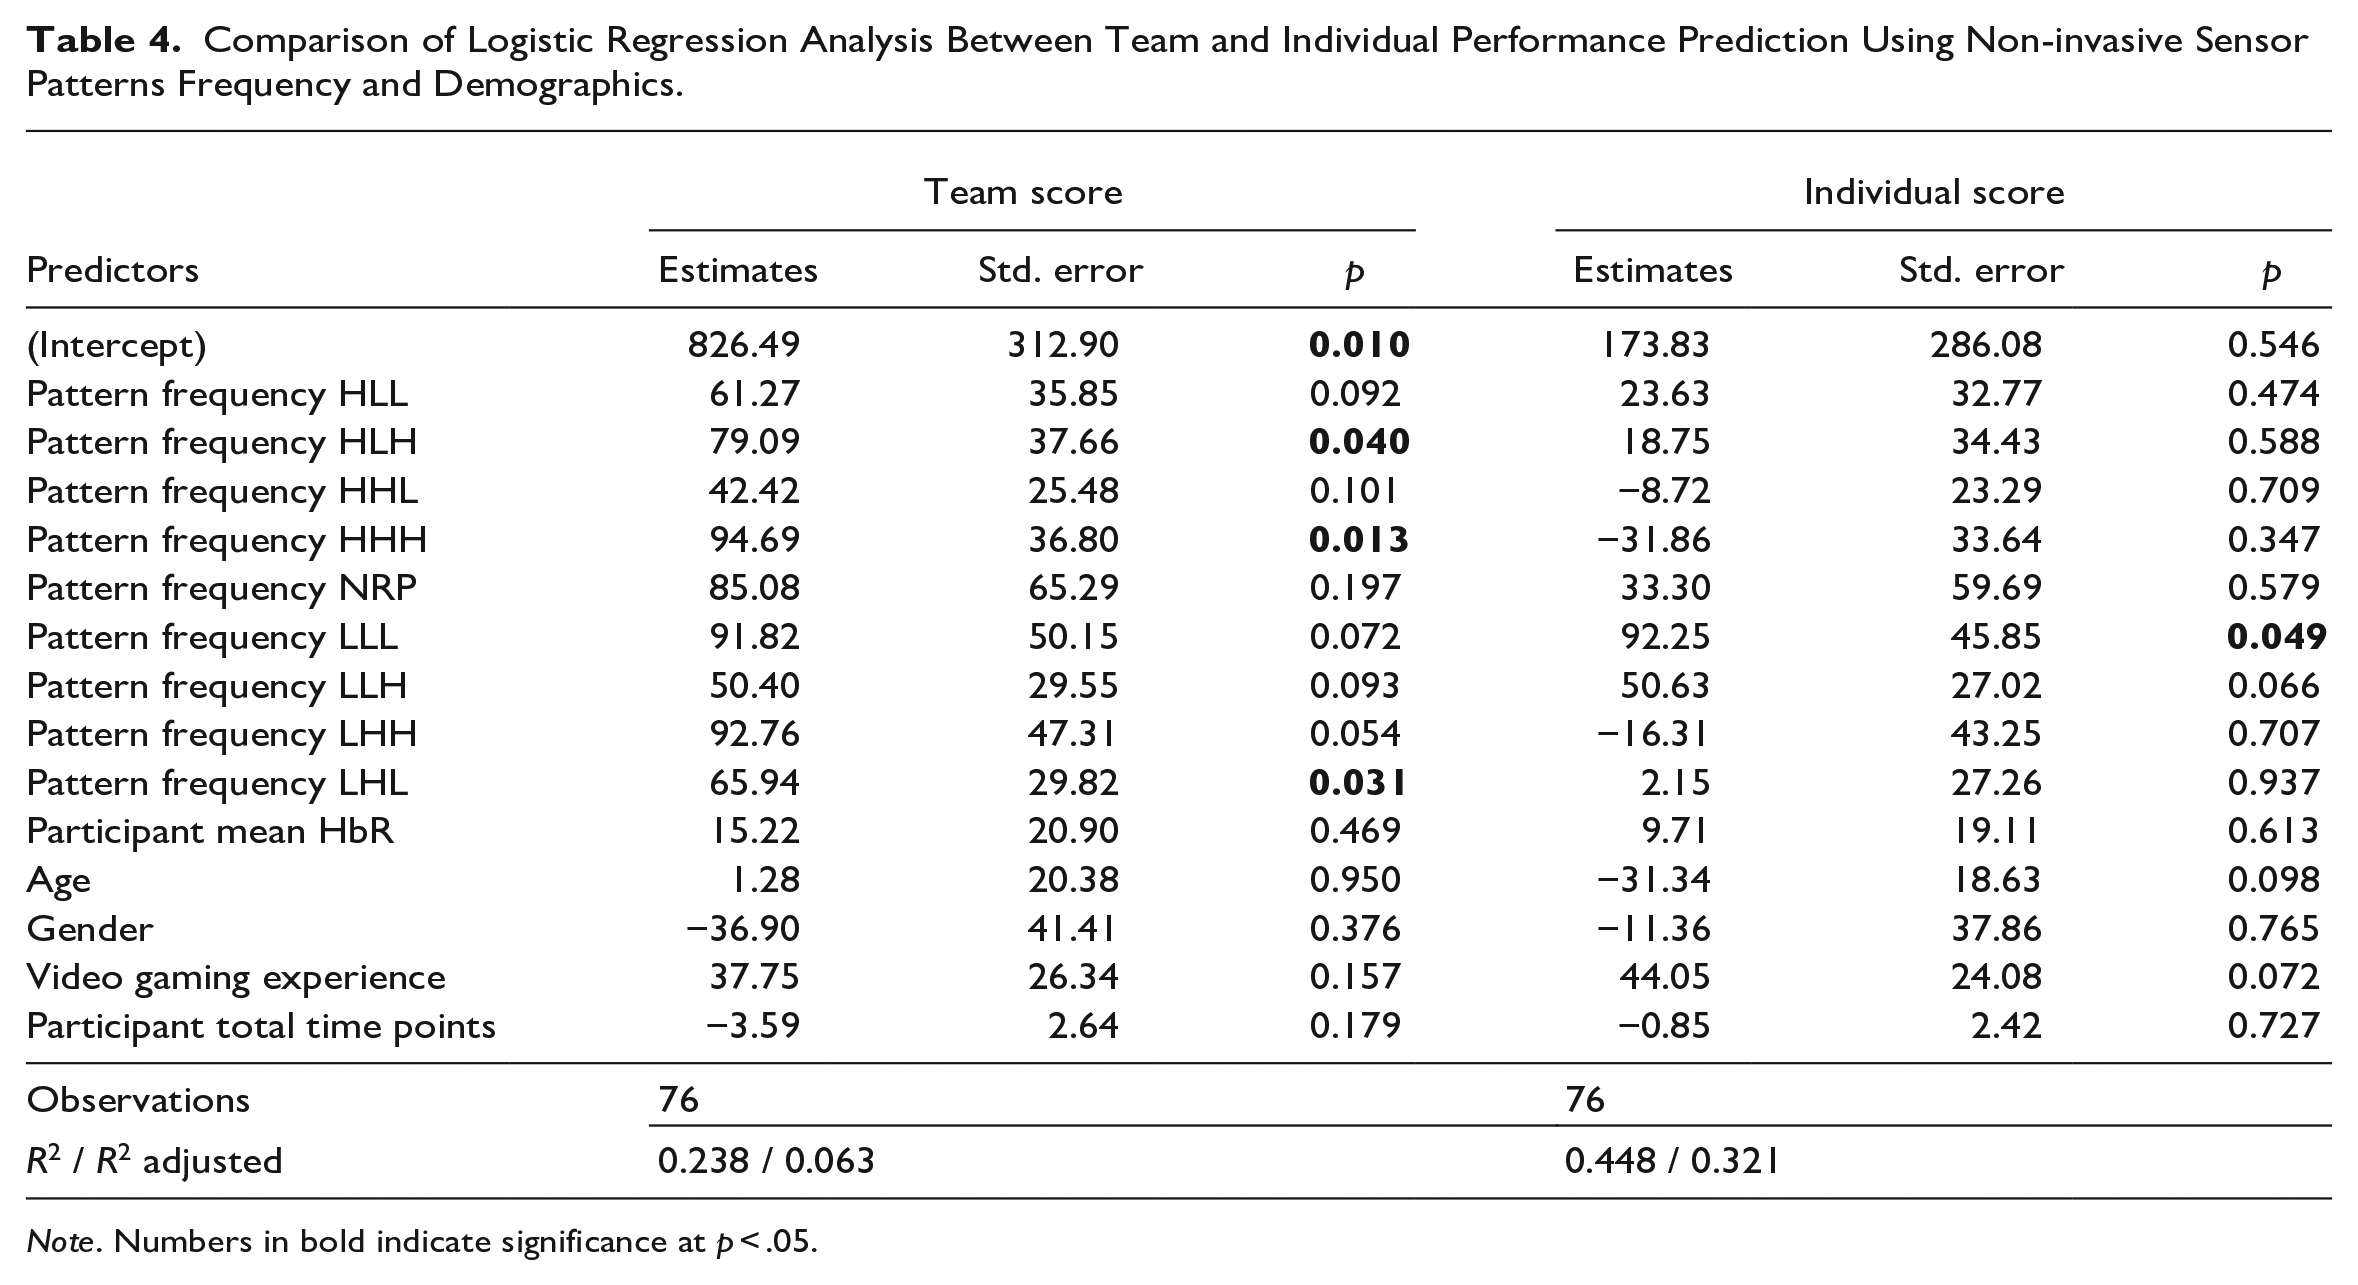
Note. Numbers in bold indicate significance at p < .05.
Discussion
This research elucidates how multimodal physiological measures reflect CWL dynamics, providing a method for near-real-time interpretable modeling of CWL in high-stakes environments. Not only does our multimodal measure with non-invasive sensors correspond to a traditional neurological measure of CWL, but our multimodal measure is also more predictive of individual and team performance than the neurological measure HbR. Thus, we showcase the effectiveness of incorporating behavioral and physiological data in detecting CWL within complex sociotechnical environments. We anticipate this approach may prove to be more scalable compared to relying solely on neurological measures.
Further, our emphasis on interpretable models allows us to pinpoint specific multimodal behavioral and physiological patterns that can serve as early indicators of impending workload changes. Notably, we identified different multimodal patterns associated with high versus low CWL, as well as patterns that corresponded most strongly with performance. Broadly speaking, the findings indicate a need for more research that examines how specific multimodal patterns correspond to different types of CWL-relevant contexts, for example physical discomfort versus mental panic. In other words, the multimodal patterns may have the added benefit of differentiating between different types of CWL states, with the potential to advance deeper understandings of CWL.
It is important to note some limitations with our approach. In particular, the pupillary response is to some extent confounded by eye movement, which can evoke a light reflex response. Still, we include pupillary response as a common CWL indicator and complement to the other CWL measures. Consistent with the brief format of the paper, we leave it to future work to include a detailed examination of specific patterns.
In conclusion, by integrating behavioral and physiological dynamics through MdRQA along with pattern analysis, our work has the potential to advance both understanding and measurement of CWL, while pointing the way for practical applications in team-based, high-stakes environments. These insights can inform the design of intelligent systems capable of timely interventions to manage CWL, thereby enhancing human-machine teaming and overall performance in complex sociotechnical settings. As such, they offer complementary capabilities to those being developed in human-AI teaming research, such as artificial social intelligence as a method for augmenting team cognitive processes (e.g., Bendel et al., 2024; Williams et al., 2022).
Footnotes
Declaration of Conflicting Interests
The author(s) declared no potential conflicts of interest with respect to the research, authorship, and/or publication of this article.
Funding
The author(s) disclosed receipt of the following financial support for the research, authorship, and/or publication of this article: Writing of this paper was partially supported by funding from Lockheed Martin Corporation contract LMC#MRA20-001-RPP006, Cognitive Offloading for Manned-Unmanned Teaming (MUM-T) awarded to the second and third author, and by the Defense Advanced Research Projects Agency (DARPA), under Contract No. W911NF-20-1-0008, Artificial Social Intelligence to Support Macrocognition in Teams, awarded to the third author. Any opinions, findings, and conclusions or recommendations expressed are those of the authors and do not necessarily reflect the views of these organizations or the authors’ affiliated University. We also thank Dr. Adarsh Pyarelal for his valuable insights into the comprehensive ToMCAT dataset used in this paper. Dr. Mary Jean Amon is now with Indiana University.