
Abstract
As technology advances, phishing attacks grow more vicious. Anti-phishing research has primarily focused on visual cues like domain names and contents, leaving visually impaired individuals particularly vulnerable. Recent studies suggest incorporating auditory alerts to enhance the detection of phishing threats. As a first step toward designing more inclusive phishing alerts, the current study examines the effectiveness of two types of audio alerts on individuals with normal or corrected-to-normal vision. Participants were randomly assigned to three alert conditions: control, earcon, and speech alert. Each participant went through 20 emails to indicate whether each email was legitimate. The results showed that participants in the two alert groups spent less time on each email than the control. Additionally, participants in the earcon condition showed a greater tendency to classify emails as phishing than those in the control condition. These results can inform the future development of auditory alerts for phishing.
Introduction
As technology continues to increase in capability and connectivity, phishing attacks adapt and become more complex in response. Phishing refers to a deceptive action involving impersonation to acquire information from a target (Lastdrager, 2014), with the objective to trick or mislead recipients into thinking that the message originated from a reliable or trustworthy source and giving out sensitive information (Sturman et al., 2023). According to Palatty (2023), roughly 3.4 billion phishing emails are sent daily. These phishing emails led to more than 300,000 victims falling prey in the U.S. in 2022, resulting in more than 52 million dollars lost in these attacks (Main & Bottorff, 2023). Consequently, much work is needed to improve phishing detection to better protect individuals from falling victim to these fraudulent attacks.
Current research efforts on anti-phishing aids and training have largely focused on the use of visual cues, such as color, icons, and placement of visual warnings to detect phishing (Alsharnouby et al., 2015; Chen et al., 2018b; Garcia et al., 2023; Petelka et al., 2019; Zhang et al., 2018). However, individuals with disabilities, particularly the visually impaired, are unable to utilize these visual cues effectively, rendering them increasingly vulnerable. Additionally, visually impaired users rely heavily on default email alerts that are not always compatible with screen readers, which they use to access content on their electronic devices (Yu et al., 2023). Several recent studies have proposed that it might be beneficial to incorporate auditory alerts to further protect users from phishing attacks (Cooper et al., 2021; Datta et al., 2021; Yu et al., 2023). Cooper et al. (2020) asked 32 subject matter experts (those with experience in cyber security or information technology) to rate the auditory prototypes they developed for alerting users of phishing emails. They found that the most effective prototype was providing users auditory descriptions of the phishing cues (e.g., misspelling), presented immediately after they opened the emails (Cooper et al., 2020). Cooper et al. (2021) tested some of the prototypes (a few combinations of haptics, visual, and audio cues) on users and found that combined audio and visual warnings are the most effective in helping users detect phishing emails. However, they did not have an audio-only condition or distinguish between different types of audio alerts.
Expertise and gender have been identified as two factors that affect phishing susceptibility (Carrol et al., 2022). Moreover, people between the ages of 18 and 25 with limited technology knowledge were more likely to fall for phishing emails (Sheng et al., 2010). Based on the particular vulnerability of this age group and expertise level, the current study employed an empirical approach to test the effectiveness of two types of audio alerts on college students who were non-expert users. One type is a speech alert and the other is an earcon, the latter of which is an abstract sound that has no relationship to the referent (Nees & Liebman, 2023). Audio alerts offer advantages to individuals with visual impairments and those with normal vision, particularly when their visual attention is engaged in other on-screen tasks. This study utilized individuals with normal or corrected-to-normal vision as a first step toward understanding the most effective auditory cues that help individuals detect phishing.
Method
Subjects
A total of 142 participants were recruited via an online participant recruitment system, SONA (https://rice.sonasystems.com), at Rice University. This number was based on a prior power analysis using G*Power (Faul et al., 2007) to achieve a power of 80% with ⍺ = .05. All participants reported normal or corrected-to-normal vision and hearing. This research was approved by the Institutional Review Board at Rice University.
Out of the 142 participants, seven participants in the speech condition, eight in the earcon condition, and 14 in the control condition failed an attention check and thus were excluded from subsequent data analyses. The mean age for the remaining 113 participants was 19.48 years (SD = 1.17). Participants self-reported their gender: 82 identified as female, 29 identified as male, and 2 identified as non-binary. Additionally, 43.36% identified as Asian, 22.12% identified as White, 12.39% identified as Black/ African American, 12.39% identified as Hispanic/ Latino, and 9.73% identified as Other. Of the 113 participants, 55.75% reported having no cybersecurity-related experience, 39.82% reported having some experience, and 4.42% reported having cybersecurity-related experience. In addition, all participants reported using emails and computers daily or almost daily.
Apparatus and Stimuli
Each participant reviewed 20 email images (half phishing, half legit) on their own device. All the email images were adapted from a previous study (Chen et al., 2018a). The phishing emails were edited from legit emails to have suspicious/ wrong sender addresses (e.g., “google” was misspelled as “gooqle”). An additional email image from Chen et al. (2018a) was used as an attention check. The attention check was formatted the same as the other questions, except that the prompt was “select yes if you are paying attention,” and the two options were “yes” and “no.” Only those who answered “yes” to this question were considered valid responses.
Two types of auditory alerts were used. The alerts were a female voice saying “phishing alert” for the audio-speech group and a high-pitch (approximately 557 Hz) tone for the audio-earcon group. The two alerts were manipulated to be of the same length (1 s).
The auditory alerts were presented when some email images appeared on the screen, indicating that it was a phishing email. In both the speech and earcon alert groups, the auditory alert system was designed to have an approximately 90% correct rejection rate with phishing emails and 42% false alarm rate with legitimate emails (Zhang et al., 2018). This meant that out of the 10 legitimate emails, four emails were accompanied by an auditory alert. The rest of the six legitimate emails were not accompanied by an alert. In addition, out of the 10 phishing emails, one email was not accompanied by an auditory alert. The rest of the nine phishing emails were accompanied by auditory alerts correctly. These auditory alerts were designed not to be always accurate to deter the participants from deciding whether an email was legitimate or phishing solely based on the alerts.
Experimental Design
This study used a between-subject experimental design. The independent variable was audio-alert type (control, audio-speech, or audio-earcon between-subjects), with participants’ phishing detection performance as the dependent variable.
Participants’ phishing detection performance was measured via hit rate, false alarm rate, response criterion, and response sensitivity, as well as the response time of classifying the emails. Based on the signal detection theory (Macmillan & Creelman, 1991), hit rate was calculated by dividing the number of correctly identified phishing emails by 10, the total number of phishing emails. False alarm rate was calculated by dividing the number of incorrectly identified legitimate emails by 10, the total number of legitimate emails. Response sensitivity (d’, participants’ ability to distinguish phishing emails from legitimate emails) and Response criterion (c, participants’ bias in classifying emails as legitimate or phishing) were then calculated and analyzed based on the hit rate and false alarm rate (Stanislaw & Todorov, 1999). Response time was measured as the time elapsed between the onset of the email image and when participants made a response regarding the legitimacy of the email.
Procedure
Participants received the experiment link remotely and performed the study on their own devices. At the beginning of the experiment, they were instructed to use laptops/desktops only and turn their volume to 50%. Participants also answered questions regarding their age, gender, ethnicity, and how much experience they had with technology and cybersecurity.
Then, they were instructed to read the definitions of phishing emails and the signs of phishing. Before they could continue with the study, they had to answer two follow-up questions testing the correct definition and signs of phishing. Additionally, the two audio-alert groups were instructed that they had been given an anti-phishing alert tool to assist them, although the tool was not perfect.
After the previous steps, participants in all three groups were instructed to play the role of someone named Julie Smith and classified 20 emails in Julie Smith’s inbox as either phishing or legitimate. Each email was presented 9 s before they could choose to continue. The time limit of 9 s was chosen because a report has shown that people spent an average of 9 s on an email (2022 Trends in Email Engagement, Litmus, 2022). The 20 email images and one attention check were presented via Qualtrics, and the presentation sequence was randomized for each participant. The participants only saw one email image at a time. Additionally, the auditory alerts, for those in the audio-speech and audio-earcon conditions, were designed to play automatically as soon as the email image loaded.
After viewing and classifying the 20 emails as legitimate or phishing, participants were instructed to indicate whether they based their decisions on the audio alerts or email images on a sliding scale of 0 to 100 (0 = audio alerts alone, 50 = a balanced mix of both, and 100 = email images alone). Additionally, participants in the two audio-alert groups indicated how much they trust the audio alerts on a sliding scale of 0 to 100 (0-Distrust, 50-Neutral, 100-Trust).
Results
Using Levene’s test, the dependent variables of hit rate, false alarm rate, response sensitivity, and response criterion passed the assumption check of homogeneity. Thus, analyses of variance (ANOVAs) with the alert condition as a between-subject factor were conducted on these dependent variables, with an alpha level of .05. There was a significant difference in the hit rate across conditions, F (2, 110) = 3.52, p = .033, η2 = .06 (see Figure 1). Planned contrast analyses were conducted to compare the different audio-alert conditions further. There was no significant difference between the control condition (M = 0.39, SD = 0.22) and the two audio alert conditions, t (110) = 1.67, p = .098, Cohen’s d = 0.16. However, there was a significant difference between the earcon (M = 0.52, SD = 0.25) and speech alert condition (M = 0.41, SD = 0.19), t (110) = 2.15, p = .034, Cohen’s d = 0.41. Participants who received earcon alerts had higher hit rates at identifying phishing emails than the participants who received speech alerts.
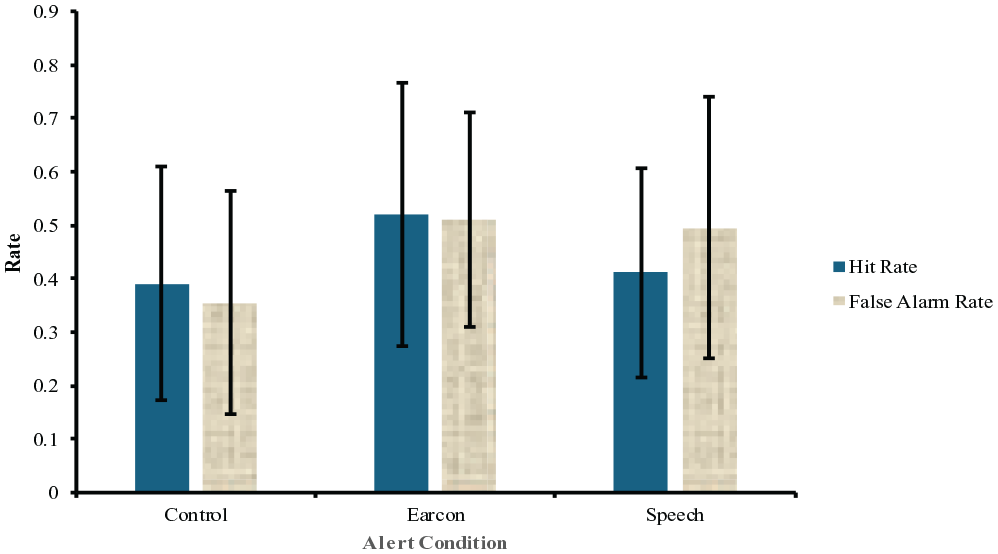
Participant performance in hit rate and false alarm rate. Error bars represent ±1 standard deviation of the mean.
The ANOVA on the false alarm rate showed a significant effect of the audio-alert manipulation, F (2, 110) = 5.51, p = .005, η2 = .09 (see Figure 1). The contrast analyses showed a significant difference between the control condition (M = 0.36, SD = 0.21) and the two audio alert conditions, t (110) = 3.32, p = .001, Cohen’s d = 0.63. The two alert conditions had higher false alarm rates compared to the control condition. However, there was no significant difference between the earcon (M = 0.51, SD = 0.20) and speech alert condition (M = 0.50, SD = 0.24), t (110) = 0.32, p = .749, Cohen’s d = 0.06.
Response sensitivity (d’) was calculated by subtracting the normalized false alarm rate from the hit rate. Based on correction suggestions, 0.5 was added to the number of hits, and 1 was added to the number of signals and noise to accommodate either hit rate or false alarm rate being 0 or 1 (Chen et al., 2021; Hautus, 1995). A higher absolute value of d’ indicates that participants were better at differentiating between phishing and legitimate emails, while a d’ of zero signifies performance at the chance level. No significant difference was found in response sensitivity (d’) across the control (M = 0.11, SD = 0.60), earcon (M = 0.03, SD = 0.66), and the speech alert condition (M = −0.21, SD = 0.65), F (2, 110) = 2.74, p = .069, η2 = .05
Response criterion (c) was calculated by dividing the addition of normalized false alarm rate and hit rate by −2 (Stanislaw & Todorov, 1999). The correction used in the analysis of d’ was also applied here. A larger c means that the participants were conservative (i.e., more likely to report an email as legitimate), and a smaller c means that the participants were more liberal (i.e., more likely to report an email as phishing). According to the ANOVA on response criterion (c), there was a significant effect of the audio-alert manipulation, F (2, 110) = 5.64, p = .005, η2 = .09. The contrast analyses showed a significant difference between the control (M = 0.34, SD = 0.48) and the two alert conditions, t (110) = 2.57, p = .012, Cohen’s d = 0.49. Nevertheless, there was no significant difference between the earcon (M = −0.05, SD = 0.50) and speech alert condition (M = 0.12, SD = 0.47), t (110) = 1.51, p = .134, Cohen’s d = 0.29.
To identify the outliers in response time, the 1.5 IQR method (Rousseeuw & Hubert, 2011) was employed by setting the lower and upper cutoffs to (median of the first quartile −1.5*IQR) and (median of the third quartile +1.5*IQR), respectively. Data outside of this range were defined as outliers, which were then replaced by the mean of non-outlier data in each condition separately. The response time data did not pass Levene’s test of homogeneity. Using Welch’s correction (Welch, 1938) to the ANOVA, there was a significant difference in response time across the conditions, F (2, 65.60) = 5.97, p = .004, η2 = .15 (see Figure 2). Contrast analyses showed a significant difference between the control (M = 20.90 s, SD = 10.26 s) and the two alert conditions, t (110) = 15.34, p < .001, Cohen’s d = 1.46. Participants who did not receive audio alerts spent significantly more time on each email image compared to those who received audio alerts. There was no significant difference between the earcon (M = 14.65 s, SD = 3.69 s) and speech alert condition (M = 15.82 s, SD = 3.76 s), t (110) = 0.78, p = .439, Cohen’s d = 0.07.
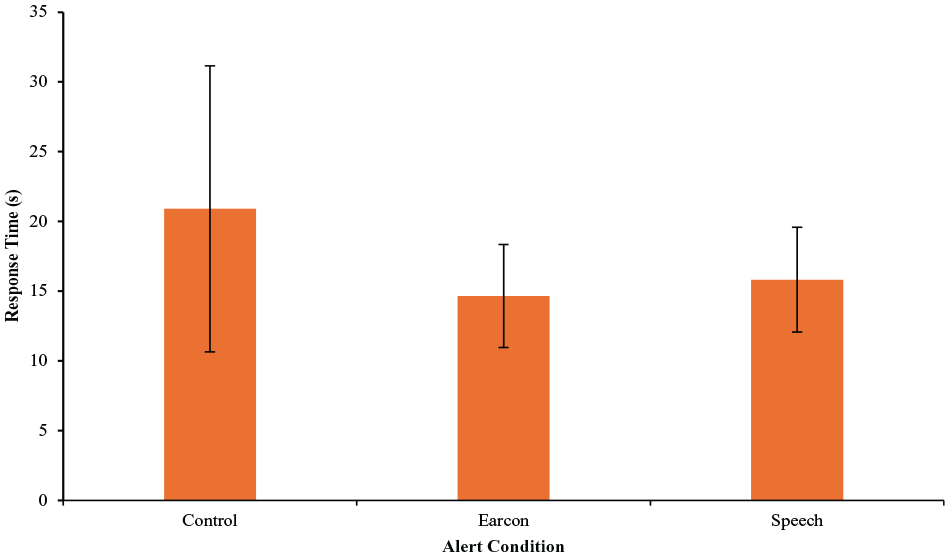
Response time across conditions. Error bars represent ±1 standard deviation of the mean.
The participants in the earcon and speech alert conditions also answered questions about their level of trust in the audio alerts, and how much they based their decisions on email images or audio alerts, both on scales of 0 to 100. The overall level of trust (M = 28.69, SD = 20.90) fell below the neutral mark of 50, t (76) = 8.95, p < .001, Cohen’s d = 1.02. Using Welch’s independent t-test, there was no significant difference in participants’ level of trust between the earcon (M = 33.37, SD = 24.90) and speech alert condition (M = 24.79, SD = 16.17), t (64.37) = 0.95, p = .343, Cohen’s d = 0.41.
Similarly, there was no significant difference in how much participants based their decisions on email images or audio alerts between the earcon (M = 72.11, SD = 24.83) and speech alert condition (M = 79.62, SD = 21.23), t (66.84) = 1.41, p = .164, Cohen’s d = 0.32. In both alert conditions, participants indicated a greater reliance on email images than audio alerts. This comparison was reflected by a mean score (M = 76.21, SD = 23.09) significantly higher than the neutral point of 50 on a scale from 0 (audio alerts only) to 100 (email images only), t (76) = 17.85, p < .001, Cohen’s d = 1.14.
Discussion
This study found that the group that received the earcon alert (a high-pitch tone) performed significantly better at correctly identifying phishing emails, compared to the speech-alert (a voice) group. This result indicates that earcon can be more effective in alarming users of phishing emails, potentially due to its simplicity or high frequency. This result contradicted Cooper et al. (2020) findings, in which experts rated speech alerts to be more helpful than earcon alerts. However, Cooper et al. (2020) employed speech alerts that were voice-over descriptions of the phishing signs, which were more informative than the current study’s speech alert, which was a female voice saying “phishing alert.” Thus, the speech alerts in the current study might have failed to provide the benefits predicted by Cooper et al. (2020) because of the lack of information.
Additionally, a possible reason for the difference in hit rate between the two alerts could be that participants perceived the earcon to be more urgent compared to the speech alert. This explanation is partially supported by Kenny and Wei’s (2009) finding that people perceive sounds with higher frequency and higher volume to be more urgent than sounds with lower frequency and lower volume. Sabic et al. (2017) also compared car warnings in the form of spearcons, text-to-speech, and auditory icons, and found that the alert type affected sense of urgency. In the current study, the earcon had a higher average frequency (557 Hz) than the speech alert (360 Hz), which might lead the earcon to sound more urgent.
Both alert groups were more likely to identify a legitimate email as phishing than the control group. Since the false alarm rate was designed to be 42% (having an alert even when the email is legitimate), it was likely that the participants were led by the auditory alerts to indicate an email as phishing, resulting in a higher false alarm rate in their performance. This finding can be explained by automation bias. Past literature has repeatedly found evidence for automation bias, which is the tendency to favor suggestions made by automated systems despite an absence of evidence (Skitka et al., 1999; Goddard et al., 2012). In the current study, participants might decide that an email is phishing when they hear an alert, despite finding no evidence to support that judgment. Nevertheless, since the phishing detection technology has advanced over the years, they have become more accurate. Thus, future studies should consider using a lower false alarm rate in testing the effectiveness of auditory alerts.
Using the signal detection theory, no significant difference in response sensitivity (d’) was found across conditions. This could be due to the difficulty of finding signs of phishing in the email images. The small typos in senders’ addresses can be very subtle and easy to miss for an untrained eye. Because these signs of phishing were subtle, participants might have missed them, regardless of whether they received auditory alerts or not. Future studies may consider employing more obvious phishing signs (such as using the wrong name to address the user) and experimenting with different types of phishing (e.g., asking for sensitive information or baiting the user to click on suspicious links).
In addition, the two alert groups spent significantly less time classifying each email, compared to the control group. This result is consistent with past studies showing that alerts help reduce reaction time (Wiese & Lee, 2004; Wu et al., 2018). Even though participants reported not trusting the audio alerts and relied more on email images, the difference in response time showed that they still employed the alerts in making decisions on the legitimacy of the emails.
The results of this study have practical significance for individuals with normal vision and, to some extent, those who are visually impaired. Our results showed that the audio alerts could benefit the users in identifying phishing emails more timely. Based on the current results indicating the potential effectiveness of auditory alerts in phishing detection, future research can validate this finding with visually impaired individuals. Future studies should also investigate the effectiveness of other auditory alert types and the effects of different sound characteristics, such as frequency and content. The results of this study provide valuable insights for more inclusive anti-phishing technology.
Footnotes
Declaration of Conflicting Interests
The author(s) declared no potential conflicts of interest with respect to the research, authorship, and/or publication of this article.
Funding
The author(s) received no financial support for the research, authorship, and/or publication of this article.