
Abstract
Publication bias and questionable research practices can inflate the perceived credibility of reported scientific findings and lead to low replicability. This preregistered study aimed to estimate the evidentiary value of empirical findings published in the journal Human Factors (2017–2023) using two meta-analytic methods: p-curve analysis to examine the distribution of significant p-values and Bayesian mixture modeling of p-value distributions to gauge the degree of contamination from the null hypothesis. Empirical findings from 62 articles were included in the analyses. P-curve results indicated evidential value, ruling out high levels of selective reporting as an explanation for significant results. Mixture modeling estimated a 25% contamination rate by the null hypothesis among significant p-values. Results document the quality of empirical evidence reported in Human Factors.
Keywords
Over the past decade, large-scale, high-powered replication efforts have revealed troubling rates of irreplicability in the scientific literature. For instance, across several fields, including the social and biological sciences, roughly a third of replications fail to produce a significant effect in the same direction as the original finding (Camerer et al., 2016, 2018; Ebersole et al., 2016; Open Science Collaboration, 2015). When findings do replicate, they generally yield substantially smaller effect sizes than originally reported (Open Science Collaboration, 2015).
Some false positive results in the literature are the natural result of scientists formulating and testing risky hypotheses that turn out to be false (Bird, 2021). This alone, however, is unlikely to fully explain low replication rates and exaggerated effect sizes (Autzen, 2021). Publication bias, a reluctance to publish null results, and selective reporting, the tendency to omit negative results from published reports, can make reported effects appear more consistent than they are and inflate average reported effect sizes (Ioannidis et al., 2014). Questionable research practices (QRPs) (i.e., p-hacking) can further be exploited to push results in the direction of statistically significant findings (Simmons et al., 2011), contaminating the published record with spurious or weaker-than-stated effects.
Concern about inflated or non-replicable findings has motivated the development of meta-analytic methods (e.g., Bartoš & Schimmack, 2022; Gerber & Malhotra, 2008; Gronau et al., 2017; Simonsohn et al., 2014) to assess the credibility of the published literature. The current preregistered study used two of these methods to assess the evidentiary value of findings published in Human Factors.
The first approach, termed p-curve (Simonsohn et al., 2015), determines whether or not a set of statistically significant p-values is likely to be the result of selective reporting. If p-curve rules out selective reporting as the sole explanation for a set of significant results, then the data are concluded to contain evidential value. P-curve is based on the distribution of significant p-values and operates on the following principles: (a) in the absence of a true effect, p-values are uniformly distributed, and (b) in the presence of a true effect, smaller p-values are more likely than larger p-values, and therefore should yield a right-skewed distribution. It follows that a right-skewed distribution of statistically significant p-values gives evidence that findings were driven by true effects, whereas a relatively flat distribution implies that significant findings might have been spurious. In the most extreme case, a left-skewed distribution, with values bunching just below p = 0.05, implies that finding might have been “hacked” just past the threshold of significance. P-curve is designed to draw inference from the results of multiple studies and requires only a modest sample of p-values (Simonsohn et al., 2014) to detect evidential value.
The second approach uses Bayesian estimation to model a distribution of significant p-values as a mixture of two basis distributions, one corresponding to true effects and the other corresponding to false-positive effects (Gronau et al., 2017). Like p-curve, the mixture model assumes that p-values from the null hypothesis take on a uniform distribution and that those from the alternate hypothesis take on a right-skewed distribution. It then uses a Markov chain Monte Carlo (MCMC) sampling procedure to estimate the parameters of the basis distribution of true effects and the contamination rate of p-values that arise from the null hypothesis, termed the H0 assignment rate. Finally, it estimates the probability that each specific p-value in the data set originated from the null distribution.
Present Study
The present study sought to assess the evidential value of findings published in the journal Human Factors in the years 2017 through 2023 using a pair of converging and complementary meta-analytic methods. Specific aims were as follows:
Aim 1: Use p-curve to estimate the evidentiary value of empirical articles published in Human Factors.
Aim 2: Use Bayesian mixture-modeling to gauge the extent to which findings published in Human Factors are contaminated with p-values from the null hypotheses.
Method
Methods were preregistered and data are available for download at the Open Science Framework (osf.io/gkcyu).
Articles were randomly sampled for data extraction from a list of all publications in Human Factors over the years 2017 to 2023. The interval 2017 to 2023 was chosen simply to represent a reasonable sample of recent journal contents. To be included, an article had to be classed as a primary empirical report of data and had to report raw test statistics from which an exact p-value could be recalculated. Each article was examined by two independent coders who were trained to complete the following steps:
(1) Classify the article as a notice, acknowledgment, corrigendum, erratum, preface, commentary, literature/scoping review, meta-analysis, model-fitting or methodological development, primary report of empirical data, replication, re-use/secondary analysis, or “other,” and retain the article for analysis only if it was classed as a primary report of empirical data.
(2) Check for the presence of p-values, and retain the article for further analysis only if it reported one or more p-values.
(3) Record the primary hypothesis, operationalized as the first-reported hypothesis.
(4) Record the summary test statistic corresponding to the hypothesis identified in step 3. If no hypothesis could be identified, record the first theory-relevant statistical test.
(5) Identify the type of analysis used to produce the test statistic recorded in step 4.
(6) Report the sample size for the study.
(7) Repeat steps 3 through 6 for all studies reported in the paper.
If coders were discrepant on any of the target metrics, the article was flagged for review by two senior coders and/or the lead investigator. All disagreements were resolved following independent examination of the article and discussion among senior coders and the lead investigator.
We aimed to examine at least 100 articles for inclusion in the present analyses. Of the 652 articles published in Human Factors in 2017 to 2023, a random sample of 139 articles (21.32%) were examined. Of these, 79 articles met inclusion criteria. However, some articles failed to report exact p-values or the raw test values needed to recover exact p-values. For such articles, we recorded the reported p-values but did not include them in our analyses, since both p-curve and Bayesian mixture modeling analyses require exact p-values. Other articles were excluded since they reported no statistically significant p-values, as both p-curve and the Bayesian mixture modeling approach stipulate that only significant p-values are included the analysis. Thus, the final sample consisted of 64 articles, some of which reported multiple experiments, totaling 69 raw test results.
Data were analyzed using R-based web applications created for p-curve (Simonsohn et al., 2014) and Bayesian mixture modeling (Gronau et al., 2017), available at https://www.p-curve.com/app4/ and https://qfgronau.shinyapps.io/bmmsp/, respectively.
Results
The proportion of examined articles from different publication years was balanced (2017: 14%; 2018: 13%; 2019: 14%; 2020: 14%; 2021: 14%; 2022: 15%; 2023: 16%). Of the 69 extracted test statistics, two were re-calculated as having ps > .05, despite being reported as p < .05 in the text and were thus not included in analyses, bringing the final number of analyzed tests to 67.
Aim 1: P-curve
Visually, the observed distribution of p-values appeared to be right-skewed (Figure 1). Binomial tests indicated that the observed proportion of p-values under .025 (84%) was significantly larger than the expected proportion (50%) assuming all true null effects (p < .0001). Continuous tests were obtained by calculating the probability of at least as extreme a p-value for each of the observed test results (i.e., the p-value of the p-value, termed “pp-value”) and then aggregating using Stouffer’s Method to assess the full curve (Z = -22.13, p < .0001; Simonsohn et al., 2014). We additionally examined the distribution of p-values under half the p-curve (i.e., the distribution of p-values ≤ .025.), an approach that is much more robust to ambitious p-hacking, (Z = −22.79, p < .0001). The distribution of values under the full p-curve and the half p-curve indicated that the observed p-curve was not flatter than what would be expected if the studies were powered at 33% (Z = 15.51, p > .9999; Z = 21.49, p > .9999).
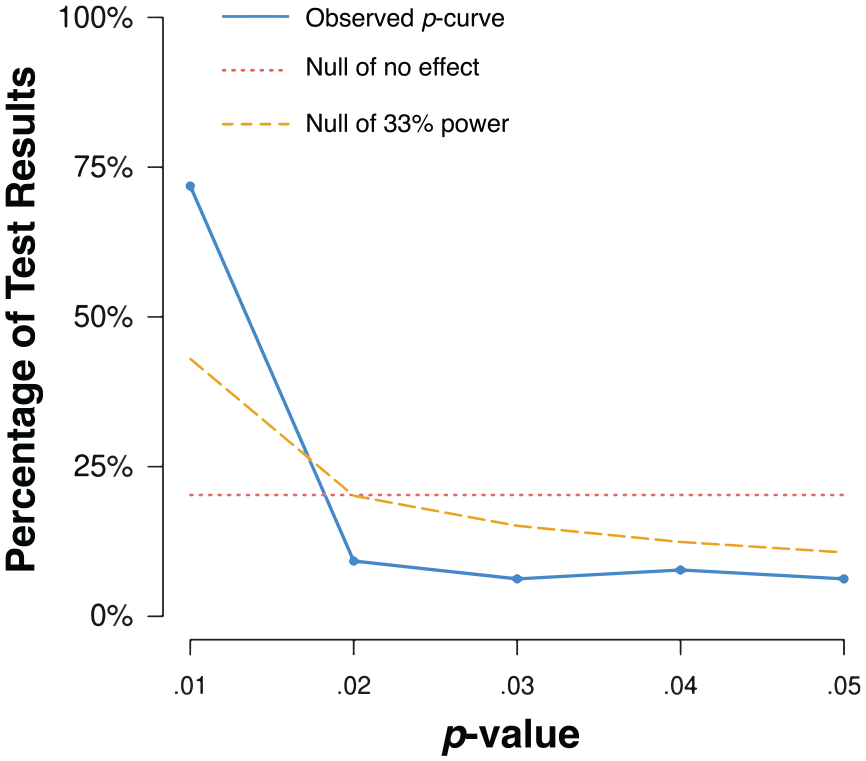
Distribution of significant p-values. The solid blue line indicates the distribution of significant p-values. The dotted red line indicates the distribution of p-values in the absence of an effect. The dashed yellow line indicates the distribution of p-values under 33% power.
Sensitivity analyses were run by incrementally dropping the most extreme p-values (i.e., either the smallest or largest significant p-values). The app tested removal of up to 32 of the most extreme p-values and examination yielded no changes in the results.
Aim 2: Bayesian Mixture Modeling
We adopted default priors for the H0 assignment parameter and for the mean and standard deviation of the p-values under H1 (Gronau et al., 2017). Convergence of the mixture model was assessed through visual inspection of the MCMC chains and a check on the R-hat statistic. Analyses yielded thoroughly intermixed chains (Figure 2) and an R-hat value of 1.00, indicating convergence (Gelman & Rubin, 1992).
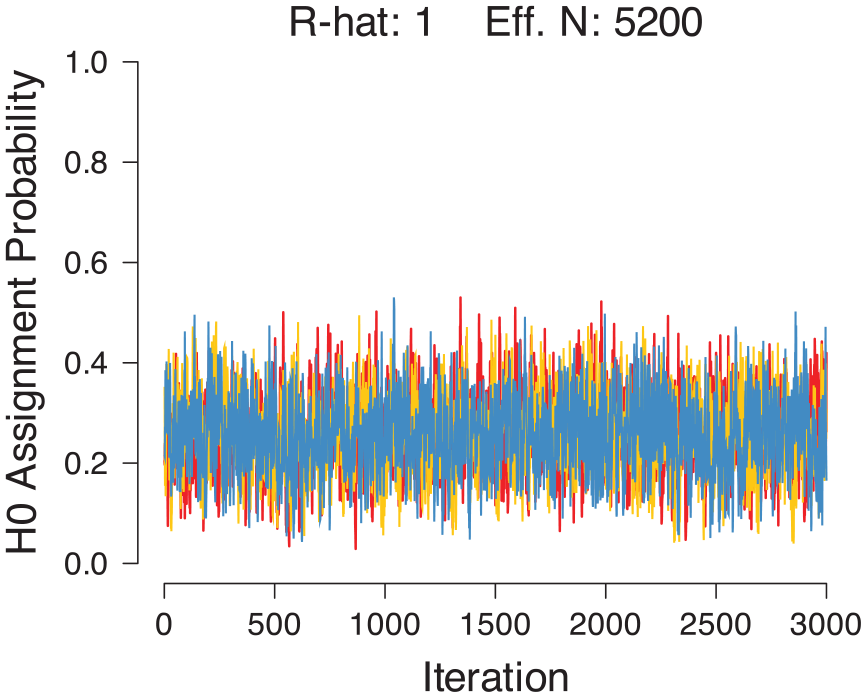
Trace plot of MCMC chains for the H0 assignment rate.
Quality of fit was evaluated using a Q-Q plot, wherein a perfect model fit would trace the dashed diagonal line (Figure 3).
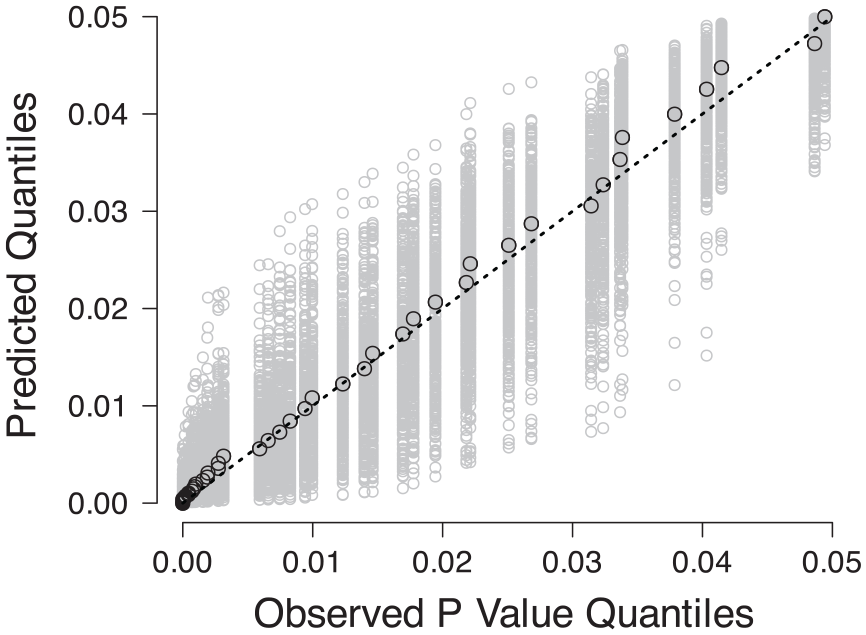
Q-Q plots comparing the observed p-value quantiles to the predicted quantiles. The black circles indicate the best fit and the gray circles indicate uncertainty.
The contamination rate was estimated to be near 0.25, with a Bayesian 95% highest density interval ranging from 0.12 to 0.40 (Figure 4). P-values larger than about .014 had a greater than 50% probability of being assigned to the null hypothesis (Figure 5). Sensitivity checks varying the prior standard distribution for H1 indicated a lower bound on the mean contamination rate of 0.11.
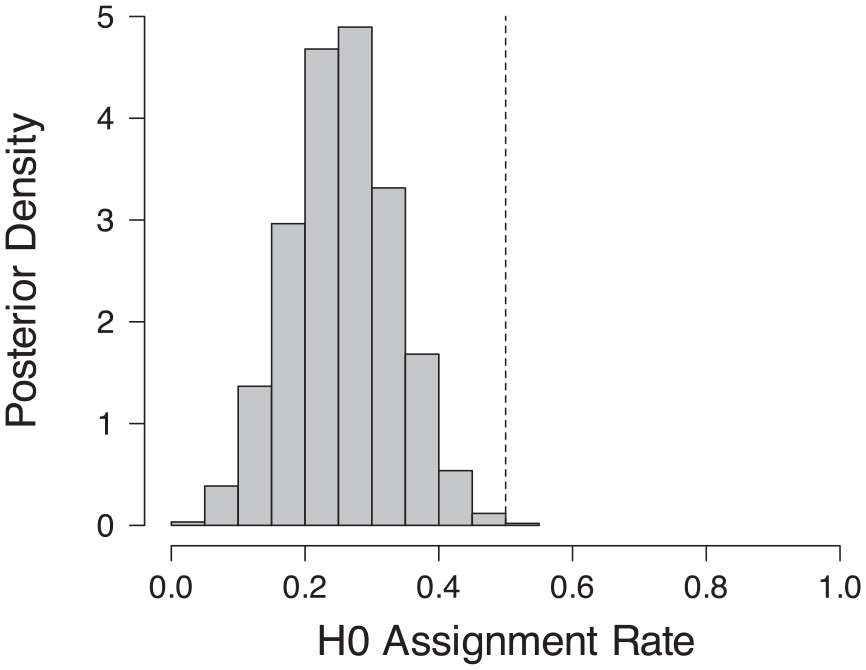
Posterior distribution of the H0 assignment rate.
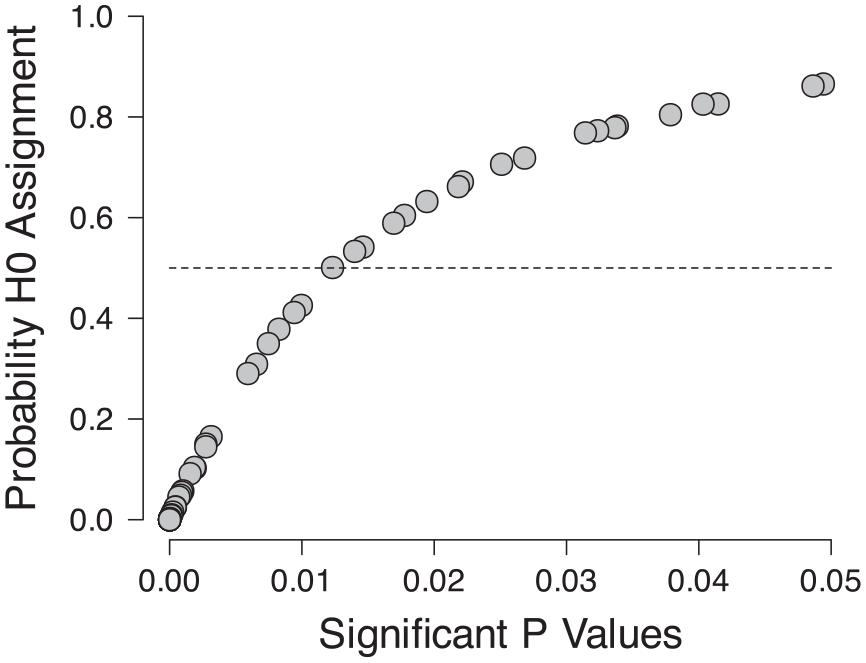
Probability of assignment to the null hypothesis for individual p-values.
Discussion
The present study sought to evaluate the evidential value of articles published in Human Factors between 2017 and 2023 using p-curve and Bayesian mixture modeling. Results from the p-curve analysis reveal that the examined findings have substantial evidential value, and results from the mixture model demonstrated a modest contamination rate of p-values originating from the null hypothesis.
We also observed several articles with null target effects, confirming that statistically significant findings are not a strict prerequisite for publication. Altogether, this pattern implies that empirical research published in Human Factors is generally robust against concerns of highly selective reporting and aggressive p-hacking.
These findings are reassuring but come with limitations. First, as necessitated by the methods we employed, we excluded non-significant p-values, even those very close to the significance threshold (e.g., p = .051), from our analyses. Such p-values are infrequent in the presence of a true effect but can be inappropriately rounded down (John et al., 2012) to support the presence of an effect, making them especially relevant to assessments of untrustworthy evidence. More generally, although p-curve and the Bayesian mixture modeling approach document evidential value, they are restricted to significant results and thus do not provide information about the relative frequency of significant and non-significant p-values. Second, the analyses we used do not assess other meaningful aspects of empirical findings beyond evidential value, such as internal validity, and thus should not be used as the sole index of empirical quality. Finally, our analyses gathered and combined data from across different subareas of research published in Human Factors. Though they indicate that reported empirical findings in general contain evidential value, they do not guarantee that all subdisciplines or areas of study represented in the journal are equally strong.
Given these limitations, future work should pair the presented techniques with alternative meta-analytic approaches intended to gauge other metrics of credibility (Adler et al., 2023; Bartoš & Schimmack, 2022). Further, in collecting data, we discovered inconsistencies in how statistical results were reported, causing us to exclude several articles. This inconsistency hinders efforts to recalculate essential metrics for meta-analytic work. Guidelines to better standardize reporting practices for authors can facilitate future meta-analytic and forensic studies.
Footnotes
Declaration of Conflicting Interests
The author(s) declared no potential conflicts of interest with respect to the research, authorship, and/or publication of this article.
Funding
The author(s) received no financial support for the research, authorship, and/or publication of this article.