
Abstract
With the increased integration of robots into industrial, service, and educational spaces, it is imperative to understand factors that influence human-robot interactions. While the existing literature has explored human perception of robot-produced verbal communication, there is a notable gap in understanding how adults process robot-produced nonverbal communication. Current research focuses on subjective measures of the individual’s perception of robots during interactions, but often fails to have objective measures or control groups in their designs which limits the conclusions that can be made. In this study, we aim to implement a design that allows for the comparison of robot and human nonverbal communication understanding and perceiving through both objective eye-tracking measures and subjective survey measures. This design should prove useful to gain insights into how people understand information provided by robots and humans when watching their nonverbal gestures, and their perceptions of the agents after their interactions.
Keywords
Introduction
Due to the increased global utilization of robots, there is a rising need to understand how and why individuals choose to interact with robots. Effective human-robot communication is an important factor for integrating robots into social spaces, but few studies have investigated an individual’s comprehension of a robot’s ability to provide information nonverbally. Nonverbal communication including body language, facial expressions, and gestures, plays a crucial role in transferring information during both human-human interactions and human-robot interactions (Hall et al., 2019; Salem et al., 2013). However, research indicates that there may be perceptual differences in which individuals perceive robot-produced gestures as less effective in comparison to human-produced gestures (Quintero et al., 2015). The differences in how individuals process robotic-produced gestures needs further exploration to improve future human-robot interactions.
Another key factor in the effective utilization of robots is establishing trust in robotic agents. An individuals’ willingness to have future interactions with robots is largely influenced by how trusting they are of robots (Schaefer et al., 2012). Attributes of individuals, such as an individual’s propensity to trust, and attributes of the robot, such as its perceived anthropomorphism, animacy, intelligence and likability, contribute to how people perceive robots as trustworthy or untrustworthy (Hancock et al., 2011). Few studies have looked at direct comparisons in trust ratings to robots and humans during situations in which participants are receiving nonverbal information, and explored how trust is affected in these circumstances. When unsure of the competencies of the robot or human, participants have shown differential trust ratings across studies. In some cases, individuals were equally trusting of humans and robots during interactions, but in others individuals were more trusting of highly anthropomorphic robots than of humans (Parenti et al., 2023; Zonca et al., 2023). The following study aims to explore both receptivity to information from a robotic agent in comparison to a human agent, and the associated perceived trust ratings.
Method
Participants
This study was approved by Florida Atlantic University’s Internal Review Board and college students were recruited from the university’s research participant pool. Participants were provided with a consent form to read and sign and were given class credit as compensation for participation in the study. To ensure the collection of good quality data participants recruited could not be colorblind, could not have had a history of traumatic brain injuries (TBIs), and must have had normal or corrected to normal vision (Carter & Luke, 2020). The initial sample consisted of 75 participants, seven of which were excluded due to prior history of TBIs and two excluded due to technical errors during data collection which left a final sample of 66 participants (F = 52, Mean Age = 19.08, SD = 2.07). The participants were randomly preassigned into two groups: (a) 33 participants that viewed the Human agent (F = 26, Mean Age = 19.27 years, SD = 2.02); (b) 33 participants that viewed the Robot agent (F = 26, Mean Age = 18.88 years, SD = 2.13).
Procedure
Participants were preassigned into two groups, those that saw the Human agent and those that saw the Robot agent. Both groups were tested using the same procedure, except that participants watching the Human agent saw gestures produced by a human hand and arm, and the participants watching the Robot agent saw gestures produced by a highly anthropomorphic robotic hand and arm. Participants first filled out three questionnaires on a computer: a demographics form, the Interpersonal Trust Scale and the MINI-IPIP, the latter two were collected to be used as part of a larger study. The demographics form included questions about the participants’ individual characteristics and included questions to identify vision problems and history of TBIs. The Interpersonal Trust scale was used to identify participants’ propensity to trust (Rotter, 1967). The MINI-IPIP was used to classify personality traits according to the Five-Factor model (Donnellan et al., 2006). After the collection of these three surveys participants were led into an experiment room where they would watch the Human or Robot pre-recorded experiment videos.
After watching the videos, participants were led back to the original computer and instructed to complete the final two questionnaires based on their perception of the videos: the Godspeed questionnaire, and the Checklist for Trust between People and Automation. The Godspeed questionnaire assessed how participants perceived the anthropomorphism, animacy, likeability, and intelligence of the agent. The Godspeed was collected as part of a larger project and the perceived safety subscale was not collected as it was irrelevant to the study design (Bartneck et al., 2009). The Checklist for Trust between People and Automation assessed the participants’ perceived trust in the agent. In this questionnaire the word “machine” was replaced by “arm” so that it could be generalized to both the Human and Robot agents (Jian et al., 2000). After the completion of these questionnaires, the participants were debriefed and thanked for their participation.
Stimuli and Apparatus
The video stimuli were presented in a dimly lit room on a 47.5 × 26.5 cm monitor with participants sitting in a straight-backed chair placed 60 to 70 cm from the apparatus. Participant gaze was tracked using the Eyelink 1000 Plus remote eyetracking system that was placed on a stand directly below the monitor. Participants were instructed to remain still during the experiment and were given two breaks to ensure focus and avoid eye strain. A 5-point calibration sequence was presented at the start of the experiment and after each break to obtain measurements of where the participants were looking during the experiment. Participants viewed a total of 48 test trial videos in three different pseudo-randomized blocks (first block had videos 1–16, second block had videos 17–32, third block had videos 33–48). Breaks were given after the completion of the first block and second block and gaze behavior over the course of the experiment was measured. Test trials in which participants were not watching the monitor, detected either through the Eyelink 1000 software or through experimenter notes, were excluded from the analysis. The presented test trial videos were the same for those watching the Human or Robot agent.
During the test trial videos, a stage was viewed with a blue box on the left side and a blue box on the right side of the stage with the Human or Robot agent appearing in the middle of the stage. When present on stage, the hand and arm of the agent were visible with the rest of the agent hidden behind a parted white curtain. Green sleeves covered the fingers, hands, and arms of both agents to ensure they were similar in perceptual characteristics and to increase their saliency against the background of the stage (Gleeson et al., 2013). Participants were presented with three counterbalanced test trial types during the experiment. The experimental pointing trials consisted of congruent pointing trials and incongruent pointing trials. Congruent trials consisted of the agent pointing to a box and a toy appearing from that “cued” box later in the test trial video. Incongruent trials consisted of the agent pointing to a box and a toy appearing from the “non-cued” box later in the test trial video, that is, the box that was not pointed at. The last test trial type was the control test trial in which the agent pointed straight down and did not “cue” either box.
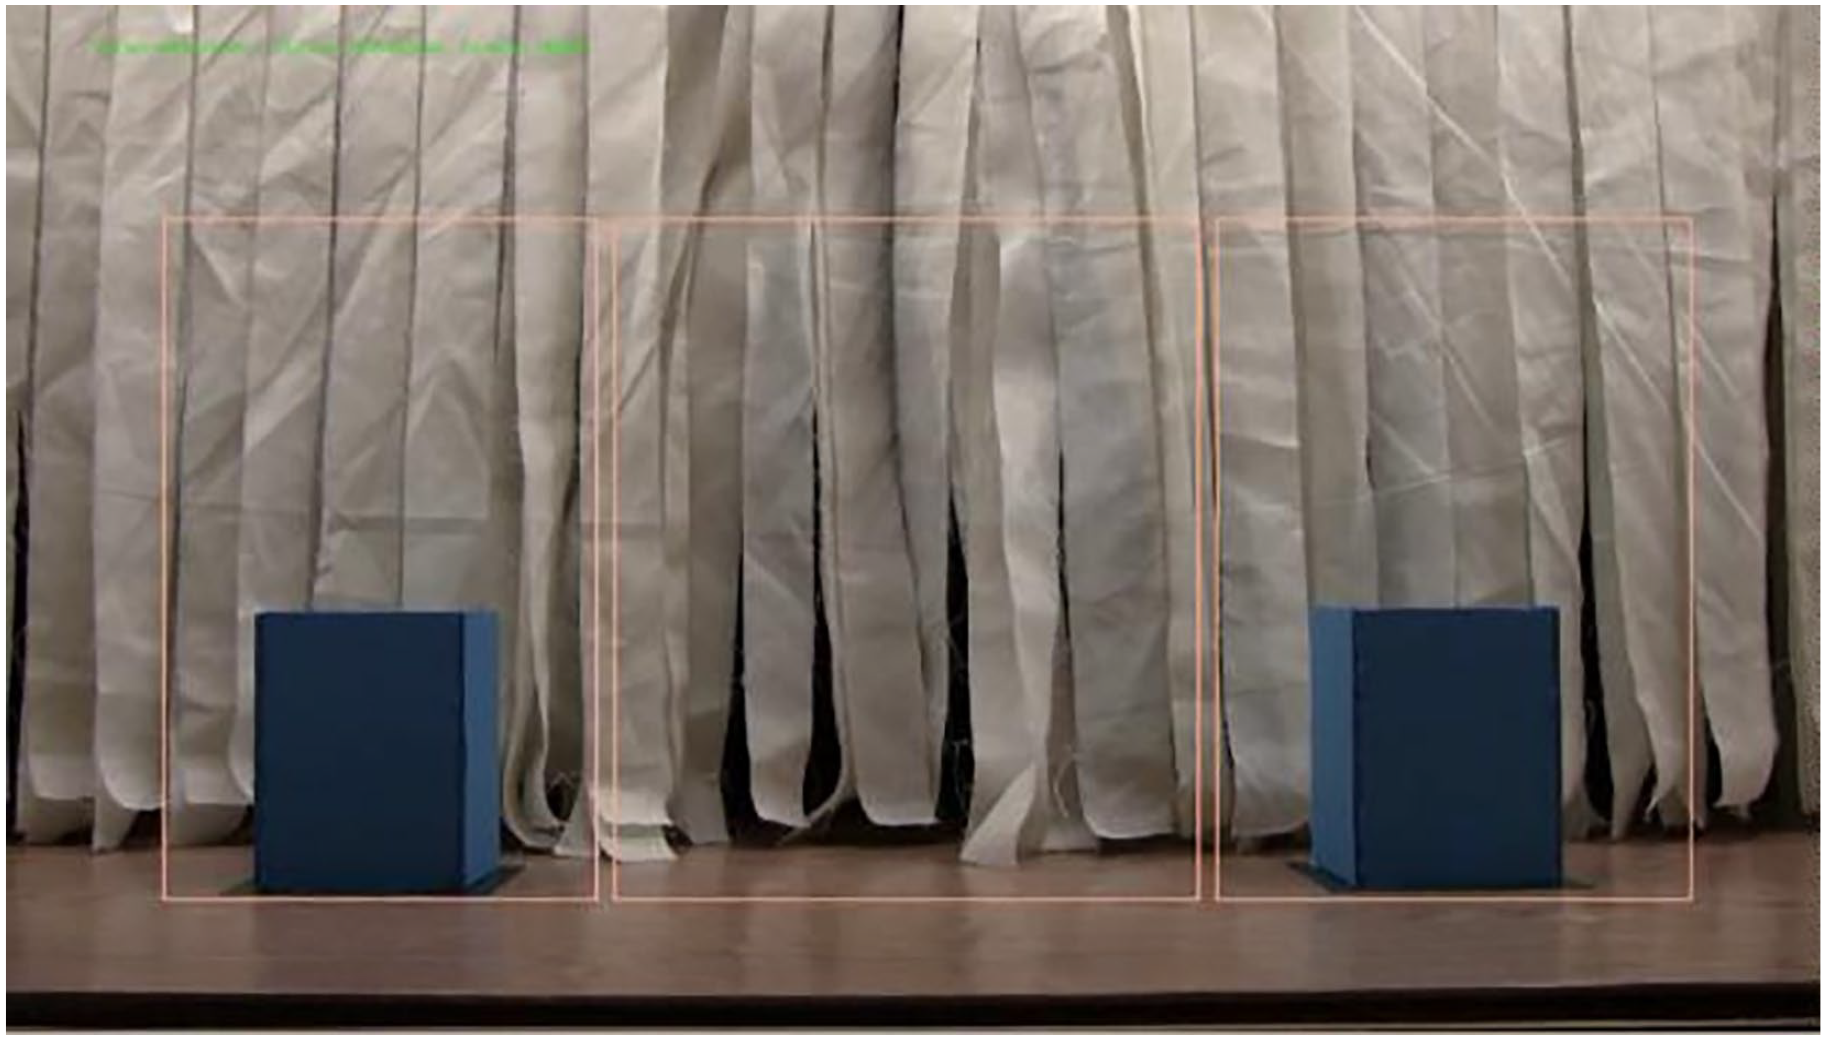
There were three predefined rectangle Areas of Interest (AOI), shown below in Figures 1 to 3. The center AOI encompassed the arm in the middle of the screen and the entire area in which the arm moved (438592[px]). The left and right AOIs were equally sized areas (355288[px]) that encompassed the blue boxes and the areas above the boxes in which a feathery toy would later appear. For the experimental pointing trials, the box that was pointed at was the cued AOI and the box that was not pointed at was the non-cued AOI. For the control pointing trials the box in which the toy would later appear was deemed the cued AOI and the other box was deemed the non-cued AOI. These AOIs were kept constant for the test trials and between the two agents.
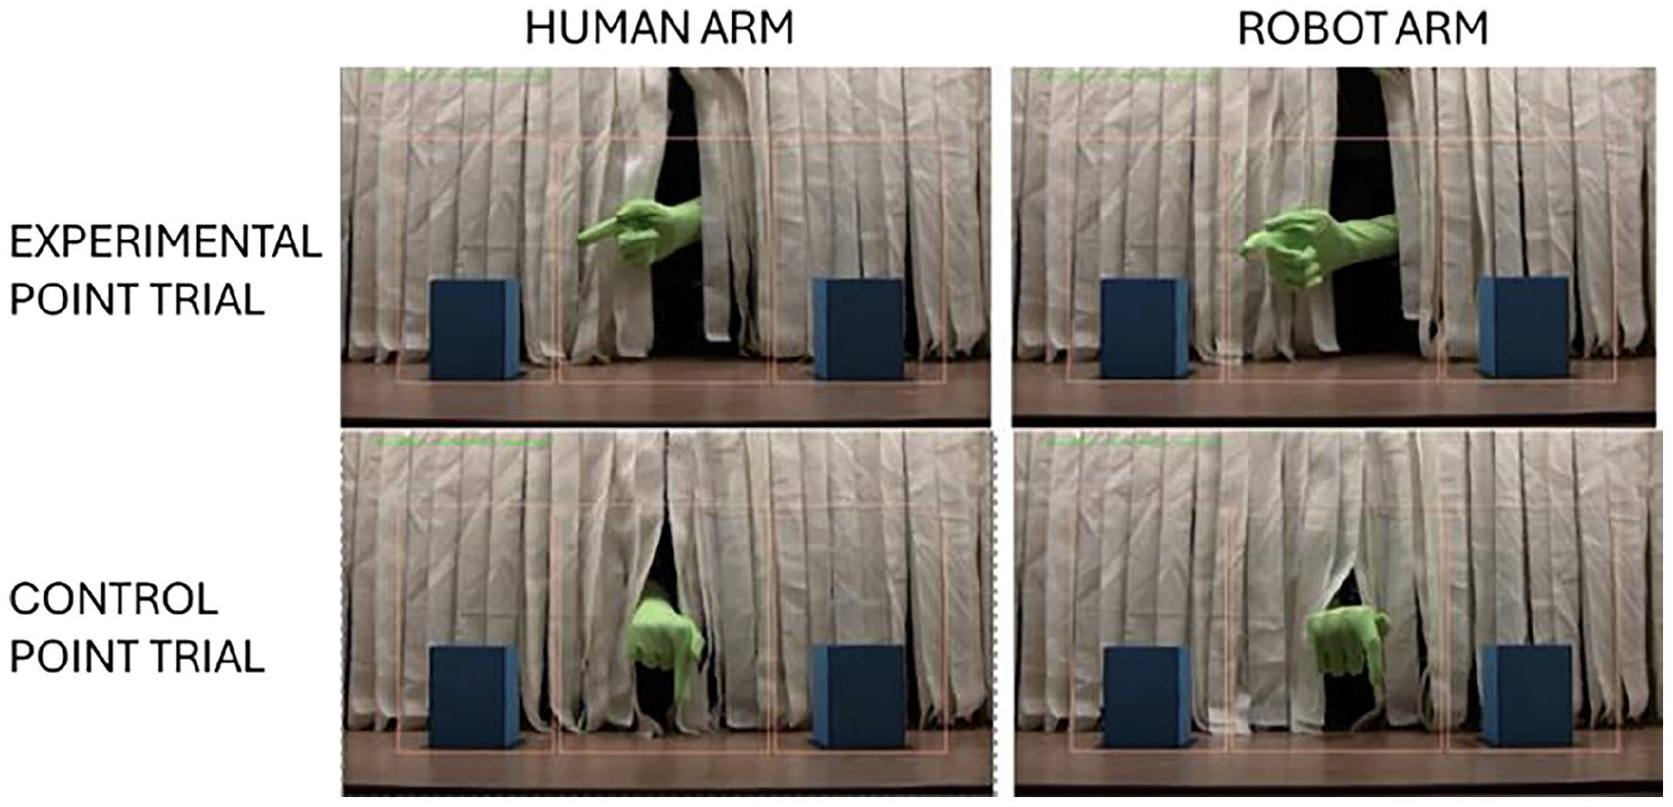
Action phase of experiment. The images on the left show the Human agent and the right show the Robot agent. The images in the top row depict experimental pointing (in this case to the left box) and the images in the bottom row depict control pointing. This phase lasted 15 s.
Prediction phase of the experiment. Participants viewed no active movement or events. This phase lasted 3 s.
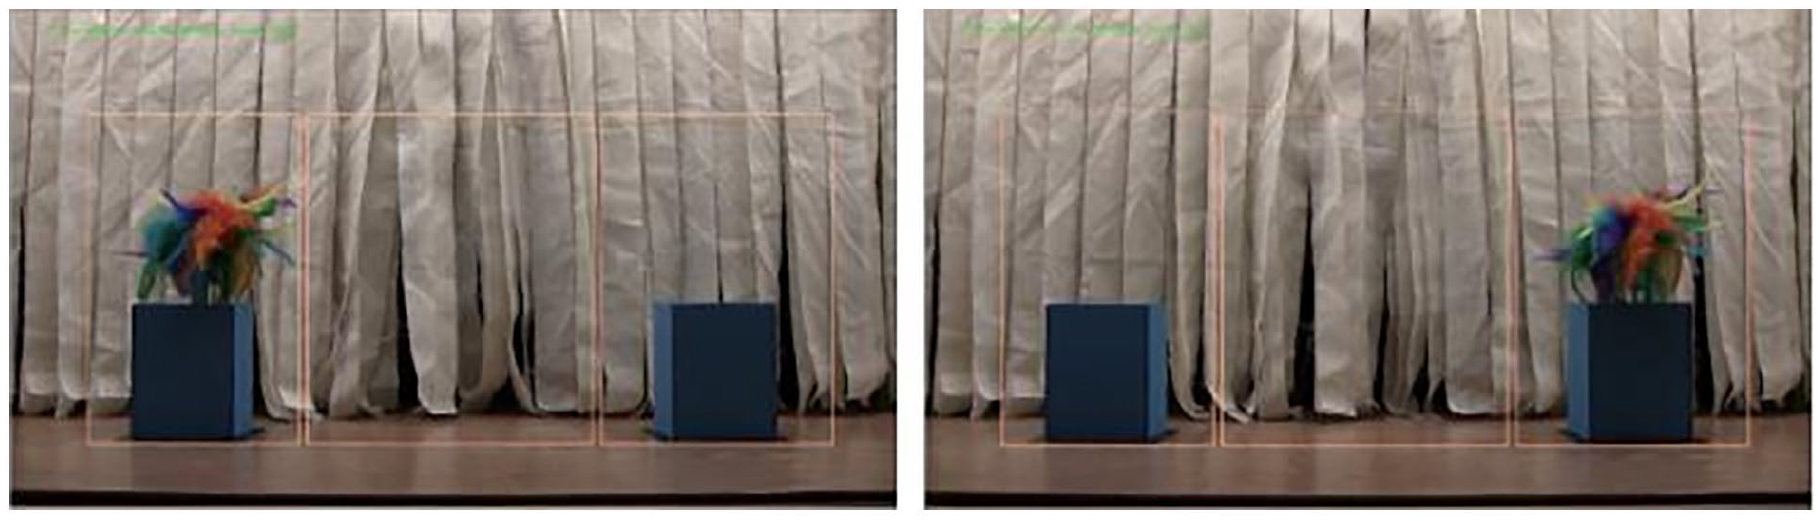
Event phase of the experiment. The toy appeared from either the left or right box and gently moved back and forth. This phase lasted 2 s.
The test trial videos consisted of a 3-phase sequence, the Action phase (15 s), the Prediction phase (3 s) and the Event phase (2 s). During the Action phase, the agent opened and closed its hand, pointed to a set location on the screen, then departed the stage through the part in the curtains (see Figure 1). For the experimental pointing trials, the agent pointed to either the left or right box. For the control pointing trials the agent pointed straight down.
During the Prediction phase the agent was not present and participants freely viewed the stage with the two boxes present (Figure 2). In the experimental pointing trials, participants that were receptive to information provided by the agent should have looked more toward the cued box than the non-cued box. In the control pointing trials participants were not cued to look at one box over the other so they should make less predictions toward the boxes.
During the Event phase a multicolored feathery toy emerged from one of the boxes on the stage and gently moved from side to side (Figure 3). In the congruent trials the toy appeared from the cued box. In the incongruent trials the toy appeared from the non-cued box. In the control trials the toy appeared randomly from one of the boxes.
Data Preparation
Eye-tracking data were organized and exported using Eyelink’s DataViewer software package. The average dwell time for each AOI, that is, the summed duration across all fixations, was calculated for each phase, trial type and block of the experiment. Survey data was organized and sorted through SPSS according to the requirements of the questionnaires. Data from the Interpersonal Trust Scale were used to calculate a composite score for each participants’ overall propensity to trust. Composite scores were calculated for each of the measures on the Godspeed scale for the perceived anthropomorphism, animacy, likeability, and intelligence of the agent they viewed. Scores from the Checklist for Trust between People and Automation were reverse coded as necessary, and a single composite score was created to represent the participants’ overall trust in the agent. The eye-tracking and survey data were checked for extreme outliers and any that were flagged were substituted through winsorizing. Any identified outliers that were flagged as below the 5th percentile or above the 95th percentile was substituted by assigning that value the next lowest or highest value in the dataset.
Results
Eyetracking Data Analysis
Action Phase
A 2 × 3 × 2 × 3 mixed-model ANOVA was conducted on average dwell time in milliseconds, with agent (human, robot) as the between-subjects factor and block (first block, second block, third block), trial type (experimental, control), and AOI (center, cued, non-cued) as the within-subjects factors. The assumption of sphericity was violated, so Greenhouse-Geisser corrections were applied to the analysis. All post hoc tests used Bonferroni adjustments to control for overall Type 1 error rates for multiple comparisons. The test determined no overall significant effect of the between-subjects factor of agent F (1, 64) = 0.43, p = .51.
The within-subjects factors revealed several significant main effects. There was a significant main effect of block F (1.28, 81.9) = 6.61, p = .002. Post hoc tests revealed that participants looked significantly longer during the first block (M = 3,801.14, SE = 74.47) than they did during the second block (M = 3,707.74, SE = 90.15, p = .002) or the third block (M = 3,671.93, SE = 79.77, p < .001). There was no significant difference in looking between the second block and third block (p = 1.0). There was also a significant main effect for AOI F (1.15, 73.39) = 1,590.17, p < .001. Post hoc test revealed that participants looked longer toward the cued AOI (M = 911.24, SE = 73.99) than the non-cued AOI (M = 123.65, SE = 13.72, p < .001) and longer toward the center AOI (M = 10,145.92, SE = 228.23) than either the cued AOI (p < .001) or the non-cued AOI (p < .001).
The mixed-model ANOVA revealed significant interactions between several factors. There was a significant trial type X agent interaction F (1, 64) = 4.88, p = .03, but post hoc comparisons revealed no significant differences. There was also a significant interaction between block X AOI F (1.7, 108.96) = 6.58, p = .003. Participants looked longer to the center AOI during the first block (M = 10,348.23, SE = 216.91) than the second block (M = 10,114.54, SE = 257.21, p = .007) or the third block (M = 9,975, SE = 229.38, p < .001) with no difference between the second and third blocks (p = .82). There was no difference in looking during the blocks to either the cued AOI or the non-cued AOI. Lastly, there was a trial type X AOI interaction F (1.1, 70.09) = 118.03, p < .001. The post hoc tests revealed that participants spent more time looking to the cued AOI during the experimental trials (M = 1,685.65, SE = 146.96) than in the control trials (M = 136.83, SE = 19.03, p < .001), and less time looking to the center AOI during the experimental trials (M = 9,346.96, SE = 232.44) than in the control trials (M = 10,944.88, SE = 247.89, p < .001). There was no difference in looking to the non-cued AOI based on the trial type.
Prediction Phase
A 2 × 3 × 2 × 3 mixed-model ANOVA was conducted on average dwell time in milliseconds, with agent (human, robot) as the between-subjects factor and block (first block, second block, third block), trial type (experimental, control), and AOI (center, cued, non-cued) as the within-subjects factors. The assumption of sphericity was violated, so Greenhouse-Geisser corrections were applied to the analysis. All post hoc tests used Bonferroni adjustments to control for overall Type 1 error rates for multiple comparisons. The test determined no overall significant effect of the between-subjects factor of agent F (1, 64) = 0.35, p = .85.
The within-subjects factors revealed a significant main effect of AOI F (1.17, 74.85) = 194.13, p < .001. Participants looked longer to the cued AOI (M = 325.02, SE = 34.51) than the non-cued AOI (M = 243.89, SE = 27.35, p = .04). The center AOI (M = 1,640.29, SE = 72.79) received more attention than either the cued AOI (p < .001) or the non-cued AOI (p < .001).
The mixed-model ANOVA revealed a significant trial type X AOI interaction F (1.28, 81.79) = 16.88, p < .001. Post hoc tests revealed that the cued AOI received more attention during the experimental trials (M = 423.85, SE = 56.53) than in the control trials (M = 226.19, SE = 26.82, p < .001). The non-cued AOI also received more attention during the experimental trials (M = 271.98, SE = 31.53) than in the control trials (M = 215.79, SE = 27.38, p = .01). The center AOI received less attention during the experimental trials (M = 1,514. 47, SE = 78.67) than in the control trials (M = 1,766.11, SE = 77.45, p < .001).
A three-way trial type X AOI X agent interaction was revealed in which the trial type X AOI interaction was contingent on the agent that a participant saw F (1.28, 81.79) = 4.16, p = .04. Only for the Human agent were the post hoc tests significant. For the Human agent, the cued AOI received more attention during the experimental trials (M = 480.57, SE = 79.95) than during the control trials (M = 213.02, SE = 37.93, p = .001). The non-cued AOI also received more attention during the experimental trials (M = 331.03, SE = 44.59) than during the control trials (M = 229.44, SE = 38.73, p = .002). The center AOI received less attention during experimental trials (M = 1,396.72, SE = 111.25) than in the control trials (M = 1,787.01, SE = 109.54, p < .001). Comparisons for the Robot condition were not significant (p > .05 for all).
Difference maps were generated to visualize eye fixations toward the defined areas of interest during the Prediction phase (see Figure 4). Fixations for those that watched the Human agent were compared to those that watched the Robot agent and differences in fixations were mapped. Areas where more attention was paid to the Human agent were represented in warmer colors on the green-yellow-red scale and when more attention was paid to an area for the Robot agent it was represented in cooler colors in the green-cyan-blue scale. These difference maps reflect the trial type X AOI X agent interaction in which during the experimental pointing trials participants that watched the Human agent spent more time looking toward the cued and non-cued AOIs than participants that watched the Robot agent.
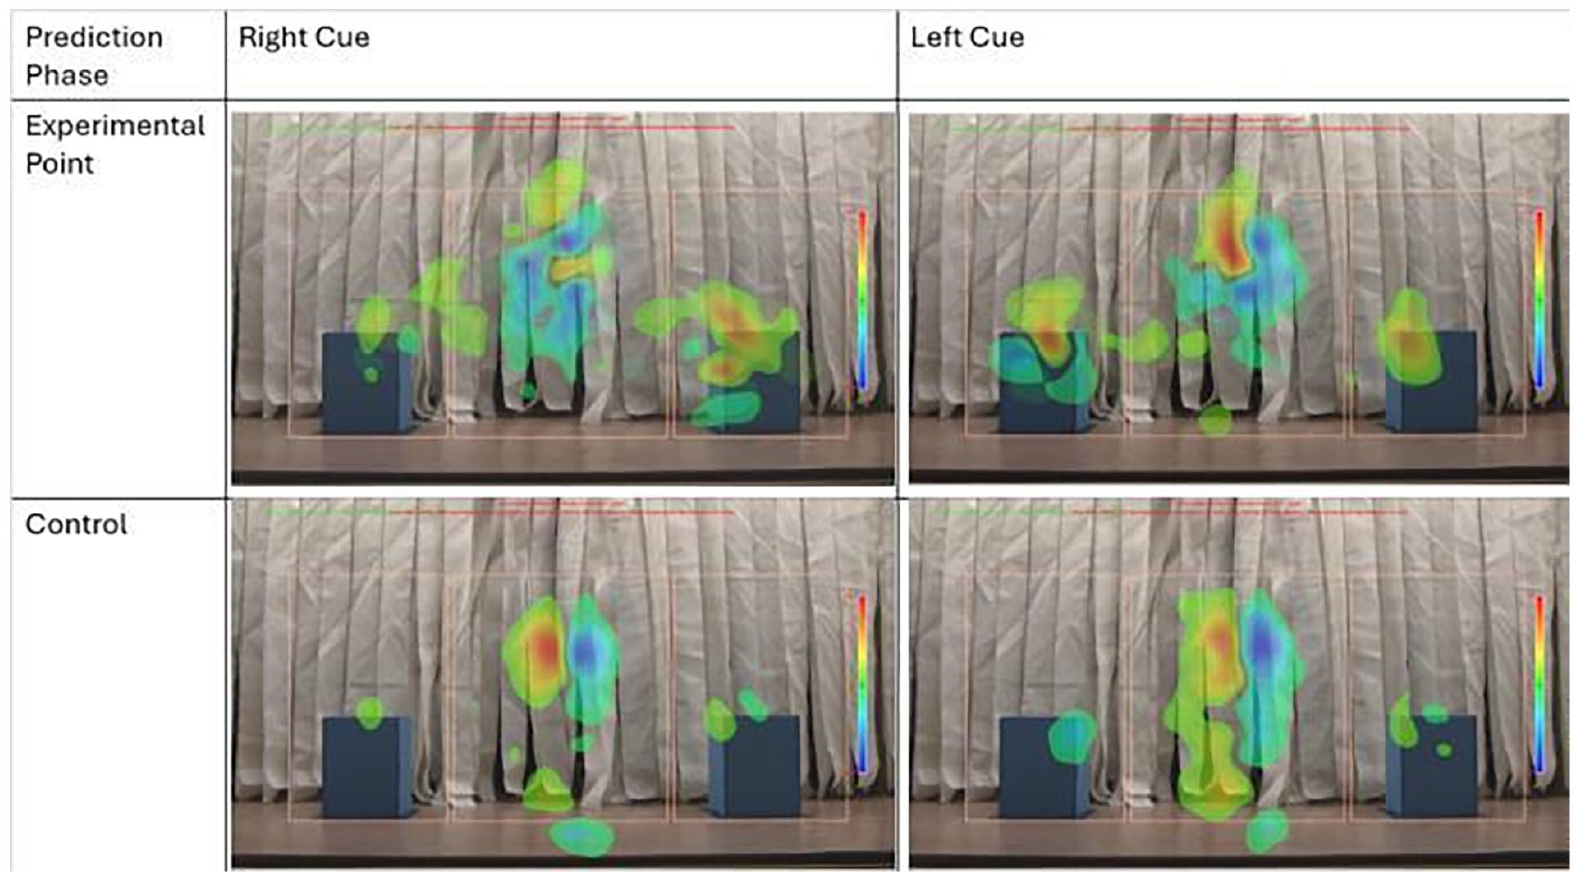
Difference maps depicting gaze patterns during the Prediction phase of the experiment. The top row of images shows the gaze patterns for participants viewing the Human and Robot agents. Warmer tones indicate where more attention was allocated when viewing the Human agent. Cooler tones indicate where more attention was allocated when viewing the Robot agent.
Event Phase
A 2 × 3 × 3 × 3 mixed-model ANOVA was conducted on average dwell time in milliseconds, with agent (human, robot) as the between-subjects factor and block (first block, second block, third block), trial type (congruent, incongruent, control), and AOI (center, cued, non-cued) as the within-subjects factors. The assumption of sphericity was violated, so Greenhouse-Geisser corrections were applied to the analysis. All post hoc tests used Bonferroni adjustments to control for overall Type 1 error rates for multiple comparisons. The test determined no overall significant effect of the between-subjects factor of agent F (1, 64) = 0.14, p = .71.
The within-subjects factors revealed several significant main effects. There was a significant main effect of block F (1.44, 91.94) = 3.62, p = .04. Post hoc tests revealed that participants spent a greater amount of time looking at the AOIs during the first block (M = 531.81, SE = 8.57) than during the third block (M = 515.61, SE = 10.87, p = .005), with no significant differences between the first block and the second block (M = 521.95, SE = 11.79, p = .17) or the second block and third block (p = 1.0). There was also a main effect of AOI F (1.32, 84.29) = 343.61, p < .001. Participants spent more time looking to the cued AOI (M = 878.74, SE = 23.08) than the non-cued AOI (M = 450, SE = 12.62, p < .001) or the center AOI (M = 240.64, SE = 14.76, p < .001). Participants spent more time looking at the non-cued AOI than the center AOI (p < .001).
The mixed-model ANOVA revealed a significant trial type X AOI interaction F (1.77, 113.13) = 864.31, p < .001. There was no difference in looking to the center AOI based on trial type, but there were differences in looking toward the cued AOI and the non-cued AOI. The cued AOI was looked at less during the incongruent trials (M = 98.26, SE = 13.82) compared to the congruent trials (M = 1,256.25, SE = 36.86, p < .001) or the control trials (M = 1,281.7, SE = 36.03, p < .001), with no significant difference in looking between the congruent and control trials (p = 1.0). The non-cued AOI was looked at more during the incongruent trials (M = 1,241.98, SE = 32.78) than the congruent trials (M = 63.62, SE = 9.15, p < .001) or the control trials (M = 44.36, SE = 5.88, p < .001). Participants also looked longer to the non-cued AOI during the congruent trials than in the control trials (p = .009).
Trust Data Analysis
A two tailed independent samples t-test was performed on participant trust scores from the Checklist between People and Automation to determine if there was a significant difference in reported trust scores based on participants viewing the Human agent or the Robot agent. The test revealed no significant difference in trust scores from those that viewed the Human agent (M = 3.52, SD = 0.89) and those that viewed the Robot agent (M = 3.88, SD = 0.82; t [64] = −1.72, p = .09, 95% CI [−.78, .06]). These results trend in the direction of individuals trusting the Robot more than the Human, but due to a low sample size for this test, the effect may not have been strong enough to capture.
Discussion
This study explored receptivity to nonverbal information provided by a robot and a human and the extent to which participants perceived the two agents as trustworthy. Analysis of the average dwell time revealed no overall significant differences in gaze patterns between those that viewed the Robot and the Human agents. In the Action phase participants equally viewed the agents producing the gestures and looked at the box that was being pointed at more than the box that was not. In the Prediction phase participants were able to draw causal relations from the Robot and Human produced gestures as to where the toy would appear, however, the trial type X AOI X agent interaction suggests that those watching the Human agent were more receptive to the information provided. Participants watching the Human agent were making predictions as to where the toy would appear during experimental trials while those that watched the Robot agent did not show a significant difference between their gaze patterns during experimental and control trials. In the Event phase there was no difference based on the agent watched, participants were equally as responsive to the toy’s appearance (in the control and congruent trials participants looked to the cued AOI and in the incongruent trials participants looked to the non-cued AOI). While the eyetracking measures did not reveal an overall difference in gaze patterns based on agent type, the results from the Prediction phase suggest that participants might be less receptive to information provided by a robot compared to a human. The trust data analysis revealed no significant difference in trust ratings based on agent type, but the scores were trending toward significance with participants rating the Robot as being more trustworthy than the Human. More research is needed to understand the differences in understanding information from non-human agents, and the underlying perceptual differences that occur when interacting with robots as opposed to other humans.
Footnotes
Declaration of Conflicting Interests
The author(s) declared no potential conflicts of interest with respect to the research, authorship, and/or publication of this article.
Funding
The author(s) received no financial support for the research, authorship, and/or publication of this article.