
Abstract
Human-Robot collaboration (HRC) is playing a pivotal role in modern industry. We conducted human experiments and computational modeling with the Queuing Network (QN) cognitive architecture to investigate the patterns of speed-accuracy tradeoff (SAT) and speed-confidence tradeoff (SCT) in human prediction of a robot’s movement intention. Experimental results show specific patterns of SAT and SCT, which are both affected by task difficulty. For example, clear quantitative relations of SAT are shown (a) in all the easy task conditions, (b) only in the medium to long duration conditions of the medium difficulty situations, but (c) not in any of the hard (most difficult) conditions. To account for SAT and SCT, entity departure processes of the QN are used to represent information accumulation in the human mind, with the entities representing the possible robot movement target locations. This modeling work goes beyond the previous QN models that focused on the arrival and service processes of information entities.
Keywords
Introduction
Successful Human-robot collaboration (HRC) has the promise to enhance industrial production efficiency and flexibility (Cheng et al., 2020; Li et al., 2023). To truly realize the potential of HRC, it is essential to cultivate a bi-directional anticipatory dynamic where both the human and the robot can predict each other’s intentions. However, while enabling robots to discern human intentions is an active area of research (Aggarwal & Ryoo, 2011), there is a need for computational modelling and experimental research of human prediction performance regarding robot’s intention (Stulp et al., 2015). This paper, therefore, aims to address this gap.
Envision a task wherein a human and a robot are assembling an Ikea chair. The robot could select the appropriate pieces and tools for the assembly. If the human assembler can predict which part the robot will hand over next (while the robot is also predicting the human’s intention), they could position themselves accordingly and prepare the correct fastening elements in advance. This level of anticipatory interaction would streamline the assembly process, reducing time and minimizing errors.
To computationally model human prediction performance regarding robot’s intention, one of the important research issues is the trade-off between speed and accuracy, which has had a long history of research in psychology and human factors in general and has been studied in some related areas including human targeted movements in particular (Accot & Zhai, 1997). This trade-off has also been considered for the designing of user interface and input devices to enhance the efficiency and user experience of interactive systems (Stoelen et al., 2012).
Another important aspect to consider is the speed confidence tradeoff (SCT), since it investigates the balance between the speed of decision making and the level of confidence in the accuracy of those decisions. In the context of prediction activities, such as the one mentioned above in HRC, it’s crucial to determine whether humans also experience a speed-accuracy and a speed-confidence tradeoff. The presence of such tradeoffs has important implications for designing the HRC work content and refining robot movements to fulfill the dual requirements of swift predictive outcomes and precision. However, to date, it remains uncertain whether humans exhibit a tradeoff between speed and accuracy or speed and confidence when engaged in HRC prediction tasks. The goal of the current research is to address this need by conducting studies employing both computational modeling and controlled experiment methods.
The computational modeling method we explore is the extension of the Queueing Network- architecture and modeling approach to the HRI domain. This QN architecture and approach includes a family of QN models, which models and simulates a wide range of human performance. The QN network consists of servers that correspond to different functional units within the human brain. Information is represented as entities and processed by the servers in three subnetworks: the perceptual subnetwork, the cognitive subnetwork, and the motor subnetwork. Entities can be processed by one or multiple servers simultaneously, depending on their functions. Previous QN models have proven successful in simulating a wide range of traditional human factors tasks such as eye movement (visual search) and target pursuit (driving) (e.g., Lim et al., 2010; Liu, 1996), we propose to explore its applicability to model and simulate human prediction performance in HRC. Previous QN modeling work has mostly focused on the arrival and service processes of the QN, but Liu (Liu, 2005) has shown mathematically that the departure processes in the QN can account for SAT. This paper explores whether this prediction holds true for HRC tasks.
Overall, the research aims to achieve a deeper understanding of human prediction performance in HRC by answering the following questions: (a) Do humans experience SAT and SCT when predicting robot intentions? (b) Can the QN departure processes effectively simulate the SAT and SCT in human prediction activities? (c) How can insights from human participant experiments and computational modeling be used to design more effective HRC tasks?
Methods
Experimental Task and Experimental Design
In the experiment, participants watched videos showing Rethink Robotics’ Sawyer robot reaching for specific objects on a shelf in a 3 × 3 grid (Figure 1). The participants’ task is to predict the target object that Sawyer aims to reach after viewing a video segment. Before the start of each experimental trial, the participants are informed about the two possible target objects that the robot aims to reach and their task is to judge which one of the two possible objects is the final target object.
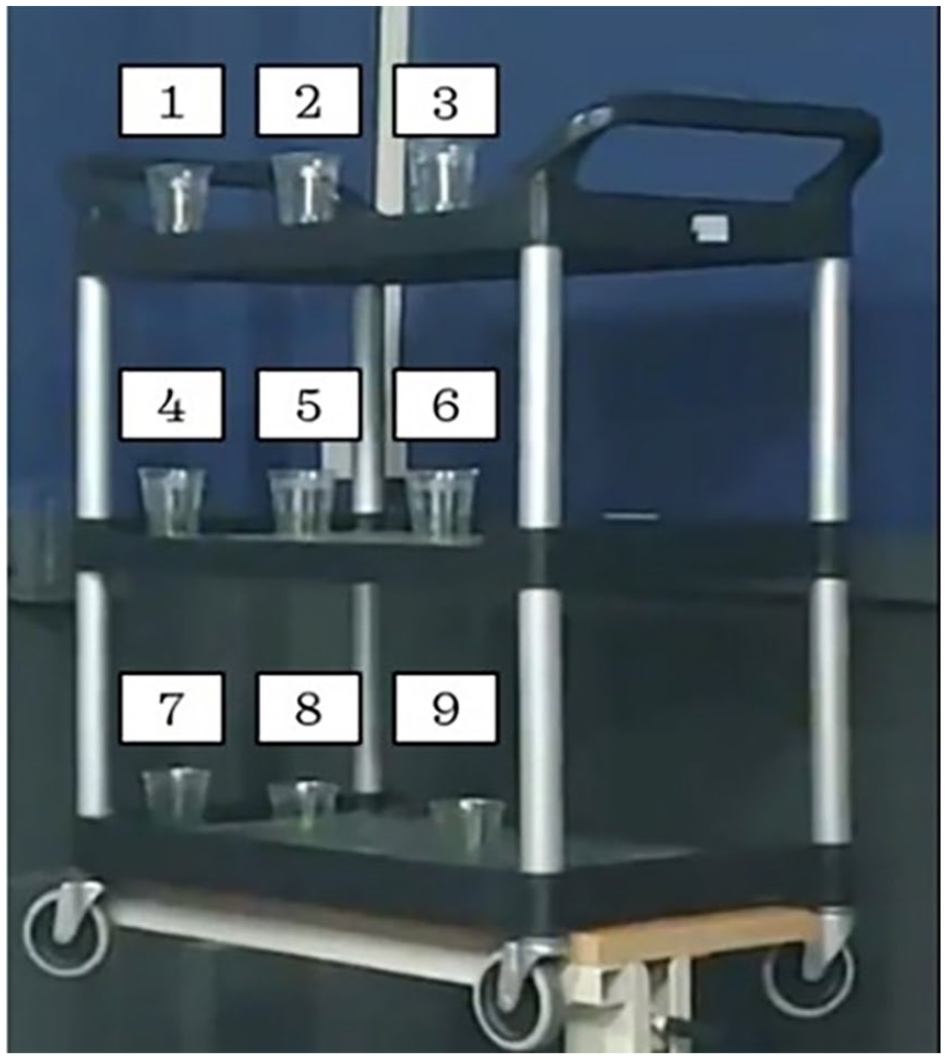
The arrangement of objects in a 3 × 3 grid. In each experimental trial, the participants are informed about two possible target objects that the robot aims to reach and the participants’ task is to judge which one of the two possible objects is the final target object.
All video clips start from the same initial positions and are sourced from a previous study (Soratana et al., 2021).
Independent and dependent variables
This experiment has two independent variables: video length and task difficulty. Video length pertains to the segment length of the video clip, which is categorized into four levels, specifically, 20%, 40%, 60%, and 80% of the total duration of the robot reach process. We assume that the length of this video segment affects the amount of information participants can access and accumulate before making their predictions. Task difficulty is categorized into three levels—easy, medium, hard. The level of prediction difficulty increases as the distance between the two possible target objects decreases. There are two pairs of objects in each difficulty level. For the “easy” level, the two possible objects to be chosen by the robot are either Objects 1 and 9 or Objects 3 and 7. These situations are selected because the two objects are diagonally located and have the greatest distance between them, ensuring the lowest level of prediction difficulty. For the “medium” difficulty level, the two possible target objects are at the two ends of the same row (e.g., 1 and 3, 7, and 9). These combinations present a moderate level of prediction challenge. Finally, for the “hard” level, participants will make predictions from two possible target objects located adjacent to each other (e.g., 1 and 2, 8, and 9). These pairings represent the highest level of prediction difficulty due to the close proximity of the objects.
The dependent variables include the accuracy, confidence, and response time of participants’ predictions. Prediction accuracy is calculated by dividing the number of accurate predictions by the total number of predictions. Participants’ prediction confidence, rated on a scale from 1 to 9, is collected. Response time is measured from when each video stops playing to when participants make a prediction.
Experimental Procedures
The experiment was organized into 19 blocks, consisting of 1 training block and 18 experimental blocks. In each block, the robot arm in the video would reach for objects in one pair at a specific difficulty level. Each block comprised eight trials, with four different segment lengths for reaching each of the two objects in the pair. There were two pairs of objects at each difficulty level, totaling three difficulty levels overall. To ensure comprehensive data collection, each block was repeated three times, resulting in a total of 18 experimental blocks (two pairs × three difficulty levels × three repetitions). Consequently, there were 144 experimental trials in total (18 blocks × 8 trials/block). In the training block, the two possible target objects were Objects 4 and 6. The training block also consisted of eight trials, with four video lengths for each object. The distance between the two objects matched that of the medium difficulty level in the experiment blocks, but this specific pair of objects was intentionally excluded from the experiment blocks to mitigate the memory effect. The placement of videos within each block and the sequence of blocks were randomized.
Within each block, a video clip showing only a segment of the complete reaching process was played (See Figure 2a). Following the video clip, participants were prompted to a user interface where they needed to press either the “A” or “D” key on the keyboard with their left hand to indicate their prediction. Subsequently, they input their confidence level (See Figure 2b). Prior to each block of trials, participants were instructed to position their fourth finger of the left hand on the “A” key and their second finger of the left hand on the “D” key. This aimed to facilitate rapid and consistent responses, without being affected by participants’ hand movements. Additionally, participants were directed to make their responses as quickly as possible without sacrificing their prediction accuracy.
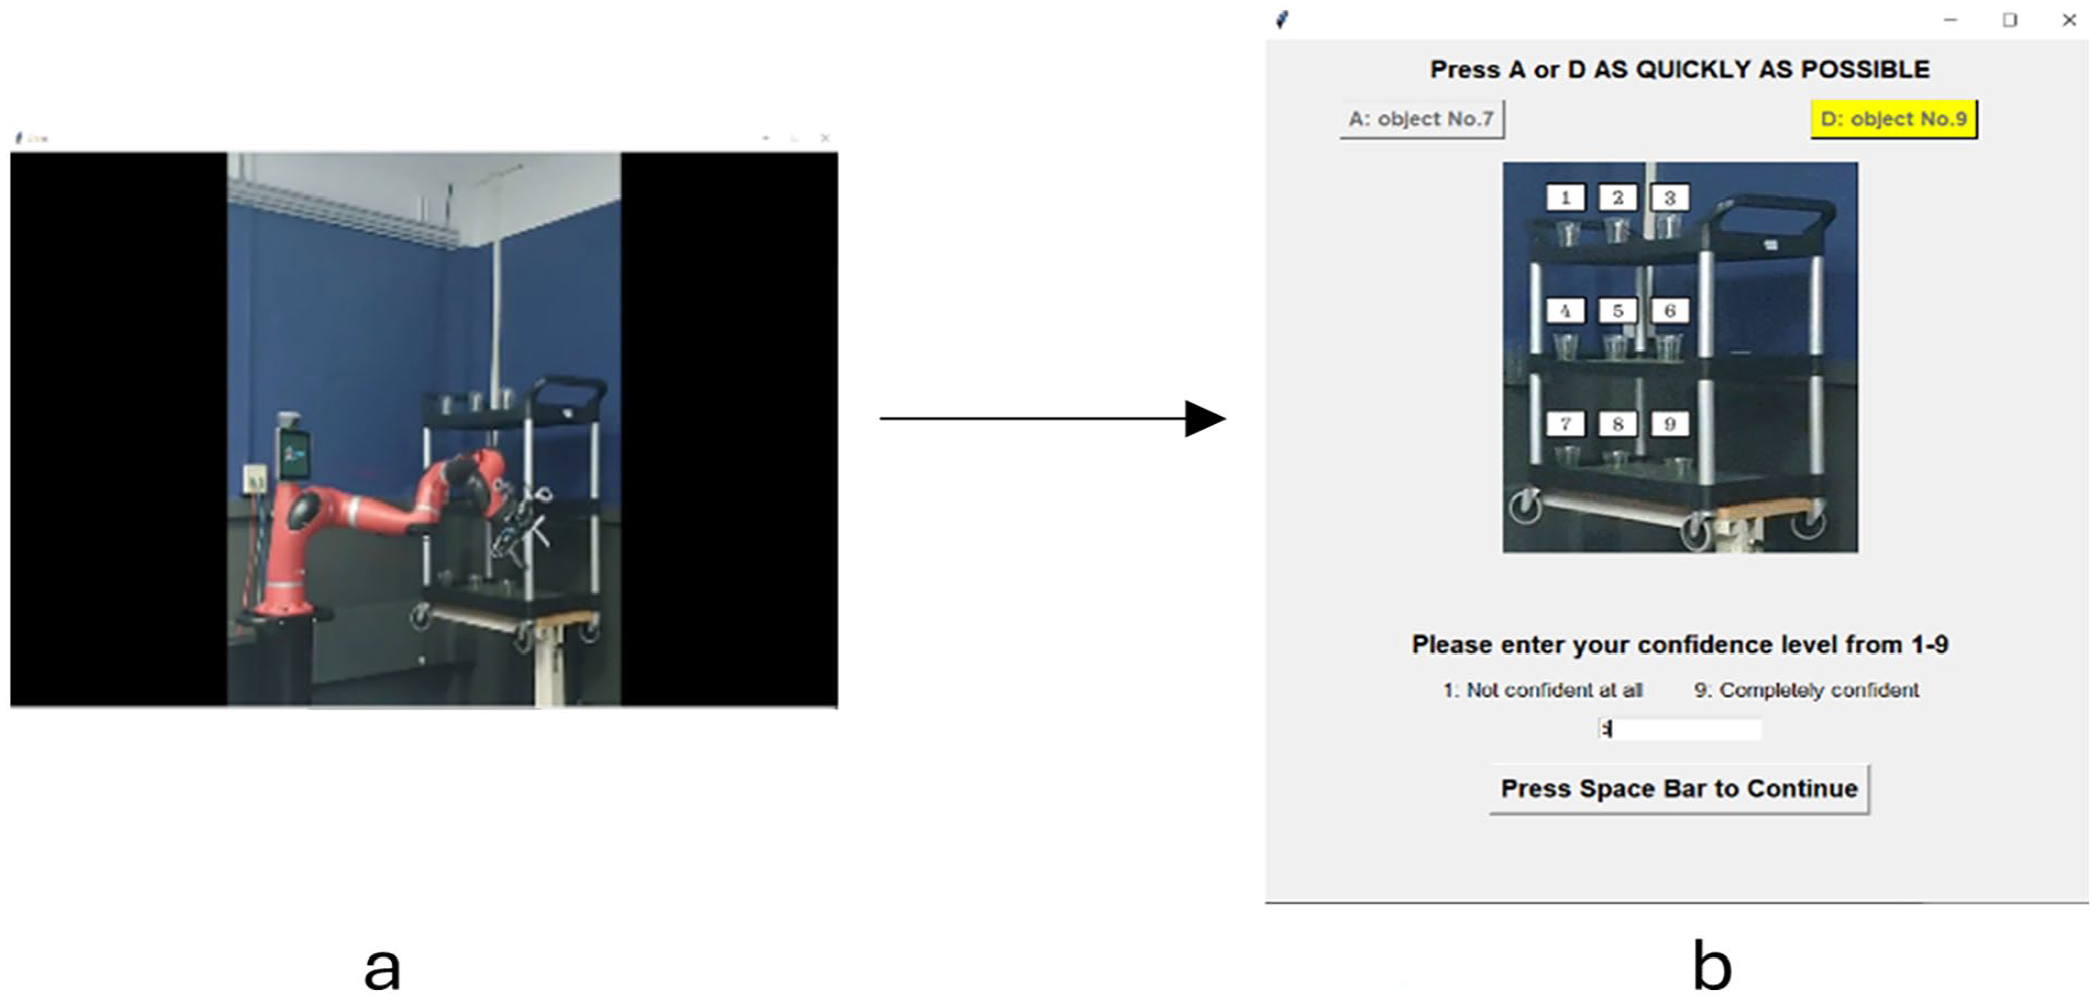
(a) Video interface and (b) Prediction interface.
Participants
Ten participants (five females, five males, average age = 26.4 ± 4.1) took part in the experiment. All the participants are students from the University of Michigan. All participants’ dominant hand is their right hand.
QN Model Establishment
The primary aim of this phase is to start with the simplest QN system with only one server to analyze the potential speed-accuracy tradeoff identified in the human experiments. Two distinct entities, denoted as A and B, representing the Targets and Non-targets, are generated. The model is used to test the hypothesis that human predictions are informed by accumulated information. The quantity of A and B entities leaving the server is utilized to quantify the information accumulation in the human brain.
The two independent variables in the experiment, task difficulty and video duration, can be determined by two parameters in the model: entity arrival probability and prediction threshold, respectively, as described in detail below.
Entity Arrival Probability
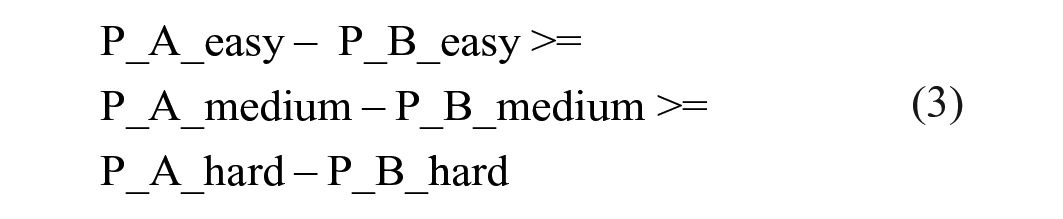
The arrival probability of a specific type of entity represents the likelihood that an incoming entity will be of this particular type. A higher arrival probability indicates a greater chance of the entity being of a certain type. Thus, the higher the probability of the entity, the more likely it is for participants to perceive its type of information. In this experiment context, we have two types of entity, and it is expected that the probability of the Target entity (P_A) would be larger than that of the Non-Target entity (P_B). However, the magnitude of their difference is contingent upon the task difficulty. In easier tasks, where the distance between the two objects is greater, participants would find it simpler to discern the disparity between the two types of videos. Therefore, the difference between the arriving probability of these two types of entities should be more pronounced in easier tasks. In conclusion, the entity arriving probability in this model should meet the following requirements:


Prediction Threshold
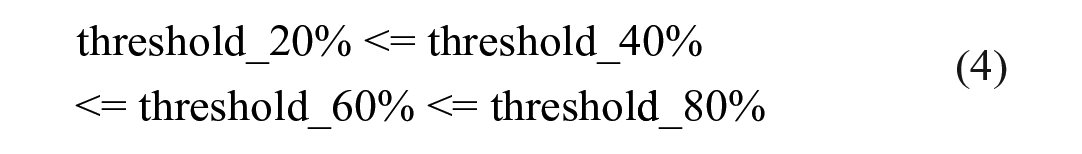
The prediction threshold refers to a predefined decision criterion value that participants use in their mind to make a prediction based on the number of entities that have departed from the server. More entity departures from the server represent more information that has been accumulated about the entities. If the total number of departures of a certain type of entity reaches this threshold first, the model’s prediction will correspond to this type of entity. In this study, the setting of the prediction threshold is dependent on the duration of the video. We assume that the service time of the QN server is the same for both target and non-target entities. Since P_A > P_B, as videos extend in length, and the total number of generated entities increases, the likelihood of more target than non-target entities entering and departing the model increases, which means longer videos exhibit reduced prediction randomness and reduced likelihood a “wrong” entity reaches the threshold first. Similarly, a larger threshold can also decrease prediction randomness because a greater total number of departures increases the likelihood of the target entity being correctly identified. Therefore, longer videos align with a larger prediction threshold, and the prediction threshold must adhere to the following requirement:
Simulation
The QN model was implemented using Python 3.9, and the SimPy library was utilized to construct the queuing structure. This QN model closely mimicked the lab experiment’s procedure. In each trial of the simulation, two types of entities were generated with probabilities that met the requirements outlined in (1), (2) and (3). These entities then entered the model and were processed by the QN server in a first-in-first-out (FIFO) order. Entities that exceeded the server capacity were placed in a queue, awaiting their turn for processing. Once served by the server, the entities departed from the model. During the simulation, if the departure number of type_A (target) entity reached the threshold specified in (4) first, the model made a prediction that the robot would reach the target, which is a correct prediction. Conversely, if the departure number of type_B entity reached the threshold first, then the model predicted that the robot would reach the non-target object, which is a wrong prediction. If neither type of entity reached the threshold within the simulation time (the duration of the video clip), the model makes a guess by assigning a 50% probability to each type of prediction. By iteratively adjusting the arrival probability and the prediction threshold and comparing the model outputs to the experimental data, the optimal combination was identified. With the optimal entity arrival probability and prediction threshold, the model was run for 1,440 trials, aligning with the total number of trials conducted in the experiment with 10 participants.
Result and Discussion
Experiment
The results of the experiment show three main findings about SAT: Very clear SAT (Figure 3a) quantitative relations are shown (a) in all the easy task conditions, (b) only in the medium to long duration conditions of the medium difficulty situations, but (c) not in any of the hard (most difficult) conditions. Specifically, results show that for the easy tasks, a clear SAT is evident: increasing video clip duration improves accuracy. Medium tasks exhibit no significant accuracy difference between short (0.2–0.4 times) video durations, but SAT becomes more pronounced as the clip duration extends, suggesting insufficient information in short clips may lead to random predictions. In hard tasks, SAT is less discernible, likely due to challenges in distinguishing between closely located destinations, even with longer clips.
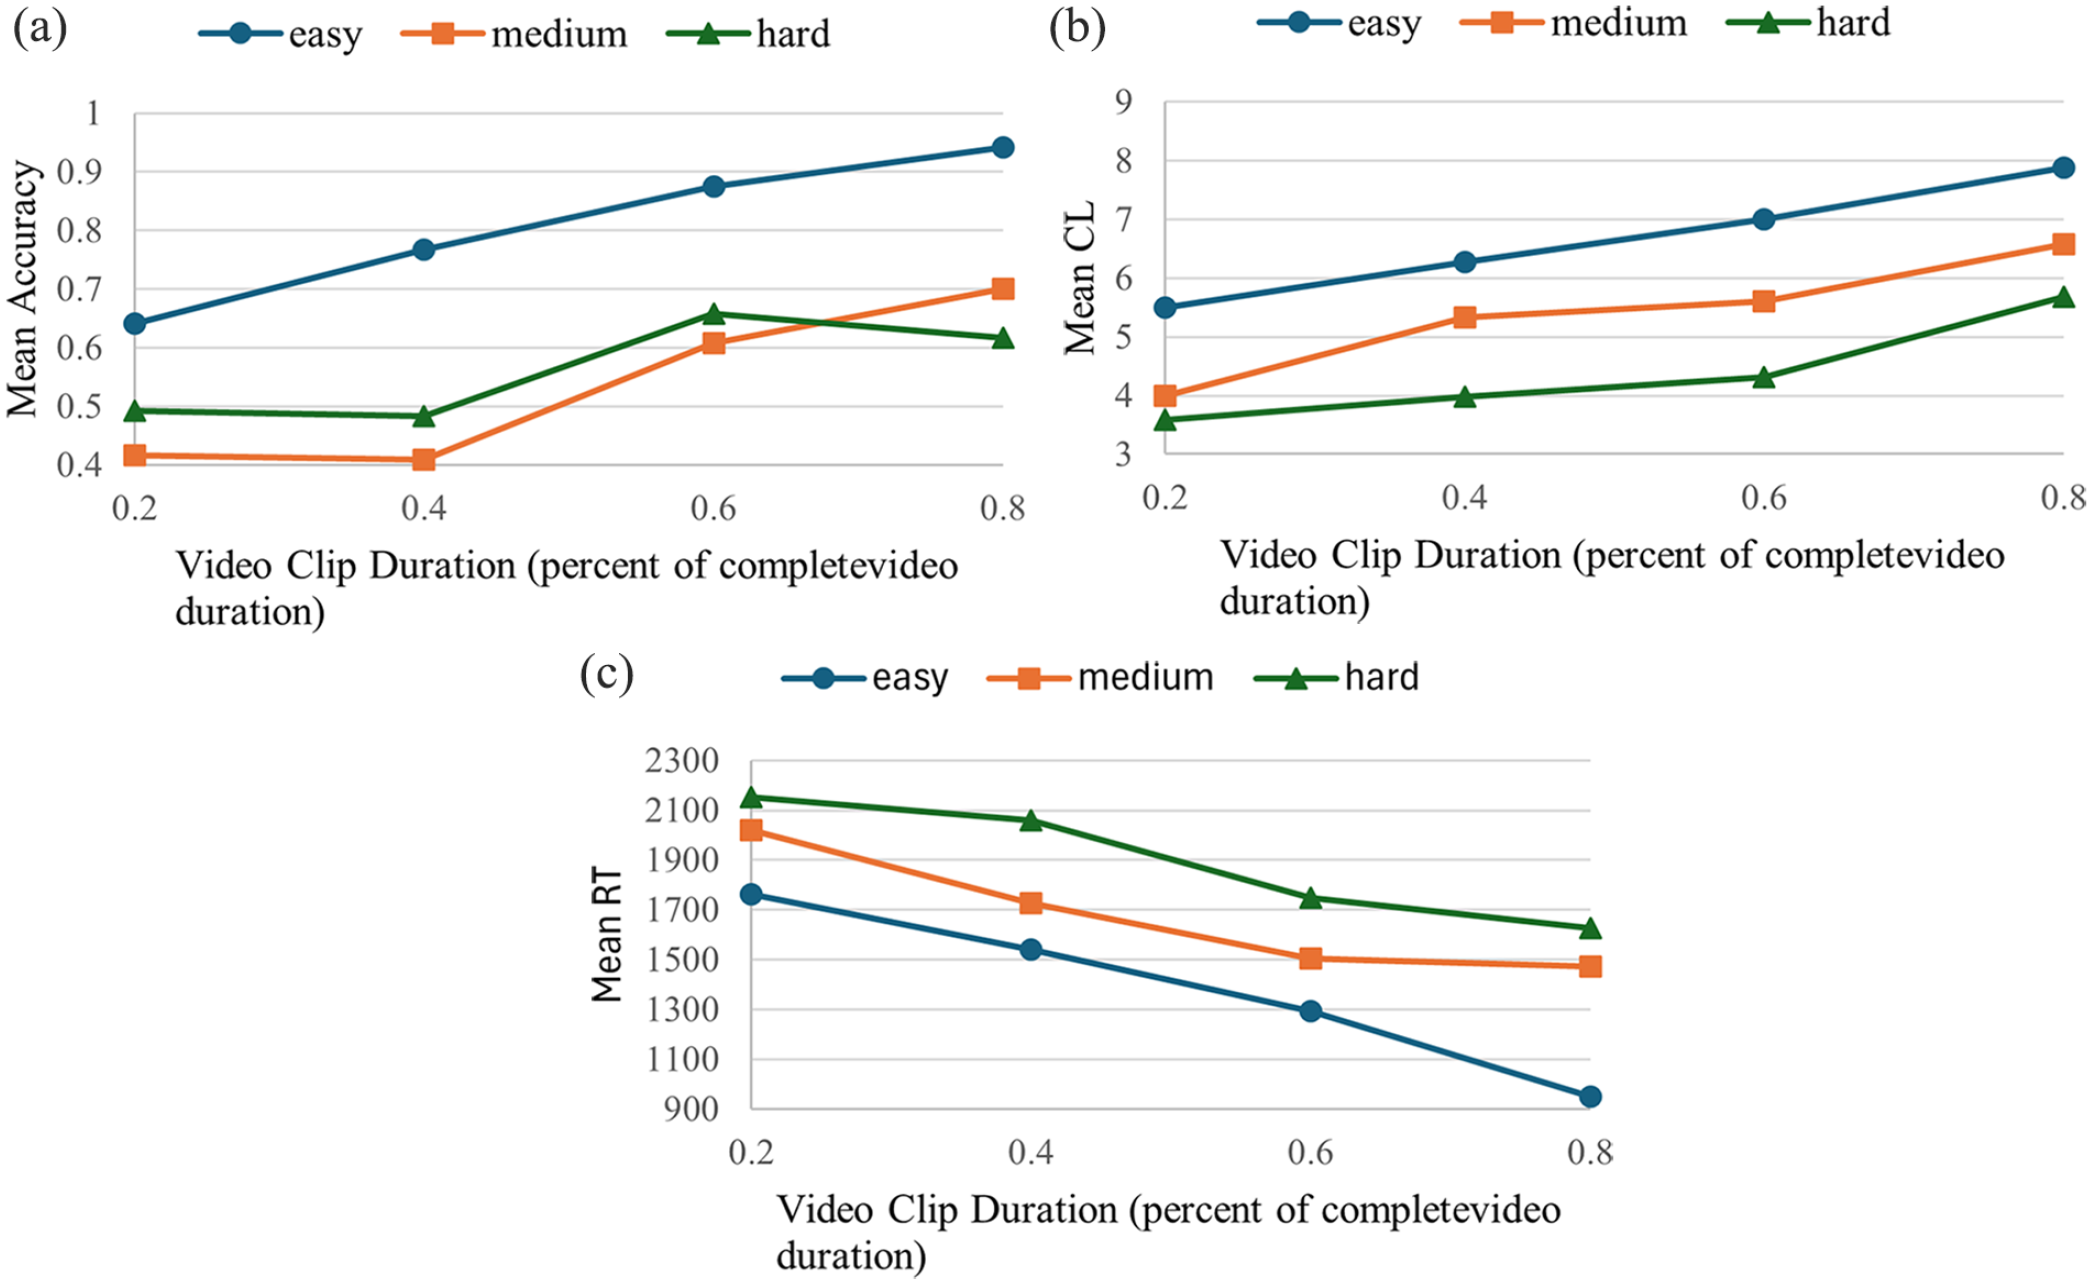
The trends of (a) Mean Accuracy, (b) Mean CL, and (c) Mean RT as a function of video duration.
SCT is evident across all difficulty levels, with longer durations consistently yielding higher confidence levels (Figure 3b). This implies that increased video duration allows participants to gather more information, increasing their confidence in their predictions. Mean reaction time (msec) mirrored confidence findings (Figure 3c), decreasing with longer clip durations, indicating reduced hesitation with more information.
QN Model
At this moment, the single-server QN model is only used to account for the SAT results of the experiment. The model results and corresponding experimental results for the three difficulty levels in the experiment are presented in Figure 4. The model successfully captures the SAT trend observed in the experiment, particularly in the easy tasks. Additionally, the model fits the results across all difficulty levels well, demonstrating root mean square errors (RMSE) in easy, medium and hard difficulty levels of 0.069, 0.068, and 0.066, respectively.
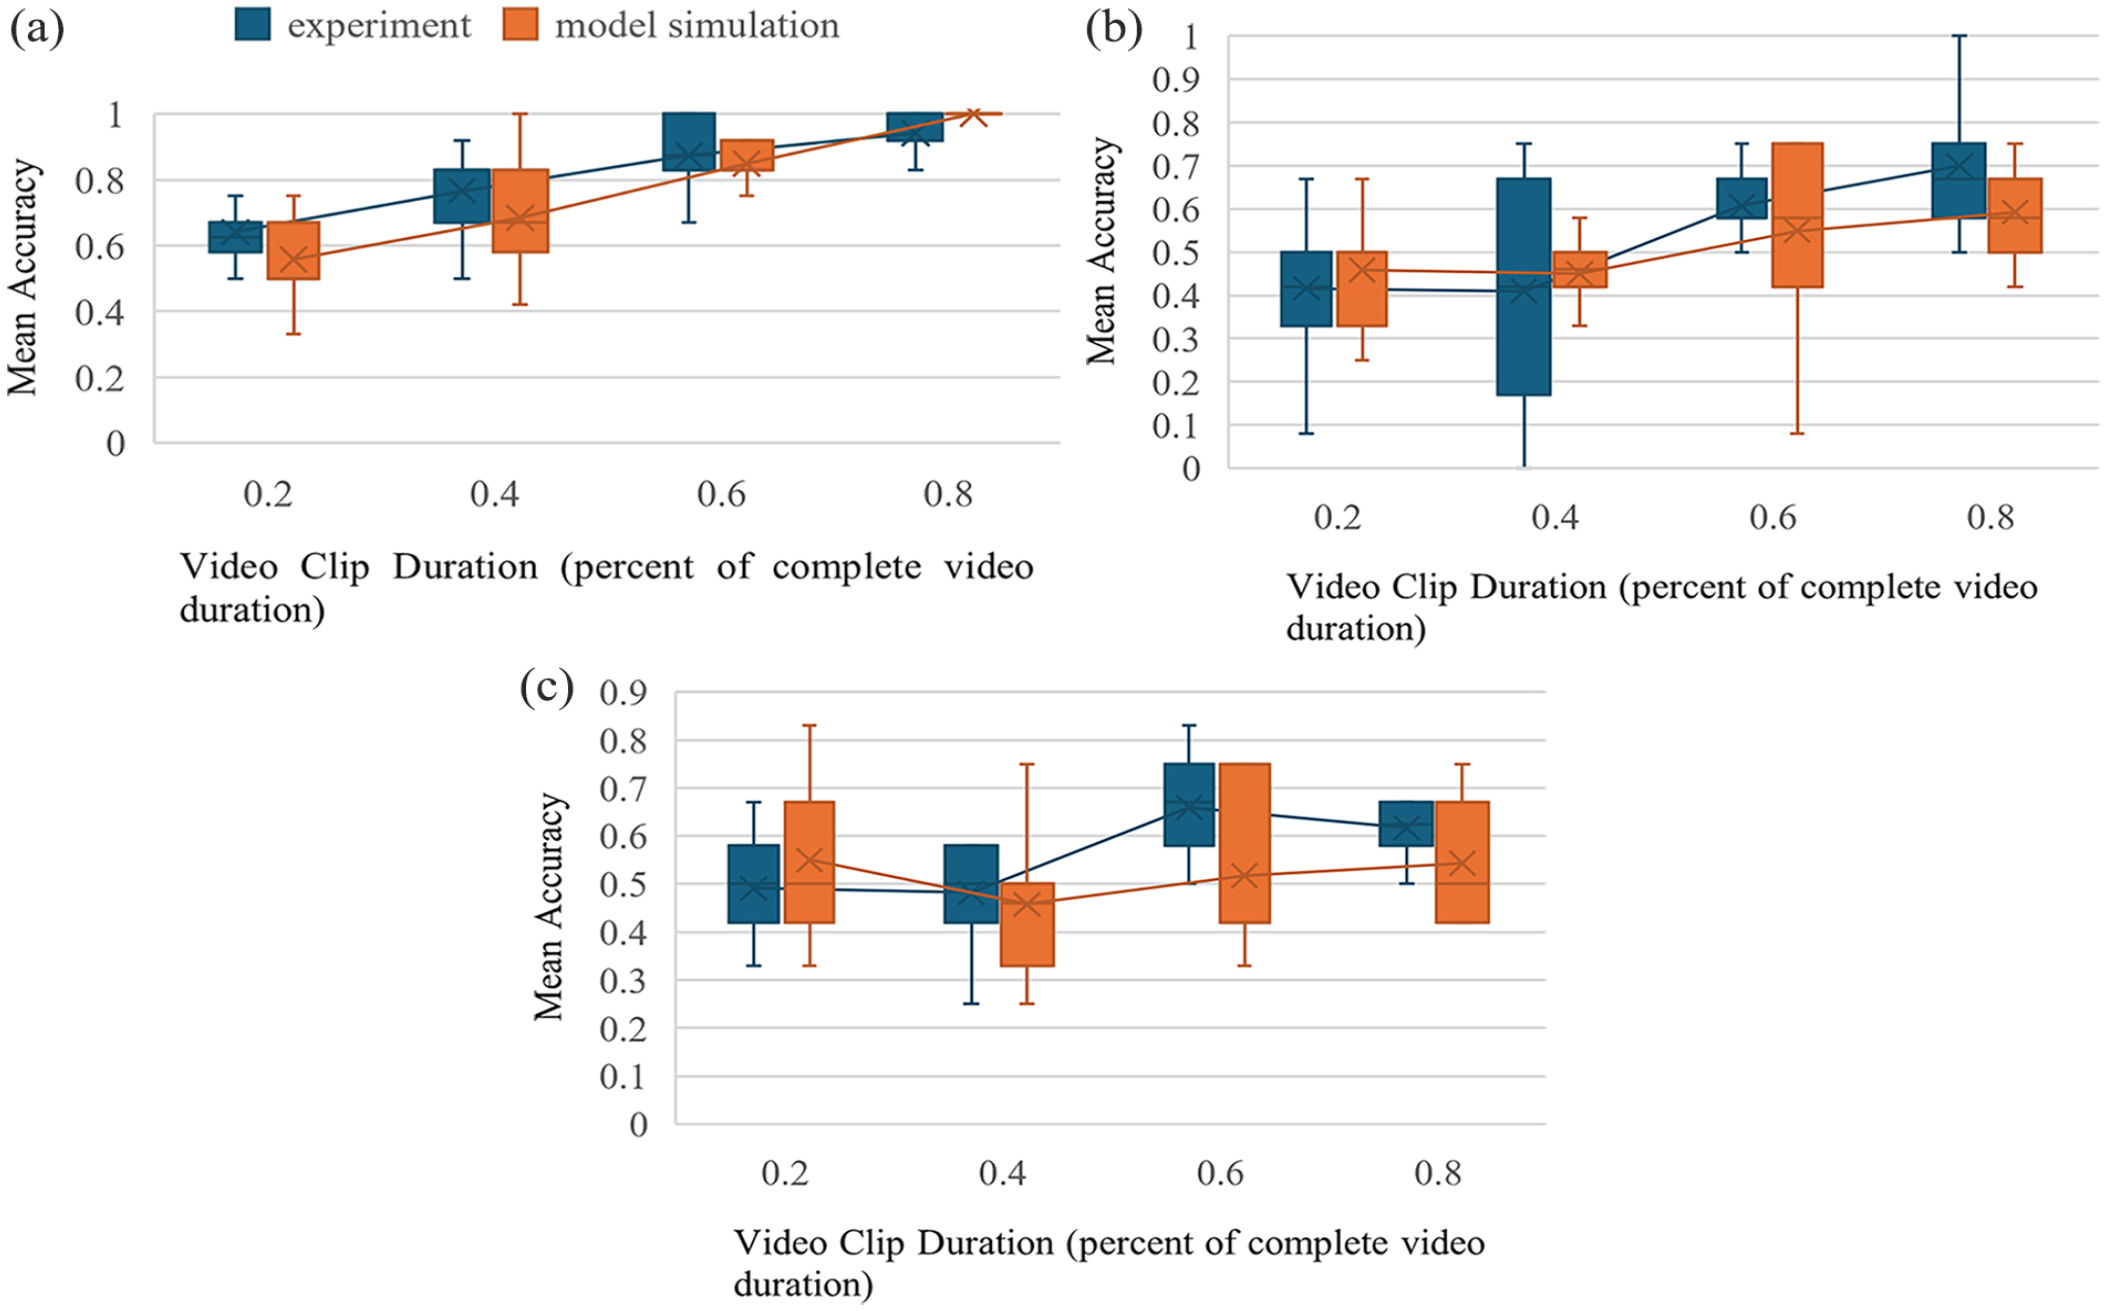
Model result versus experiment result: (a) Easy, (b) Medium, and (c) Hard.
These findings suggest promising potential for using the model to simulate the SAT of human prediction on a robot arm’s selection task. In subsequent work, we intend to utilize and extend this model to simulate dual-task situations where a worker might need to operate machinery while judging a robot’s reach destination.
Footnotes
Declaration of Conflicting Interests
The author(s) declared no potential conflicts of interest with respect to the research, authorship, and/or publication of this article.
Funding
The author(s) disclosed receipt of the following financial support for the research, authorship, and/or publication of this article: This work is supported in part by the National Science Foundation under grant No. 2128623. There is no conflict of interest in this work.