
Abstract
For safety-critical tasks, such as landing an airplane and driving through an intersection, operators must find critical information quickly, which depends upon where they are likely to look, specifically dwell percentages. These values can be estimated using the SEEV computational model which includes four primary factors: Salience, Effort, Expectancy, and Value. To assist the practitioner developing interfaces for these and other tasks, this paper describes each factor in detail, provides example hand calculations, and identifies computational software for complex analyses (e.g., the Automation Design Advisor Tool, the Adaptive Information Expectancy Model, the Human Efficiency Evaluator, MIDAS, Automation Design Advisor Tool, and Eijssen’s SEEV model). Getting access to this software can be challenging.
Keywords
What Are Some Questions That Human Factors Professions Need to Answer?
What percentage of the time will people look at/attend to various displays on an instrument panel?
If a display on a panel is moved from one place to another, how will those percentages change?
If the tasks vary, how will those percentages change?
How long will it take for a person to respond to a warning light for a specific purpose in a specific location?
These are questions the SEEV model and its derivates (N-SEEV) can answer, with the last question being beyond the scope of this paper. The SEEV model predicts where people will look to bring information (e.g., in a road scene, on an instrument panel) into foveal vision. Some tasks, such as lane maintenance or the detection of objects in the periphery, rely on ambient vision and are not predicted by this model. Initial publications describing the SEEV model include Wickens et al. (2001) and Wickens et al. (2003). An early and very clear explanation of the model appears in Wickens and Horrey (2008), with Wickens (2021) providing a current overview.
Over time, engineering models are enhanced, providing more accurate results, but requiring more data and taking more time to complete. They can also be more difficult to understand. This has been the case for SEEV as well. To help human factors select a version of SEEV to utilize, the first step is to identify some of the existing enhancements/versions.
Attention is Guided by Four Factors: Salience, Effort, Expectancy, and Value
Salience, Effort, and Expectancy can be determined objectively or subjectively. Value is determined subjectively by the analyst, usually by ranking the options, with ties being allowed. Higher priorities are assigned larger values. So for three items, the highest priority would have a value of 3.
The probability or percentage of time (probability × 100) of attending to an area of interest (dwell time on a display or part of a scene) is:
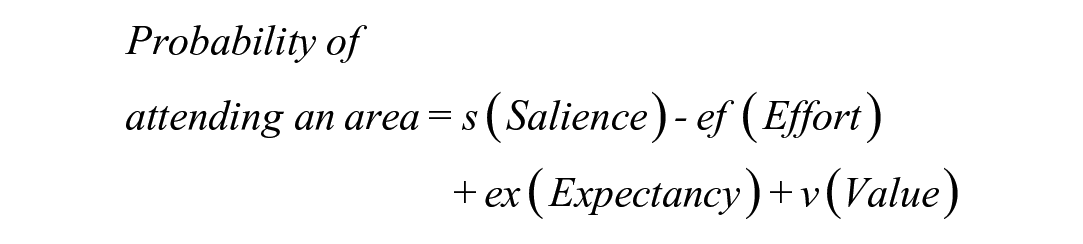
Commonly, the weights for the four factors are all one. When salience and effort are excluded, the sum is referred to as attractiveness, representing an ideal design.
The Basic Method Using Ranks Is Fast and Computed Using Excel
Suppose a person is driving, and as shown in Figure 1, there are three information sources, the road scene, the speedometer, and a crash warning light. The driver’s tasks are to not crash (Importance Rank = 3, most important), stay on the road (Importance = 2), and drive at or under the speed limit (Importance = 1). The distance from the centroid of their glances to the center of the speedometer and the center of the road scene (the “x”) are about the same, and the distance to the crash warning light is about double that (in this example).
Compute Salience—Here, assume that objects on the road, the road edges, and the warning light are equally salient, but the speedometer is much less salient. The resulting display salience ranks would be 2.5, 2.5, 1 (road scene, warning light, speedometer), so the sum of the ranks is constant. Furthermore, as a practical matter, allowing tied ranks speeds up the analysis process.
Compute Effort—The warning light is twice as far from the centroid as the other displays, so the effort ranks for the 3 displays are 1.5, 1.5, 3 (road, light, speedometer).
Compute Expectancy—If the road scene is most likely to change (i.e., curve) and the warning light is least likely to change, then the ranks are 3, 2, 1.
Compute Value—As a reminder, value is task importance don’t crash (=3), stay in lane (=2), and don’t speed (=1) multiplied by the information relevance. For the don’t crash task, the relevance ranks of the 3 displays are 2.5, 2.5, 1 (so the Values, the product, are 7.5, 6, and 3).
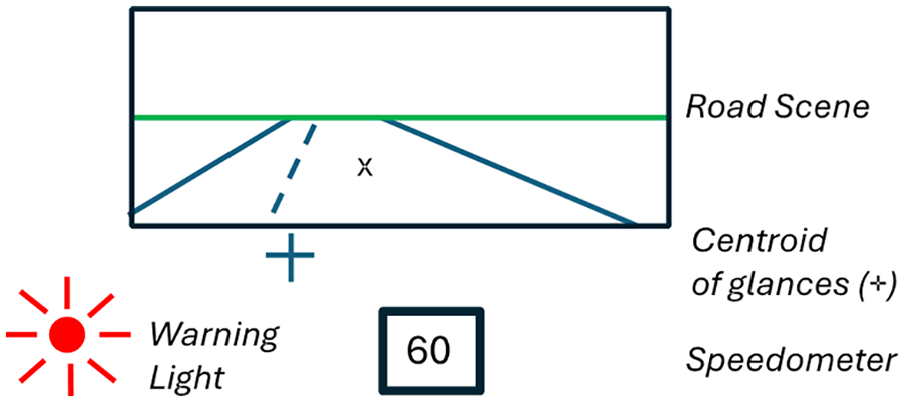
Example driving scene.
Using these ranks and other data, the results in Table 1 indicate a significant percentage of time is spent looking at the warning light (32%) for this hypothetical example, but crash events are rare, which is not captured by the ranks.
SEEV Calculations.
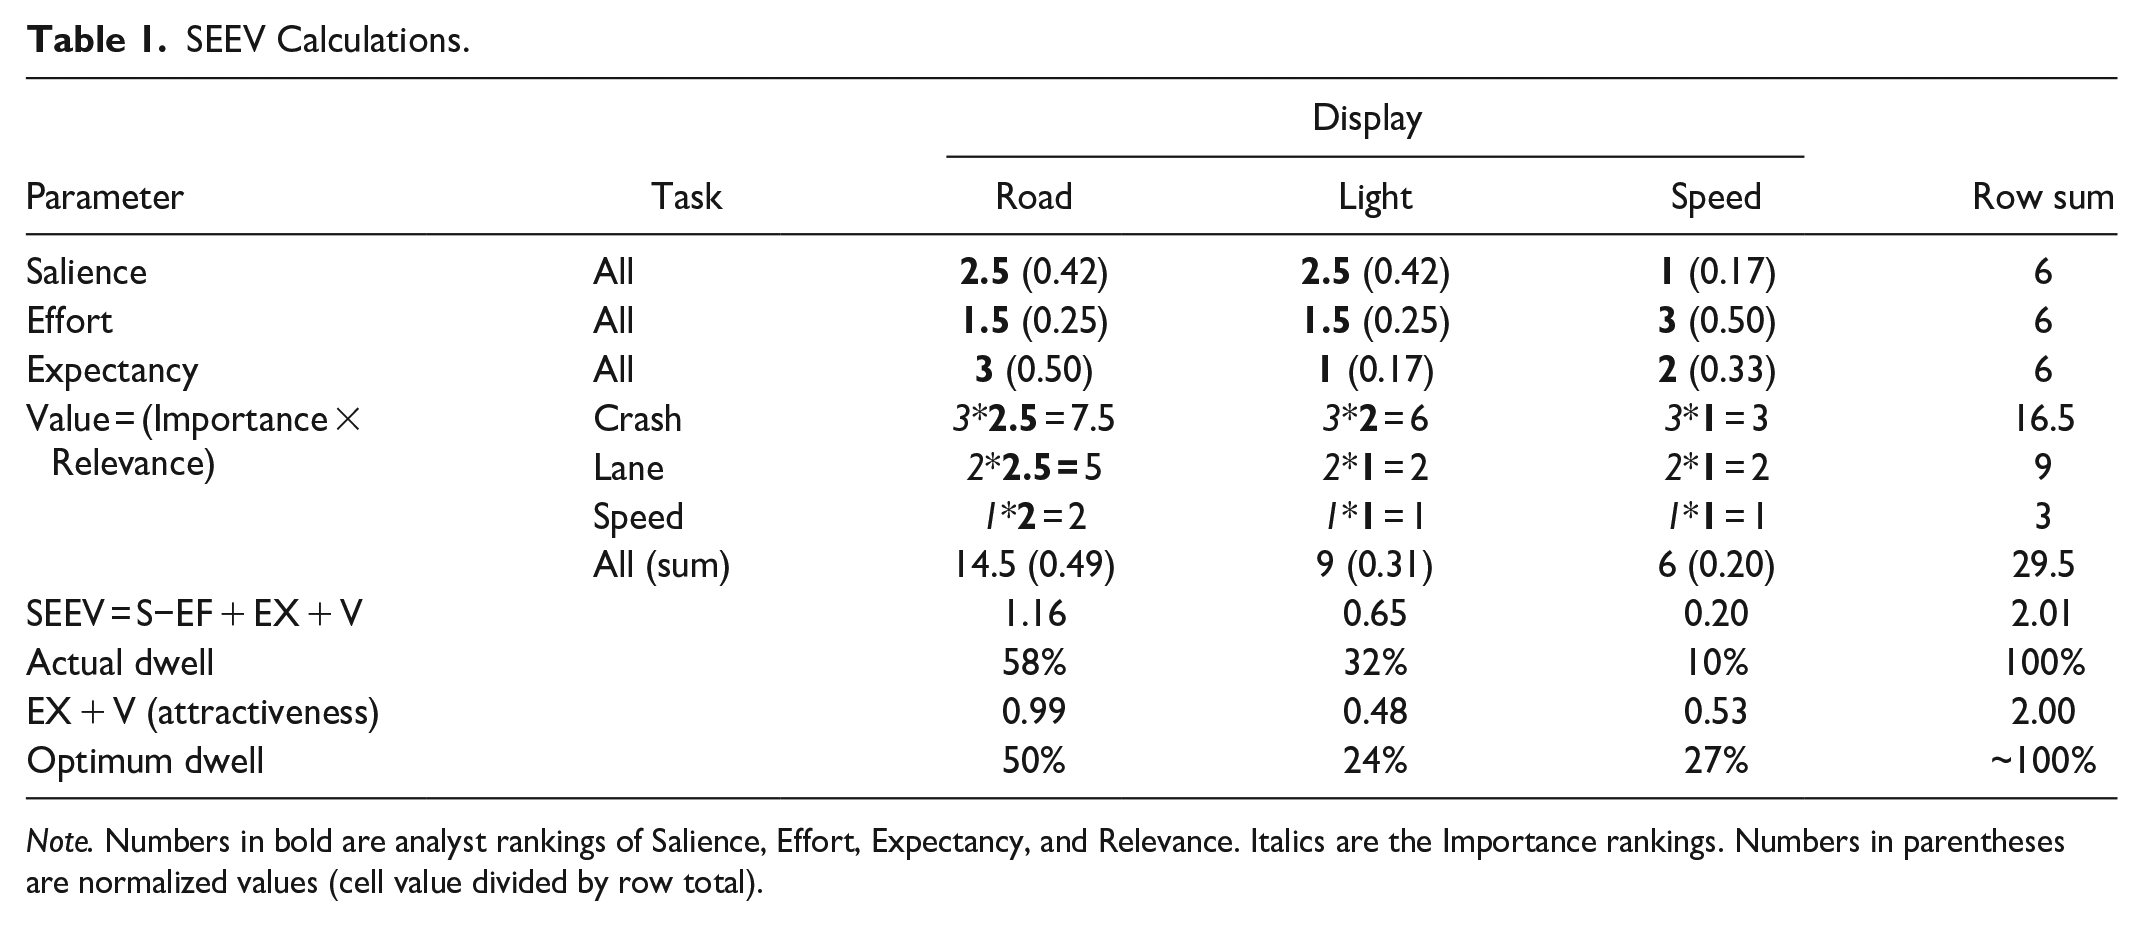
Note. Numbers in bold are analyst rankings of Salience, Effort, Expectancy, and Relevance. Italics are the Importance rankings. Numbers in parentheses are normalized values (cell value divided by row total).
The example presented is simpler than most real-world analyses. Analysis quality should improve as more tasks and more displays are included. Many assume that because SEEV was developed by well-known individuals and supported by high-quality research, the predictions are always both precise and accurate. As SEEV can be implemented in Excel, these assumptions can be examined, for example, by using ratings instead of ranking for the Importance or treating Relevance as Helpfulness (3 = necessary, 1 = relevant, 0 = not). In Table 2, rows 3 and 4, the road scene was treated as necessary for all tasks, the crash warning light as relevant only for crash, and the speed display as necessary for speed and helpful for crash.
Estimated SEEV Dwell Percentages (rounded off) for Value Parameters for Crash, Lane, and Speed Tasks.
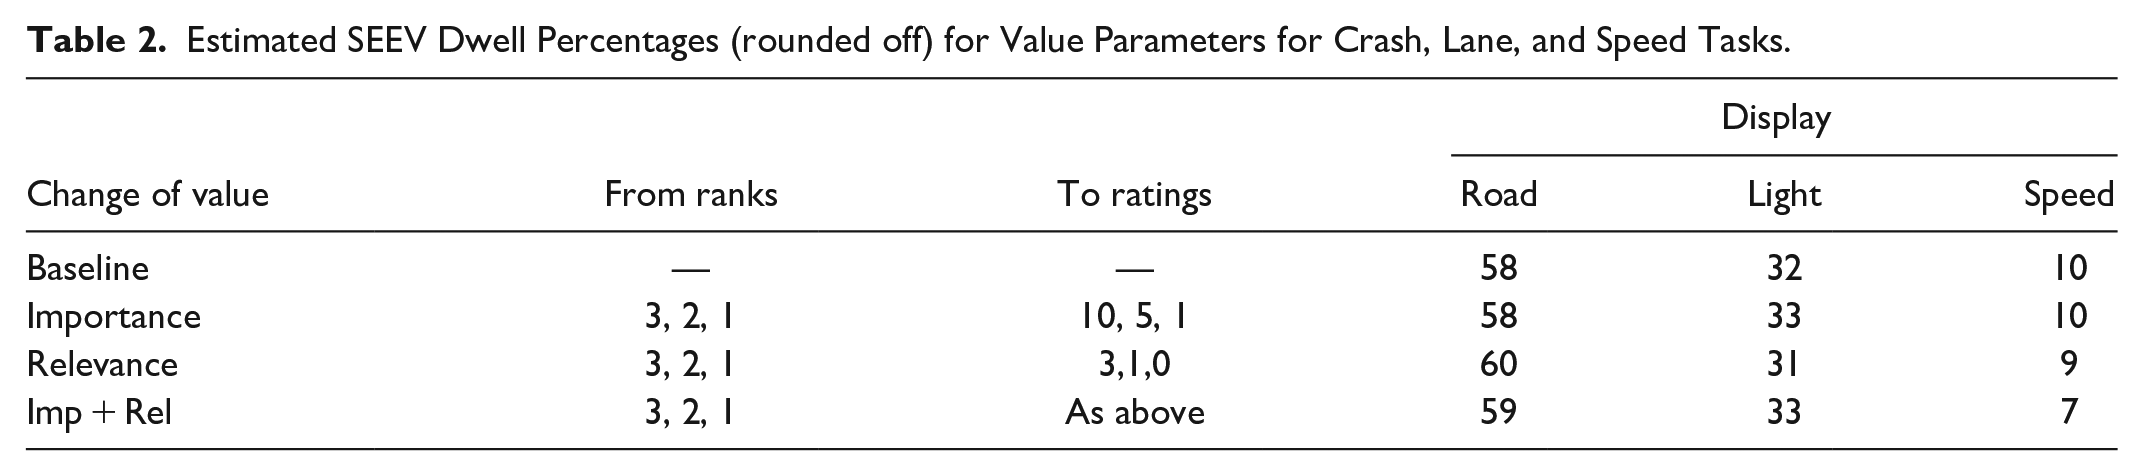
Note that the resulting changes were only a few percent. As they are easy to do and informative, the author suggests conducting sensitivity analyses examining the consequences of changing selected rankings and replacing ranking with rating data. This information should be included in SEEV analyses used to make design decisions to provide context.
Enhancement 1: Partitioning Displays into Zones Is Often Done for Heterogenous, Large Displays
For tasks such as driving, flying, and examining a patient, the user is seeking information from a scene, and where they look in the scene depends upon the task (e.g., driving curves, following lead vehicles). Similarly, for a display that provides multiple pieces of information that could be used at different phases of a diagnosis and could require multiple fixations to different locations to absorb all of the information presented, such as a patient monitor, the display should be divided into zones. Treating disparate zones as a single area of interest could result in misleading findings. For example, Wong and Huang (2011) partitioned a road scene into 7 zones based on how soon a driver would need to respond to an event in that zone (Table 3). Zone definitions will vary with the road geometry (e.g., intersection vs. open road). So, for example, at an intersection, how often drivers look at traffic signals or stop/yield signs is important.
Zone Numbers and Areas of Interest.
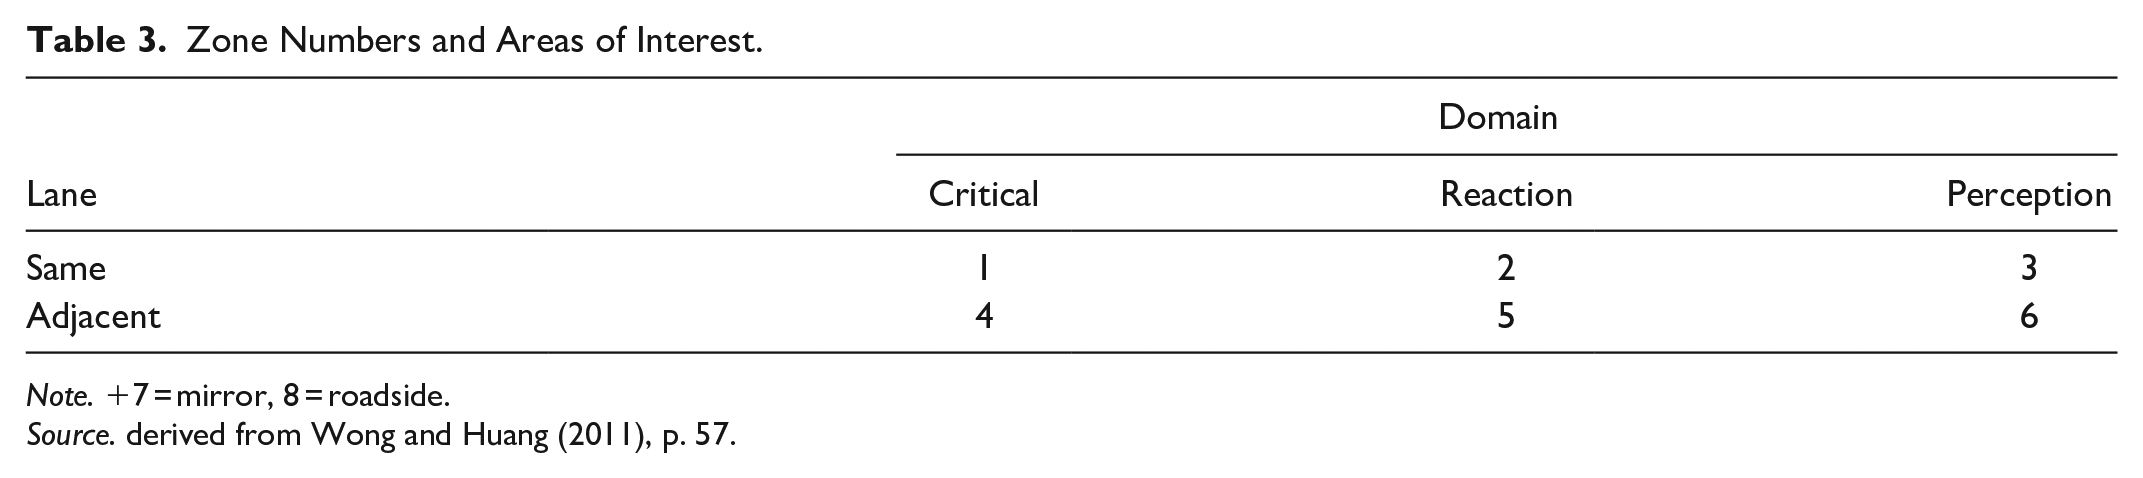
Note. +7 = mirror, 8 = roadside.
Source. derived from Wong and Huang (2011), p. 57.
How many zones are needed will also depend upon the task and the displayed information. For example, an older automotive instrument cluster will have a speedometer, tachometer, fuel gauge, engine temperature gauge, a grouping of warning lights, and possibly other information. For a detailed analysis, each of them could be a zone. To provide perspective, the field of view of foveal vision is 1 to 2 degrees, depending on the source cited. A thumbnail at arm’s length is about 2 degrees (Tobii, 2024). Given the limits of human vision and the capabilities of eye fixation recording devices, anything smaller than that does not make sense.
Enhancement 2: Categorize Information Relevance Based on Helpfulness (Necessary, Helpful, Not Relevant) Instead of Ranking It
Applications that implement this idea are the Adaptive Information Expectancy (AIE) Model (Wortelen, Bauman, & Lüdtke, 2013); Wortelen, Lüdtke, Baumann, et al., 2013), the Human Efficiency Evaluation (Feuerstack & Wortelen, 2015), and the Visual Attention Modeling Data Capturing Tool (AM-DCT) Feuerstack and Wortelen (2016). Of these, the Adaptive Information Expectancy Model appears to be the most complex as it is created within the Cognitive Architecture for Safety Critical Task Simulation (CASCaS) which predicts gaze behavior and task performance based on user goals, which at any given time can be absent, waiting, selectable or active. See Lüdtke et al. (2022). The links to some of the software mentioned in this paragraph no longer work.
The merits of this enhancement is based on practical experience. Rank ordering a series of information sources for multiple tasks is time-consuming. Some of the software for this purpose presents some or all possible pairs of information sources for a task, and requires a ranking for each pair. Furthermore, ties are not allowed, when in fact they are appropriate. However, quite often, the information sources for each task fall into the 3 categories (necessary, helpful, not relevant), and those decisions can be made more quickly than ranking. Of course, an analyst could make finer distinctions if they so desired and have four or five categories (e.g., necessary, very helpful, helpful, rarely helpful, not relevant). This is a judgment call the analyst makes primarily based on ease of implementation. Having rules for these decisions could help.
Enhancement 3: Determine the Extraction Efficiency of Information From a Source
How long people look at an information source not only depends on the value of the information but the difficulty of retrieving the information from the source. Harre and Feuerstack (2018) refer to “information insights,” identifying 11 perception categories and 1 comparison category (Table 4) as part of a series of steps to compute the “Konect” Value. From this emerged a scheme for ranking the visual efficiency of various decisions. What they have done is to comprehensively list the types of activities associated with various information processing tasks, a categorization that is very useful for determining task time. However, keep mind that SEEV analyses concern fixation probability, which can be independent from dwell times assessed here (Wickens, 2024, personal communication).
Measures of Visual Efficiency.
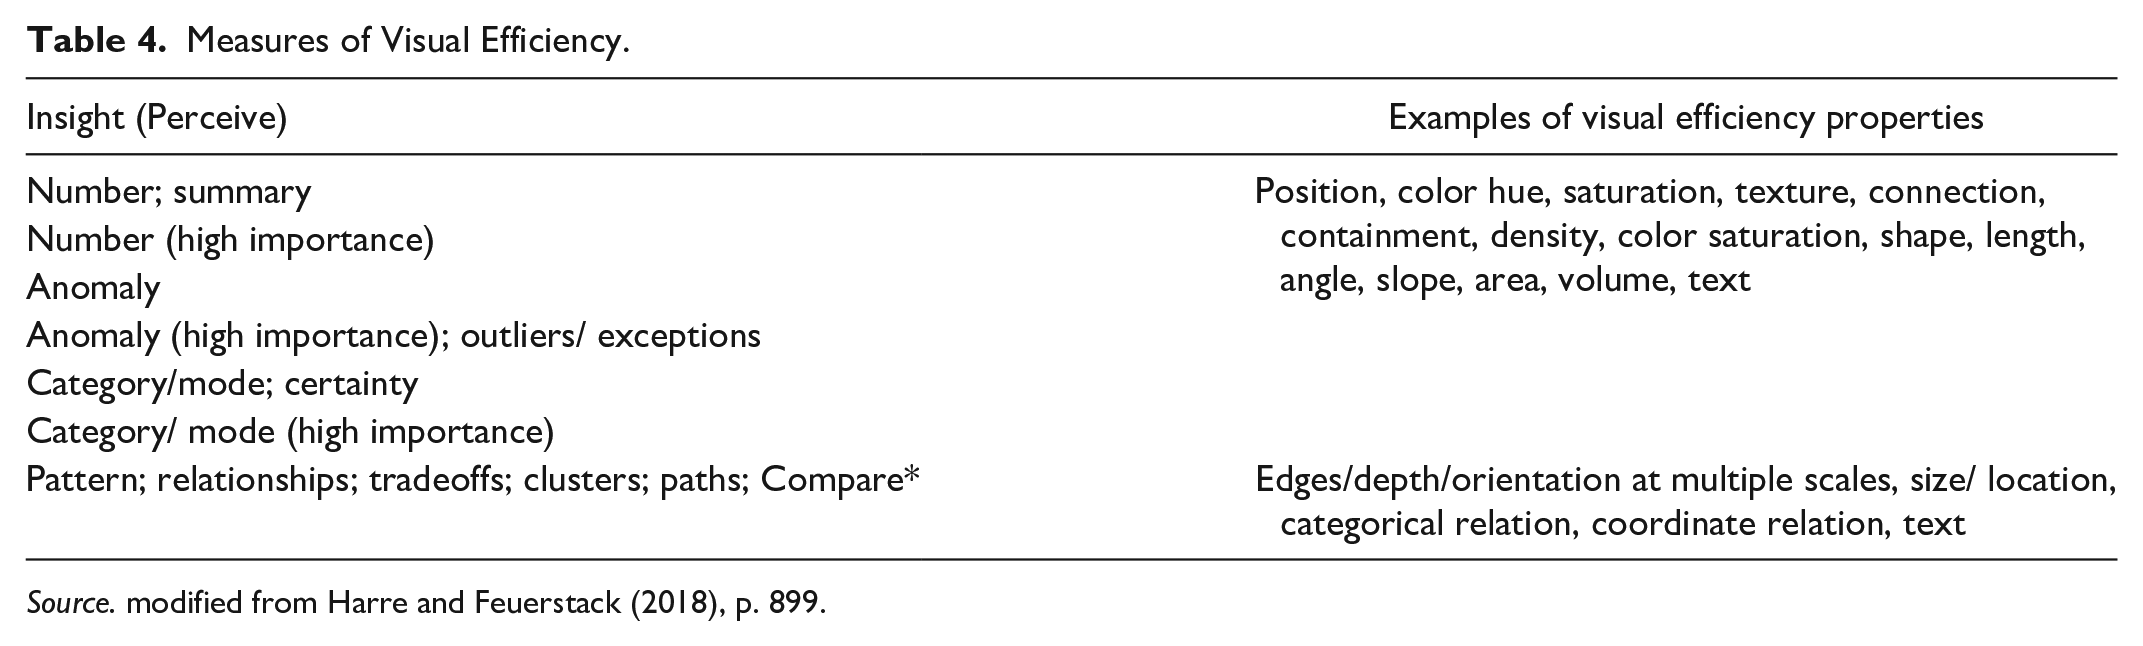
Source. modified from Harre and Feuerstack (2018), p. 899.
Enhancement 4: Compute Salience, an N-SEEV Prelude
N-SEEV, a derivative of SEEV, is extremely valuable for human factors analysis because it estimates the mean time to notice a critical event, miss rates, and other useful information in practice. In N-SEEV, computing salience is extremely complex, with the details first appearing in Itti and Koch (2000) and more recently summarized in Itti (2023). An excellent description of the computation of salience for application to SEEV calculations appears Eijssen’s 2021 thesis.
“The saliency component was implemented using the Salience Toolbox . . . and expanded with the saliency detection algorithm . . . . Early vision features (color channels, orientation, and brightness) were extracted from a video frame. Local feature pyramids were used to construct a contrast map. Using center-surround differences, conspicuity maps for each feature . . . were formed . . . Finally, feature maps were combined into a single conspicuity map [static saliency map]. . . . a static saliency map was created for each 10th frame of the video” (Eijssen, 2021, p.11). “. . . Dynamic saliency was computed by creating a difference map between two consecutive model-predicted static saliency maps (e.g., the difference between the salience map of the 10th and 20th video frames). . . . Finally, a static and a dynamic salience score were calculated for each AOI [Area of Interest] by adding the value of each pixel of the saliency map within an AOI and dividing it by the saliency value of all pixels. ” (Eijssen, 2021, p.12).
The author strongly recommends reading the Eijssen (2021) thesis because the SEEV-related measure descriptions are excellent and the MATLAB code for all measures is provided.
Enhancement 5: Use Complete Analysis Tools, Assuming You Can Get Them and Have Time to Learn How to Use Them
In addition to the applications mentioned so far, in particular, Eijssen, there are several that have been created with specific domains in mind.
Example 1: MIDAS Simulation Environment
Gore et al. (2009) describes an implementation of SEEV in MIDAS (Man-machine Integration Design Analysis System), software used by NASA for examining aircrew activities. For those unfamiliar with it, MIDAS, via a GUI, provides dynamic visual representations of the simulation environment, human performance model outputs (including timelines, workload, and situation awareness), performance shaping factors (e.g., fatigue), and libraries of basic human operator procedures, as well as probabilistic scan paths for its perception model and various duration distributions (e.g. gamma, lognormal). MIDAS is more complex than other discrete event simulation models such as IMPRINT (Improved Performance Research Integration Tool; Anonymous, 2023) in that perception is a 3-stage, time-based perception model (undetected, detected, comprehended) for objects inside the workstation and a 4-stage, time-based perception model (undetected, detected, recognized, identified) for objects outside the workstation. Figures 2 and 3 shows sample salience and relevance screens used by analysts.
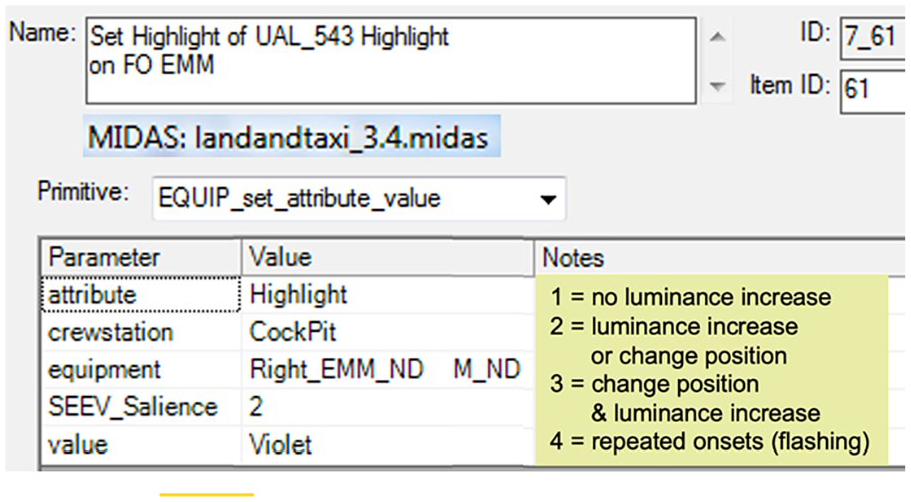
Assigning salience in MIDAS.
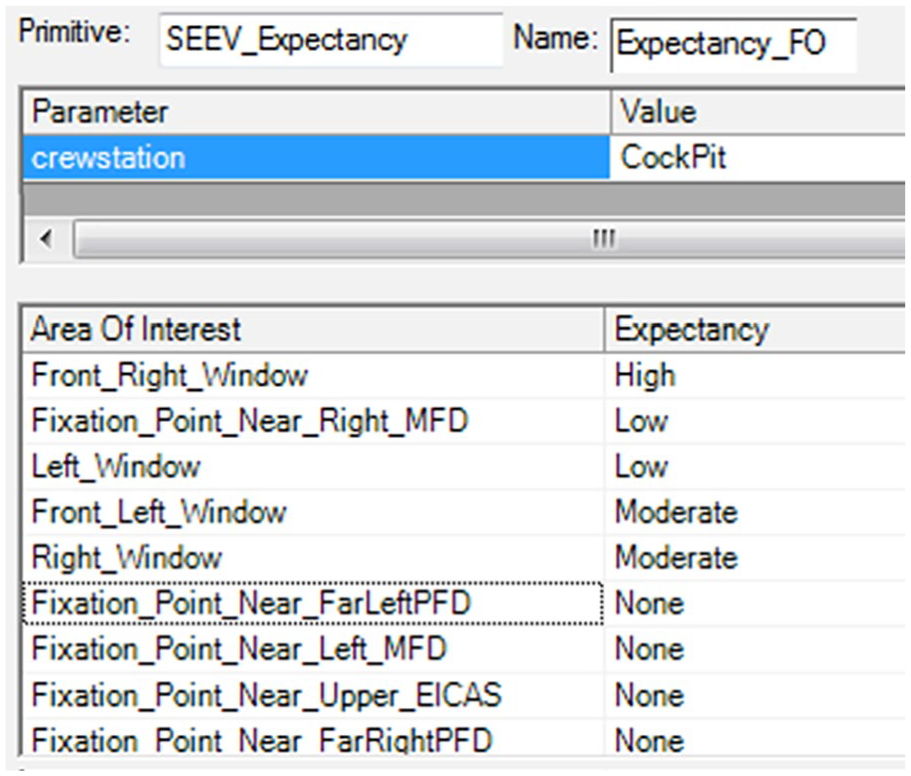
Assigning relevance in MIDAS.
Example 2: ADAT Flight Deck Modeling Tool
The Automation Design Advisor Tool (ADAT, Sebok et al., 2011; Sebok et al., 2012; Wickens et al., 2013) was designed to overcome problems with current flight management systems, specifically interaction complexity, use of abbreviations and acronyms mode confusion, and overrides, among others. ADAT provided rules for scoring human factors design issues on a scale from 0 to 10 based on compliance with good human factors design principles and provided predictions of pilot performance including scanning and noticing behavior. References are provide to publications for each principle, a huges plus ADAT consists of six modules: layout, changes, meaningfulness, confusability (alphanumeric and graphical), complexity, and procedures. ADAT produces predictions for SEEV and N-SEEV.
Example 3: Custom SEEV Tool with Visualization
Finally, Rheem et al. (2021) describe a GUI-based implementation of the most recent version of SEEV/N-SEEV that includes a complete salience model, and inhibition of return to a recently viewed area, and has other features to improve SEEV estimates that are not in the original SEEV equation. The SEEV Modeler produces visualizations of simulation results, which include a heatmap of attentional distribution and the trajectory of simulated eye movements, something that other software does not provide. The model is implemented in MATLAB, but there is no public source for the code. However, the model has been well validated and the visualization is a big plus for convincing management of issues that need resolution.
Conclusion: Great Science But Good Luck with the Tools
The SEEV model has been the topic of numerous publications, with successive enhancements adding accuracy to the calculations at the cost of greater complexity and presumably greater analysis time. As a first step for considering which enhancement to choose, the paper identifies some of the options. However, it is to be emphasized that even in its most basic form, the SEEV model can provide useful insights into display design problems, in part because the Excel models are easy to create, and what-if variations are easy to explore.
Those who continue to work if SEEV are encouraged to place their software in accessible repositories such as GitHub and to develop in languages that will be stable over time such as MATLAB.
For additional information, see a recent summary by Wickens (Wickens, 2021), Eijssen’s 2021 thesis, and Green (2024), the report on which this paper was based.
Footnotes
Declaration of Conflicting Interests
The author declared no potential conflicts of interest with respect to the research, authorship, and/or publication of this article.
Funding
The author disclosed receipt of the following financial support for the research, authorship, and/or publication of this article: The report on which this paper is based was supported by Nissan North America via Purchase Order 9200020692 with the University of Michigan. The author does not have any financial interest in Nissan or its competitors. The ideas expressed are those of the author (as informed by Chris Wickens).