
Abstract
This study investigates how performance variation in AI-infused systems, specifically in-vehicle voice control systems, affects user trust. The frequent updates of AI-infused systems over the air raise concerns about the unstable performance of AI-infused systems, due to uncertainty and inexplicability of AIs. Employing a Wizard of Oz simulation with 27 participants, the study manipulated the accurate correct rates of voice command responses to represent system updates, measuring the perceived correct rate and trust after each update. Results suggest that the way the system evolves can impact users’ trust in the current version of the system, but this effect fades out with time. Moreover, users’ perception of performance, rather than the actual performance, has an impact on users’ trust. The research underscores the importance of managing users’ perception of system performance to maintain user trust and contributes to the knowledge of the relationship between AI evolution and user trust.
Keywords
Introduction
With the development of artificial intelligence (AI) and the computing power in personal devices (such as smartphones, smart home systems, and smart cabins in vehicles), AI-infused systems (AISs) are becoming increasingly popular (Gorwa et al., 2020; Jan et al., 2023; Lockey et al., 2021). At the same time, nowadays, commercial companies frequently take Over-The-Air (OTA) updates of AIS (Andrade et al., 2019), which raises concerns about the unstable performance of the AIS due to uncertainty and inexplicability characteristics of AIS. Specifically, although the OTA aims to improve the overall performance of the system, it may downgrade the performance of certain functions temporarily to balance the computing power or simply due to the instability of new algorithms (Kocielnik et al., 2019).
This variation in the system performance may impact users’ trust in the system and further affect their reliance on the system (Dzindolet et al., 2003). It has been widely acknowledged that trust in a system is a dynamic process (Falcone & Castelfranchi, 2004; Lee & See, 2004). For example, previous research has pointed out that experiencing system failure can undermine users’ trust in the system (Madhavan et al., 2006) and it takes a relatively long time for them to rebuild their trust (Lee & Moray, 1994). Thus, inappropriate strategies in adjusting the system performance may cause users to stop using the systems. However, previous research on dynamic trust usually targeted systems with infrequent failures (Yu et al., 2017) or systems that are safety-critical, such as driving automation (Ayoub et al., 2022; Huang et al., 2023). For systems that have relatively high failure rates but low-risk outcomes (such as voice control systems), users’ trust in the system might be based on their interactions with the systems over a relatively long period and hence, it is necessary to investigate: (a) the relationship between users’ perceived system reliability (as measured by perceived successful rate) and their trust in a system; (b) and whether and how system performance variation can affect users’ trust in the system.
To answer these research questions, in this study, we designed a Wizard of Oz (WoZ) system to simulate voice control systems (VCSs) in smart cabins of vehicles. We chose VCS in the study as it is common in daily life, frequently updated in daily devices (such as smartphones and smart cabins), and with relatively unstable performance. The response accuracies of the VCS varied throughout the study to simulate OTAs. The findings of this study can help AIS providers (such as designers of smart cabins) select better roadmaps to update low-risk AIS if certain functions must be compromised and design strategies to re-attract users if negative events have happened.
Method
Participants and Experiment Design
In total, 27 participants (17 male and 10 female) with an average age of 28 years old (min: 16, max: 54, standard deviation [SD]: 10) completed the study remotely. The participants were required to have access to a computer and take part in the experiment in a quiet and undisturbed environment.
To control the actual correct rates participants experienced precisely, the researcher designed a Wizard of Oz (WoZ) system to simulate the VCS. Specifically, the experimenter manually played pre-recorded responses to participants’ queries. The pre-defined questions were related to the vehicle functions (e.g., opening the window) or infotainment systems (e.g., playing music) and the participants could easily tell the correctness of the responses by the VCS. To make the VCS appear realistic, the entire experiment was conducted remotely in the virtual remote meeting room. The virtual animation (Figure 1) was displayed on a shared screen representing the states of the VCS.

Screenshot of the VCS virtual animation.
Procedure
As shown in Figure 2, upon the start of an experiment, the participants signed the consent, told that they were recruited to test a VCS system developed by our research team, and were instructed on how to interact with the VCS. Each participant was required to give three batches of 10 queries to the VCS, totaling 30 queries per participant. Between batches, the participants were told that the system version had been upgraded. To simulate the variation in VCS performance, three actual correct rates (ACRs) of responses were used, that is, 50%, 70%, and 90%, leading to 27 possible combinations in the three batches (3*3*3). The failures happened randomly in each batch, but the participants were not informed of the ACR of the VCS. Participants were randomly assigned to one of the 27 combinations.
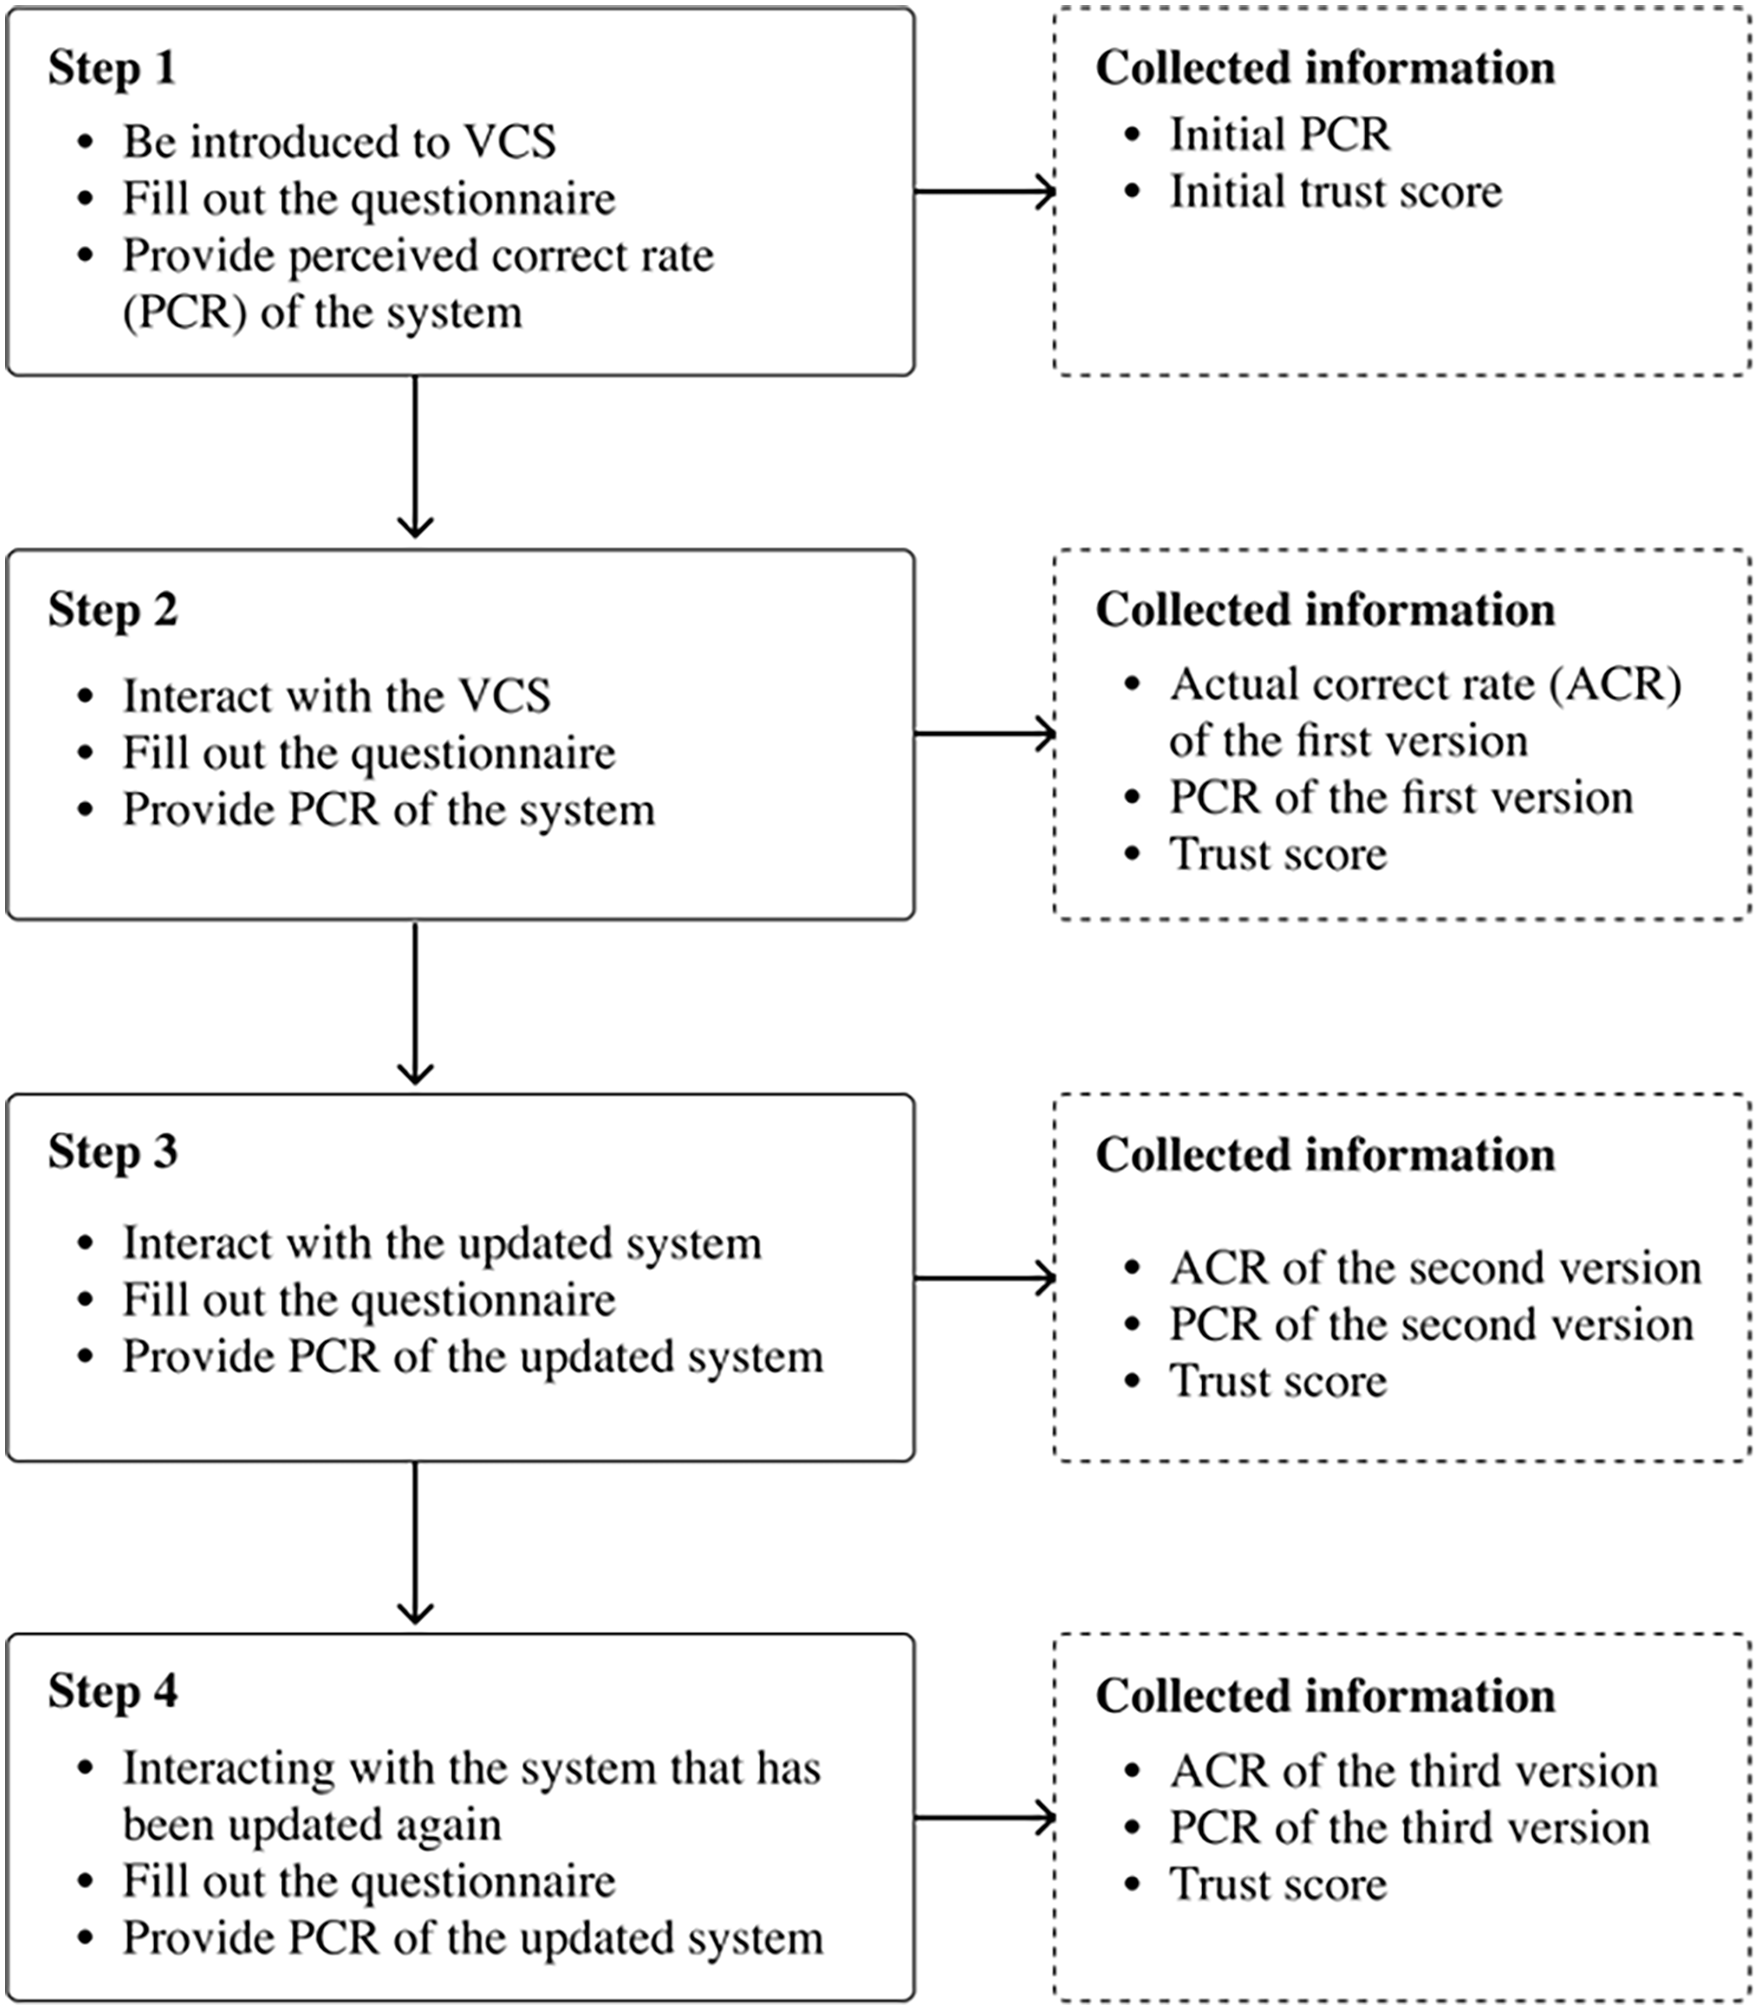
Flow diagram of experiment process.
Before initial interaction with the VCS, each participant completed a Trust between People and Automation questionnaire (Jian et al., 2000) to measure their initial trust in VCS. After participants finished each batch, they reported their trust in and their perceived correct rate (PCR, ranging from 0% to 100%) of the latest VCS they had just experienced. The trust score ranges from 1 (“not at all”) to 7 (“extremely”). No participant found that the VCS was fake.
Dependent Variables and Statistical Models
In this study, we investigated how the actual and perceived variations in VCS accuracies can affect users’ trust in the VCS. To account for the individual differences in propensity to trust and given that we are interested in the influence of performance variations on users’ trust in VCS, we calibrated one’s trust in different versions of the VCS based on everyone’s initial trust (i.e., trust = trust in the current version—initial trust). Four mixed linear models were built in “SAS OnDemand for Academics”:
- Model 1 explored how the performance of the current actual system (Current ACR) and variations in system performance (change in ACR = ACR of current version—ACR of previous version) can affect users’ PCR of the system. As a result, 81 (27 participants * 3 versions per participant) data points were used in this model.
- Model 2 and Model 3 explored how users’ trust in the system can be affected by variations in system performance (change in PCR = PCR of current version—PCR of previous version), and the perceived performance of the current (Current PCR) and previous system version (Previous PCR), respectively. As a result, 54 (27 participants * last 2 versions per participant) data points were used in Model 2 and Model 3.
- Model 4 explored how the performance of the current system and the perceived patterns of system variation in the previous two versions (i.e., PP, including “continuous increase”; “continuous decrease”; “first increase, then decrease”; “first decrease, then increase”; “remain unchanged”; “first unchanged, then increase”; “first unchanged, then decrease”; “first increase, then unchanged”; “first decrease, then unchanged”) can affect users’ trust in the system. As a result, 27 data points were used (27 participants * 1 final version per participant)
Results
The model results are shown in Table 1. First, as expected, users’ PCR of the system can be influenced by the ACR of the current system (Model 1); but not by the ACR in previous versions, as shown in Figure 3. Specifically, for every 1% increase in ACR, the PCR increased by 0.3%, with a 95% confidence interval (95%CI) of [0.013%, 0.59%].
Model Results.
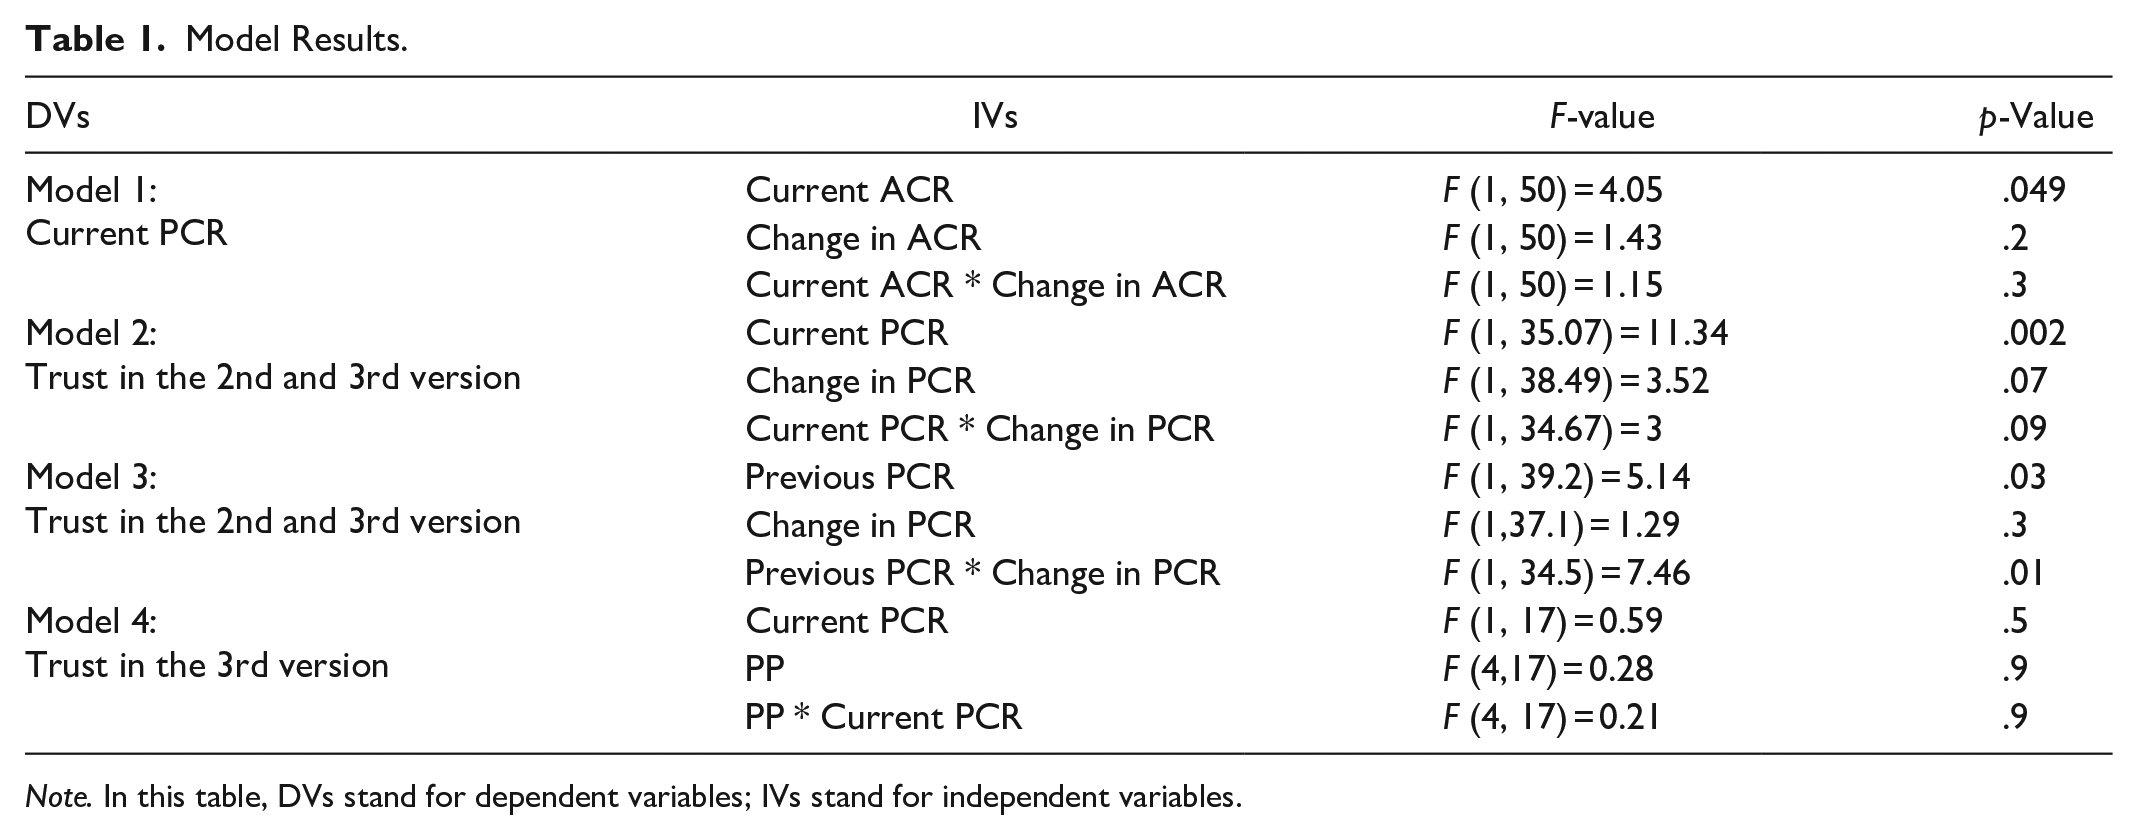
Note. In this table, DVs stand for dependent variables; IVs stand for independent variables.
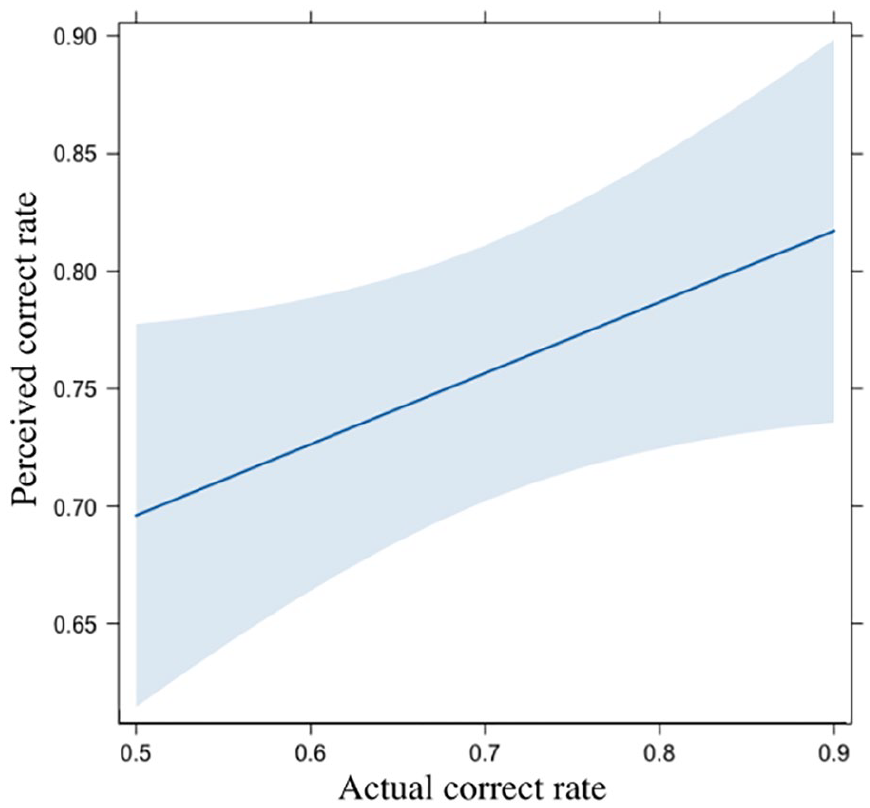
The effect of ACR on PCR in Model 1. In this figure and the following figures, the shadow represents 95% confidence intervals (CIs) of the fitted curve.
Then, we explored the influential factors of users’ trust in the VCS and found that participants’ trust in the systems was positively associated with the PCR of the current VCS version (Model 2), as shown in Figure 4. Specifically, for every 1% increase in PCR, users’ trust in VCS increased by 0.04, with a 95%CI of [0.02, 0.06]. However, the change in PCR between the current and previous VCS versions did not affect users’ trust in the current version. Instead, as shown in Model 3 and Figure 5, we observed an interaction effect between users’ perceived change of PCR (between the previous version and the current version) and the users’ perceived correct rate of the last version (i.e., PCR of the previous version). We found that with the increase of the PCR of the previous version, the influence of the Change in PCR on users’ trust in VCS reduced.
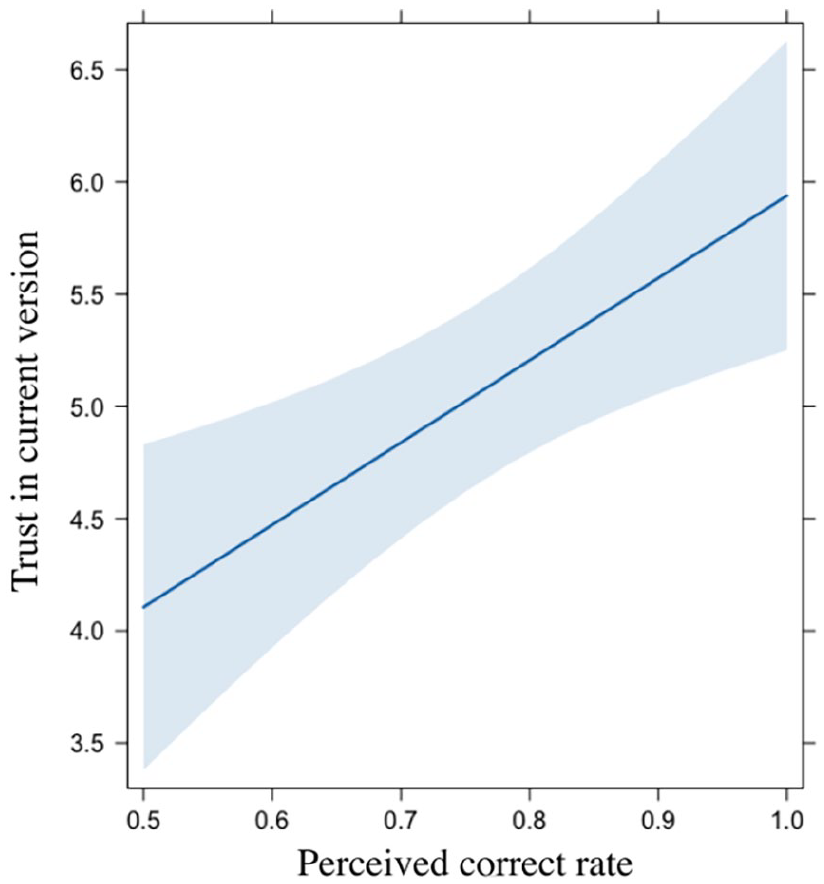
The effect of PCR on trust in Model 2.
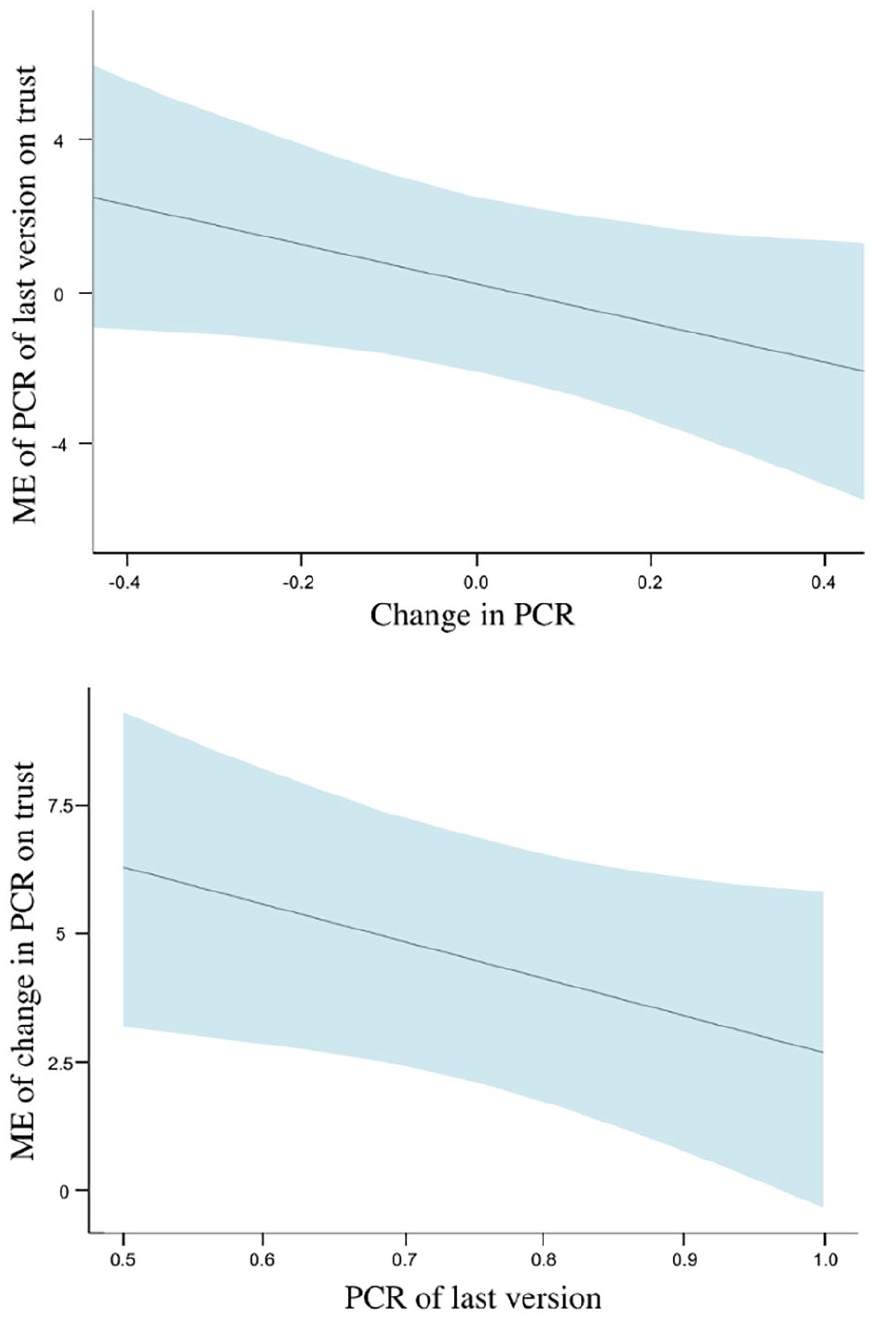
The marginal effects (ME) of the interaction effects between Change in PCR and the previous PCR in Model 3.
The perceived pattern of the system upgrades (i.e., perceived correct rates of the first two versions of the VCS), surprisingly, did not affect the trust in the 3rd version (Model 4), potentially because users’ impression of the first two versions fades out over time.
Discussion
In this paper, we investigated how trust changes with the variations of VCS performance through a WoZ experiment. Though previous studies investigated the evolution of trust in relation to users’ familiarity with automation over time (Huang et al., 2022, 2023), most of them assumed that the system performance was consistent, which may not hold with the prevalence of OTA. Thus, our study can provide more insights into the influence of system performance variations on users’ attitudes toward the AISs.
First of all, as expected, we found that users’ perceived correctness of the system (i.e., current PCR) can be correlated with the actual system performance (i.e., current ACR in Model 1) and that users’ trust in the current system can be affected by users’ perceived system performance of the current system (i.e., current PCR in Model 2). This finding is in line with Yin et al. (2019), which found that while the stated accuracy of AIS can influence trust, the actual observed accuracy experienced by users has a more significant impact, ultimately overshadowing the stated accuracy. Thus, efforts can be made to increase the users’ awareness of the system improvement if we aim to increase users’ trust in an AIS system.
At the same time, it is interesting to notice that although historical system performance (i.e., change in PCR) did not affect users’ perceived system performance (i.e., current ACR in Model 1), it can affect users’ trust in the system indirectly. In general, we found that the way the system evolves can impact users’ trust in the current version of the system, but this effect fades out over time. Specifically, the large variation in the system performance relative to the previous version can diminish the marginal effect of the system performance in the current version (see Model 3). Thus, system designers may need to consider this effect to balance the cost and return of certain system optimization.
The effect of system variations, somehow, fades out over time, as only the previous version of the system can affect users’ trust in the current system version, but the 1st version cannot affect users’ trust in the 3rd version (see Model 4). We propose that this decline could primarily stem from the limitations of working memory, suggesting that recent PCRs rather than earlier ones had more influence on one’s attitudes toward AIS. This finding is in line with previous research to some extent, which found that users’ trust in safety-critical systems may drop after experiencing a failure but recover slowly if the system runs smoothly for an extended period (Mishler & Chen, 2023). The users may likely have fresh memories of the failure, and their memory diminishes over time.
Finally, it should be noted that although the findings of this study contribute to the understanding of system performance variations on users’ trust in AISs, the readers should be cautious about the online nature of the interaction with the VCS we adopted, as it may limit our ability to ensure participants were fully engaged with the task. The conclusions drawn from our study may also not apply to more safety-critical AIS systems, such as driving automation. Future research is needed to validate our findings in broader fields with a larger sample size.
Footnotes
Declaration of Conflicting Interests
The author(s) declared no potential conflicts of interest with respect to the research, authorship, and/or publication of this article.
Funding
The author(s) disclosed receipt of the following financial support for the research, authorship, and/or publication of this article: This work was supported by the Guangzhou Municipal Science and Technology Project (No. 2023A03J0011), and the Project of Hetao Shenzhen-Hong Kong Science and Technology Innovation Cooperation Zone (HZQB-KCZYB-2020083).