
Abstract
This study introduces and validates a new metric for assessing takeover performance in conditionally automated driving, using Fréchet Distance. Fréchet Distance is a measurement that measures the similarity between two separate curves. Thirty-two participants took part in a simulated driving experiment. Employing a 2 × 2 within-subjects design, the study compared traditional takeover performance metrics, including takeover time, time to collision, and resulting acceleration, with Fréchet Distance. Analysis results revealed similar trends between traditional metrics and Fréchet Distance. These findings suggest that Fréchet Distance can effectively measure takeover performance by integrating spatial and temporal aspects.
Introduction
According to the Society of Automotive Engineers (SAE), vehicles at level 3 and above are considered autonomous and equipped with automated driving features. Level 3 autonomous vehicles can perform driving tasks and monitor the driving environment to a certain extent, but the driver must resume control of the vehicle when prompted by the vehicle (SAE International, 2014). Unfortunately, drivers disengaged from the operational control of the vehicle often encounter challenges in resuming control promptly and successfully (Ayoub et al., 2019; Du et al., 2020a; Eriksson & Stanton, 2017; Gold et al., 2016).
In response to this challenge, numerous prior studies have investigated drivers’ takeover performance in Level 3 conditional autonomous vehicles. These studies aimed to identify factors influencing takeover performance, such as situation urgency (Du et al., 2024; Roche & Brandenburg, 2018), driver’s state (Du et al., 2020a), and human-machine interface (Du et al., 2021; Politis et al., 2015; Trask et al., 2019; Zhang et al., 2023).
Various measurements have been employed in these studies to assess performance in takeover situations, such as takeover time, minimum time to collision, and longitudinal/lateral accelerations (Cao et al., 2021; Du et al., 2020a; Gold et al., 2016; Naujoks et al., 2014). The diverse measurements for assessing takeover performance make the synthesis of findings, the summarization of the impact of different factors, and the comparison of the effectiveness of various designs intended to facilitate takeover transitions difficult.
Takeover Time and Quality Aspect
There are two aspects of takeover performance measurement: timeliness and quality (Cao et al., 2021; McDonald et al., 2019). Measurements related to time are commonly utilized during the stages leading up to action execution to assess the speed of a driver’s response. These measurements can differ based on whether they involve a visual or physical process (McDonald et al., 2019). Visual process measurements involve measuring gaze reactions concerning how drivers regain awareness and cognitive readiness. On the other hand, physical process measurements involve measuring the duration of the driver’s interaction with the automated vehicle to achieve motor readiness. Measurements related to quality are typically assessed by examining the vehicle’s dynamics resulting from drivers’ actions. These measurements include various elements related to takeover maneuvers, such as the distance between the ego vehicle and potential collisions, speed, collision occurrences, and the behavior of the steering wheel and pedals (Cao et al., 2021; McDonald et al., 2019).
Trajectory and Fréchet Distance
There have been attempts to analyze takeover performance by using the driving trajectory. For example, Holländer and Pfleging (2018) measured standard deviation from a fixed ideal trajectory to identify how much the driving performance deviated, and Ito et al. (2016) compared the trajectories visually by outlining a graph within the subject by varying conditions. Gold et al. (2013) and Lorenz et al. (2014) used a schematic illustration of all subjects and analyzed the effect of each condition such as time to collision until the obstacle. Fréchet distance is widely used to measure the similarity between two curves, which considers the location and ordering of the points along the curves. Successful applications include route identification (Lyu et al., 2021) and driver-car matching (Meng et al., 2019). However, in order to measure the similarity of two trajectories using Fréchet distance, an optimal trajectory needs to be generated.
The theoretical optimal trajectory can be obtained as the solution to minimizing a cost function provided by Abbas et al. (2017). Its goal is to achieve a tradeoff between tracking the center line of the corridor and regulating the steering rate input while avoiding obstacles.
The trajectories contained temporal and spatial information of the optimal vehicle states at different time points. After obtaining the theoretical optimal trajectory, the Fréchet distance between the theoretical optimal and the actual trajectories can be calculated using the following equation:

where
Our current study aims to integrate takeover timeliness and quality into a single metric using Fréchet distance by generating an ideal trajectory and comparing the actual driving trajectory to the ideal trajectory. By this, we expect to mediate the forementioned issues of having diverse measurements. We hypothesize that the result of evaluating takeover performance through Fréchet distance would align with the results using existing metrics and reflect takeover performance.
Methods
Participants
A total of 32 participants (average age = 25.8 years, SD = 4.4 years, 16 females, 16 males) with normal or corrected-to-normal vision participated in the experiment. Each participant received a payment of $30 for their participation. The study was approved by the University of Michigan Institutional Review Board.
Apparatus and Stimuli
Driving Simulator and Automated System
The study was conducted in a fixed-base driving simulator from Realtime Technologies Inc. (RTI, Michigan). The virtual world was displayed on three monitors, located approximately 4 feet in front of the participant (See Figure 1). The simulated vehicle was controlled by a steering wheel and pedal system. The vehicle was programmed to simulate the behavior of an SAE Level 3 automation, which handled the longitudinal and lateral control, and navigation, and responded to traffic elements. Participants could press the button on the steering wheel to activate the automated mode, which was indicated by an auditory sound and a blue light on the dashboard. Whenever the autonomous vehicle (AV) reached its system limit, a take-over request was issued, consisting of a spoken auditory warning (“Takeover”) and the disappearance of the blue light on the dashboard. At the same time, the automated mode would be automatically deactivated for the driver to take over control of the vehicle.
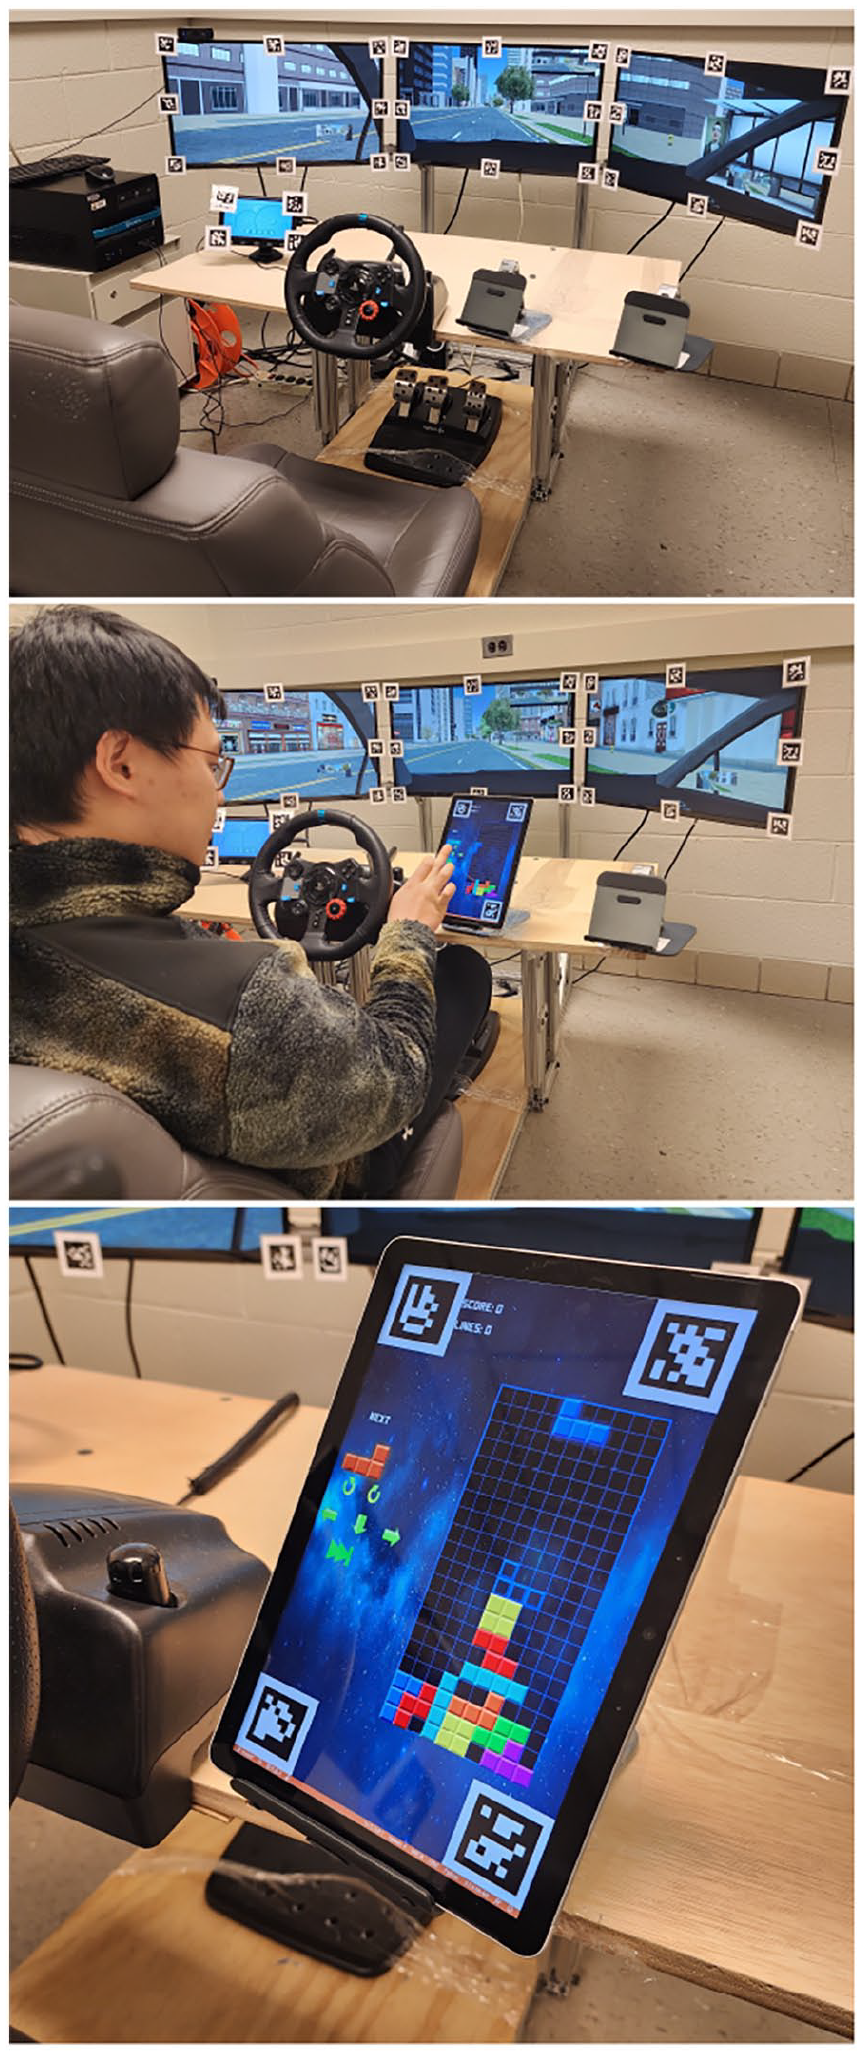
RTI driving simulator and NDRT.
Non-Driving Related Task
Participants were asked to play the Tetris game when the vehicle was in automation mode. The NDRT task was selected to promote increased drivers’ eyes-off-the-road and hands-off-the-wheel conditions anticipated in SAE Level 3 automated driving mode. In the Tetris game, puzzle tiles were randomly generated and presented. The task was running on an 11.6-inch touchscreen tablet mounted next to the steering wheel (See Figure 1).
Experimental Design
The experiment used a 2 × 2 within-subjects design with two independent variables: takeover lead time and tablet location. The two variables were chosen to induce a varying degree of takeover performance. Takeover lead time has been shown to significantly influence takeover performance (Du et al., 2020; Eriksson & Stanton, 2017), and tablet location also impacts drivers’ car following performance (Lamble et al., 1999). Benchmarking previous studies (Du et al., 2020; Eriksson & Stanton, 2017), the takeover lead time was set to 4 or 7 s. The tablet was placed 25 or 55 centimeters away from the steering wheel for the participant to perform the secondary task. The sequence of the four conditions was balanced using a balanced Latin square design. Each participant experienced four takeover events in the experiment: Construction ahead, Police vehicle on shoulder, Stationary bus ahead, and Lead vehicle sudden stop.
Four takeover performance measurements were measured as dependent variables: Takeover time, Time to collision, Maximum resulting acceleration, and Fréchet Distance. These measurements are commonly and frequently used from previous studies to evaluate takeover performance
• Takeover time (TOT) (s)— time aspect
Takeover time is defined as the time between when the TOR is given and the point where the participant moves the steering wheel over 2 degrees or the pedal over 3 degrees.
• Minimum time to collision (TTC) (s)—quality aspect
The minimum time to collision is calculated as the minimum value of remaining time until a collision with the obstacle ahead assuming a constant speed of the vehicle at the moment.
• Maximum resulting acceleration (MRACC) (m/s2)—quality aspect
The maximum value of the square root of the sums of squares of lateral, longitudinal acceleration during the takeover situation.
• Fréchet distance (m)
measure of similarity between the ideal and actual trajectory of the vehicle.
Procedure
Upon arrival, participants provided informed consent and filled out a demographic survey. The participants were given an introduction that described the experiment. Next, participants received a training session to familiarize themselves with the driving simulator and the Tetris game. During the training, participants practiced how to drive, change lanes, and engage/disengage in the automated driving mode. They were also introduced to the visual display and auditory alerts for takeover requests. Participants were then asked to drive the simulator until they felt comfortable handling the simulator controls. After that, participants played the Tetris game to get familiar with it.
As shown in Figure 2, the main experiment began with the command to activate the automated driving mode. After that, there was an NDRT phase where participants were asked to play the Tetris game. Participants were informed that there was no need to monitor the environment when the AV was in automated driving mode. Once a TOR was issued, participants were required to take over control of the vehicle immediately. Participants were instructed to comply with all the traffic laws when they drove manually. They were informed that the speed limit was 35 mph. Participants could hand back the control to the AV after they negotiated the driving situation. When the AV was re-engaged, participants were asked to complete a short questionnaire verbally.
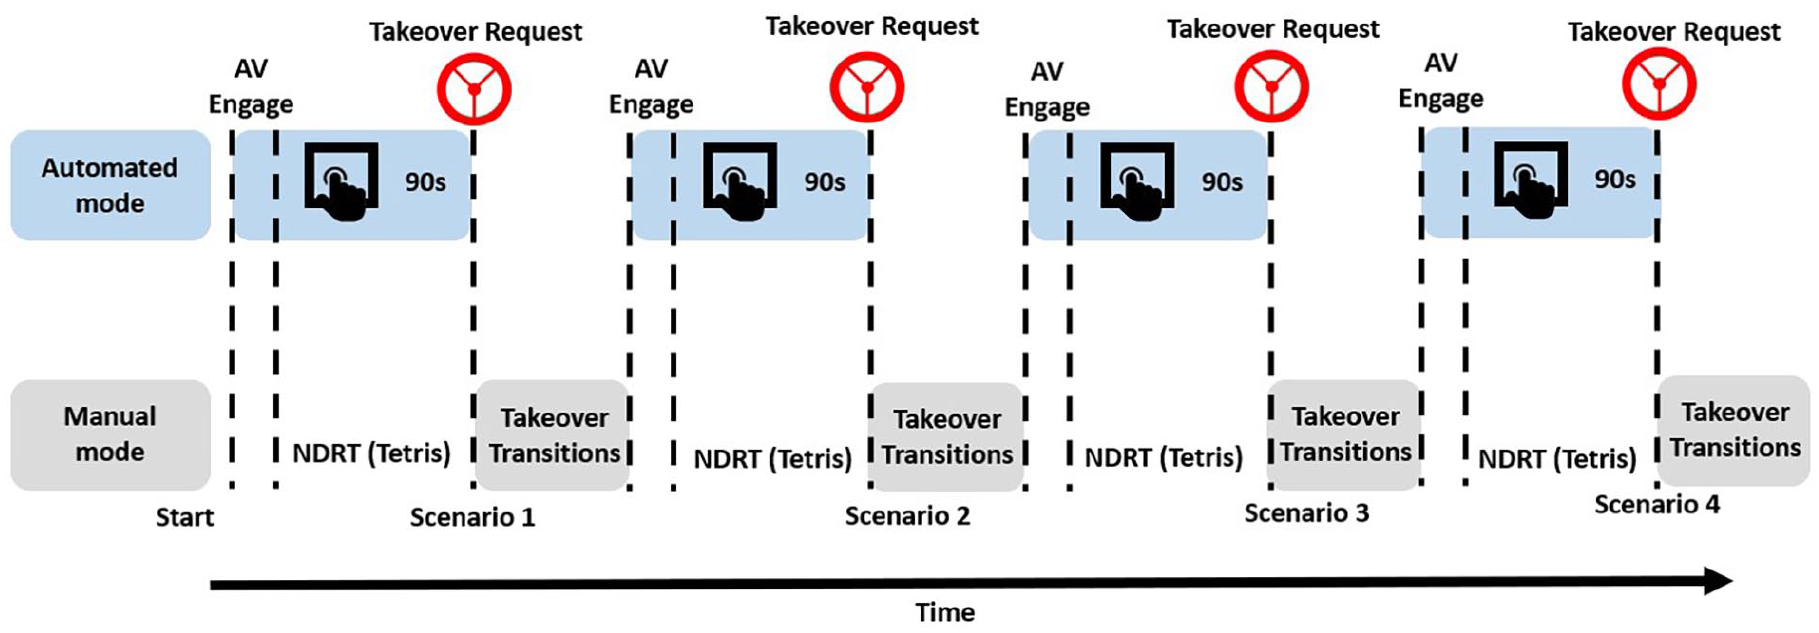
Sequence of takeover events in the experiment.
Data Analysis
We first used two-way repeated measure Analysis of Variance (ANOVA) to analyze the relationship between the independent variables and dependent variables. The analysis for two-way ANOVA was done in IBM SPSS (version 29).
Results
The ideal trajectory was generated for both 4 and 7 s lead time conditions and was compared to each of the participants’ driving trajectories to calculate the Fréchet distance (Figure 3). The descriptive statistics for overall driving performance are shown in Table 1.
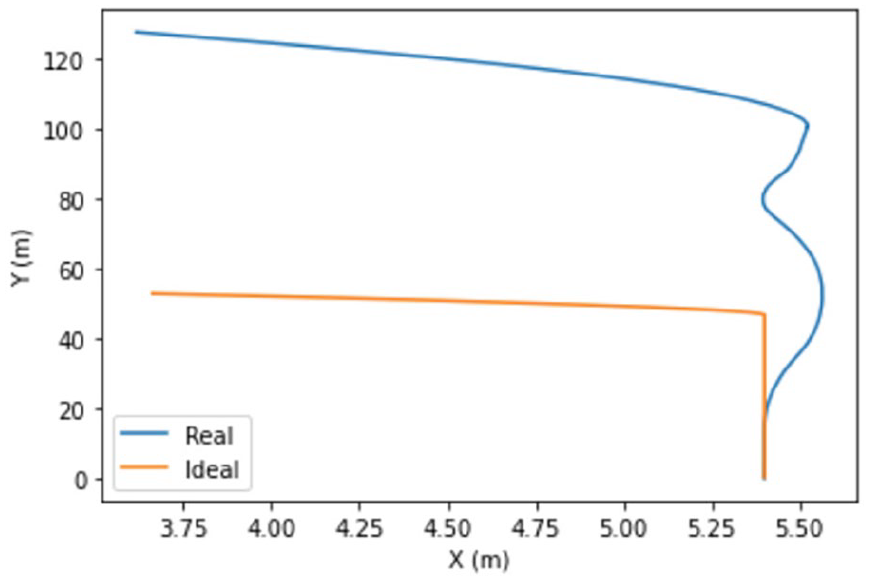
Illustration of the theoretical optimal and the actual driving trajectory for a takeover event in the simulation world. The orange line denotes the theoretical optimal, and the blue line denotes the actual trajectory.
Descriptive Statistics of Dependent Variables.

Two-way Repeated Measure ANOVA
The lead time had significant effects on ToT (F [1, 31] = 11.789, p = .002), MRACC (F [1, 31] = 9.924, p = .004), TTC (F [1, 31] = 37.216, p < .001), and Fréchet distance (F [1, 31] = 191.595, p < .001; Figure 4). The results indicated that 4 s condition showed a shorter takeover time and time to collision, larger maximum resulting acceleration, and larger Fréchet distance compared to the 7 s condition. No significant effect was found in tablet location and interaction effect.
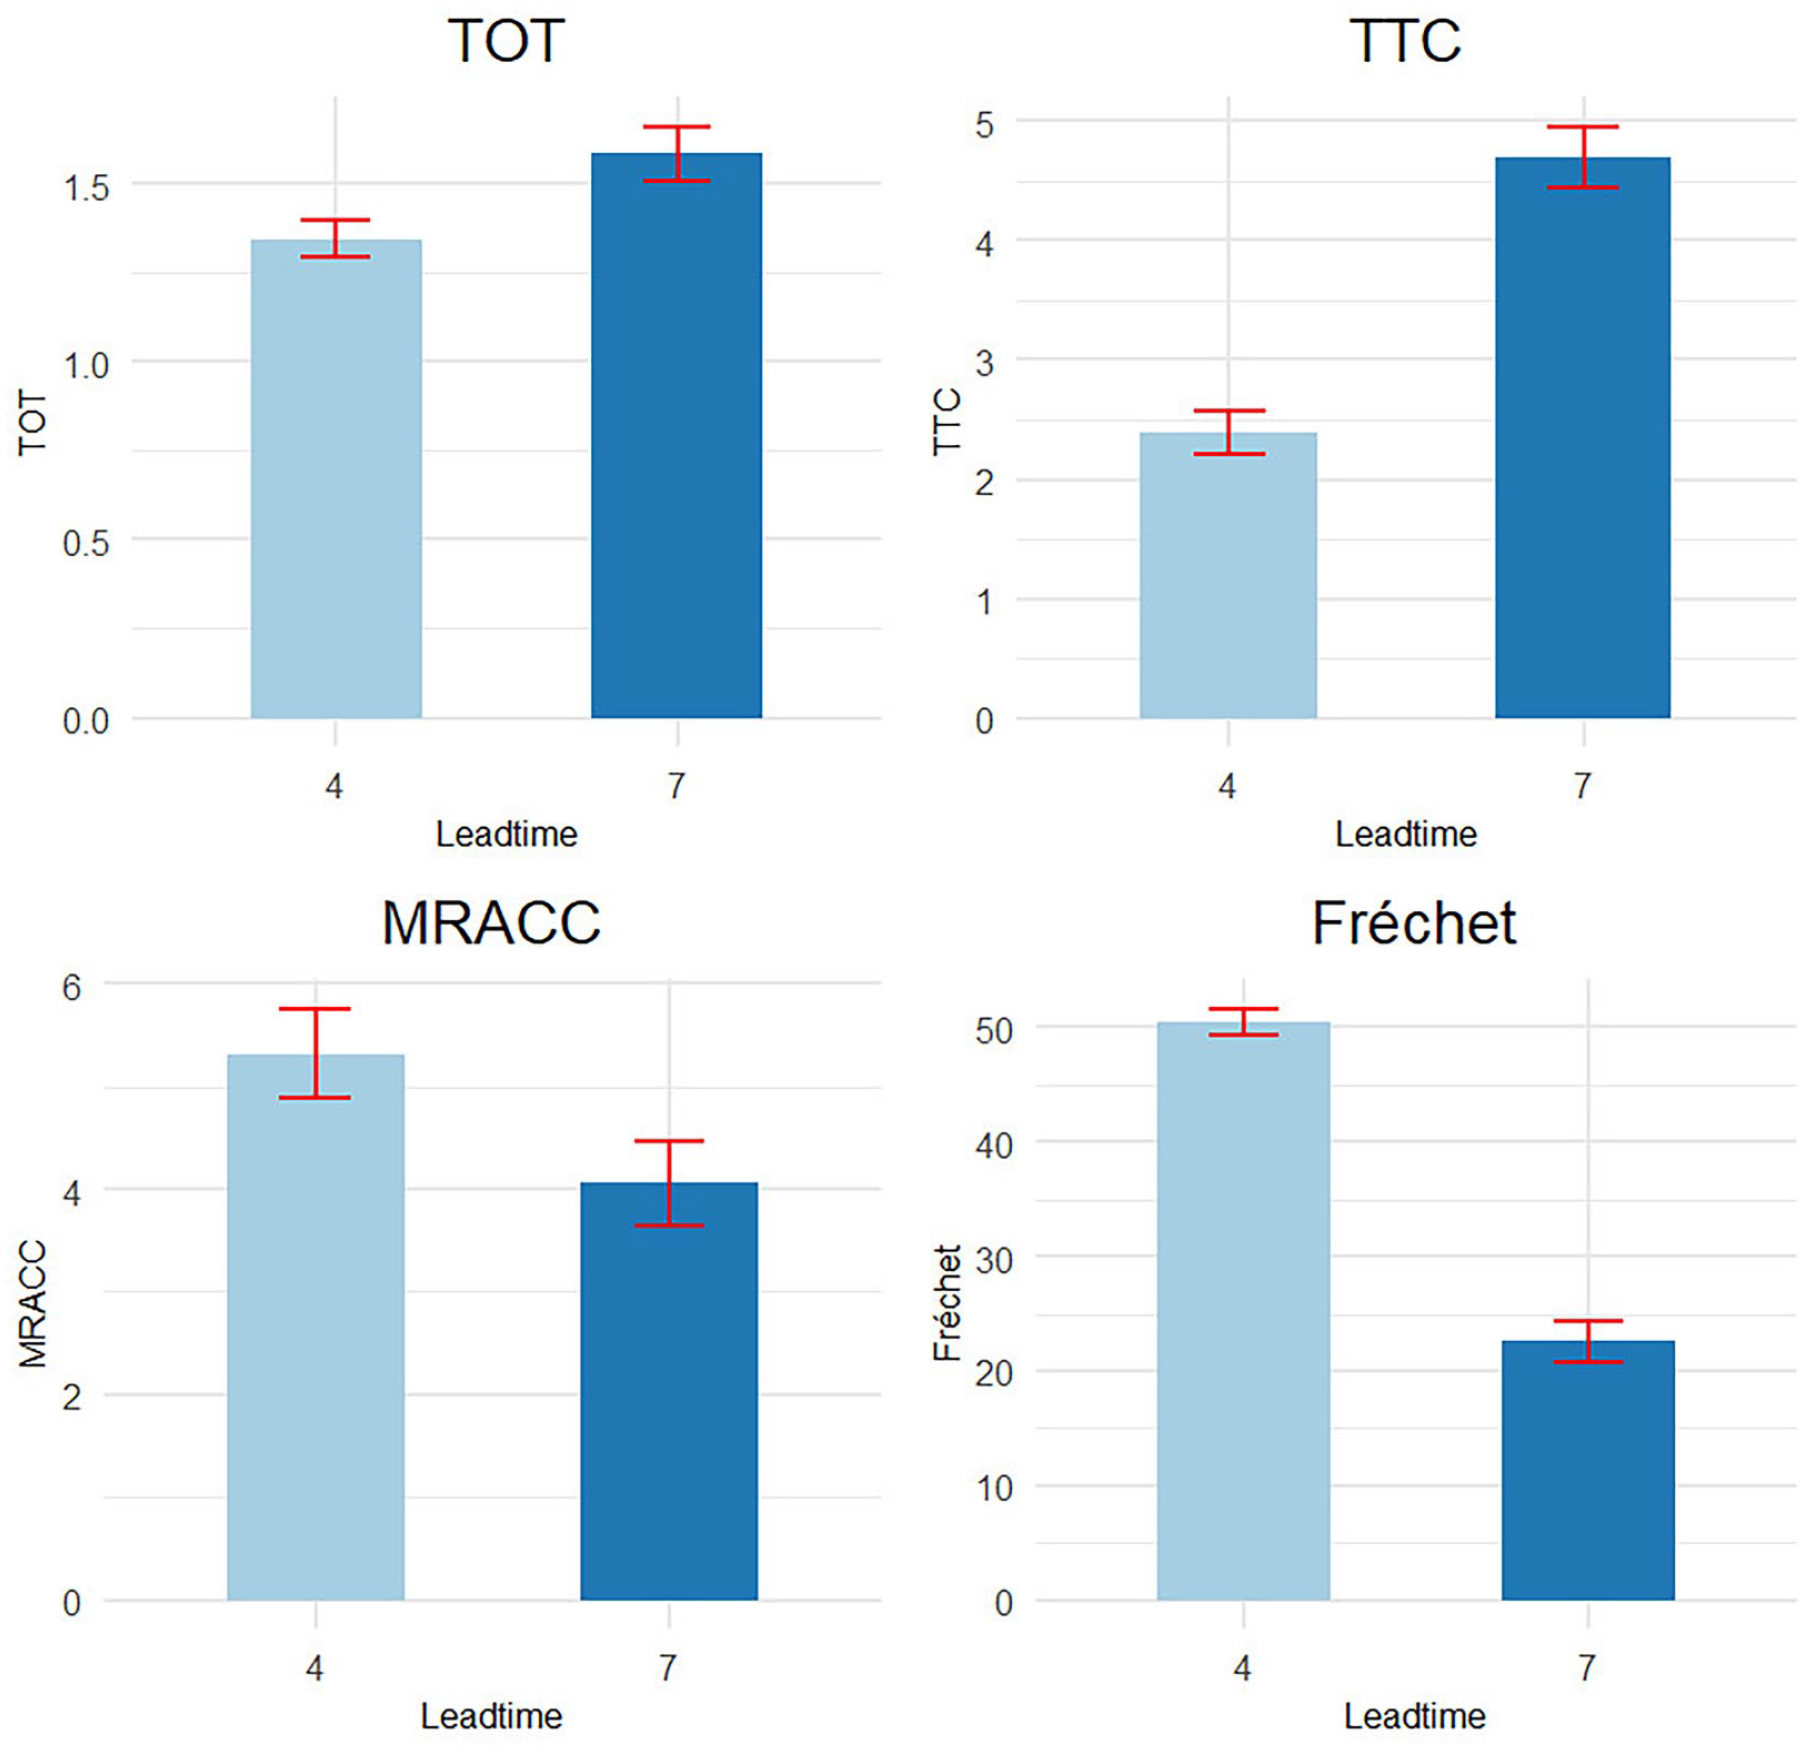
Effect of lead time on dependent variables.
Discussion
In this study, we proposed to use Fréchet distance as a metric for measuring takeover performance. We hypothesized that the result from the Fréchet distance would align with the results from other key takeover performance measurements. To test this hypothesis, we applied takeover lead time and tablet location in order to induce different levels of takeover situation and measured takeover performance measurements. We found that lead time had significant effects on all four takeover measurements, with a 7 s lead time showing better takeover performance. A shorter lead time limits the time for driver-vehicle interaction during the takeover process which makes it more difficult for the driver to take over control when requested (Du et al., 2020b; Eriksson & Stanton, 2017; Gold et al., 2016; Petersen et al., 2019). This is also similar to the previous studies that have shown that longer takeover lead time leads to lower quality takeover performance (Gold et al., 2013; Wan & Wu, 2018). In addition, we found non-signficant effects of the tablet location on any of the four measurements, which again validates the use of Fréchet distance as a takeover performance metric.
The current study has several limitations. First, the scenario was limited to a lane change situation without penalizing braking maneuvers. Many participants initially braked and then changed lanes to avoid obstacles, reflecting a natural response in critical collision avoidance situations (Markkula et al., 2012). Further investigation of different situations and scenarios is required for deeper understanding. Second, the optimal theoretical trajectory was predetermined and fixed. The criteria for what constitutes the safest and most desirable trajectory remain unclear and require further investigation to establish relevant boundaries and factors.
Conclusion
Our study aimed to address the challenges arising from the diverse use of metrics in takeover performance assessment by proposing a novel measurement approach using Fréchet distance. We validated this approach by comparing its trends with traditional takeover measurements. Our results indicate that the identified factors influence takeover performance measurements consistently in terms of direction and magnitude. Future research should focus on further validating Fréchet distance as a comprehensive measurement for takeover performance across various contexts. Such validation will enhance the credibility and applicability of Fréchet distance as a takeover performance metric.
Footnotes
Declaration of Conflicting Interests
The author(s) declared no potential conflicts of interest with respect to the research, authorship, and/or publication of this article.
Funding
The author(s) disclosed receipt of the following financial support for the research, authorship, and/or publication of this article: This material is based upon work supported by the AAA Foundation for Traffic Safety.