
Abstract
Guided visual search is a common theme in HF applications. In this project we use large-scale databases of wildlife camera-trap imagery as a testbed for optimization of target highlighting. MegaDetector, a generic animal detection deep machine learning model, provides bounding boxes for potential targets within an image. In some cases, human observers are necessary to confirm or further classify the detections. Outlining the bounding box can direct human attention to the target AOI to improve observers’ classification speed and accuracy. However, this outline introduces visual clutter and crowding at the AOI boundary. In a first empirical study we investigate the use of padding to mitigate the effects of local clutter and compared different methods of visual highlighting (colored outline vs. blur outside of AOI). We found support for using padding to improve performance when animals were hard to see. Both colored outlines and blur were effective at directing observers’ attention.
Introduction
Visual search is a reoccurring theme in many human factors applications. Searching for targets can usually be aided by valid cueing techniques directing attention to the correct location within a scene (Posner, 1980). Both endogenous and exogenous cues across different modalities have been employed to redirect operators’ attention in complex environments – like cockpits, control rooms, medical imaging, head-up displays, and security monitoring applications. A particular area where human target classification is often used is in the analysis of natural image data, either to provide training sets as a ground truth for deep machine learning algorithms, or as a fall-back level of analysis when AI models cannot provide conclusive identification of image elements.
One such area is the analysis of vast sets of wildlife camera trap imagery used by conservation biologists and related fields, which are used to provide crucial information about animal populations. Across the world, hundreds of millions of images are captured and processed each year. This is made possible by a strong reliance on automated classification systems, with human observers only involved in a small subset of classifications. However, the sheer number of images processed means that still millions of images have to be evaluated by a human expert.
One of the first processing steps in analyzing camera trap images is to analyze each image through MegaDetector (Beery et al., 2018; Beery et al., 2019), a ubiquitous generic animal detection model that provides confidence estimates and bounding boxes for the presence of animals, people, and vehicles within an image. This data is often fed into other, domain specific models to further classify the animal. For human observers the bounding boxes specified in MegaDetector are usually presented as thin, colored (mostly red) lines forming the minimal bounding box highlighting the animal(s) position in the image.
Optimizing the human analysis of these type of images serves as the main use-case for this paper, but clearly our approach easily generalizes to other, visually similar situations. In general, we are interested in the optimization of visual highlighting in natural scenes for object identification. Spatial cues, like MegaDetector’s bounding boxes, are a common means to direct human attention and increase both accuracy and speed of the identification or classification task. However, the visual features of bounding boxes introduce additional visual elements into complex naturalistic scenes that might lead to additional visual clutter and crowding (Moacdieh & Sarter, 2015; Yeh et al., 2003) exactly at the boundary of the area of interest for the visual search task. Following suggestions inspired by Rosenholtz et al.’s (2007) view of clutter as a congestion of features within a specific feature subspace, we investigate the use of different levels of padding to mitigate the effects of the spatial cues on image processing. In addition, we explore different methods of visual highlighting via the manipulation of spatial frequency (introducing blur outside of the bounding box) which reduces the necessity for additional visual features like colored bounding box edges. We anticipate that removing visual crowding on the edges of the bounding box, while retaining a valid spatial cue to localize the target should improve overall identification times in situations that are visually challenging. For example, small, difficult to identify targets might be more prone to interference from visual crowding on the edge of a bounding box because this area constitutes a larger relative amount of significant image features for a small object than for a larger object. In a first empirical study we tested the general feasibility of this approach.
Method
Participants
We recruited 57 participants through the online experiment platform Testable.org. Of these, 53 participants passed our accuracy criterion of 80% correct that was based on visual search performance independent of our experimental manipulation.
Materials
From a set of >200 k images of the iWildcam 2018 training set that contained MegaDetector confidence estimates and bounding boxes for animals within the images we selected 288 camera trap images. Of these, 144 contained a single animal, the other half did not. Across these images we factorially crossed whether the image was in color or monochrome (e.g., a nighttime shot) and whether the animal was easy to spot or hard to see (a subjective assessment of the experimenters). In addition, we balanced the size and location of target animals across the COLOR × DIFFICULTY groups (manipulated within-subject). For each of the images containing an animal we matched a second, similar image that did not contain an animal as a non-target stimulus. All images were downscaled so that the long side equaled 1,000 px.
We manipulated both the original target and matching non-target image by either drawing the lines of the bounding box at zero PADDING (P1), a medium level of PADDING (P2), or a large level of PADDING (P3) by increasing the bounding box respectively (within-subject across different images). In the non-target condition this means that the bounding box was drawn in the same location but without any animal present. In the blur condition we used the same spatial coordinates but instead of drawing an outline of the bounding box, we blurred the image outside the bounding box. We used different levels of blur and stroke width (see Figure 1 for examples). Participants saw each of the basic images only once in a specific combination of padding x level of stroke or blur.
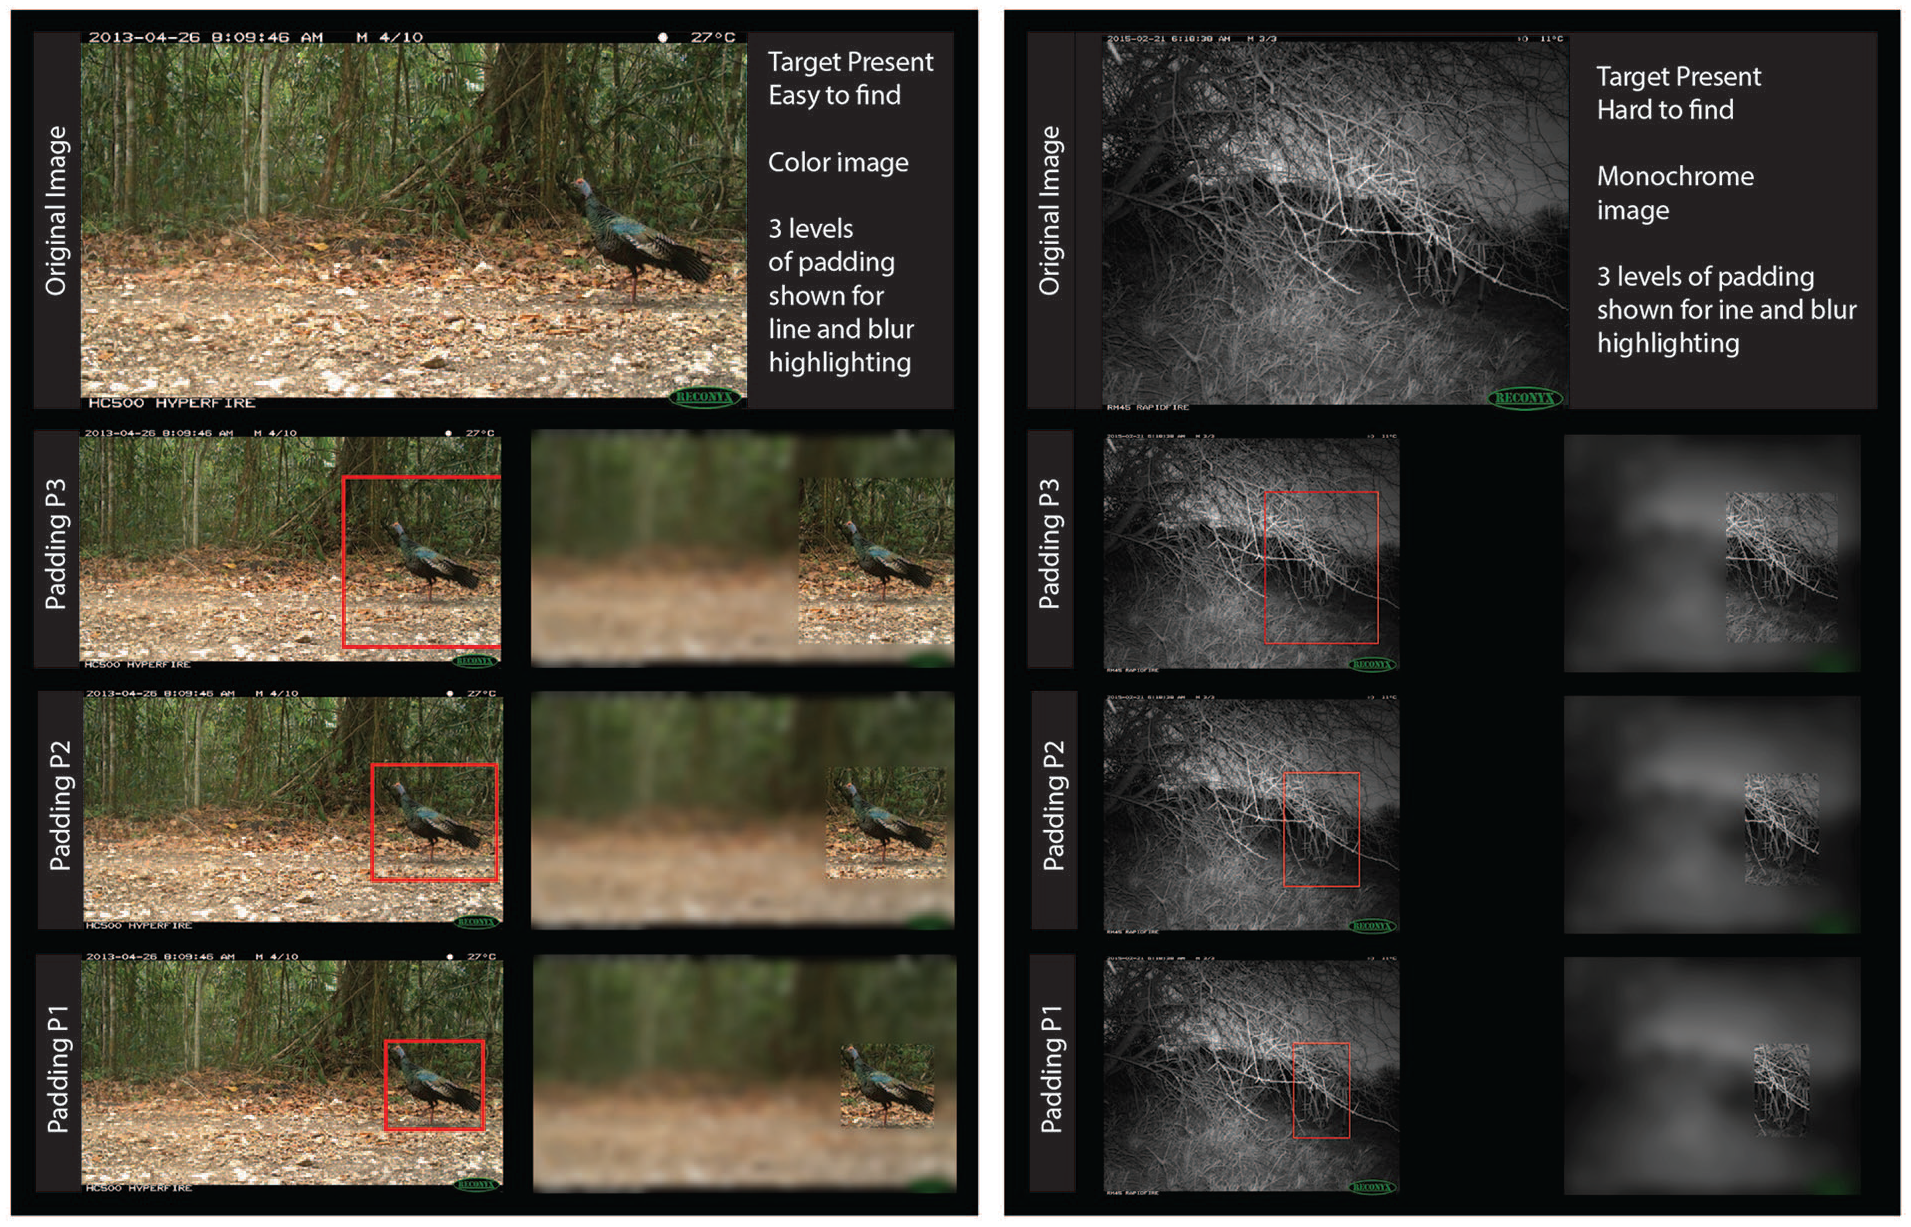
Stimulus material used in the study. Panel on left shows an example of a color image containing a target that is easily visible. The red bounding box matches the area of the non-blurred portion of the blurred images (blur level medium). Padding increases from level P1 to P3. The panel on the right shows a monochrome image with a hard-to-spot target animal. Blur level is high for the images on the right.
Procedure
Participants were randomly assigned a TYPE OF HIGHLIGHT (between-subject) – either the traditional LINEs showing the bounding box or the BLUR condition. Images were presented in two blocks of 144 images after an unrelated practice set of 24 images that used similar but different images and image manipulations. Each of the blocks contained 72 target-present images and 72 target-absent images. In half of the trials no visual highlight was given.
Images were randomly assigned to condition. Participants never saw the same image in different conditions (e.g., if an image was first seen with padding of level 3, it would not be shown again with a different level of padding).
Results
Two participants in each group were eliminated from the analysis because their overall accuracy was <80% in the no-visual-highlight condition, which used the same images between groups and was not associated with the main manipulations in this study. The two groups were well-matched on n and age (LINE: n = 27, Mage = 41.0; BLUR: n = 26, Mage = 38.5). Response times >10 s were excluded from the analysis (0.17%). The remaining data for accuracy (percent correct) and response time (RT in ms) were submitted to mixed model ANOVAs.
Greenhouse-Geisser corrections were applied when sphericity assumption was not met. Comparison between the two groups on their performance on the shared non-highlighted control images showed a slight but significant difference in accuracy (BLUR 91.7%, LINE 89.1%; F(1,51) = 4.44, p = .04, ηp2 = 0.08). Groups did not differ significantly in RT (1,727 vs. 1,673 ms), nor any second level interaction including BLUR versus LINE. As expected, both groups showed a clear advantage when the target was highlighted. Accuracy was 95.4B% and 95.1L% respectively, F(1,51) = 119.70, p < .001, ηp2 = 0.70, and RT was much faster with 1252B and 1268L ms respectively, F(1,51) = 135.75, p < .001, ηp2 = 0.73. The remaining analyses will only include images with applied highlight.
The overall pattern of results can be seen in Figures 2 (for accuracy) and 3 (for RT). Unsurprisingly, cueing the location of the target had minimal effect when the target was easy to spot and drew attention to itself.
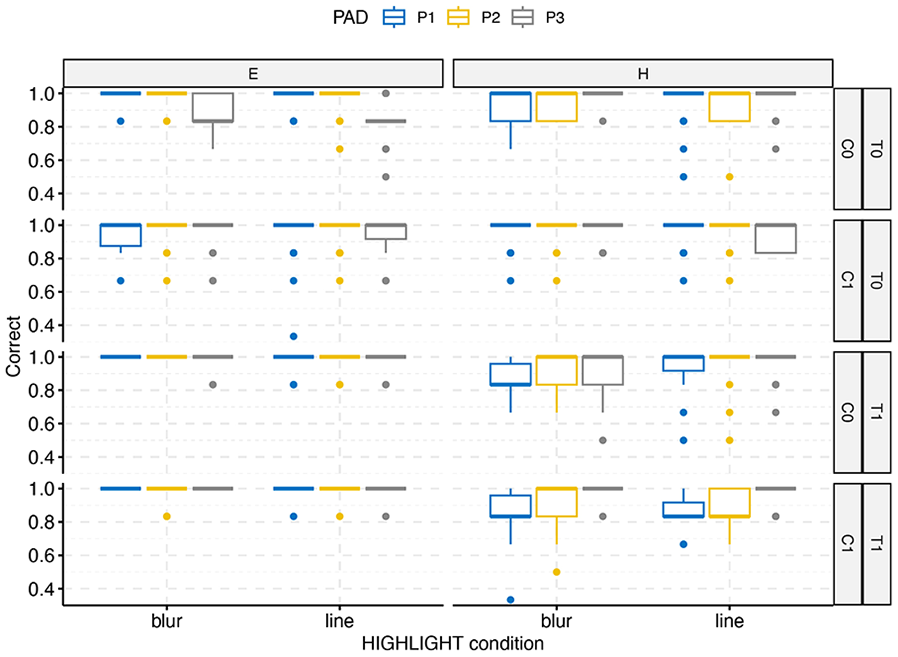
Overall accuracy by highlight condition (BLUR vs. LINE), DIFFICULTY (Easy vs. Hard), target present (T1) versus absent (T2), and COLOR (0 = monochrome, 1 = color). Padding levels range from P1 (no padding) to P3 (max padding).
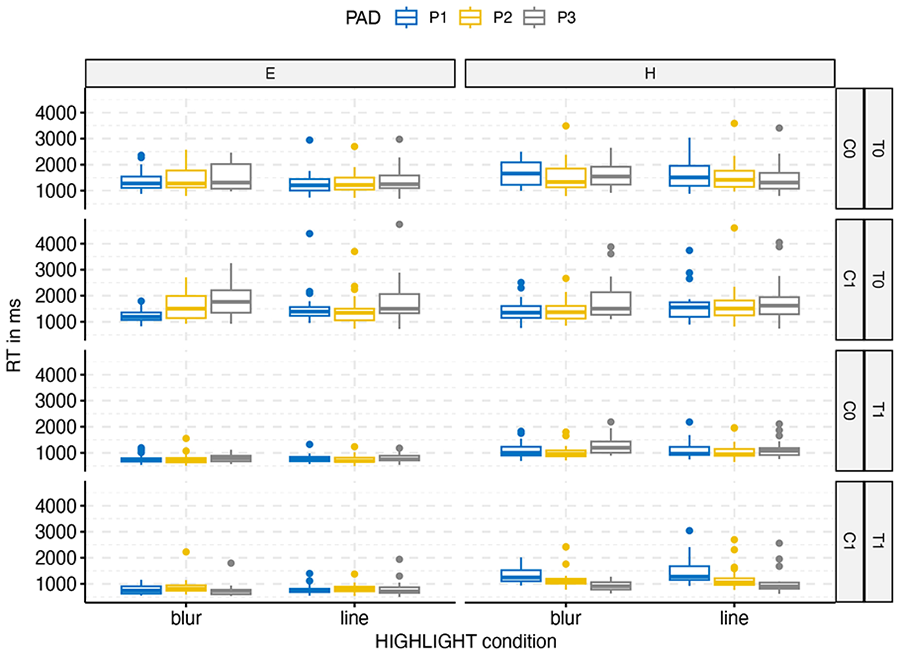
Overall response times by highlight condition (BLUR vs. LINE), DIFFICULTY (Easy vs. Hard), target present (T1) versus absent (T2), and COLOR (0 = monochrome, 1 = color). Padding levels range from P1 (no padding) to P3 (max padding).
Similarly, images without a target took longer to scan with little effect of cueing than images with targets present. The conditions BLUR versus LINE did not differ from each other overall, F(1,51) < 1 for either RT or accuracy, but there were significant second level interactions. The interesting part of the analysis is in the bottom-right quadrant of the figures which show an increase in accuracy and a decrease in RT with increasing levels of padding. To illuminate this trend, we submitted this subset of data (TARGET present, DIFFICULTY hard) to a 3-factorial mixed model ANOVA. There was a main effect of PADDING for RT, F(1.87, 95.21) = 15.82, p < .001, ηp2 = 0.24 and accuracy, F(1.84, 93.85) = 20.16, p < .001, ηp2 = 0.28, and an interaction of PADDING and COLOR for RT, F(1.94, 98.80) = 46.32, p < .001, ηp2 = 0.476, and accuracy, F(1.69, 85.94) = 8.66, p < .001, ηp2 = 0.15. In both analyses there was also a significant (but weaker) interaction between BLUR versus LINE and COLOR. In both RT and accuracy an increase in padding leads to improvement in performance for color images, but not for monochrome images.
Discussion and Outlook
This initial study investigated the role of padding and different types of highlighting on speed and accuracy of visual identification of animal targets in wildlife camera trap images. Our main finding consists of an increase in speed and accuracy when padding is added to a visual cue in situations where the target is difficult to spot and the image contains color information. Highlighting has minimal effect when the target pops out on its own or when a target is absent. Given that automated image classifiers are less likely to be stumped by clearly visible animals, this implies that for the most relevant of cases in which probable targets have to be identified or confirmed by a human observer the process can benefit the most from the added padding.
Our research does not address potential issues of imperfect automation and inaccurate highlighting by AI tools. It is reasonable to assume that a reliance on automated tools will lead to poorer performance if the wrong or no area is highlighted within an image (see Warden et al., 2023, for corroborating evidence for cued visual searches in AR).
At our current experimental resolution we did not find any meaningful differences between the red outline of the bounding box and the use of blur outside of the bounding box region. However, we did show that blur and the use of spatial frequency cueing can be used effectively, especially in color images with sufficient contrast. We plan to conduct more targeted studies investigating the effect of the type of highlight and under which conditions each highlighting strategy shows the most promise.
Obviously, blur is not always a good strategy in a visual search task – especially when awareness of context and the ability to monitor areas outside of the highlighted area are important. However, it provides an additional visual tool in situations where this is not an issue.
Eventually, this type of research may lead to adaptive highlighting strategies, where both the task demands as well as the visual properties of the images can be used to predict an optimal setting for attentional cueing.
Footnotes
Declaration of Conflicting Interests
The author(s) declared no potential conflicts of interest with respect to the research, authorship, and/or publication of this article.
Funding
The author(s) received no financial support for the research, authorship, and/or publication of this article.