
Abstract
General aviation (GA) pilots use different types of weather information when assessing weather conditions during pre-flight weather briefing tasks. Of concern is low altitude weather dynamics and variability between surface weather reporting stations where conditions are known. The study presented here investigated pilot decision making regarding interpolation of weather conditions to multiple potential target destinations, between known weather reporting stations, subject to the effects of differing terrain and microclimate weather patterns. Participants included 24 GA pilots, ranging from 156 to 40,000 h experience, who estimated flight rule conditions at three target locations each (including an actual accident site) in multiple geographic regions and observability of weather reporting stations. Pilots rarely provided correct estimations of flight rule conditions at target locations; accuracy did not always improve with increasing observability of other nearby reporting stations. Despite these errors, pilots were confident in their estimates of flight rule conditions at target locations.
Keywords
Objective
Despite the increasing availability of advanced software and hardware systems to provide information about weather conditions, general aviation (GA) pilots continue to be subject to adverse weather and weather-related incidents. Weather-related factors have been a leading cause of GA accidents and fatalities over several years (AOPA, 2021; NTSB, 2005). As a result, the Weather Technology in the Cockpit (WTIC) program within the Federal Aviation Administration (FAA) has been involved in an ongoing research effort to address multiple gaps affecting GA pilots and adverse weather conditions, particularly for pilots observing visual flight rules (VFR) flight plans.
The current research, funded under the WTIC program, is one of several to address GA pilot understanding and use of weather information and interface products regarding dynamic weather conditions. GA covers a wide variety of fixed-wing and rotorcraft vehicles, there is a common emphasis on low-altitude operations (LAO) below 1,500 feet above ground level (AGL), where most recreational aircraft and helicopter flights operate (Pokodner, 2015). It is important to note that LAO weather conditions are more affected by ground terrain features, whether they are naturally occurring (such as valleys or hills) or human-constructed (such as urban skyscrapers). Weather conditions at these low altitudes are significantly distinct from those at the higher altitudes of commercial aircraft (usually 20–40,000 feet), and are much more influenced by ground-based features such as terrain variability and other geographic sources of variation. As a result, flight conditions along flight plans between origin and destination airports are more likely to be affected by local LAO weather dynamics and terrain features.
There is an additional confound affecting presentation of weather information and its variability across a geographic region. Most official FAA reports and weather information tools certified for use focus on automated surface or automated weather observation stations (ASOS or AWOS), which are usually associated with airports. Airports do not fully sample all terrain conditions, of course: they tend to be located in flat regions at lower altitudes than the surrounding terrain which can include significant valleys in more complex terrain. An ASOS/AWOS cited in slightly higher terrain may not indicate valley fog conditions at an airport nearby in the valley or mountain gap wind conditions a few miles away. Lake effect storms may differently affect ASOS/AWOS conditions within a snow band, and of course, there are no reporting stations in the open water of the Great Lakes to indicate reduced visibility.
FAA Sectional Charts are widely available and regularly updated with both fixed and changing LAO or ground terrain features. However, it is not clear how often, or how well, pilots integrate this available information when assessing flight conditions and risk when conducting pre-flight briefings before VFR flights. In addition, the multiple layers of potential ASOS/AWOS reports, including meteorological terminal area reports (METARs) and terminal area forecasts (TAFs), has the potential to overwhelm pilots with too much data, thus inhibiting rather than enhancing situation awareness (Chaparro et al., 2023; Warden et al., 2023; Wickens & Yeh, 2018; Yeh et al., 2018)
Presentation of weather information by some weather products also suffers from potential confounds in terms of density of weather reporting station presentation and its interaction with the spatial zoom (geographical distance presented in a regional display of weather conditions) and resolution (level of pixel detail of the presented major geographic features such as coastlines and airport designations, although terrain variability may not be represented). An apparently unquestioned trend in interface design is to increase pixel resolution of display images. However, such increases in display resolution have not significantly reduced GA accidents or fatalities in the 21st Century. Thus, one objective of this study was to begin to address how GA pilot access and use of weather information may be influenced by variables other than display resolution when assessing dynamic, interpolated, and uncertain weather conditions between known reporting stations when planning flight paths during initial pre-flight weather briefings.
Approach
The study reported here combines several initial research efforts intended to provide baseline information to the WTIC program for multiple research projects to be conducted at FAA and other research facilities. The participant pool consisted of experienced GA pilots recruited for a computer-based, low-fidelity pilot decision making experiment. Research was conducted at the FAA William J. Hughes Technical Center (WJHTC) in Atlantic City, NJ, under FAA IRB Protocol [redacted during review]. Three different geographic regions of the contiguous United States were used, to expose pilots to multiple sources of geographic and terrain variability and to offset potential “home region” experience bias. (See Figure 1 for an example of one of the three regions utilized in this study.). We used pre-recorded static displays, presented on a part-task workstation display like the one used in Ahlstrom and Suss (2014).
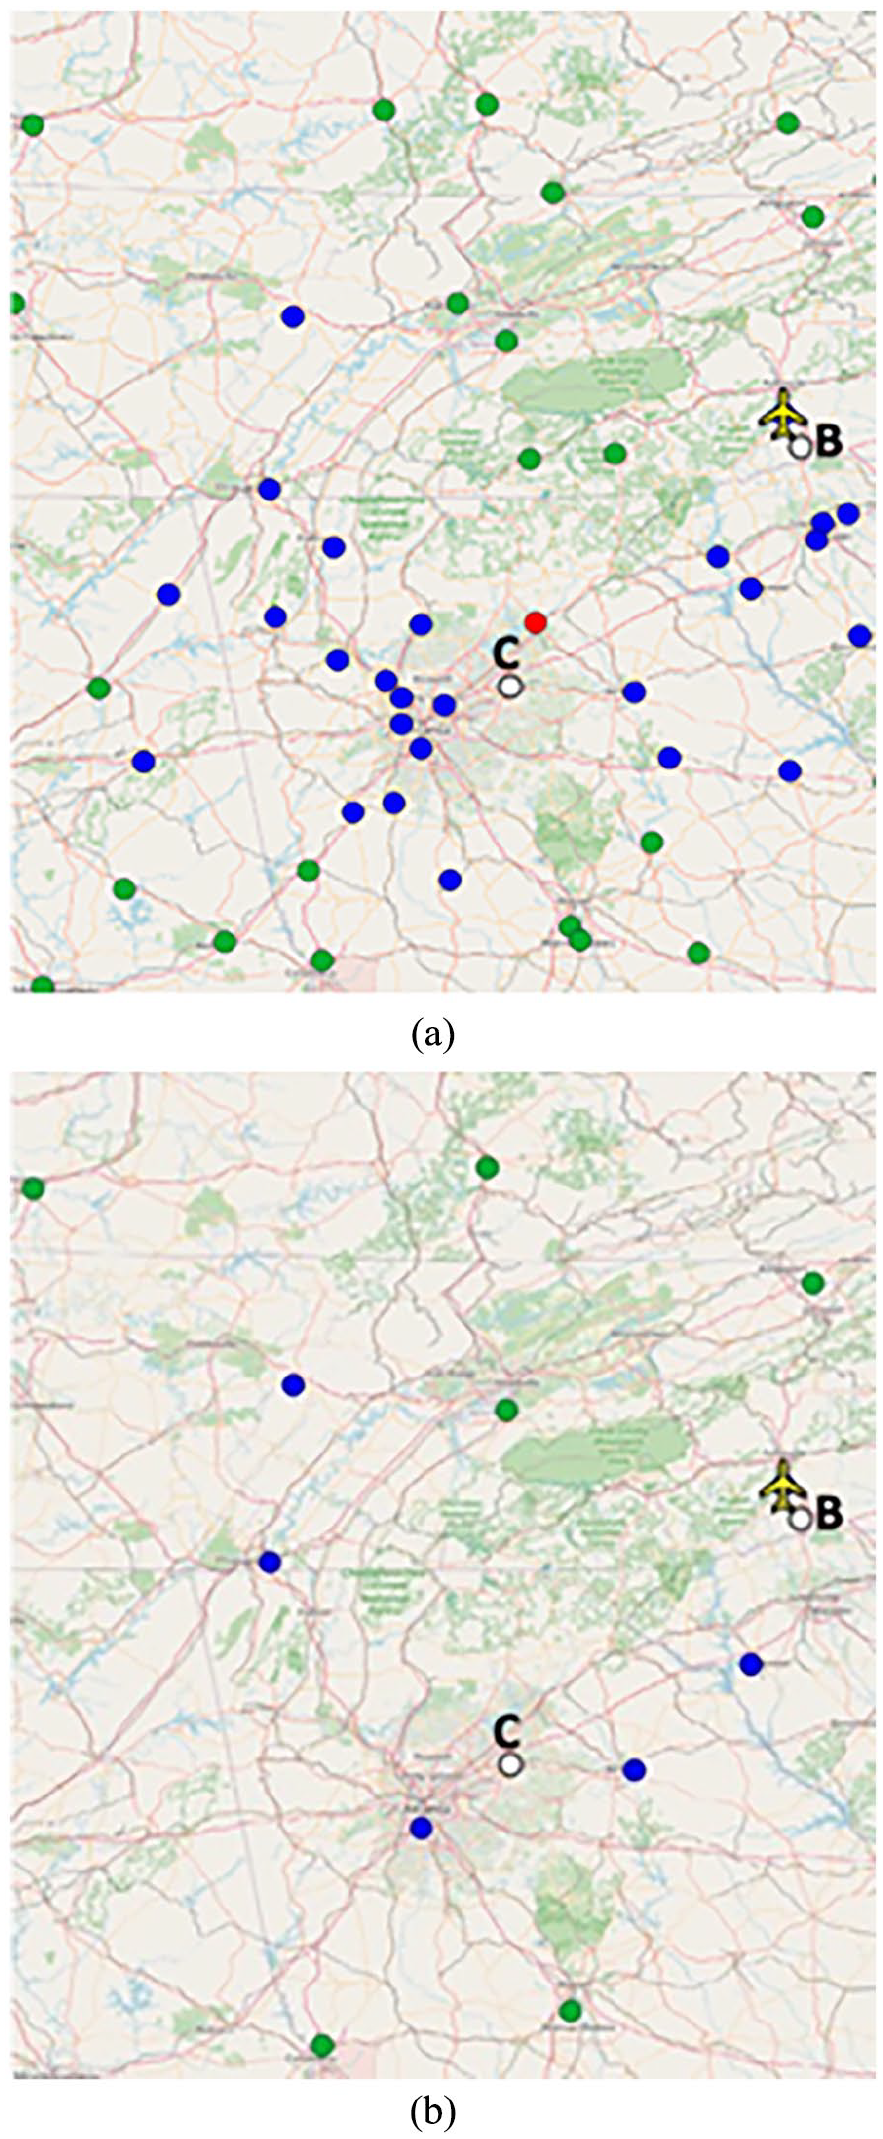
Illustration of weather information display presented to pilots with ASOS/AWOS reporting stations and flight rule categories for high (a) and low (b) station observability experimental conditions. The Cumberland Plateau/Southern Appalachian region is shown in this figure.
Note that, in these displays, terrain variability is indirectly visible in terms of lake features and mountain range information as well as labeled park areas. This information is not as detailed as the topographic terrain information visible from a true FAA sectional chart, but is similar to what might be viewed in a number of weather information display products such as Foreflight or Garmin. (See (Koebbe, 2021) for an example of one such display suite; coincidentally, one weather base layer example shown (at approximately 0:35–0:45 of the video) covers a geographic area very similar to that shown in Figure 1a and b.)
For each region, weather conditions presented were actual conditions associated with a known “sentinel” event (a fatal GA accident that was assessed to have weather as a major causal factor) that occurred within the visible area. Within each region, weather conditions were presented at three different levels of reporting station observability. For clarity, “observability” here refers to the number of ASOS/AWOS reporting stations visible to the pilot within a fixed display resolution and geographic range. (This use of the term “observability” suggests, but is not identical to, the sense of “observability” as the ability to infer “system state based on sensor and non-sensor knowledge” (King et al., 2014, p. 4075), or to assess changes in the “state of the system from the data available on the same interval” (Marchal, 2014). Making more weather station reports visible should have a positive relationship to observability, but is not changing the actual number of stations or sensors available for state estimation.) The increase in station reports observable represents differing “zoom” levels of reporting station visibility available in contemporary weather information products. For example, Figure 1b shows the lowest level of “observability” for this region (the Cumberland Plateau). Note that the difference between Figure 1a and b is only the number of ASOS/AWOS sites shown. The overall display resolution and area represented in the two figures are the same.
For each of the regions, pilots were shown observed weather flight rule categories for a number of airport reporting stations, and were asked to assess conditions at three other sites. The yellow aircraft “ownship” icon represents the origin location of the flight plan. Two of these sites were other airport stations for which weather conditions were known (but masked and unavailable to pilots); one was the actual incident location, where conditions were assumed be instrument flight rules (IFR) or low-instrument flight rules (LIFR) due to the nature of the accident. (In Figure 1a and b, the proximity of ownship and Location B, which was in fact the accident location, suggests a local-only flight plan.). The combination of three regions and three levels of observability resulted in a total of nine experimental conditions. The experimental presentation of these conditions was randomized across participants.
During the scenario presentations, participants completed a set of structured questions regarding what tools they use to make their decisions. (Tools that were reported include options such as personal knowledge, past experiences, use of aviation weather software applications, and weather conditions at the weather stations.). Before the start of the experimental session, each pilot was instructed on how to perform the weather assessment task. Following the nine (randomly presented) experimental trials, each pilot was subjected to a post-session debriefing.
Findings
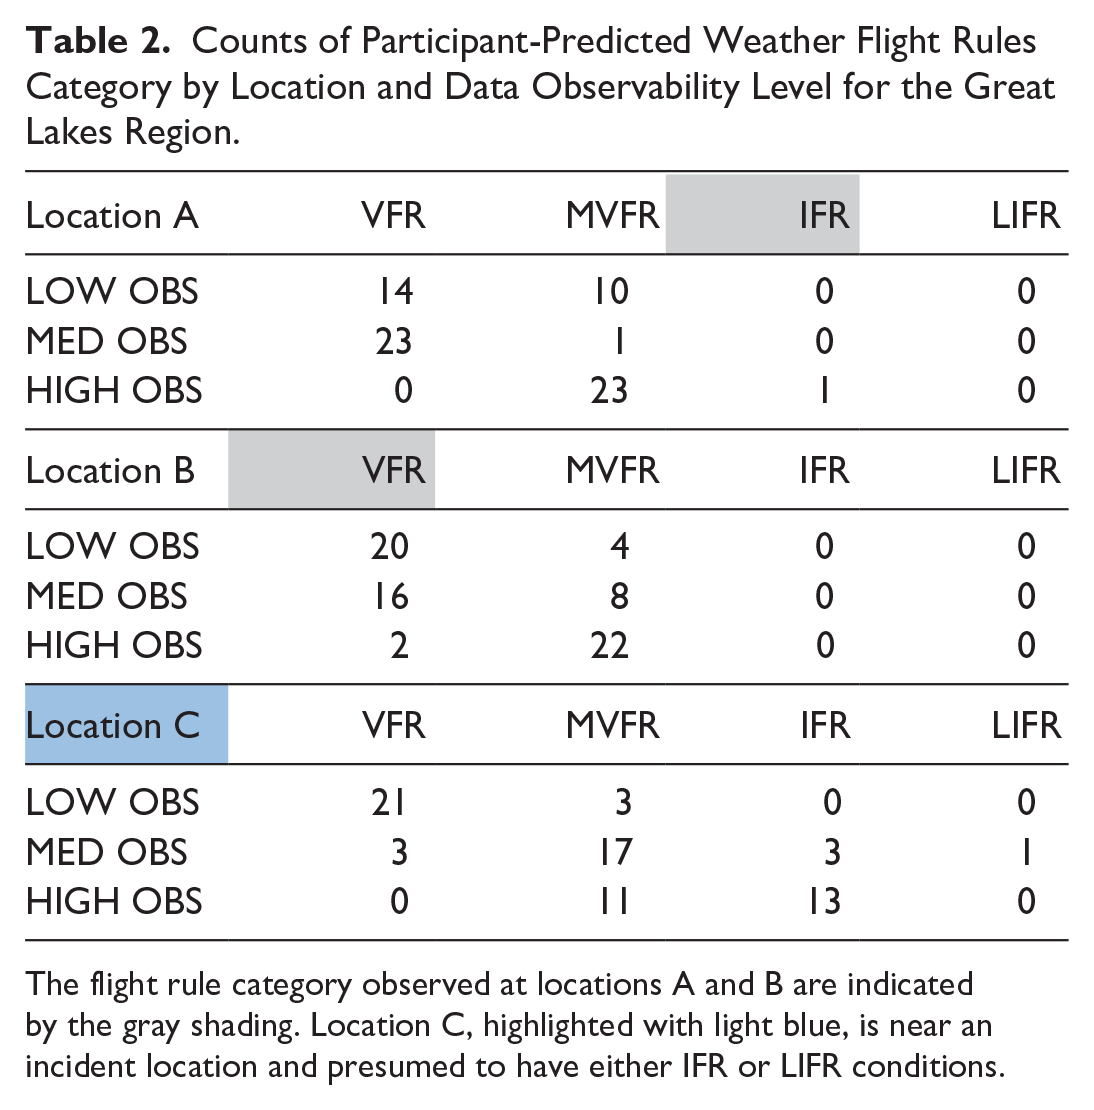
Participation in the study was managed according to FAA IRB, and deemed exempt on March 1, 2023. Twenty-four GA pilots participated in the study. The age of the participant group had a mode of 62 years and a range of 66 years (min = 21 and max = 87) (see Table 1 for participant demographic summary). The total number of flight hours ranged between 156 and 40,000, with a mode of 11,000 hr. The total number of instrument hours had a mode of 10,000 hr, and a range of 19,995 hr. Eight of the pilots reported not using any kind of weather display while flying, while the remaining 16 pilots reported using one or more of four reported weather information sources (Foreflight 64%, Garmin 26%, SiriusXM 5%, and WingXPro 5%). Although this study emphasized flight under VFR flight conditions only, most pilots (n = 16) had certified instrument ratings, and many had 10,000 or more hours of instrument rated flight. The study was a mixed-effects model, with a total of 72 possible assessments (24 pilots × 3 display observability levels) regarding pilot estimations of flight rule conditions at each of the three target locations.
Participant Demographics.
The first set of findings focuses on the estimation of flight rule categories for each of the three target locations in each region, and at each level of reporting station observability. Tables 2 to 4 show the counts of predicted weather flight rules categories (VFR, MVFR, Low Instrument Flight Rules (LIFR), and IFR) for the Great Lakes, Northern California, and Cumberland Plateau/Southern Appalachian regions, respectively. Additionally, Table 5 provides a cumulative count of predictions for all regions and locations for each level of observability.
Counts of Participant-Predicted Weather Flight Rules Category by Location and Data Observability Level for the Great Lakes Region.
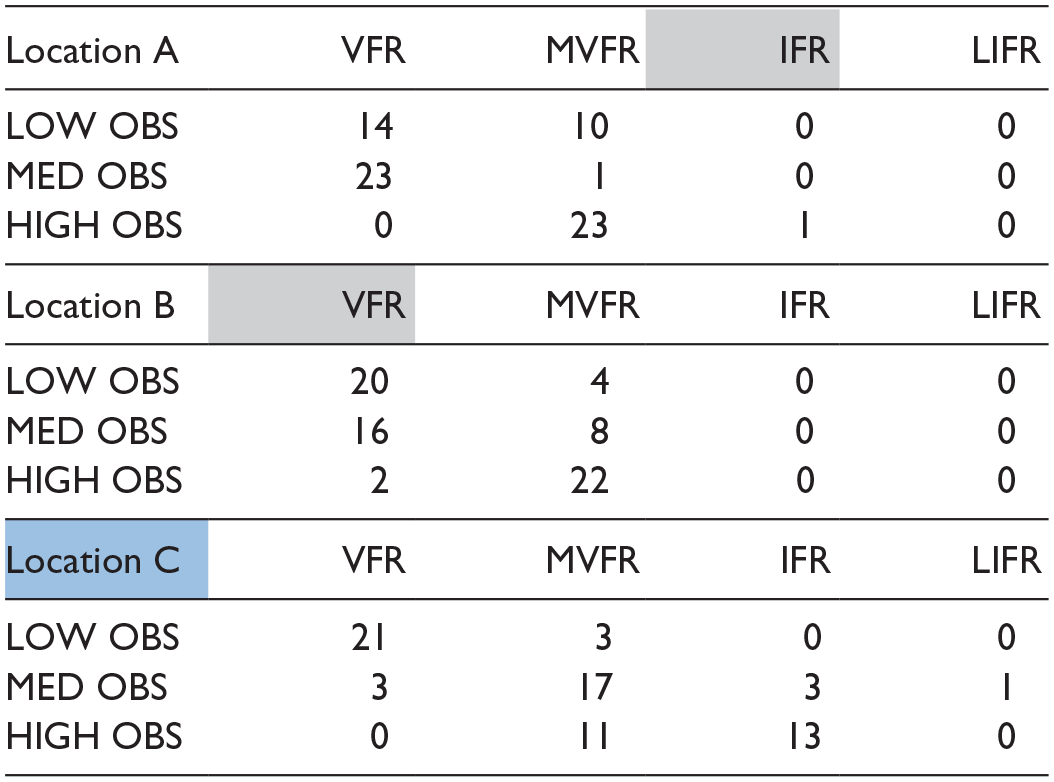
The flight rule category observed at locations A and B are indicated by the gray shading. Location C, highlighted with light blue, is near an incident location and presumed to have either IFR or LIFR conditions.
Counts of Participant-Predicted Weather Flight Rules Category by Location and Data Observability Level for the Northern California Region.
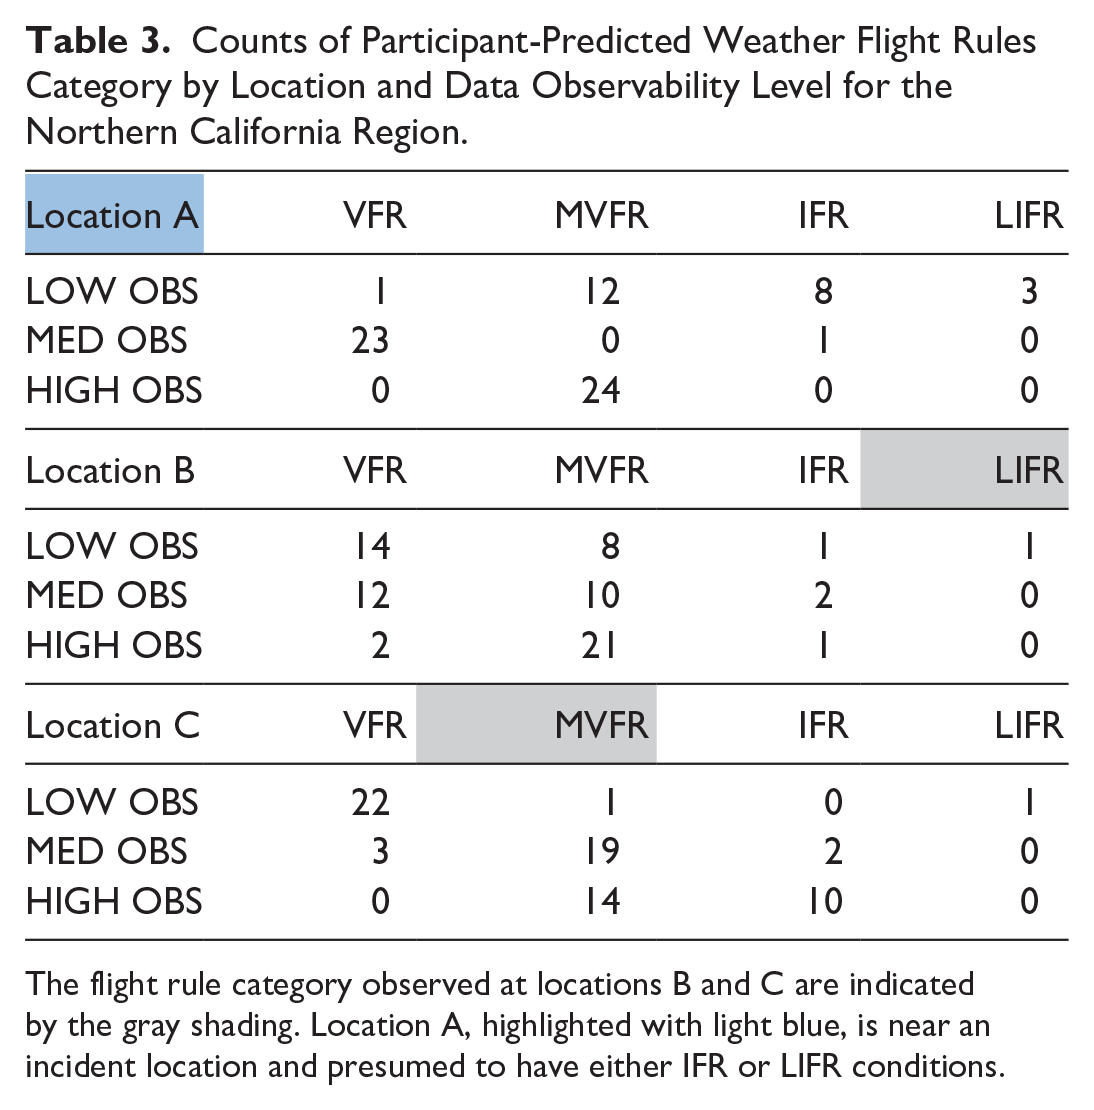
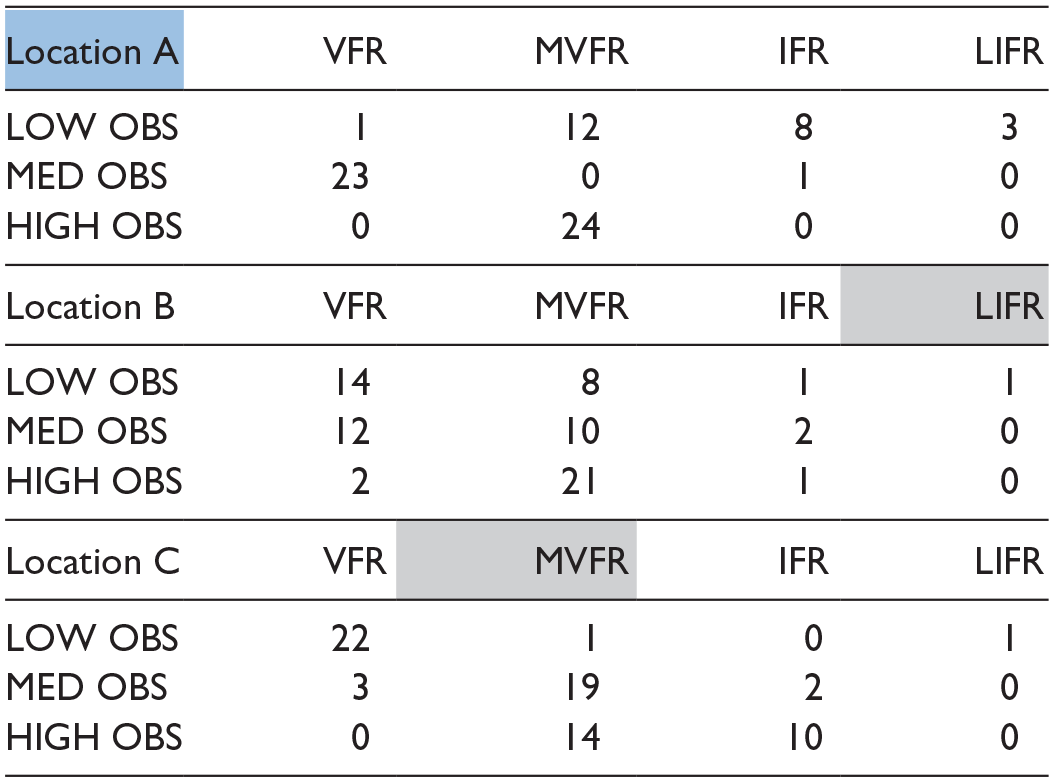
The flight rule category observed at locations B and C are indicated by the gray shading. Location A, highlighted with light blue, is near an incident location and presumed to have either IFR or LIFR conditions.
Counts of Participant-Predicted Weather Flight Rules Category by Location and Data Observability Level for the Cumberland Plateau/Southern Appalachia Region.
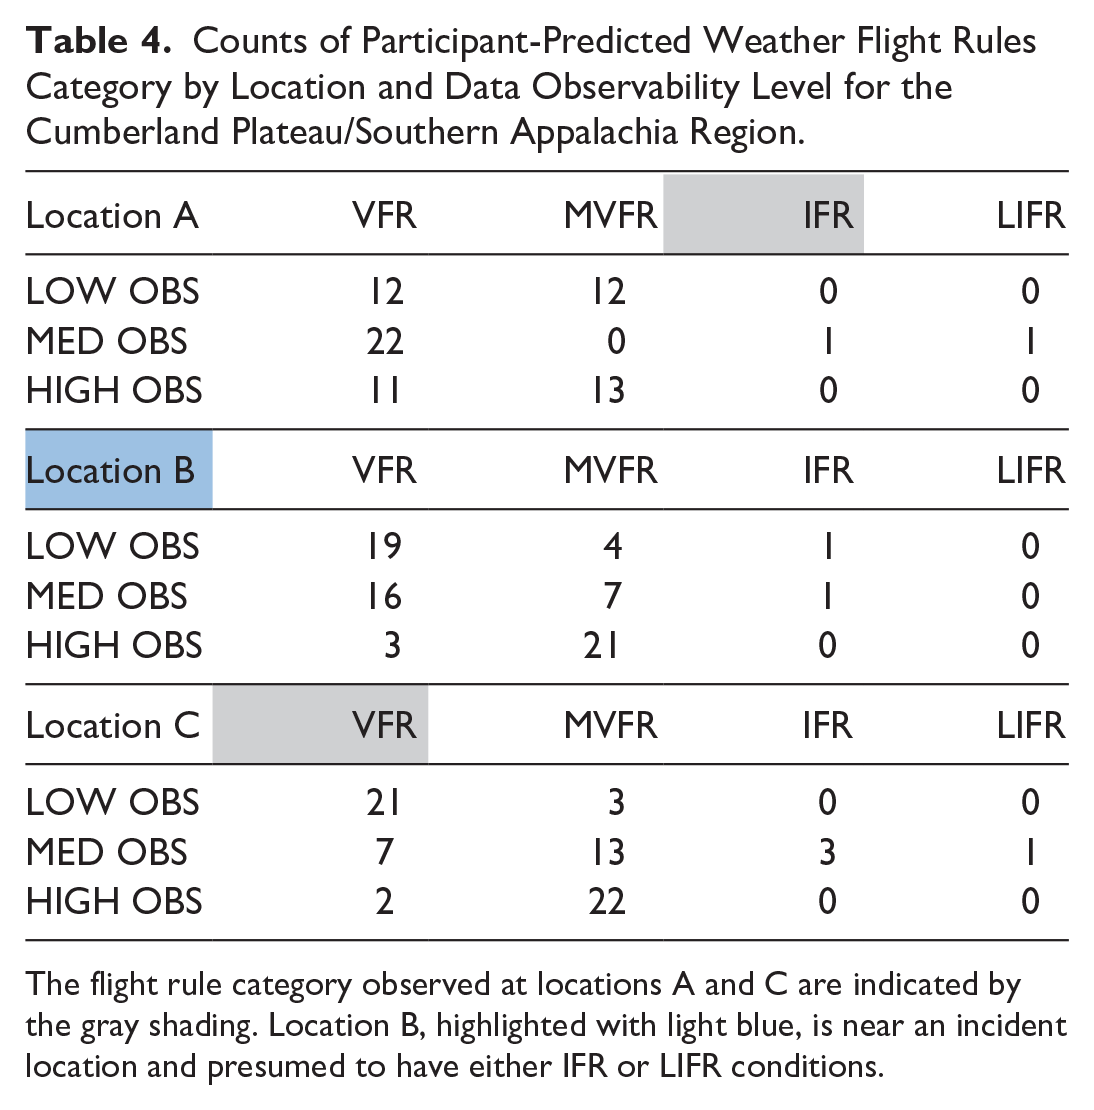
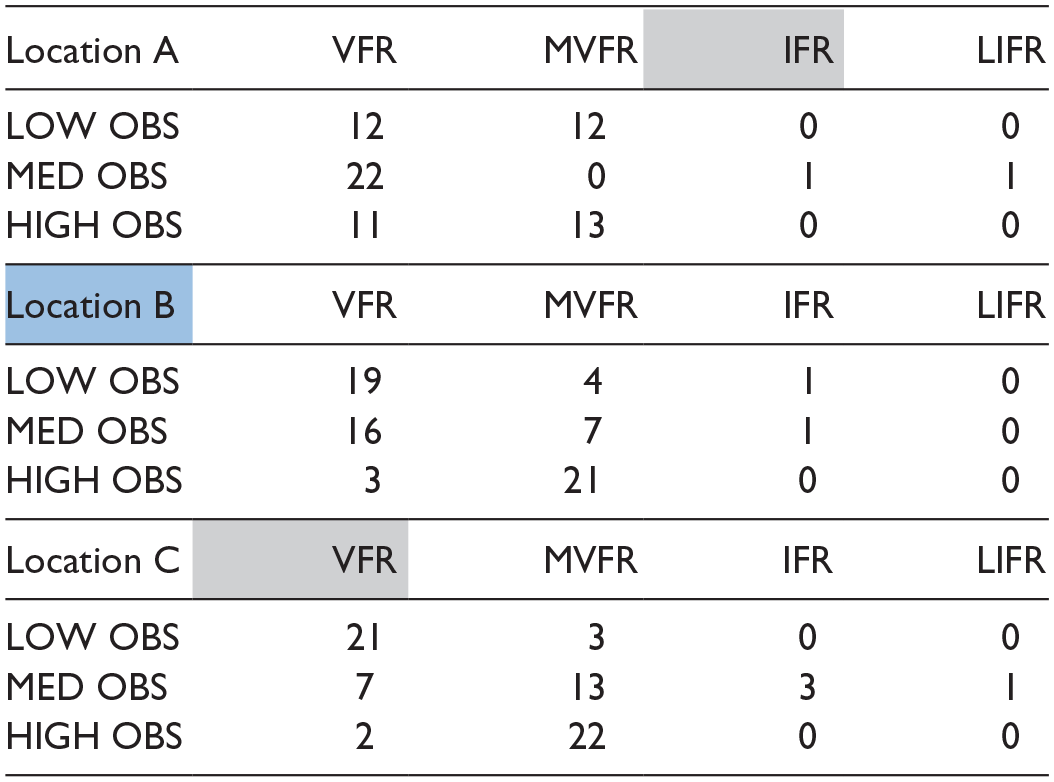
The flight rule category observed at locations A and C are indicated by the gray shading. Location B, highlighted with light blue, is near an incident location and presumed to have either IFR or LIFR conditions.
Cumulative Counts of Participant-Predicted Weather Flight Rules Category for All Regions and Locations.
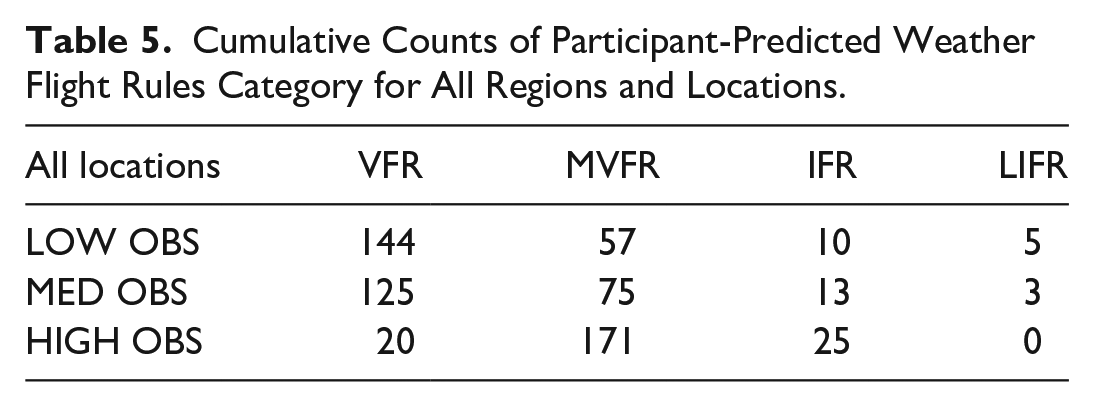
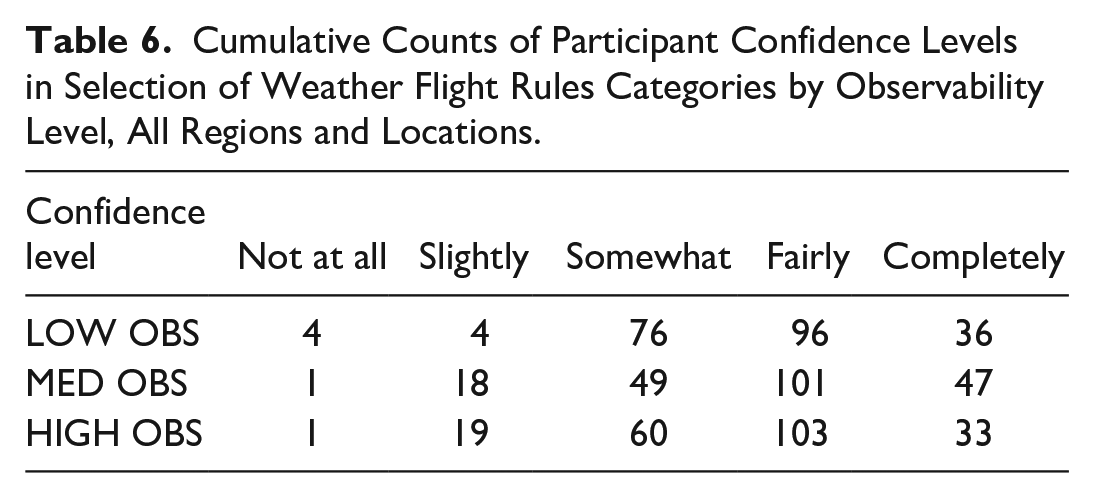
In addition, participants were asked to rate their confidence in their estimations of flight rule category levels for the three target locations. As shown in Table 6, participants rated their confidence “somewhat confident” or above in over 78% of possible evaluations, and “fairly confident” or above in over 62% of possible evaluations (72 presentations of three target locations, or 216 total). Even target locations where actual flight rule conditions were known to be IFR or LIFR (Location A in the Great Lakes and Cumberland Plateau were IFR; Location B in Northern California was LIFR) resulted in pilots estimating these conditions correctly
Cumulative Counts of Participant Confidence Levels in Selection of Weather Flight Rules Categories by Observability Level, All Regions and Locations.
Takeaways
The survey results indicated a relatively low skill in survey participants being able to estimate the correct weather flight rules category conditions. Surprisingly, increasing levels of reporting station observability did not systematically improve accuracy, or influence confidence, in pilot estimations of flight conditions or confidence in their estimates. There were very few correct estimations of flight rule conditions at targeted locations. Few estimations of conditions at known airport reporting stations were correct; accuracy did not increase with increasing observability of other nearby airport reporting stations.
Despite these errors, pilot estimates of their confidence were rated “fairly confident” or “completely confident” (the highest rating) in the strong majority of evaluations. There is more spread in confidence estimates in the medium- and high-observability conditions than the low-resolution condition, with notably higher numbers of “slightly confident” estimates in the medium- and high-observability conditions. The medium observability level had the highest number of completely confident selections. It is also important to note that confidence does not uniformly shift in either direction with presentation of more weather observations (“greater resolution”), even when the additional observations indicate increased variability in reported weather conditions.
Unfortunately, this preliminary study was unable to uncover the reasons for these somewhat surprising findings regarding pilot estimations of conditions, confidence in those estimates, and of decisions regarding whether to continue the flight plan. The pilots seemed to be combining aspects of display features, cognitive strategies, and projection/interpolation of flight conditions that may or may not be incorporating terrain variability or other effects on flight conditions. There does seem to be some impact of availability of other observation stations near that of the proposed destination, but as is seen in two of the three accident locations (Northern CA Location A; Cumberland Plateau Location B), as well as Great Lakes Location A, medium resolution observation availability led to more “Go” decisions than either low or high resolution.
It appears that these variables of reporting station zoom level and the proximity of reporting stations with distinct flight rules categories are important considerations worthy of future research. This combination of factors, and the resulting gap, seems to be particularly relevant when considering the pilot reports and decisions regarding flight plans to locations that were in truth sentinel weather-related accident locations (and thus presumed to have problematic flight conditions). In this study, pilots’ decision making when presented with different resolution of information could only be inferred based on their responses; the results were more surprising and more difficult to interpret than originally anticipated. Further studies are required, with additional issues regarding display elements, pilot mental models, or terrain feature cues to be evaluated to provide more insight into pilots’ reasoning. Additional research is indicated that will help resolve gaps associated with pilot understanding and use of weather information in dynamic, uncertain, and riskier weather and flight rule category conditions.
Footnotes
Declaration of Conflicting Interests
The author(s) declared no potential conflicts of interest with respect to the research, authorship, and/or publication of this article.
Funding
The author(s) disclosed receipt of the following financial support for the research, authorship, and/or publication of this article: Funding for this research was provided by the Federal Aviation Administration, via the PEGASAS Center of Excellence (12-C-GA-PU, Amendement #114), to the first and second authors. Conclusions, findings, and opinions are those of the authors, and not the FAA or US Government.