
Abstract
For the last century, the roadway design paradigm has been grounded in the physics of point masses, adjusted for human limitations. However, this is inadequate to assure pedestrian safety in complete streets where vehicle kinematics no longer control. Instead, social and psychological factors manage behavior. Unfortunately, the appropriate design critical psychological principles have yet to be elucidated. We posit that interpersonal perception governs drivers’ behavior, attentiveness and speed in streets. This is bounded by previously delineated human neurological and perceptual propensities. Using these perceptual limitations as postulates in a geometric style proof, we derive the person perception panorama (PPP): a window of interactivity around the moving driver that is continuously monitored for human presence, roughly 60 to 90 feet wide. In this area interpersonal interaction is implicit, functional, and has an impact on driver behavior. Validating evidence, additional governing principles, and an initial speed prediction formula are also included.
Keywords
Background
Accommodating Our Superpowers
From the engineer’s point of view, roadway design can be thought of as the environmental support for the manipulation of a large assistive device that provides the users with superpowers like speed, stamina, and maneuverability. The primary design paradigm employed idealizes the vehicle as a point-mass governed by Newtonian physical laws. Unfortunately, as with all superpowers, we found that our native capacities were not an ideal fit for our newfound abilities. Double-digit speed requires the reflexes of a cheetah. To anticipate what comes next, we need the eyesight of a hawk. The inertial consequences of mistakes that would inevitably occur require the armoring of a beetle. Since we couldn’t augment the driver’s native capacities, we shaped the environmental inputs to address these frailties. Design consistency and repetition helped us generate automatic responses at speeds that are not available for less over-rehearsed tasks. Font size, color programing, pavement markings, and iconography all helped our visual limitations. Superelevation nudged drivers back into position in curves. Large clear zones helped us avoid the consequences of minor mistakes. Add to this vehicle bulk, armoring, seat belts, and active protection systems, and some now rightfully worry about the potential risks to those outside the vehicles when those inside it have so little skin in the game. All of this has borne fruit: vehicle crash fatalities have stabilized at or below 20 per million vehicle miles for over 30 years (FARS Data Tables, 2024).
However, pedestrian and bicycle fatalities have been steadily increasing since 2009 (Aevaz, 2019). This can be traced to two concurrent phenomena. The timing of the rate increase tracks well with market absorption for smart phones making distraction an attractive target. Apple released its first iPhone in December 2007 and pedestrian fatalities have grown steadily since 2009. Much has been written about the costs of driver distraction, particularly to pedestrians. (Khan & Habib, 2022; Salmon et al., 2022). However, the second issue may be the critical factor. During this time period, the complete streets movement has also been aggressively encouraging communities to add multimodal features to all roadway designs. Figure 1 compares the number of complete streets policies to the pedestrian fatality rates since the early 2000’s.
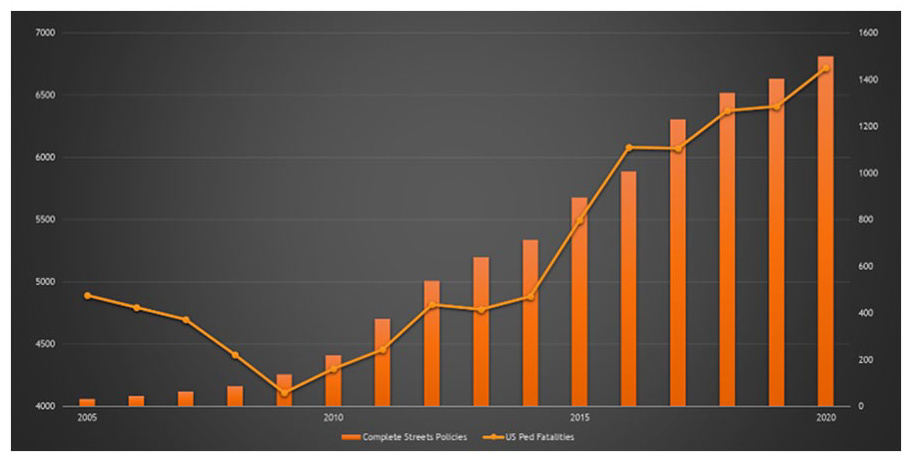
US complete street policies and pedestrian fatalities. (FARS, 2024; Complete Streets Policies, 2023)
Unfortunately, The US had spent the previous 60 years—two full generations—optimizing our systems for vehicular travel. Few front-line engineers had much experience in the design nuances of supporting pedestrians and cyclists and even fewer drivers expected their presence. Although the added features may have made the environment safer than it was previously, paradoxically, this may have invited vulnerable users into systems that were not yet safe enough, generating fatalities that may not have otherwise occurred.
An Ancient Design Paradigm
The 20th century physics-based design paradigm we have employed within roadway design is partly to blame. In low-speed multimodal environments, the driver’s discomfort with the vehicle kinematics are insufficient to control their behavior. The vast majority of non-motorized fatalities occur on arterials or collectors where eye-to-eye negotiations may be attempted by the pedestrian, but are not likely to be successful in engaging the driver due to their neurophysiological limitations (FARS, 2024).
Historically, pedestrians navigated environments via face-to-face, eye-to-eye negotiation. Where these dynamics control, safety issues remain manageable even with the most meager of interventions. In these environments, a different design paradigm must be applied, with a different strategic approach, one that is governed by an entirely different set of natural laws: psychological principles grounded in strengths and limitations of the minds and bodies of the participants. This begs two questions. Out of all of the corpus of psychological study, which principles are critical to these face-to-face operations and can they delineate what factors matter or where these principles apply? An appropriate set of governing principles grounded in the psychophysiological characteristics of the users should manifest themselves in the historic built environment and in the behavior of the drivers. Is there evidence that this is true?
In this paper, we will trace out a logical argument, similar to a geometric proof, composed of several well-known psychological principles and attempt to document the evidence that supports these principles and their ramifications.
The Proof
Corollary 1a: This is normal and adaptive. Much of the safety risks experienced by novice drivers stem from the need to consciously perform the skills that are later refined and executed automatically by System 1.
Corollary 1b: The function of System 1 is to maintain the person’s own health, safety, and welfare by monitoring the environment for threats or rewards. It is by necessity ego-centric because it is intended as a first line of defense that operates too quickly for System 2 second-guessing. It is not concerned with external risks to others, except where those risks would return back on the person in terms of deeply conditioned social rewards or shame.
Corollary 1c: System 1 is extraordinarily good at extrapolating statistical risk and reward probabilities from previous experience (Kahneman & Tversky, 2013).
Corollary 1d: Familiarity will enable automaticity and distraction (Harms, 2023). Drivers will prioritize their own comfort, including comforting themselves with a distraction when they are bored when System 1 deems the risks statistically acceptable, despite the cognitively understood risks this entails (Wilson et al., 2014). System 2 handles the self-control to tolerate this discomfort, but it can be easily fatigued.
Additional large sections of the brain are recruited in these tasks in addition to these single use areas. We are reflexively drawn to the human face (Fletcher-Watson et al., 2008). Facial recognition and body language decoding are implicated in the dopamine, oxytocin, and norepinephrine/adrenaline pathways, giving it priority for both reward and threat detection (Lotze et al., 2009; Rypma et al., 2015).
Corollary 2a: The height of the N170 and N190 waves that signal facial recognition and the decoding of body language (respectively) are tied to the emotional valence of the person observed (Blau et al., 2007). More intense emotions generate higher responses. What the brain is looking for is the emotional tone of the other person in order to evaluate whether that person implies a threat or reward.
Faces can be distinguished from clocks up to 16° from the fovea (Hershler et al., 2010). Biological movement is detectable out to 20°, though this decreases with age (Owsley, 2016). This angular limitation is due to the significant drop in the density of the rods and cones at distances away from the fovea (Wells-Gray et al., 2016).
Corollary 3a: An area designated the Person Perception Panorama (PPP) can be derived from these dimensions placed in plan view, with the driver at the center of the diagram. This yields a moving corridor 60 to 90 feet wide that travels with the driver (or pedestrian) as they traverse the corridor (Figure 2).
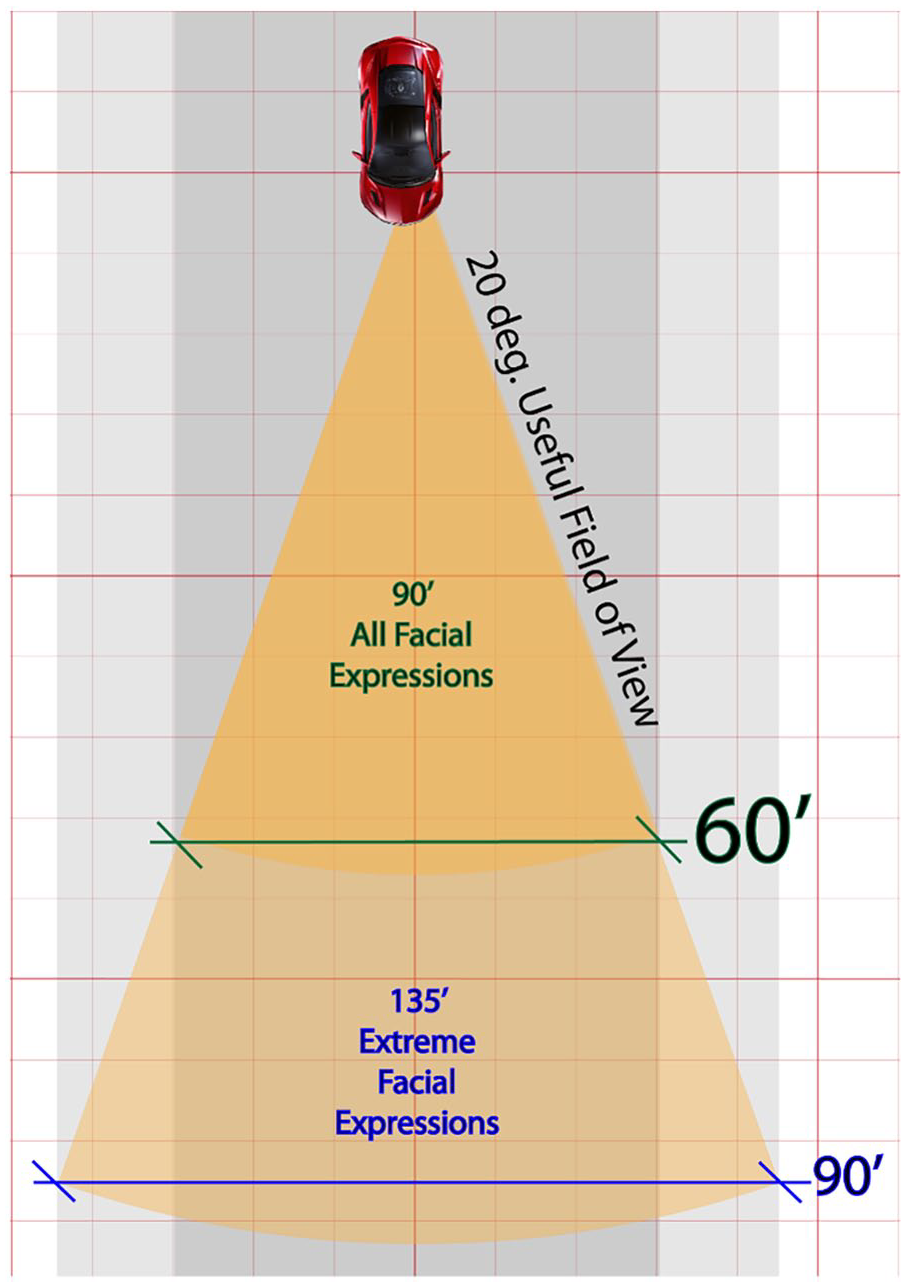
The person perception panorama.
Corollary 3b: Since System 1 is constantly monitoring the environment for other human beings for self-preservation purposes with or without selective attention, (Corollary 1b) and it is the emotional tone that is being evaluated (Corollary 2a), a person that is perceived within that 90 foot distance is likely to be given neurological priority by System 1 monitoring, whether they are consciously perceived or not. If the emotion is extreme, they may register within the longer, wider area. The presence of a person represents a potential threat or reward that may emerge in that interaction. This increases workload and engages self- monitoring systems that maintain social conformance in an effort to gain acceptance and avoid shame. This impacts operating speed.
Confirmation 1: In the FDOT Mental Frameworks project (Eluru et al., 2023), uncongested 85th percentile speeds measured within the SHRP2 NDS were collected at 200 locations evenly distributed between Seattle, Washington and Tampa, Florida. The visual width of each location was measured as the distance between receding lines of regular barriers at the driver’s eye height. This included obstacles like trees, buildings, on- street parking, consistently spaced utility poles, etc. In essence, this dimension delineates the visual “tunnel” the driver navigates. Unimpeded speed choice was strongly correlated (R2 = .49) with this dimension, but more importantly, threshold effects were observed at 60 and 90 feet in width, consistent with Corollary 3b (Figure 3). A narrow corridor will not guarantee a low speed operations, but when the width exceeds 60 feet, 30 mph 85th percentile speeds are no longer observed. Beyond 90 feet, unimpeded speeds below 45 mph are rare.
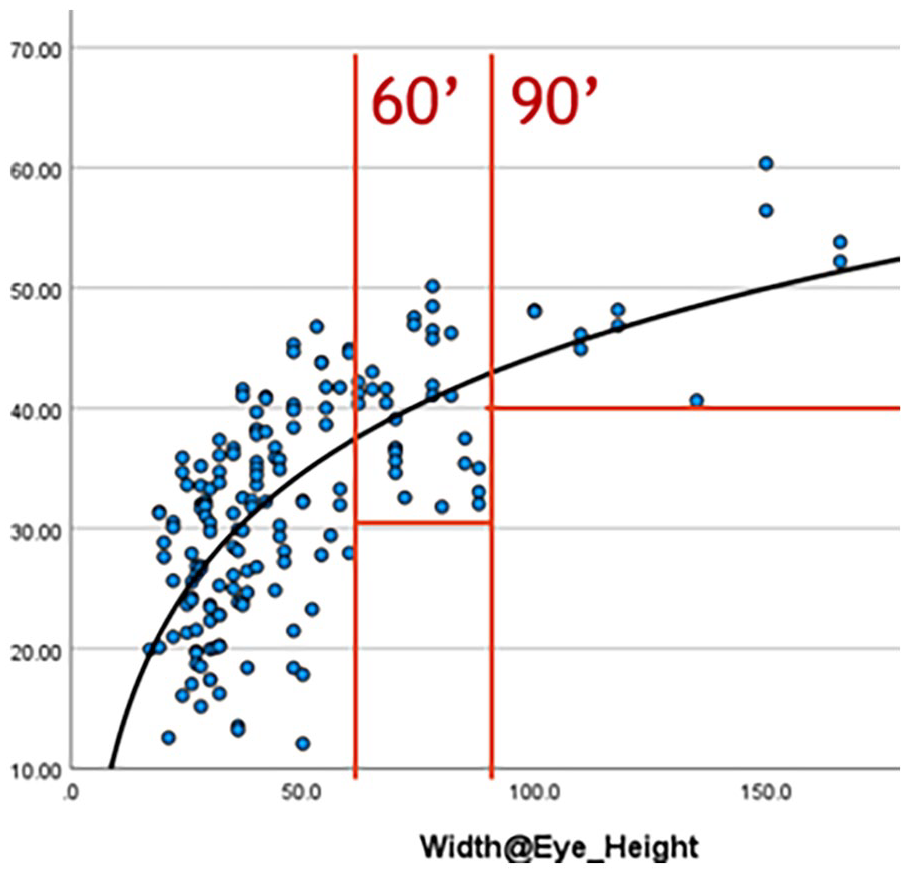
Visual width and uncongested 85th %ile speed.
Corollary 3c: System 1 bases its actions on experience. Since it is the perception of human presence that gets priority within the PPP, contexts that regularly generate this type of experience will be anticipated to do so in the future. This makes the actual presence of a person at any given time unnecessary to elicit behavioral change, given that they are present frequently enough for System 1 to anticipate their presence (Tice et al., 2022).
Confirmation 2: In the same Mental Frameworks study, vulnerable user presence (Were they there?) and perception (Were they seen?) were measured at each site. Figure 4 shows the relationship between the 85th percentile speed and the probability that a vulnerable user was observed by the driver during a study epoch. The unimpeded speed was very tightly correlated (R2 = .73) with the probability that a driver had seen a vulnerable user in the space but not with their presence. Of course, there are feedback relationships involved here. Pedestrians aren’t likely to be in places where drivers feel comfortable driving fast, which means drivers don’t expect them and they are less likely to be seen, even if they were present. Multitasking behaviors also decreased when vulnerable users were seen.
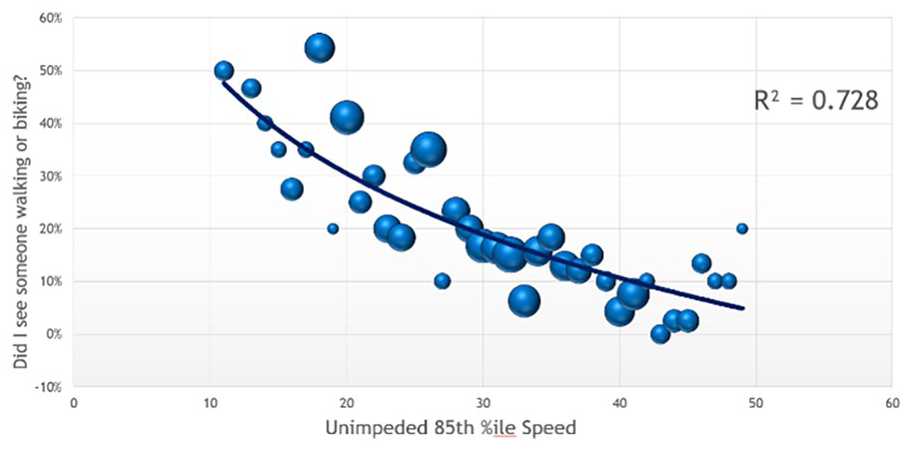
Odds of seeing a vulnerable user versus unimpeded speed.
Corollary 3d: Because the PPP can be surveilled using only System 1 resources and human presence can be observed without selective attention, areas wider than 60 feet require active surveillance rather than passive monitoring, making them intuitively uncomfortable for pedestrians, and less frequently monitored by drivers. When corridors are wider than this distance, a person will need to keep their “head on a swivel” to maintain full situational awareness of all threats and rewards in the space.
Confirmation 3: A cursory review of the oldest portions of the major city centers worldwide shows a development pattern where primary thoroughfares are typically 60 to 90 feet from building face to building face. There are exceptions for marketplaces and grand boulevards with tree lined linear parks, but the pattern is fairly consistent in most major cities. This includes Paris, Rome, Milan, Florence, London, Portland, Seattle, Vancouver, and Quebec City, as well as many older Asian and middle eastern cities. Local streets are much smaller, typically 40 feet in width. Notable exceptions are Washington DC and the newer sections of Barcelona, which were both designed in anticipation of either parade routes, steam powered vehicles, or multiple horse drawn carriages side by side.
Corollary 4a: At 30 mph, the entire range of the driver’s visual focus is within the PPP. By 40 mph, over half of their fixations will be beyond this range. In essence, like overdriving your headlights at night, between 30 and 40 mph, System 1 deems face-to-face interaction as either futile or unnecessary and it ceases to impact the driver’s behavior to any significant extent, either in terms of attention or speed management.
Confirmation 4: In the study that established the concept of perceptual narrowing, (Rogers et al., 2005), the visual angle reduces as drivers increase speed. When the focal length and angular reduction are taken into account, the area that the driver is monitoring at the higher speed reflects an ellipse roughly 60 feet in width.
Corollary 6a: In an urban environment, clutter and mechanical interaction (stops, starts, deviations) have an impact on speed and workload, but potential human interaction is the critical component. Interaction with other people portends rewards and threats, which also induces workload. These are managed via System 1 mechanisms that emerge without the need for the higher level executive functions in System 2. Indeed, overriding them may require additional workload resources.
Corollary 6b: Observing that factors like the likelihood of human presence, interaction potentials for those within the PPP, and interruptions each contribute to the driver’s workload, each will impact operational speed.
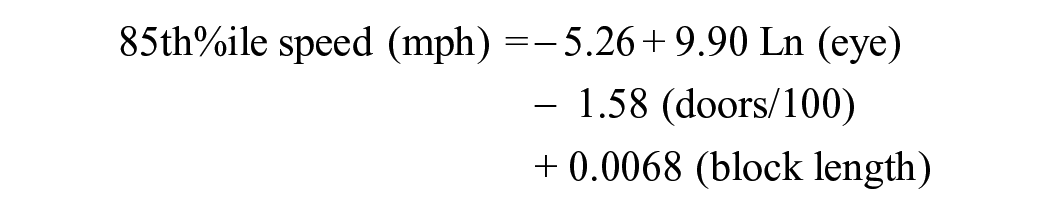
Confirmation 5: A linear regression was fitted to the unimpeded speed using three measurable variables as proxies for these factors (R2 = .62). Active doorway density was used as a proxy for the frequency of human presence. The visual corridor width was used to mark the potential for human perception, and block length was used as a measure of the frequency of interruptions.
Conclusions
The purpose of this paper was to delineate the established psychological principles that govern the operations of a face-to-face urban environment and derive how these principles shape the behavior of the drivers in that space. Doubtless, there are other psychological principles that have a bearing on this topic that have yet to be fully explored. For example, event segmentation theory (Radvansky, 2017), the theory that explains why memory gets reset as we cross doorway thresholds, is likely to have critical impacts on visual scanning patterns and contextual retention at intersections. However, this proof should be sufficient to begin to discuss design, context, and land use patterns in a more concrete fashion, recognizing that each has a direct impact on driver behavior and non- motorized user safety outcomes. This approach also should move the discourse for vulnerable user safety and speed management into more realistic discussions about attention management, speed control, and vulnerable user conspicuity.
Rather than their behaviors being seen as enigmatic or mercurial, it is clear that drivers have been operating their vehicles consistent with their human capabilities. These principles provide the tools for roadway designers to understand how to shape driver behavior in concrete ways and to determine for themselves when they cannot. It may be that the community’s mobility or capacity goals conflict with their vulnerable user safety goals for much of the roadway network we currently use, necessitating more aggressive vulnerable user protection and more conspicuous crossing locations. In addition to equity concerns regarding those that cannot drive for economic or disability reasons, our aging population will need an environment that can be safely accessed as they lose the ability to drive safely. Land use mix, building orientation, parking placement, and roadway design rarely change quickly, but are key factors in human presence and their salience to the driver. Without changing the context around the driver, both in terms of the built environment and the human presence that frequents it, our drivers’ attentiveness and speed are unlikely to change. The choice to maintain the built environment as it is or transform it in ways that encourage higher levels of interaction will dicatate the types of driver behavior we get, but also impacts the ability to connect informally within society. It is these connections and the spaces that build community (Jeffres et al., 2009). Although the resulting decisions may be difficult, it is far better to know you have the ability to make those decisions rather than experience the powerlessness that has been the norm in our low-speed design practices.
Footnotes
Declaration of Conflicting Interests
The author(s) declared no potential conflicts of interest with respect to the research, authorship, and/or publication of this article.
Funding
The author(s) disclosed receipt of the following financial support for the research, authorship, and/or publication of this article: This research was funded by the Florida Department of Transportation grant BDV24 TWO 977-34.