
Abstract
This study examines the ergonomic impact of augmented reality (AR) technologies in educational contexts, with a focus on understanding how prolonged AR engagement affects postural dynamics and physical demands on users. By analyzing slouching scores alongside NASA Task Load Index (TLX) Physical Demand (PD) values, we assess the physical strain experienced by participants during the initial modules of an AR-based lecture series. Our findings demonstrate a notable decline in slouching scores as participants progress through the lecture modules, indicating increased postural deviations. To quantify these effects, we developed a regression model that effectively predicts the physical demands imposed by various AR modules, based on the observed slouching scores.
Introduction
In the rapidly evolving area of digital education, Augmented Reality (AR) has emerged as a transformative tool, offering unparalleled opportunities for enhancing learning experiences across various disciplines. While it provides an immersive learning experience (Rampolla & Kipper, 2012), it also brings new challenges that can affect the user’s comfort and, ultimately, their learning outcomes.
The primary objective of this study is to investigate the relationship between prolonged engagement with AR in educational settings and the manifestation of postural fatigue among users. This exploration is grounded in the hypothesis that extended exposure to AR environments causes noticeable changes in users’ posture, specifically leading to increased postural fatigue, characterized by a rearward shift in the center of mass (COM). This postural degradation could arise because of the immersive nature of AR, which, while engaging, may inadvertently lead users to adopt static or awkward positions for extended periods. Thereby increasing physical load, exacerbating stress, and contributing to muscle strain and discomfort. As AR interfaces become more sophisticated and more widespread in educational settings, there is an urgent need to understand the physical demands on learners. A considerable amount of research has been focused on the cognitive benefits of AR—its ability to reduce mental workload (Guo & Kim, 2020), engagement (McLean & Wilson, 2019), and retention (Huang et al., 2019). However, the physical interaction between the user and the AR system—a significant determinant of the technology’s efficacy—is not as well explored.
This study, therefore, seeks to fill this gap by examining the impact of prolonged exposure to AR on postural stability and fatigue. Our experiment, with its varied content and interactive nature, provides a unique opportunity to observe and quantify these effects. Initial observations indicate that the allure of the AR experience, which encourages prolonged periods of immobility may lead to postural fatigue. In this study, we take a step toward identifying and quantifying the problem of postural fatigue in AR and developing a nuanced understanding of how such fatigue could potentially affect learning by leading to a decline in comfort and concentration over time.
This study aims to bridge the research gap by examining how continuous exposure to AR environments influences users’ postural stability and fatigue dynamics. Through a comprehensive analysis of motion capture data, this research seeks to quantify the challenges posed by AR learning, offering insights into creating more user-friendly educational tools that balance technological innovation with health considerations. Furthermore, this research contributes to a broader discourse on user-centered design in educational technology. By using the outcomes from the current study, we can derive insights that are specific and actionable, laying the groundwork for ergonomic considerations to be incorporated right from the early stages of AR system design. It is imperative to consider these ergonomic factors not as supplemental but as integral to the design and deployment of AR in education. With this objective in mind, we delve into the methodology, findings, and broader implications of our work, which we hope will pave the way for a future where AR-enhanced learning is as ergonomically sound as it is educationally effective.
Methodology
Experimental Setup
The comprehensive experimental setup (Guo & Kim, 2021; Yu et al., 2023) underpinning this study has been architected to evaluate an Augmented Reality (AR) educational system’s effectiveness. This system integrates AR with Near-Field Electromagnetic Ranging (NFER) (Schantz, 2007) and motion capture technologies. Central to this experimental design is the AR instructional platform, intricately developed to administer a duo of engineering-themed lectures. Microsoft HoloLens 2 (Kapp et al., 2021), selected for its sophisticated holographic and eye-tracking capabilities, serves as the AR medium (Kim et al., 2023).
Within the controlled experimental environment, participants—undergraduate engineering students—are free to move and interact with the AR content spatially confined into designated zones, aligning with the modular structure of the lectures (see Figure 1). The precise indoor tracking afforded by the Q-Track NFER system is instrumental to this setup, enabling a location-based generation of modules helping participants maneuver through the AR space.
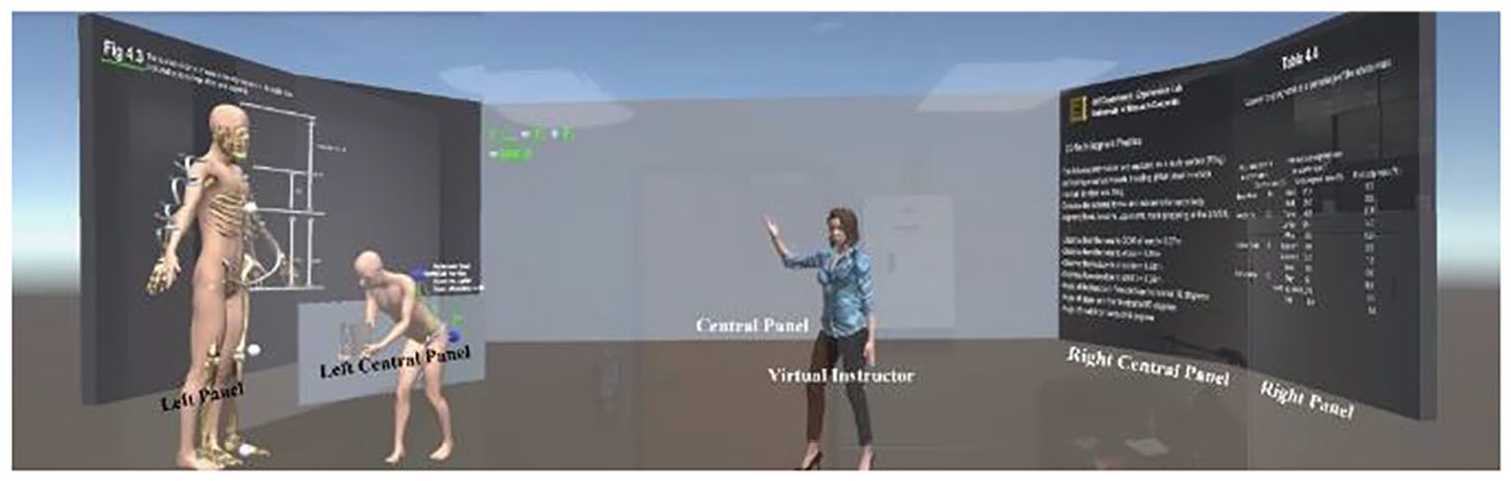
Labeled 3D scene of an AR module built with Unity.
Based on a quasi-experimental design (White & Sabarwal, 2014), 21 undergraduate engineering students from the University of Missouri participated in this experiment. The Xsens motion capture sensors, equipped with location tracking, are attached to participants to accurately record their bodily movements, focusing particularly on hand gestures and upper body dynamics (refer to Figure 2). This motion data is not only for understanding current interactions but also serves as the backbone for future development of gesture-based controls, potentially enriching the interactivity of AR learning experiences. Moreover, we incorporated D-lab eye tracking to gauge the cognitive and mental demands experienced by participants during the study.
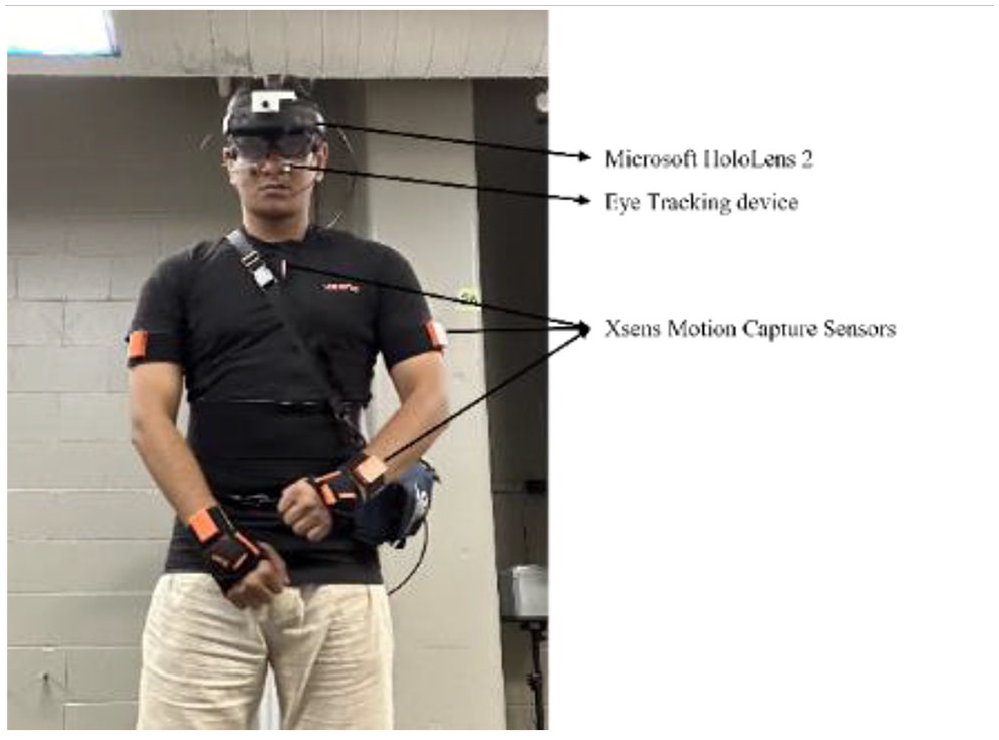
Equipped with hardware components.
The content for these AR lectures is crafted using the Unity engine, renowned for its prowess in creating compelling 3D environments. This study comprises two lectures: Lecture 1 consists of seven modules that progressively introduce participants to fundamental biomechanical concepts, with each module increasing in complexity. Conversely, Lecture 2 contains eight modules that explore more advanced problem-solving topics. For this study, we only utilized data from Lecture 1.
The AR learning experience commenced with an introduction to biomechanics in module 1, followed by problem-solving in modules 2 and 4, focusing on forces, momentum, and achieving static equilibrium. Module 3 delved deeper into static equilibrium concepts. From module 5, biomechanical principles applied to human body dynamics during lifting, culminating in modules 6 and 7, which involved intensive calculations on body dynamics, providing a progressive, in-depth understanding of biomechanics. Despite being exposed to seven modules in Lecture 1, this study solely focuses on the correlation between AR learning associated with acquiring declarative knowledge and physical demands, as indicated by slouching scores. Consequently, the data analysis covers modules #1 to 4.
The experimental process begins with a preparatory phase where students are equipped with all the necessary hardware components and receive comprehensive instructions from a lab assistant in a controlled environment. This setup ensures that they fully understand the study’s protocols before they engage with the material. This preparation is crucial for facilitating their initial interaction with experiment Lecture 1, which is designed to ease learners into the AR environment. After the experiment, participants provided usability feedback and completed metacognition assessments and NASA TLX (Hart, 2006).
Participants’ interaction with the lectures is active, they are physically and cognitively interacting with it, an aspect assessed through subsequent quizzes and evaluations. These assessment tools are important, not just for evaluating immediate learning impacts but also for gauging the AR system’s instructional efficacy.
Data Processing
In the data processing phase of our study, we refine and focus the data collected from AR interactions during Lecture 1, to extract meaningful insights specific to our research objectives. The initial stage involves segmenting the comprehensive datasets obtained through motion capture and HoloLens eye-tracking technologies. This segmentation targets essential metrics such as the position data and COM, isolating the elements that are most indicative of postural dynamics.
Following segmentation, we employ visual analysis tools to interpret the shifts in balance and posture as indicated by COM changes. These visualizations help us discern subtle movements and shifts, for instance, identifying patterns such as a consistent rearward shift in COM can indicate increasing physical fatigue, a primary concern of this study.
Synchronization of timestamps across different data sources is critical. We align the motion capture data with the HoloLens eye-tracking data by matching frame numbers to precise moments of gaze and physical positioning. This synchronization allows us to construct an accurate and detailed timeline of user interactions throughout the modules. After aligning the data, we segregate it by module, enabling focused analysis on specific segments of the lecture. This step is crucial for identifying which parts of the lecture may be more physically demanding or potentially contribute to a quicker onset of fatigue.
The final step in our data processing is the filtration of the aligned and segregated data to remove any extraneous information or noise. This filtration is vital for ensuring the accuracy and reliability of our analysis. Focusing on data captured when participants are directly engaging with the central panel minimizes the impact of peripheral activities, thus enhancing the clarity and robustness of our findings.
Throughout this phase, we generated various visualizations to transform complex datasets into intuitive graphical representations. These visuals effectively illustrate the dynamics of user interactions within the AR environment, aiding in the clear communication of our findings.
Data Analysis
In the analysis of postural dynamics within our AR educational setup, we employed filtered motion capture data to quantify deviations of the COM positions across different modules. This detailed examination, illustrated in various plots, highlighted notable variations in participant postures that potentially reflect their interactions with specific AR content. For instance, significant lateral shifts in the COM, particularly noted in the “COM position X (representing the horizontal movement of COM,” indicated that certain modules might induce physical responses such as balancing reactions or ergonomic adjustments to the immersive AR environment (e.g., see Figures 3 and 4).
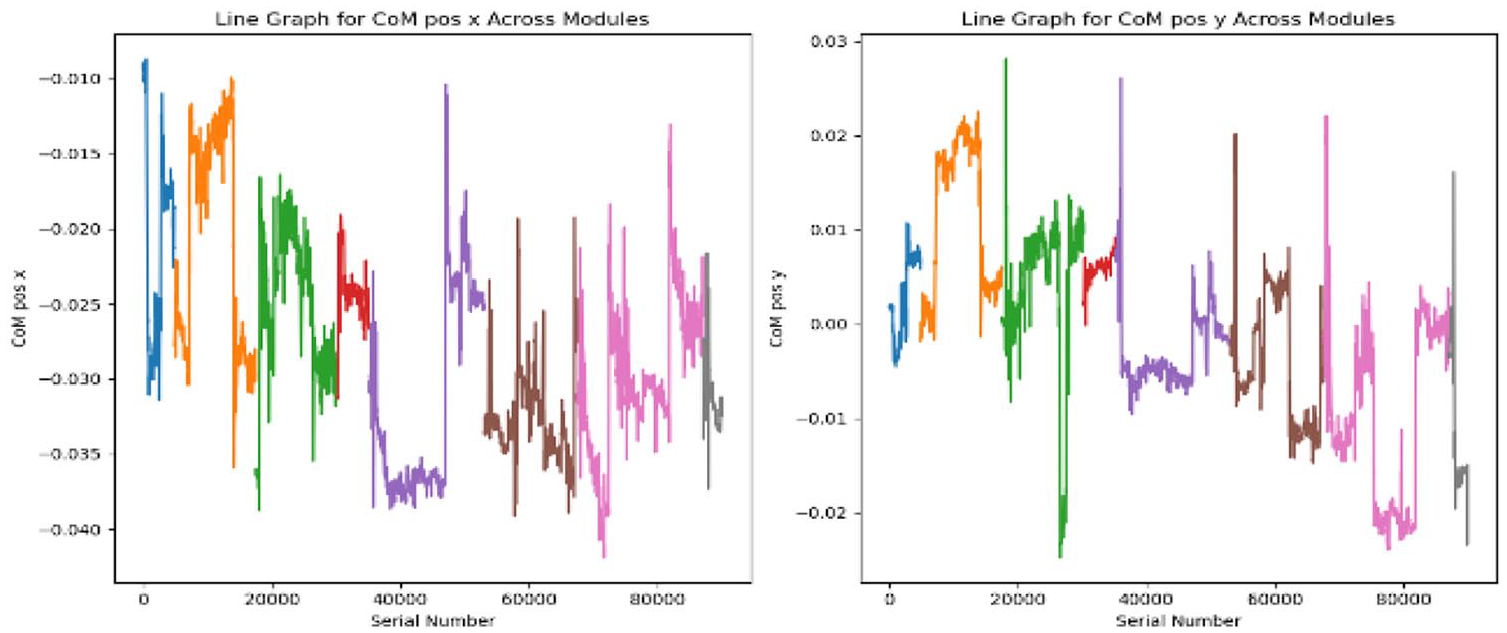
Module-specific COM visualization in x and y axes of the movement of a participant. Visualizations offered quantifiable evidence of the impact of AR on physical engagement, revealing that some modules imposed greater physical demands, driving more pronounced postural adjustments.
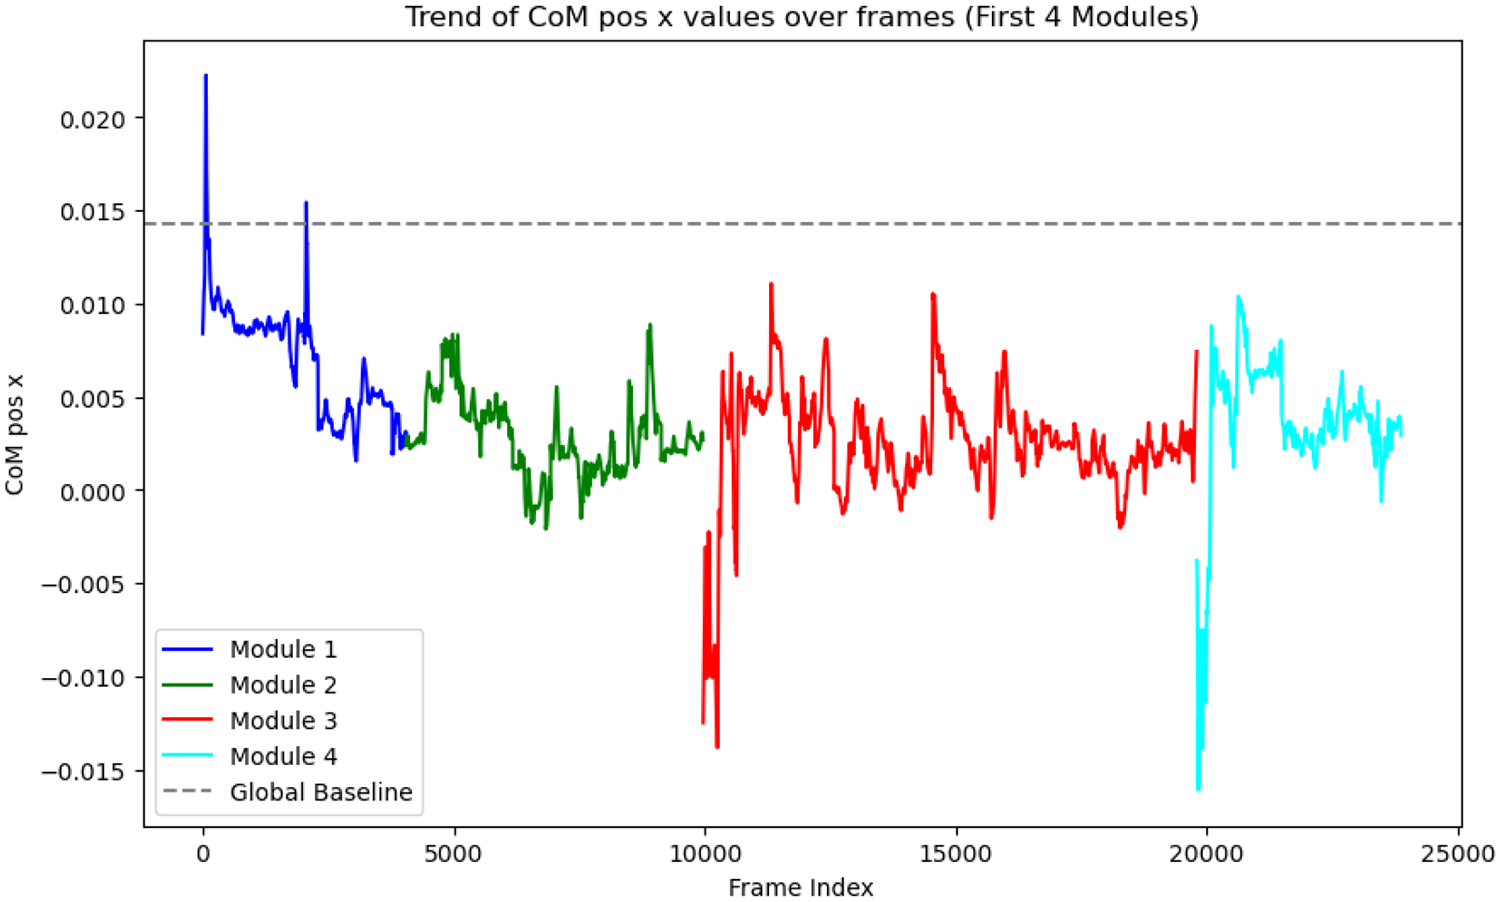
Frame-by-Frame COM pos X trajectory the modules from #1 to #4.
Parallel to our analysis of postural dynamics, we dedicated a substantial portion of our research to developing and interpreting slouching scores. This metric, ranging from 0 to 100, quantifies the extent of a participant’s postural deviation from a predetermined participant-specific baseline, established during the initial 4 s of “Module 1.” Here, participants generally displayed stable postures, making it an ideal reference for subsequent comparisons. Maximum deviation is calculated by taking the average of 240 maximum values from all the modules. A slouching score of 100 indicates no deviation from this baseline, suggesting optimal postural stability, whereas lower scores signal significant deviations, which could be symptomatic of physical strain or discomfort.

Our methodological approach involved calculating the maximum deviation from this baseline by isolating the top 240 deviations in “COM pos x,” which represents the most significant shifts observed during the module interactions. This threshold provided a benchmark for substantial postural changes.
In our analysis, we developed a linear regression model (Twomey & Kroll, 2008), designed to predict physical demand based on slouching scores from different modules. The regression coefficients offered insights into the specific impact of each module on perceived PD, highlighting the direct relationship between engagement in AR learning activities and ergonomic challenges.
Results
In our study, the analysis of slouching scores across the modules from modules #1 to #4 in Lecture 1 provided profound insights into the physical demands exerted on participants within AR learning environments. As previously stated, although participants encountered seven modules in Lecture 1, this study specifically investigates the correlation between the learning processes associated with acquiring declarative knowledge and physical demands, quantified through slouching scores. Consequently, data analysis encompasses modules #1 to #4. A pattern emerged, characterized by a gradual decline in slouching scores from the beginning to the end of the lecture. This trend, especially marked in the initial modules, indicated significant postural deviations and a corresponding increase in physical demand and fatigue as participants progressed through the lecture. The progression within each module demonstrated how varying content delivery and interaction requirements could differentially impact participants’ physical well-being.
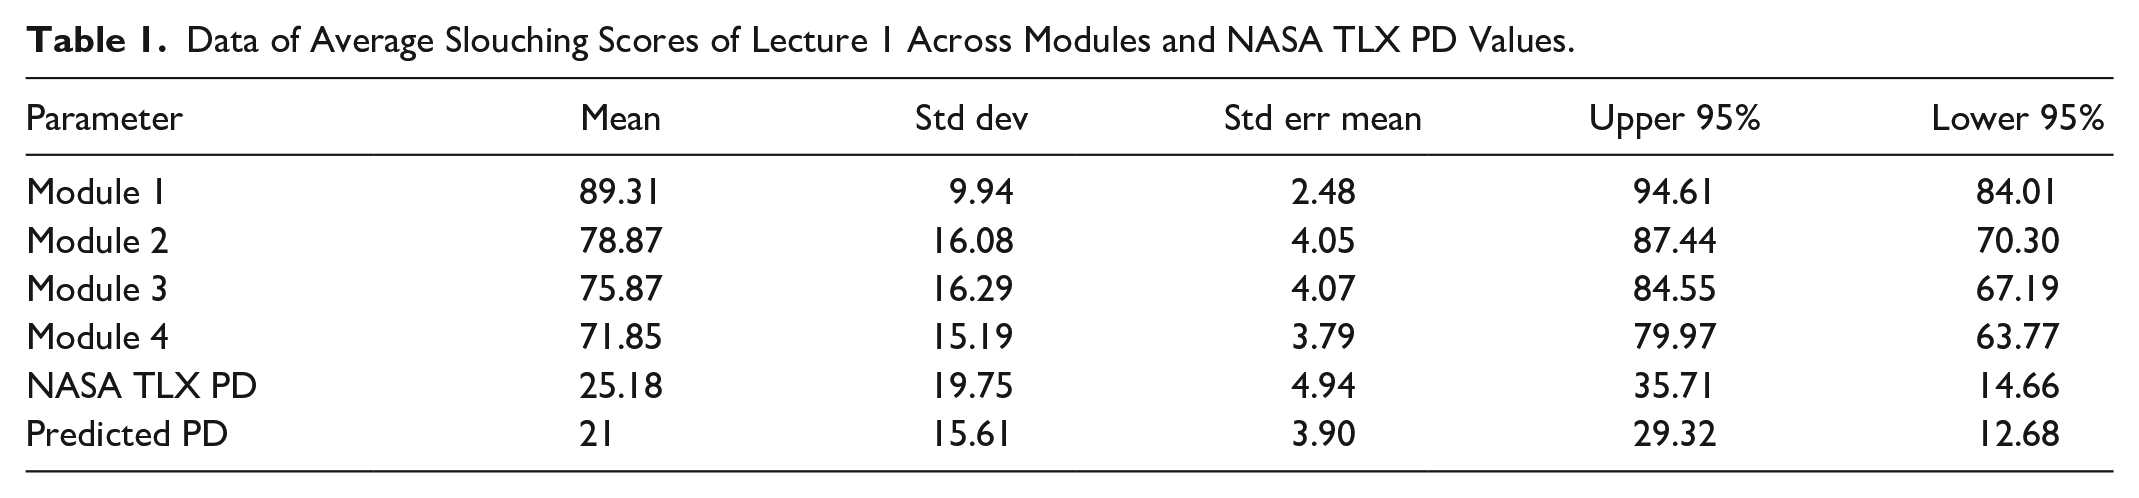
Table 1 illustrates the data of average slouching scores across Lecture 1′s modules alongside NASA TLX PD values, showing the spread and mean values that highlight the need for tailored AR design to enhance comfort and maintain user engagement.
Data of Average Slouching Scores of Lecture 1 Across Modules and NASA TLX PD Values.
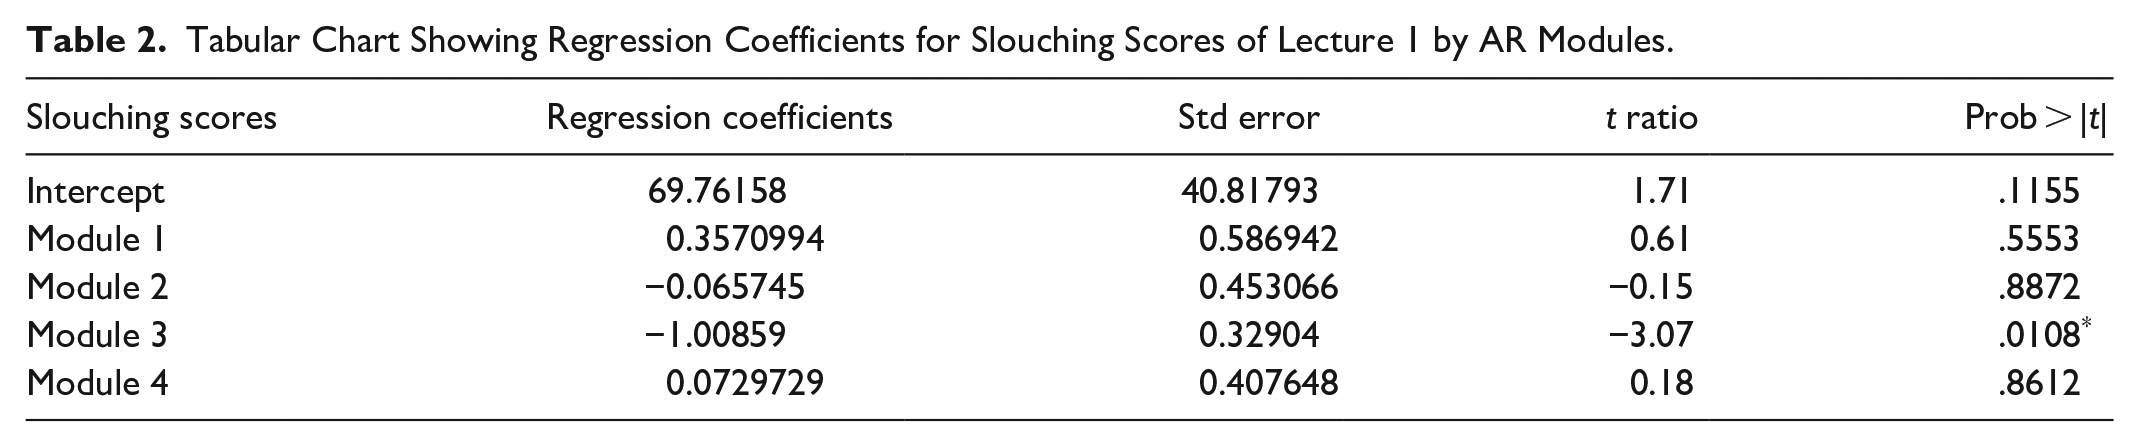
Our regression model analysis further substantiated the relationship between slouching scores and physical demand across different AR modules, offering a predictive insight into the physical strain experienced by participants. For instance, in Module 3 (see Table 2), a significant negative coefficient indicated that higher engagement levels led to more pronounced postural deviations suggestive of increased fatigue. The scatter plot in Figure 5. Compares the actual NASA TLX PD scores to with the module 3 slouching score. In Lecture 1 module 3, each point in the graph corresponds to a pair of actual PD values and the module 3 slouching score for an individual participant. The plot’s R-squared value is 0.59, meaning the model predicts about 59% of the variability in actual PD scores effectively.
Tabular Chart Showing Regression Coefficients for Slouching Scores of Lecture 1 by AR Modules.
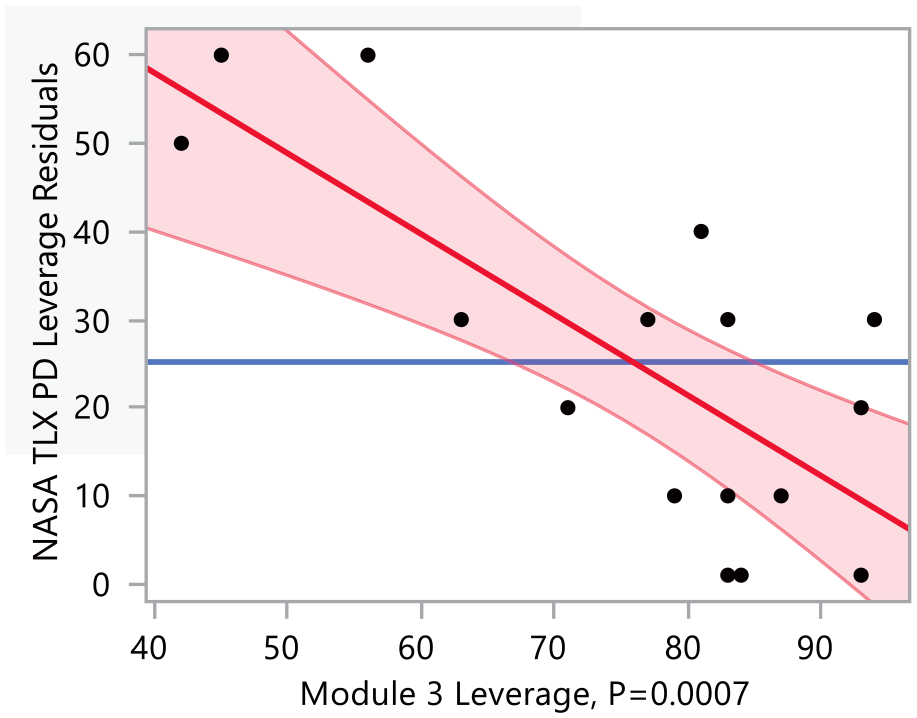
Scatter plot comparing actual NASA TLX PD values and Module 3 slouching scores.
Discussion
From our findings of this study, it is important to address three fundamental questions that emerge from our research on the physical impacts of augmented reality (AR) in educational settings.
How Do the Slouching Scores Relate to the Physical Impact of AR on Users?
Slouching scores serve as a key metric in this study, quantitatively linking users’ postures to the physical demands imposed by AR technologies. As users progress through AR modules, decreased slouching scores correlate with increased physical strain, revealing the ergonomic challenges inherent in prolonged AR use.
Understanding the Specifics of AR Module Interaction and Physical Demands
In our study, we analyzed the AR modules’ content and user interaction, observing that each module varied in cognitive load and required physical interaction. Module 3 stood out as it introduced complex concepts of static equilibrium, demanding heightened cognitive and physical engagement from users. The nature of this module led to increased postural adjustments and hence a more pronounced effect on slouching scores, which was reflected in the regression analysis. Moreover, the raw slouching scores revealed a consistent decrease through modules, indicating that as the complexity of tasks increased, so did the physical demand on users. This was quantified using the predictive model, which effectively captured the nuances of user engagement with the AR modules.
Estimating PD and Fatigue in AR Environments
Beyond slouching scores, factors such as the duration of interaction with AR, the complexity of tasks within each module, and individual user characteristics like prior AR experience can influence physical workload (Cornell & Berger, 1987; Fiľo & Janoušek, 2022). For instance, participants with less AR experience may exhibit more significant physical strain as they adapt to the AR interface. This data, coupled with our robust regression model, provided a comprehensive understanding of the physical workload associated with AR use, informing ergonomic optimizations in AR system design.
Conclusion
Our study’s comprehensive analysis of slouching scores and postural dynamics within AR learning environments culminates in several critical insights that both validate and expand our understanding of the ergonomic challenges associated with prolonged AR engagement. The gradual decline in slouching scores from modules #1 to #4 in Lecture 1 demonstrates an increase in postural deviations and physical demand, signaling a rise in the physical fatigue faced by participants as they interact with immersive AR content.
The regression model developed through our study provided a robust framework for predicting physical demand based on slouching scores, further illustrating the predictive capabilities of our analytical approach. This model not only reinforced the empirical findings of our physical assessments but also offered a methodological advancement in how we understand and anticipate the physical ergonomic impacts of AR in educational settings.
Future research should focus on expanding the sample size and diversity of participants to enhance the generalizability of the findings. It is also crucial to diversify the AR content to assess ergonomic impacts across different educational and training scenarios. Moreover, integrating machine learning techniques could offer significant advancements in real-time ergonomic analysis, enabling systems to automatically adjust to individual user needs and behaviors. These advancements would not only refine the effectiveness of AR applications but also ensure they are safer and more beneficial for broader users.
Footnotes
Declaration of Conflicting Interests
The author(s) declared no potential conflicts of interest with respect to the research, authorship, and/or publication of this article.
Funding
The author(s) disclosed receipt of the following financial support for the research, authorship, and/or publication of this article: This research is supported by NSF IIS-2202108.