
Abstract
Extreme heat is the cause of most US weather-related deaths and is a serious risk for older adults, children, and people with medical issues living in vulnerable neighborhoods. This study explored how extreme heat events affect vulnerable communities, focusing on people’s perceptions, adaptive behaviors, and social network support. Mobile ecological momentary assessment through Short Message Service was employed to collect real-time data from residents in a socioeconomically challenged urban neighborhood in Iowa. Participants responded to text messages with survey links twice daily during heat events over the summer, in which they were asked about their perceptions and behaviors. The results show the need for targeted, inclusive, and effective heat warnings and social network support to reduce heat risks and help vulnerable communities better cope with extreme heat.
Introduction
Real-time data collection was conducted to understand the impact of extreme heat events on human behavior in vulnerable populations. Heat is the most frequent cause of weather-related deaths in the United States (US Department of Commerce, n.d.). Heat extremes are occurring more frequently, with greater severity and longer duration (Habeeb et al., 2015). Over 700 people die each year from heat-related illnesses in the US (Vaidyanathan et al., 2020). Vulnerable populations include older adults, children, and those with chronic medical conditions (Jay et al., 2021), especially among people with low income. While only 18% of US homes lack air conditioning (AC), up to 60% of homes in low-income areas are older, poorly built, and have no central AC. Current strategies and heat warning systems are ineffective in engaging vulnerable populations (Mayrhuber et al., 2018; Sampson et al., 2013). Heat perception plays an important role in shaping mitigations and behavioral change (Hass et al., 2021).
Although the research on human perception and behavioral responses to heat is growing (Hass et al., 2021; McLoughlin et al., 2023), more work is needed to understand the perceptions, behaviors, and support mechanisms of vulnerable populations during heat events (Howe et al., 2019; Schoessow et al., 2022). However, most behavioral research during heat events relies on interviews and recollections (Hansen et al., 2011; Pasquini et al., 2020), which participants may not accurately remember past experiences or may leave out details when reporting them, leading to recall bias (Ravanelli et al., 2023; Sampson et al., 2013). Further, surveying vulnerable groups is challenging, time-consuming, and costly (von Benzon & van Blerk, 2017). Vulnerable groups are often hard to reach due to lack of trust (Stonewall et al., 2017), lack of contact information, insufficient infrastructure, and difficulties obtaining consent (Amann & Sleigh, 2021). The approach taken in this work employs a Short Message Service (SMS) based mobile ecological momentary assessment (EMA) to capture real-time data on individual behaviors. Mobile EMA utilizes smartphones for frequent, real-time data collection in natural environments, which can reduce recall bias, decrease participant burden, and improve assessment accuracy (de Vries et al., 2021). Specifically, the SMS-based EMA methodology is the core of our “Quick Capture” study, part of a broader effort to develop mitigation requirements based on community needs, behaviors, and beliefs. The study was conducted in Des Moines, IA. This pilot study aims to understand people’s perceptions, behaviors, and support networks during heat events while testing and refining the methodology.
Method
Participants
Of the 900 neighborhood residents contacted by mail, 37 completed an initial survey, and 8 (2 males, 6 females) enrolled in the current study. Participants averaged years 46 years old (range 18–74). Six participants reported an annual household income of less than $35,000, with two <$15,000. All eight participants had air conditioning at home, half using a central air conditioning system and the other half using window air conditioning units.
Event-Based Design
The event variable was weather with two levels: baseline event and heat event. Each event lasted four to five consecutive days. A heat event was defined as a time period where the heat index was predicted to exceed 100°F for three or more consecutive days. The baseline was a period with a prediction below 90°F for an equivalent duration. However, the actual heat index values recorded during the study periods varied from the forecasts. The study includes three heat events that occurred during the summer of 2023, with heat index values in parentheses: July 25–29 (M = 101, SD = 8.7), August 20–24 (M = 110.4, SD = 3.7), and September 2–5 (M = 96.3, SD = 1.6). One baseline was captured for comparison: September 16–20, with a mean heat index of 78.6°F (SD = 2.4).
Procedure and Measures
Participants responded to SMS prompts with survey links twice daily during each heat event. At approximately 2 PM, participants received the six-question early afternoon (EA) survey asking about real-time perception and behaviors. At approximately 7 PM, the 11-question late afternoon (LA) survey asked participants to reflect on that day. At the end of the heat event, an event exit survey asked about their experience with the past heat event. A final survey reflected their experiences throughout the summer. The survey measures are described in Table 1.
Dependent measures across the different surveys.
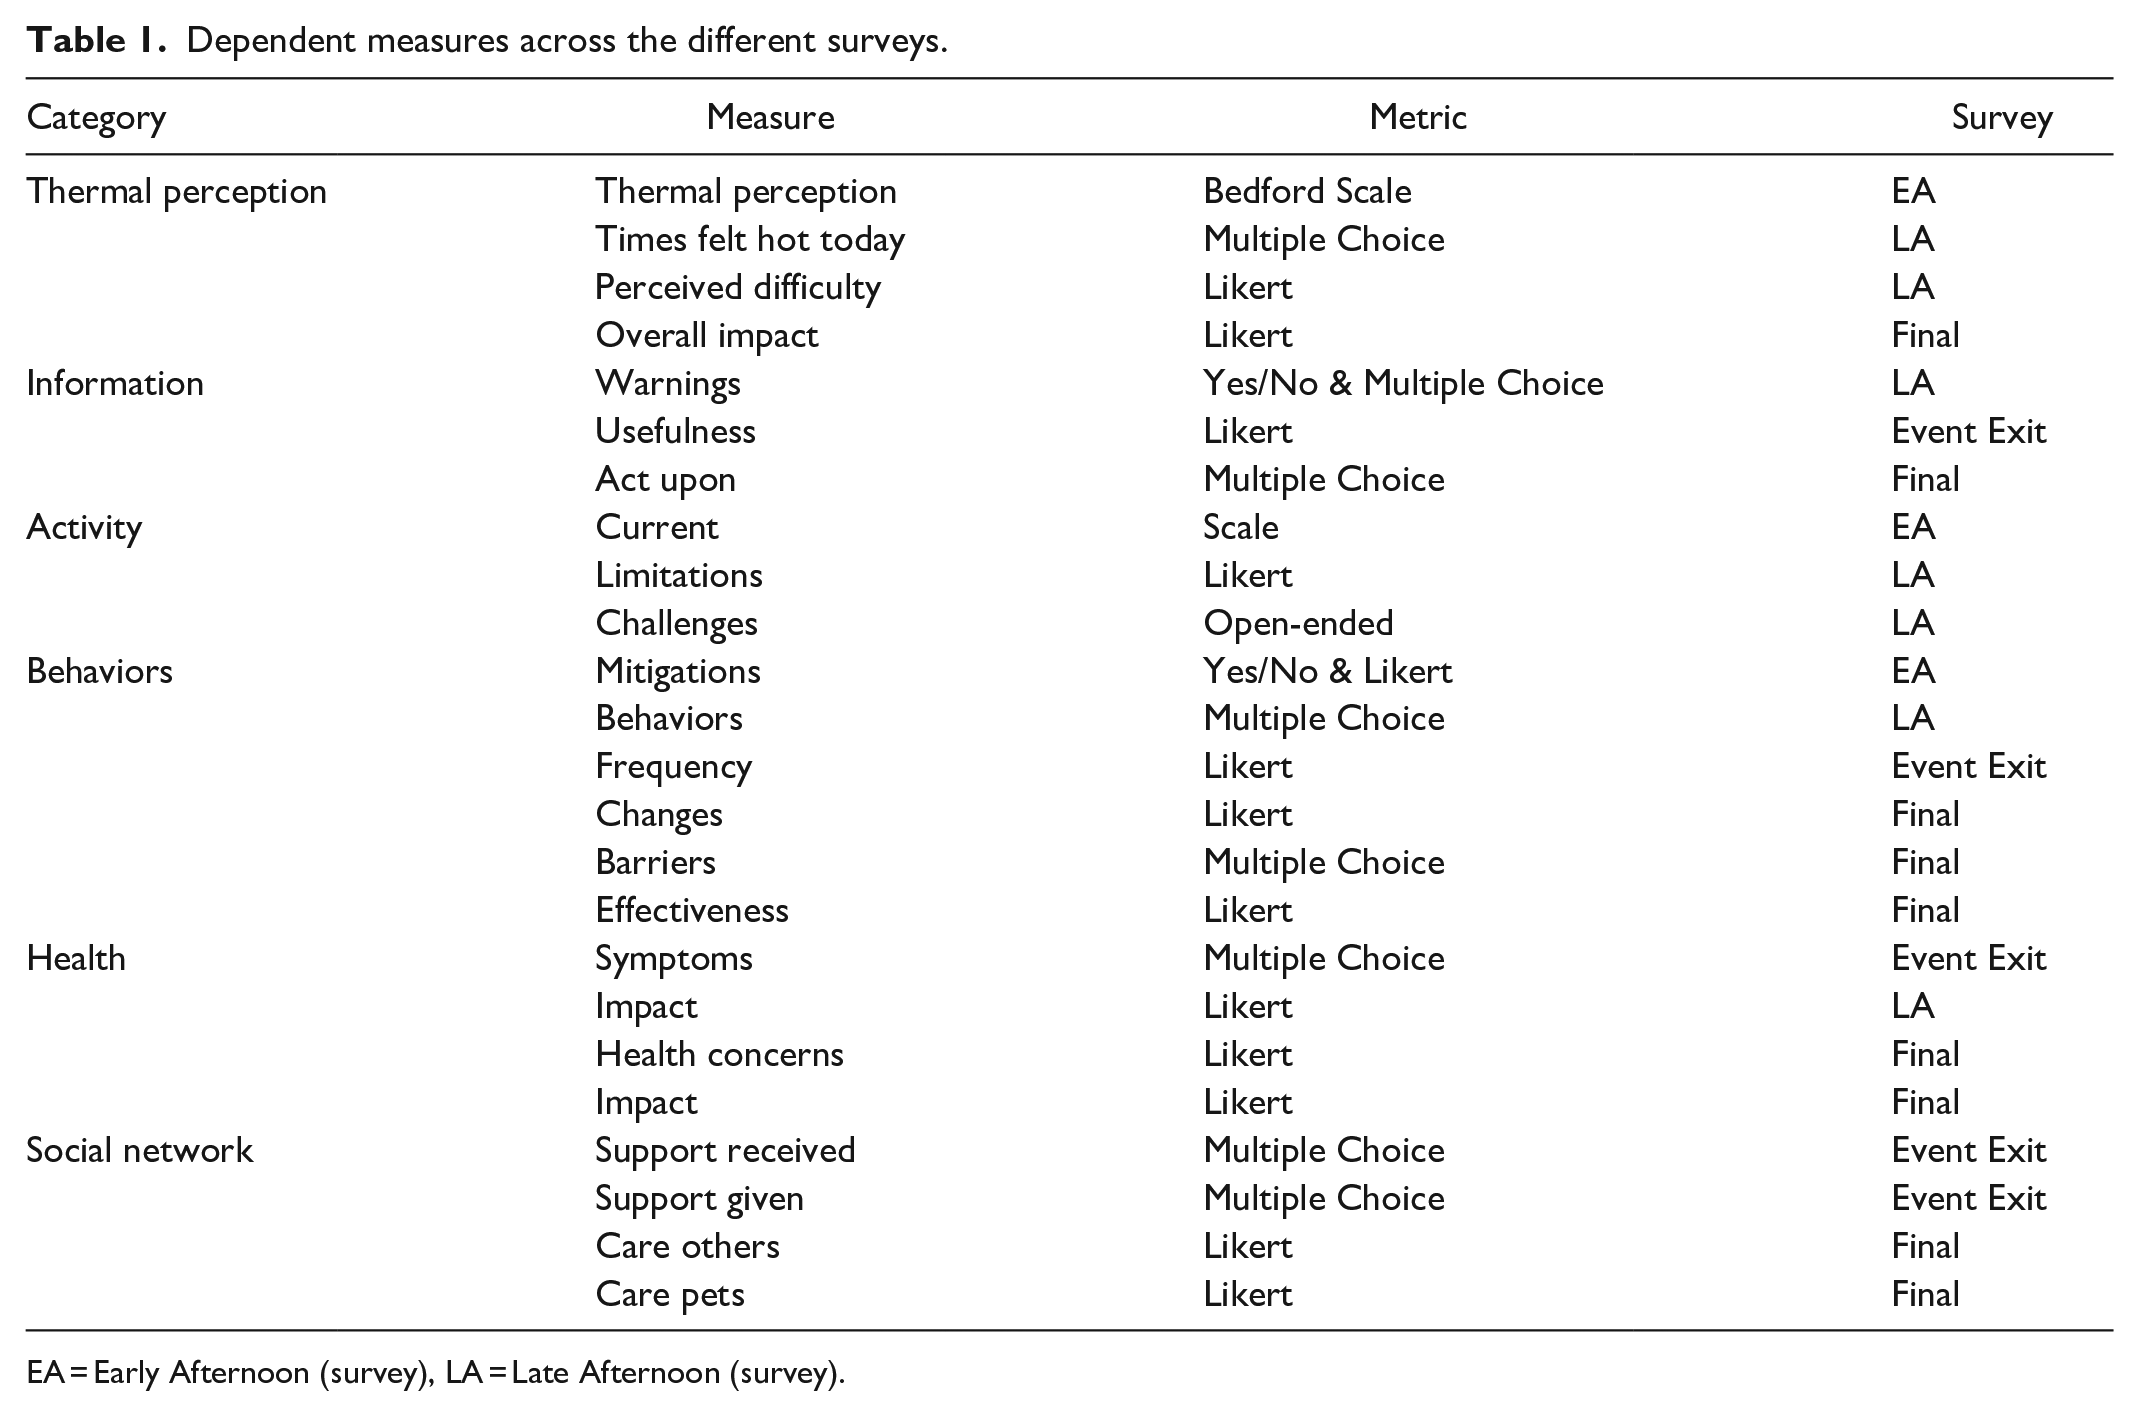
EA = Early Afternoon (survey), LA = Late Afternoon (survey).
Data Analysis
Given the low sample size in this pilot study, the results are presented with descriptive analysis. Pearson’s correlation was computed to examine the relationship between heat index and selected variables such as activity limitations, perceived heat coping difficulty, and overall well-being impact. Any statistical conclusion should be interpreted cautiously due to the low sample size.
Results
Thermal Perception
Figure 1 illustrates the perceived temperature between heat events and a baseline week. Eighteen percent of participants’ responses reported feeling warm or hot during heat events, while only 6% mentioned feeling warm or hot during baseline.
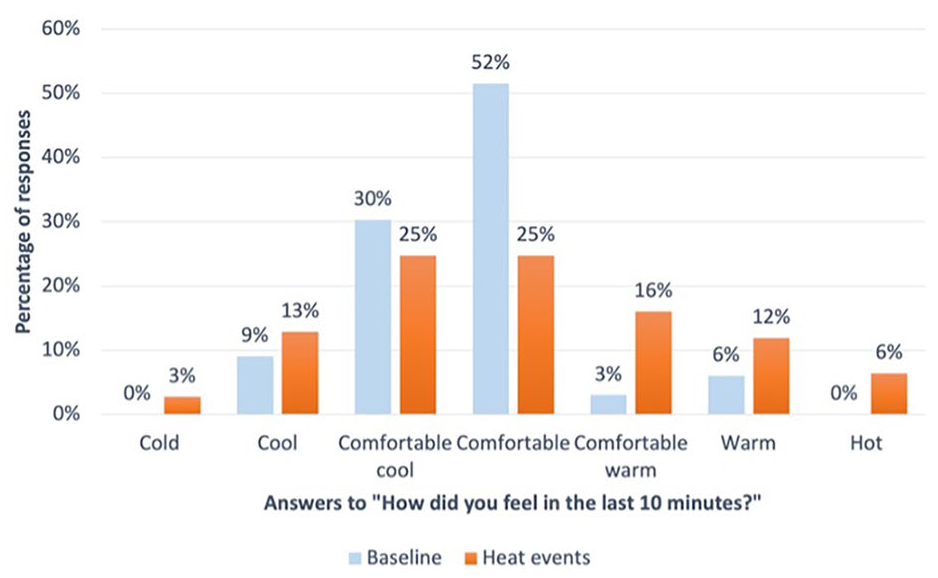
Distribution of thermal perception over the last 10 min during baseline versus heat events.
Half of the participants felt neither positive nor negative about heat events, and 37.5% felt somewhat negative. The rest (12.5%) felt somewhat positive. Sixty-five percent of participants’ responses show that it was at least somewhat challenging to cope with the heat during heat events compared to 11% during the baseline. The perceived difficulty during heat events (M = 2.1, SD = 1) was higher than that of the baseline (M = 1.2, SD = 0.6. These findings suggest that people feel it’s more challenging to cope with the heat during heat events than the baseline. Perceived difficulty coping with the heat was correlated to the heat index, r(139) = 0.5, p < .001. When the heat index increased, people felt it was more challenging to cope with the heat.
Information
Fifty-four percent of responses reported receiving heat warnings during heat events. The most common sources were weather alerts on smartphone apps (20.8%), friends (20.1%), TV news (16.1%), family (14.8%), and neighbors (12.8%). Other sources included radio, social media, and community. Among the participants that received the warnings, 12.5% looked at the warning but continued the activity as usual, 62.5% adapted their activity but continued despite the heat warnings, and 25% canceled or postponed their activity or even took countermeasures to protect themselves or their property.
Activity
Sixty-six percent of participants felt that the heat limited their normal activities, compared to 16% during the baseline. Limitations during heat events (M = 2.3, SD = 1.1) were higher than those of the baseline (M = 1.3, SD = 0.6). Participants’ answers to “Did the hot weather limit your normal activities today?” were correlated to the heat index, r(139) = 0.4, p < .001. These findings suggest that people feel their normal activities are more likely to be limited by the hot weather during heat events than the baseline. When participants were asked about the most significant challenge they experienced due to heat each day, 18% did not go outside, and 18% limited the time they spent outdoors. Other challenges included poor sleep (10%), feeling tired (8%), feeling uncomfortable (8%), sweating (8%), avoiding exercising (8%), keeping cool at home (5%), and concern for others (8%).
Behaviors
All participants reported they changed their behaviors due to the heat to some degree; half of the participants slightly changed their behavior due to heat events, 37.5% moderately changed their behavior, and 12.5% significantly changed their behavior.
In the daily surveys, 37% of responses mentioned they have done something to make themselves more comfortable during heat events. The top five behaviors people adopted during heat events were drinking non-alcoholic beverages/water; wearing lightweight, light-colored, or loose-fitting clothes; using air conditioning at home; closing blinds, curtains, or shades; and eating light meals. However, 7.5% of responses felt their actions were not very or not at all effective. Forty-five percent thought their actions were somewhat effective, while 47.5% felt they were very or completely effective. In the event exit surveys, beyond using air conditioning, frequent behavior included avoiding alcohol, drinking cool beverages, and closing windows, curtains, and blinds. In contrast, visiting a cooling center occurred “hardly ever” or “never.”
Seventy-five percent of participants stayed home if they felt uncomfortable: 37.5% did not know where else to go, and 25% preferred to stay at home for reasons including health problems making it hard to leave, or not leaving pets. Only 25% of participants visited a cooling center at least once during the summer. Participants did not utilize cooling centers due to personal preferences, unfamiliarity, uncomfortable leaving home, lack of location information, needing to be at home to care for pets, and health issues. Participants mentioned noise pollution, poor ventilation, safety concerns, windows not opening, and insect intrusion as factors that prevented them from opening windows.
Health
There was an increase in heat-related symptoms during the heat event (20 mentions) compared to the baseline (3). During the heat event, the most frequently reported symptoms were irritability (8 mentions), dehydration or intense thirst (6), and headache (2). Sunburn, heat rash/red and dry skin, muscle weakness or cramps, and slight fatigue were mentioned once during heat events.
Sixty-six percent of participants’ responses show that heat affects their overall well-being during heat events compared to 17% during the baseline. The subjective rating of impact during heat events (M = 2.1, SD = 1) was higher than that of the baseline (M = 1.3, SD = 0.6). These findings suggest that people feel the heat is more likely to affect their overall well-being during heat events than the baseline. Perceived heat impact on well-being is correlated to the heat index, r(139) = 0.4, p < .001. When the heat index increased, people tended to feel the heat affected their overall well-being more significantly.
Social Network
Half of the participants lived alone. Around 63% are not very concerned or not concerned at all about their health during heat events. However, 100% of participants were slightly to moderately concerned for others. Also, among the five participants who have pets, 60% worried about their pet’s health during heat events. Regarding social support, 31% of respondents mentioned receiving support from friends or neighbors during heat events, while 15% said it was from family members. Regarding providing support, 31% of responses indicated providing support to friends or neighbors, 23% to family members, and 4% to community organizations.
Discussion
Everyone reacted differently to the heat events, likely due to personal and environmental factors. Half of the participants had a neutral opinion regarding heat events, indicating that people might be good at adjusting to the heat, or they may be ignoring the danger of heat.
Fifty-four percent of participants reported receiving heat warnings, which shows there may still be room for improvement in disseminating heat warnings. People rely on various channels for heat alerts. The most common channels are smartphone apps and interpersonal sources (friends, family, neighbors). Of those who received heat warnings, 87.5% adapted their behaviors. Heat warnings can play an important role in influencing people’s behavior during heat events. This demonstrates that there is room for improvement in the reach and effectiveness of heat warnings. Targeted warning systems, multi-channel communications, and community networks could be developed and employed to ensure that vulnerable populations receive timely, actionable information and assistance when needed.
Sixty-six percent of participants’ responses showed that hot weather limits their usual activities during heat events. Participants spent most of their time at home during heat events, so home-based coping strategies may need to be strengthened and better communicated. The most frequently reported adaptive behaviors included increased fluid intake, wearing light-colored and loose-fitting clothing, using air conditioning, using window coverings, and eating light meals to reduce heat indoors. There may be opportunities to encourage wider adoption of underutilized strategies like cooling centers and seeking help from others. More than half (52.5%) felt that their actions were somewhat, a little, or not at all effective, which may indicate a gap between awareness and impactful behavior.
Enhancing public knowledge about the effectiveness of adaptive behaviors may help improve heat mitigation strategies. Also, better communication about the availability and benefits of cooling centers and social network support may be helpful.
Challenges posed by heat events include environmental, infrastructural, and social factors. Raising awareness, addressing barriers, meeting the needs of the diverse population (including pets), promoting social participation in cooling centers, and working with local organizations may encourage effective adaptation to extreme heat.
Compared to baseline, the frequency of dehydration, headache, and irritability increased during heat events. Other symptoms during heat events include sweating, being tired, and poor sleep. People who live alone may need additional attention. While most people were not very concerned for their own health, they were more concerned about others’ well-being. Raising awareness of the dangers of heat is critical. Residents seemed more concerned with their pet’s health than their own. Pets can influence their decision and behaviors during heat events. In such cases, guidance could be provided, such as advice on how to take care of pets during extreme heat and information on pet-friendly cooling centers.
Friends and neighbors play a critical role in supporting each other during heat events. There are potential opportunities to strengthen connections and communication regarding heat safety, and community organizations may be well-placed to provide heat-related support. Encouraging personal network support and strengthening community connections can significantly improve the resistance to heat.
The research’s findings are based on a small sample size of eight participants, and caution must be exercised when generalizing to the broader population. Up to 60% of homes lack air conditioning in the study area. Since all of the participants in this pilot study have air conditioning at home, this might also affect their heat perception and adaptive behaviors during heat events. Future studies should recruit larger, more representative samples and implement strategies (contacting repeatedly, working with local organizations, empowering student ambassadors to spread information) to ensure participant engagement. This research project ultimately seeks to develop app-based interventions to alert vulnerable community members and their social networks of dangerous heat events and provide actionable recommendations. Alerts will be generated from a physics-aware computational model that will estimate heat localized to specific neighborhoods, streets, and houses.
Conclusion
Residents’ behaviors, perceptions, and challenges were queried through a Quick Capture method using mobile ecological momentary assessment and short online surveys. This study demonstrated the feasibility of the Quick Capture method in gathering meaningful data from a heat-vulnerable population. This method will be expanded with a larger sample of participants in the future.
Preliminary results from this pilot study point to a need for effective heat mitigation strategies for vulnerable populations. The results highlight the importance of raising awareness, developing more effective heat warnings, and utilizing social networks to communicate and help each other. Findings from studies such as these can offer insights for developing interventions in the future, thus improving the communities’ adaptive ability in the face of extreme heat.
Footnotes
Declaration of Conflicting Interests
The author(s) declared no potential conflicts of interest with respect to the research, authorship, and/or publication of this article.
Funding
The author(s) disclosed receipt of the following financial support for the research, authorship, and/or publication of this article: This project was funded by the National Science Foundation (NSF) Award # 2226880.